Senegalese vs Eastern European 4 or more Vehicles in Household
COMPARE
Senegalese
Eastern European
4 or more Vehicles in Household
4 or more Vehicles in Household Comparison
Senegalese
Eastern Europeans
4.3%
4 OR MORE VEHICLES IN HOUSEHOLD
0.0/ 100
METRIC RATING
327th/ 347
METRIC RANK
5.9%
4 OR MORE VEHICLES IN HOUSEHOLD
6.8/ 100
METRIC RATING
229th/ 347
METRIC RANK
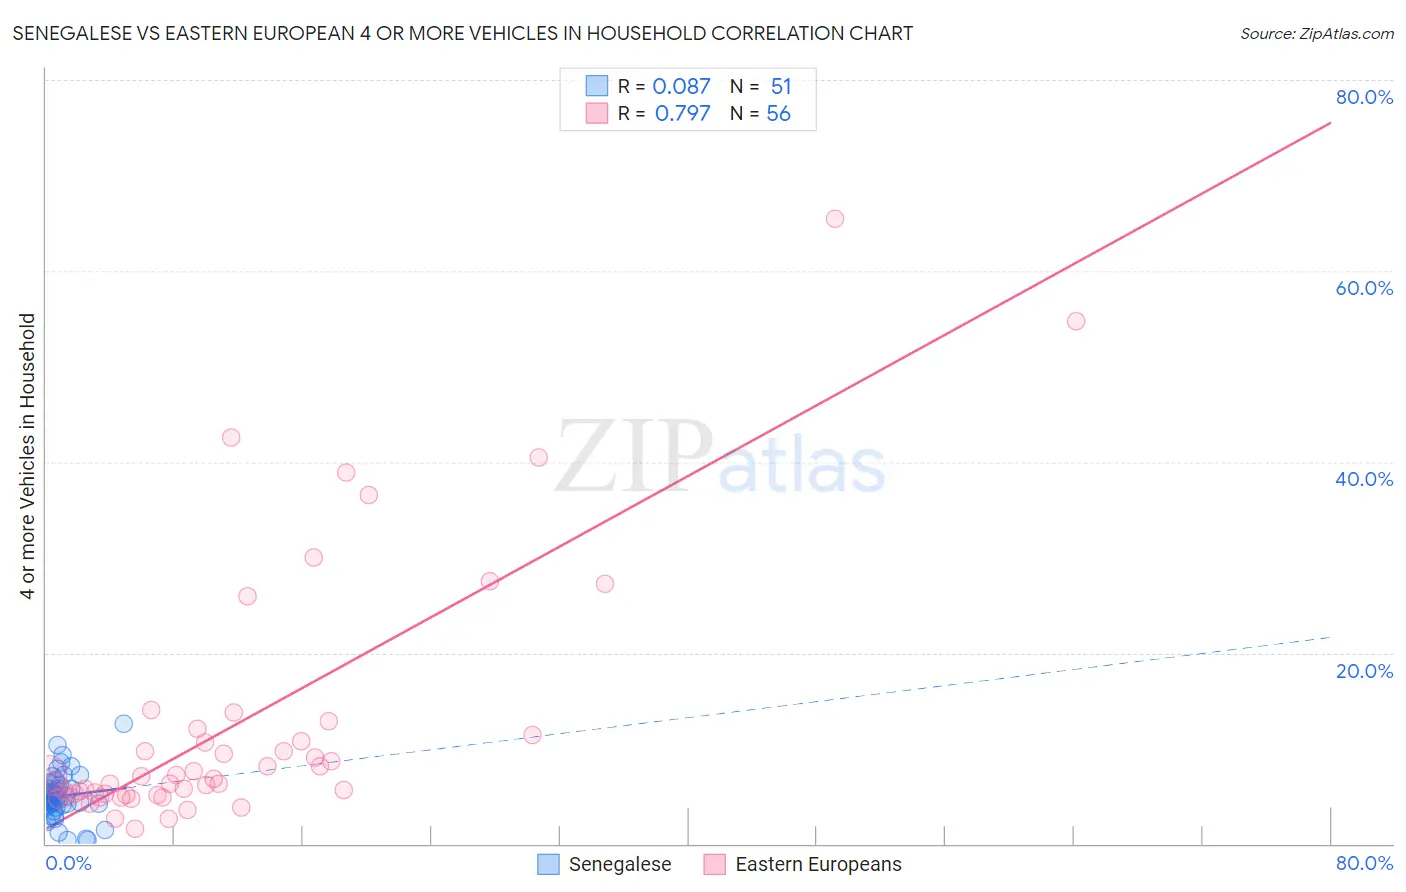
Senegalese vs Eastern European 4 or more Vehicles in Household Correlation Chart
The statistical analysis conducted on geographies consisting of 77,911,640 people shows a slight positive correlation between the proportion of Senegalese and percentage of households with 4 or more vehicles available in the United States with a correlation coefficient (R) of 0.087 and weighted average of 4.3%. Similarly, the statistical analysis conducted on geographies consisting of 459,039,876 people shows a strong positive correlation between the proportion of Eastern Europeans and percentage of households with 4 or more vehicles available in the United States with a correlation coefficient (R) of 0.797 and weighted average of 5.9%, a difference of 36.7%.
4 or more Vehicles in Household Correlation Summary
| Measurement | Senegalese | Eastern European |
| Minimum | 0.34% | 1.6% |
| Maximum | 12.5% | 65.5% |
| Range | 12.2% | 63.9% |
| Mean | 5.0% | 12.6% |
| Median | 5.0% | 7.0% |
| Interquartile 25% (IQ1) | 4.0% | 5.2% |
| Interquartile 75% (IQ3) | 6.1% | 11.7% |
| Interquartile Range (IQR) | 2.1% | 6.5% |
| Standard Deviation (Sample) | 2.4% | 13.7% |
| Standard Deviation (Population) | 2.3% | 13.6% |
Similar Demographics by 4 or more Vehicles in Household
Demographics Similar to Senegalese by 4 or more Vehicles in Household
In terms of 4 or more vehicles in household, the demographic groups most similar to Senegalese are Trinidadian and Tobagonian (4.3%, a difference of 1.6%), Cape Verdean (4.4%, a difference of 1.8%), Immigrants from Senegal (4.2%, a difference of 1.9%), Immigrants from Ecuador (4.2%, a difference of 2.1%), and Immigrants from Jamaica (4.4%, a difference of 2.1%).
| Demographics | Rating | Rank | 4 or more Vehicles in Household |
| Immigrants | Haiti | 0.0 /100 | #320 | Tragic 4.5% |
| Ecuadorians | 0.0 /100 | #321 | Tragic 4.5% |
| Immigrants | Yemen | 0.0 /100 | #322 | Tragic 4.5% |
| Immigrants | Caribbean | 0.0 /100 | #323 | Tragic 4.4% |
| Soviet Union | 0.0 /100 | #324 | Tragic 4.4% |
| Immigrants | Jamaica | 0.0 /100 | #325 | Tragic 4.4% |
| Cape Verdeans | 0.0 /100 | #326 | Tragic 4.4% |
| Senegalese | 0.0 /100 | #327 | Tragic 4.3% |
| Trinidadians and Tobagonians | 0.0 /100 | #328 | Tragic 4.3% |
| Immigrants | Senegal | 0.0 /100 | #329 | Tragic 4.2% |
| Immigrants | Ecuador | 0.0 /100 | #330 | Tragic 4.2% |
| West Indians | 0.0 /100 | #331 | Tragic 4.2% |
| Immigrants | Dominica | 0.0 /100 | #332 | Tragic 4.2% |
| Immigrants | Albania | 0.0 /100 | #333 | Tragic 4.1% |
| Immigrants | Trinidad and Tobago | 0.0 /100 | #334 | Tragic 4.1% |
Demographics Similar to Eastern Europeans by 4 or more Vehicles in Household
In terms of 4 or more vehicles in household, the demographic groups most similar to Eastern Europeans are Immigrants from Malaysia (5.9%, a difference of 0.070%), Immigrants from Switzerland (5.9%, a difference of 0.18%), Immigrants from Uganda (5.9%, a difference of 0.28%), Immigrants from Argentina (5.9%, a difference of 0.37%), and Immigrants from Western Asia (5.9%, a difference of 0.38%).
| Demographics | Rating | Rank | 4 or more Vehicles in Household |
| Cajuns | 9.2 /100 | #222 | Tragic 6.0% |
| Immigrants | Kenya | 9.2 /100 | #223 | Tragic 6.0% |
| Cubans | 9.2 /100 | #224 | Tragic 6.0% |
| Indonesians | 8.9 /100 | #225 | Tragic 6.0% |
| Immigrants | Singapore | 7.9 /100 | #226 | Tragic 5.9% |
| Immigrants | Western Asia | 7.8 /100 | #227 | Tragic 5.9% |
| Immigrants | Uganda | 7.5 /100 | #228 | Tragic 5.9% |
| Eastern Europeans | 6.8 /100 | #229 | Tragic 5.9% |
| Immigrants | Malaysia | 6.7 /100 | #230 | Tragic 5.9% |
| Immigrants | Switzerland | 6.4 /100 | #231 | Tragic 5.9% |
| Immigrants | Argentina | 6.0 /100 | #232 | Tragic 5.9% |
| Sierra Leoneans | 6.0 /100 | #233 | Tragic 5.9% |
| Africans | 4.6 /100 | #234 | Tragic 5.8% |
| Immigrants | Hungary | 4.6 /100 | #235 | Tragic 5.8% |
| Immigrants | Eritrea | 4.5 /100 | #236 | Tragic 5.8% |