Pennsylvania German vs Immigrants from Belize 3 or more Vehicles in Household
COMPARE
Pennsylvania German
Immigrants from Belize
3 or more Vehicles in Household
3 or more Vehicles in Household Comparison
Pennsylvania Germans
Immigrants from Belize
22.3%
3 OR MORE VEHICLES IN HOUSEHOLD
100.0/ 100
METRIC RATING
57th/ 347
METRIC RANK
18.1%
3 OR MORE VEHICLES IN HOUSEHOLD
2.1/ 100
METRIC RATING
245th/ 347
METRIC RANK
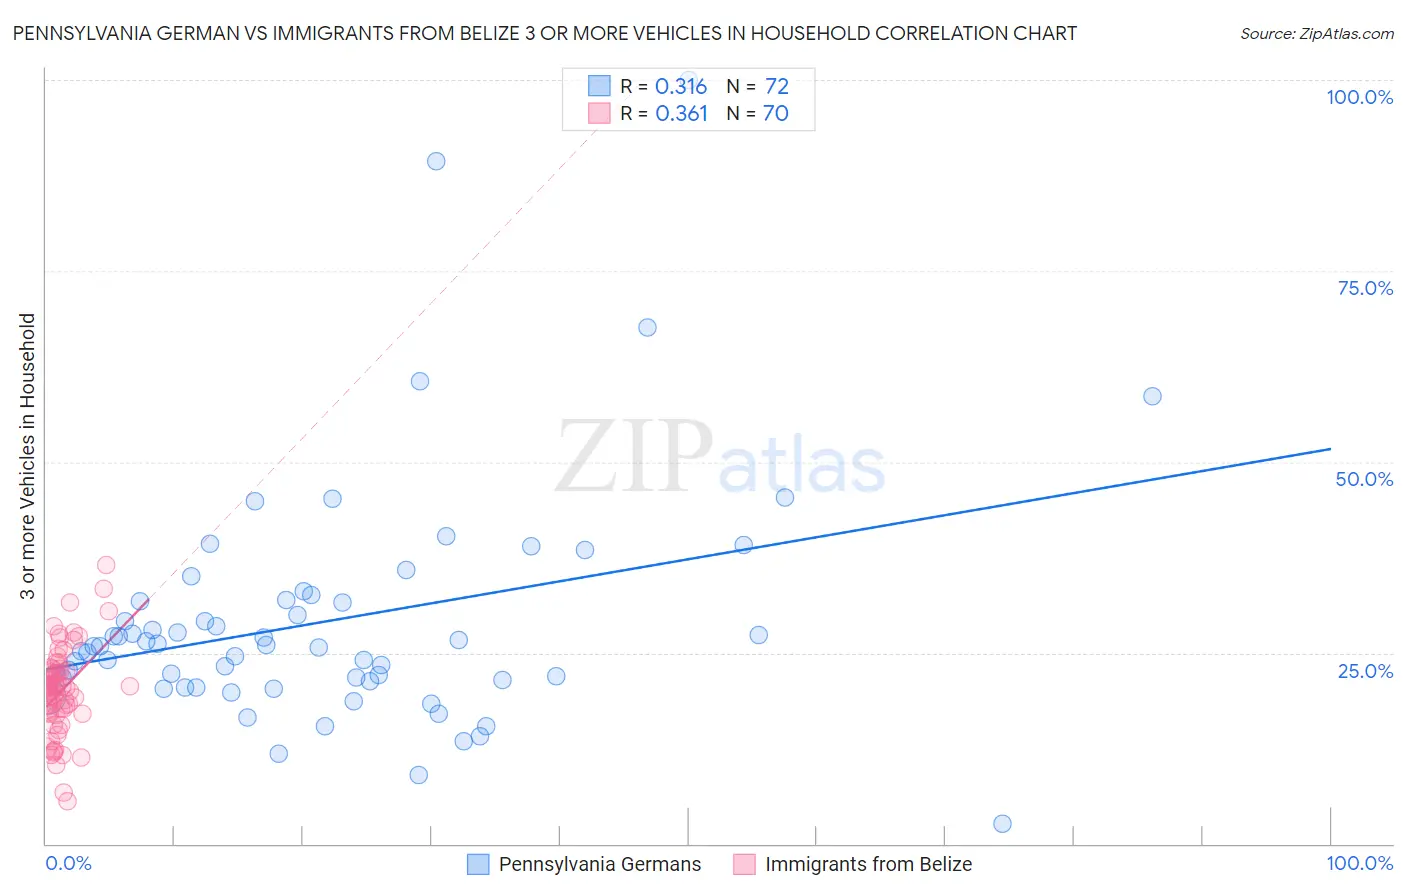
Pennsylvania German vs Immigrants from Belize 3 or more Vehicles in Household Correlation Chart
The statistical analysis conducted on geographies consisting of 234,054,154 people shows a mild positive correlation between the proportion of Pennsylvania Germans and percentage of households with 3 or more vehicles available in the United States with a correlation coefficient (R) of 0.316 and weighted average of 22.3%. Similarly, the statistical analysis conducted on geographies consisting of 130,289,749 people shows a mild positive correlation between the proportion of Immigrants from Belize and percentage of households with 3 or more vehicles available in the United States with a correlation coefficient (R) of 0.361 and weighted average of 18.1%, a difference of 23.5%.
3 or more Vehicles in Household Correlation Summary
| Measurement | Pennsylvania German | Immigrants from Belize |
| Minimum | 2.6% | 5.5% |
| Maximum | 100.0% | 36.6% |
| Range | 97.4% | 31.1% |
| Mean | 29.1% | 20.0% |
| Median | 25.9% | 20.4% |
| Interquartile 25% (IQ1) | 21.4% | 17.1% |
| Interquartile 75% (IQ3) | 31.8% | 23.0% |
| Interquartile Range (IQR) | 10.4% | 5.9% |
| Standard Deviation (Sample) | 15.7% | 5.8% |
| Standard Deviation (Population) | 15.6% | 5.8% |
Similar Demographics by 3 or more Vehicles in Household
Demographics Similar to Pennsylvania Germans by 3 or more Vehicles in Household
In terms of 3 or more vehicles in household, the demographic groups most similar to Pennsylvania Germans are Spaniard (22.3%, a difference of 0.13%), Hispanic or Latino (22.4%, a difference of 0.16%), Immigrants from Laos (22.4%, a difference of 0.18%), Navajo (22.3%, a difference of 0.19%), and Finnish (22.3%, a difference of 0.28%).
| Demographics | Rating | Rank | 3 or more Vehicles in Household |
| Sioux | 100.0 /100 | #50 | Exceptional 22.6% |
| Whites/Caucasians | 100.0 /100 | #51 | Exceptional 22.6% |
| Welsh | 100.0 /100 | #52 | Exceptional 22.6% |
| Czechs | 100.0 /100 | #53 | Exceptional 22.5% |
| Crow | 100.0 /100 | #54 | Exceptional 22.5% |
| Immigrants | Laos | 100.0 /100 | #55 | Exceptional 22.4% |
| Hispanics or Latinos | 100.0 /100 | #56 | Exceptional 22.4% |
| Pennsylvania Germans | 100.0 /100 | #57 | Exceptional 22.3% |
| Spaniards | 100.0 /100 | #58 | Exceptional 22.3% |
| Navajo | 100.0 /100 | #59 | Exceptional 22.3% |
| Finns | 99.9 /100 | #60 | Exceptional 22.3% |
| Bhutanese | 99.9 /100 | #61 | Exceptional 22.2% |
| Fijians | 99.9 /100 | #62 | Exceptional 22.2% |
| Chickasaw | 99.9 /100 | #63 | Exceptional 22.2% |
| Immigrants | Taiwan | 99.9 /100 | #64 | Exceptional 22.1% |
Demographics Similar to Immigrants from Belize by 3 or more Vehicles in Household
In terms of 3 or more vehicles in household, the demographic groups most similar to Immigrants from Belize are Immigrants from Australia (18.1%, a difference of 0.070%), Mongolian (18.1%, a difference of 0.16%), Carpatho Rusyn (18.0%, a difference of 0.23%), Immigrants from Europe (18.1%, a difference of 0.28%), and Immigrants from Eastern Africa (18.0%, a difference of 0.36%).
| Demographics | Rating | Rank | 3 or more Vehicles in Household |
| Immigrants | Honduras | 3.1 /100 | #238 | Tragic 18.2% |
| Immigrants | Middle Africa | 3.1 /100 | #239 | Tragic 18.2% |
| Immigrants | China | 2.9 /100 | #240 | Tragic 18.2% |
| Africans | 2.7 /100 | #241 | Tragic 18.2% |
| Hopi | 2.5 /100 | #242 | Tragic 18.2% |
| Immigrants | Europe | 2.4 /100 | #243 | Tragic 18.1% |
| Mongolians | 2.3 /100 | #244 | Tragic 18.1% |
| Immigrants | Belize | 2.1 /100 | #245 | Tragic 18.1% |
| Immigrants | Australia | 2.0 /100 | #246 | Tragic 18.1% |
| Carpatho Rusyns | 1.9 /100 | #247 | Tragic 18.0% |
| Immigrants | Eastern Africa | 1.8 /100 | #248 | Tragic 18.0% |
| Immigrants | Saudi Arabia | 1.7 /100 | #249 | Tragic 18.0% |
| Venezuelans | 1.7 /100 | #250 | Tragic 18.0% |
| Alsatians | 1.5 /100 | #251 | Tragic 18.0% |
| Immigrants | Southern Europe | 1.4 /100 | #252 | Tragic 17.9% |