Northern European vs Bangladeshi 2 or more Vehicles in Household
COMPARE
Northern European
Bangladeshi
2 or more Vehicles in Household
2 or more Vehicles in Household Comparison
Northern Europeans
Bangladeshis
59.9%
2 OR MORE VEHICLES IN HOUSEHOLD
100.0/ 100
METRIC RATING
41st/ 347
METRIC RANK
58.4%
2 OR MORE VEHICLES IN HOUSEHOLD
99.6/ 100
METRIC RATING
71st/ 347
METRIC RANK
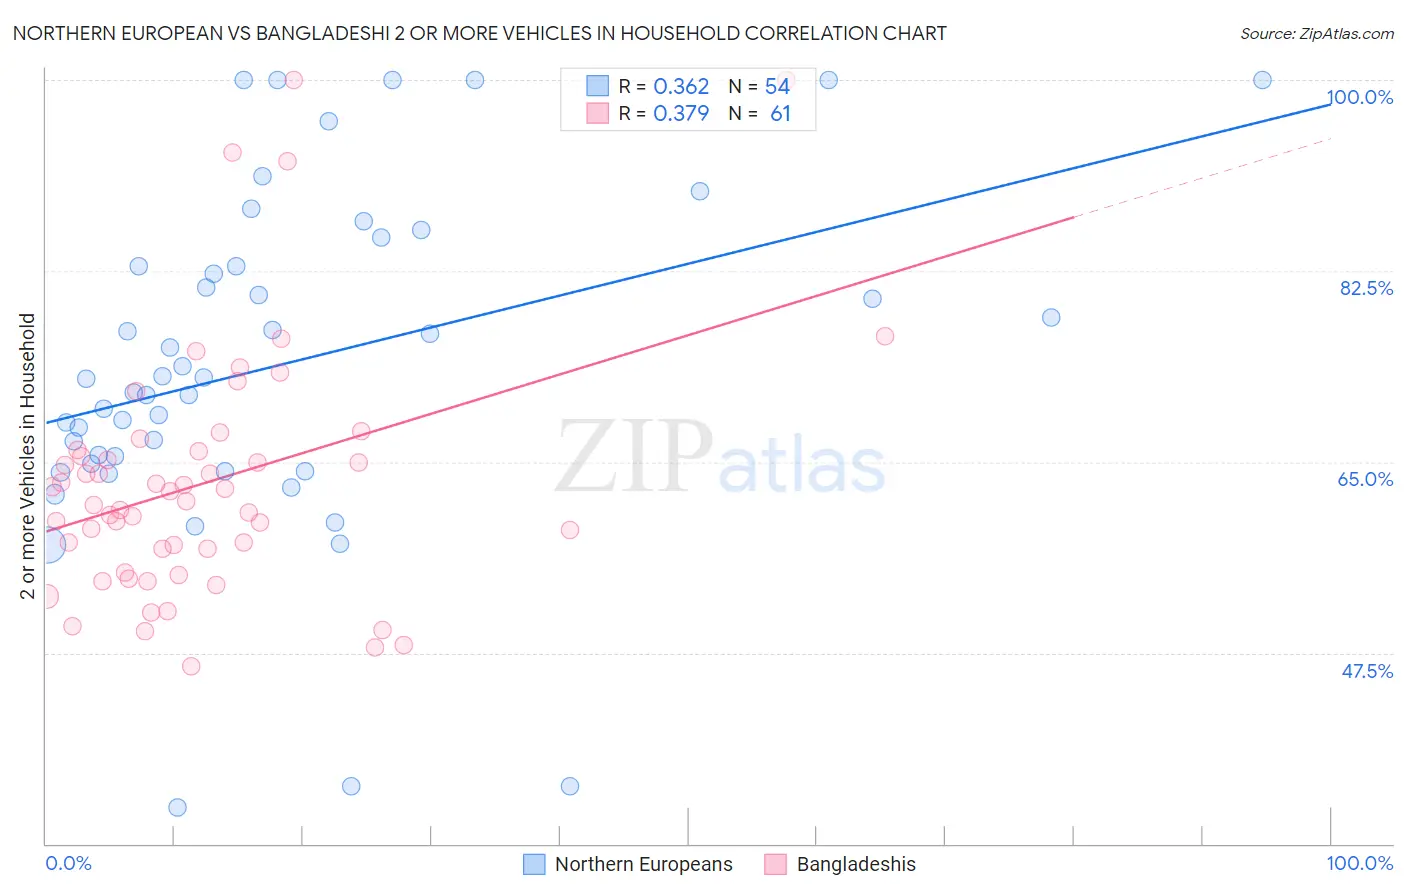
Northern European vs Bangladeshi 2 or more Vehicles in Household Correlation Chart
The statistical analysis conducted on geographies consisting of 405,957,597 people shows a mild positive correlation between the proportion of Northern Europeans and percentage of households with 2 or more vehicles available in the United States with a correlation coefficient (R) of 0.362 and weighted average of 59.9%. Similarly, the statistical analysis conducted on geographies consisting of 141,360,423 people shows a mild positive correlation between the proportion of Bangladeshis and percentage of households with 2 or more vehicles available in the United States with a correlation coefficient (R) of 0.379 and weighted average of 58.4%, a difference of 2.4%.
2 or more Vehicles in Household Correlation Summary
| Measurement | Northern European | Bangladeshi |
| Minimum | 33.3% | 46.3% |
| Maximum | 100.0% | 100.0% |
| Range | 66.7% | 53.7% |
| Mean | 74.0% | 63.1% |
| Median | 72.7% | 61.4% |
| Interquartile 25% (IQ1) | 64.8% | 56.0% |
| Interquartile 75% (IQ3) | 83.0% | 66.0% |
| Interquartile Range (IQR) | 18.1% | 10.0% |
| Standard Deviation (Sample) | 15.6% | 11.5% |
| Standard Deviation (Population) | 15.5% | 11.4% |
Similar Demographics by 2 or more Vehicles in Household
Demographics Similar to Northern Europeans by 2 or more Vehicles in Household
In terms of 2 or more vehicles in household, the demographic groups most similar to Northern Europeans are Malaysian (59.8%, a difference of 0.010%), Cherokee (59.9%, a difference of 0.020%), Czechoslovakian (59.8%, a difference of 0.090%), French (59.8%, a difference of 0.15%), and Immigrants from Taiwan (59.7%, a difference of 0.19%).
| Demographics | Rating | Rank | 2 or more Vehicles in Household |
| Spanish | 100.0 /100 | #34 | Exceptional 60.2% |
| Immigrants | Philippines | 100.0 /100 | #35 | Exceptional 60.1% |
| Chinese | 100.0 /100 | #36 | Exceptional 60.1% |
| Irish | 100.0 /100 | #37 | Exceptional 60.1% |
| Americans | 100.0 /100 | #38 | Exceptional 60.0% |
| British | 100.0 /100 | #39 | Exceptional 60.0% |
| Cherokee | 100.0 /100 | #40 | Exceptional 59.9% |
| Northern Europeans | 100.0 /100 | #41 | Exceptional 59.9% |
| Malaysians | 100.0 /100 | #42 | Exceptional 59.8% |
| Czechoslovakians | 100.0 /100 | #43 | Exceptional 59.8% |
| French | 100.0 /100 | #44 | Exceptional 59.8% |
| Immigrants | Taiwan | 100.0 /100 | #45 | Exceptional 59.7% |
| Immigrants | South Eastern Asia | 100.0 /100 | #46 | Exceptional 59.6% |
| Yaqui | 99.9 /100 | #47 | Exceptional 59.3% |
| Immigrants | India | 99.9 /100 | #48 | Exceptional 59.3% |
Demographics Similar to Bangladeshis by 2 or more Vehicles in Household
In terms of 2 or more vehicles in household, the demographic groups most similar to Bangladeshis are Italian (58.4%, a difference of 0.020%), Austrian (58.4%, a difference of 0.030%), Pennsylvania German (58.5%, a difference of 0.14%), Bolivian (58.3%, a difference of 0.15%), and Immigrants from Afghanistan (58.3%, a difference of 0.16%).
| Demographics | Rating | Rank | 2 or more Vehicles in Household |
| Portuguese | 99.7 /100 | #64 | Exceptional 58.6% |
| Immigrants | Central America | 99.7 /100 | #65 | Exceptional 58.6% |
| Croatians | 99.7 /100 | #66 | Exceptional 58.6% |
| Laotians | 99.7 /100 | #67 | Exceptional 58.6% |
| Canadians | 99.7 /100 | #68 | Exceptional 58.6% |
| Pennsylvania Germans | 99.7 /100 | #69 | Exceptional 58.5% |
| Italians | 99.6 /100 | #70 | Exceptional 58.4% |
| Bangladeshis | 99.6 /100 | #71 | Exceptional 58.4% |
| Austrians | 99.6 /100 | #72 | Exceptional 58.4% |
| Bolivians | 99.6 /100 | #73 | Exceptional 58.3% |
| Immigrants | Afghanistan | 99.6 /100 | #74 | Exceptional 58.3% |
| Poles | 99.5 /100 | #75 | Exceptional 58.3% |
| Creek | 99.5 /100 | #76 | Exceptional 58.3% |
| Slovenes | 99.5 /100 | #77 | Exceptional 58.3% |
| Lithuanians | 99.5 /100 | #78 | Exceptional 58.2% |