New Zealander vs Central American 2 or more Vehicles in Household
COMPARE
New Zealander
Central American
2 or more Vehicles in Household
2 or more Vehicles in Household Comparison
New Zealanders
Central Americans
56.7%
2 OR MORE VEHICLES IN HOUSEHOLD
91.8/ 100
METRIC RATING
124th/ 347
METRIC RANK
54.7%
2 OR MORE VEHICLES IN HOUSEHOLD
23.0/ 100
METRIC RATING
194th/ 347
METRIC RANK
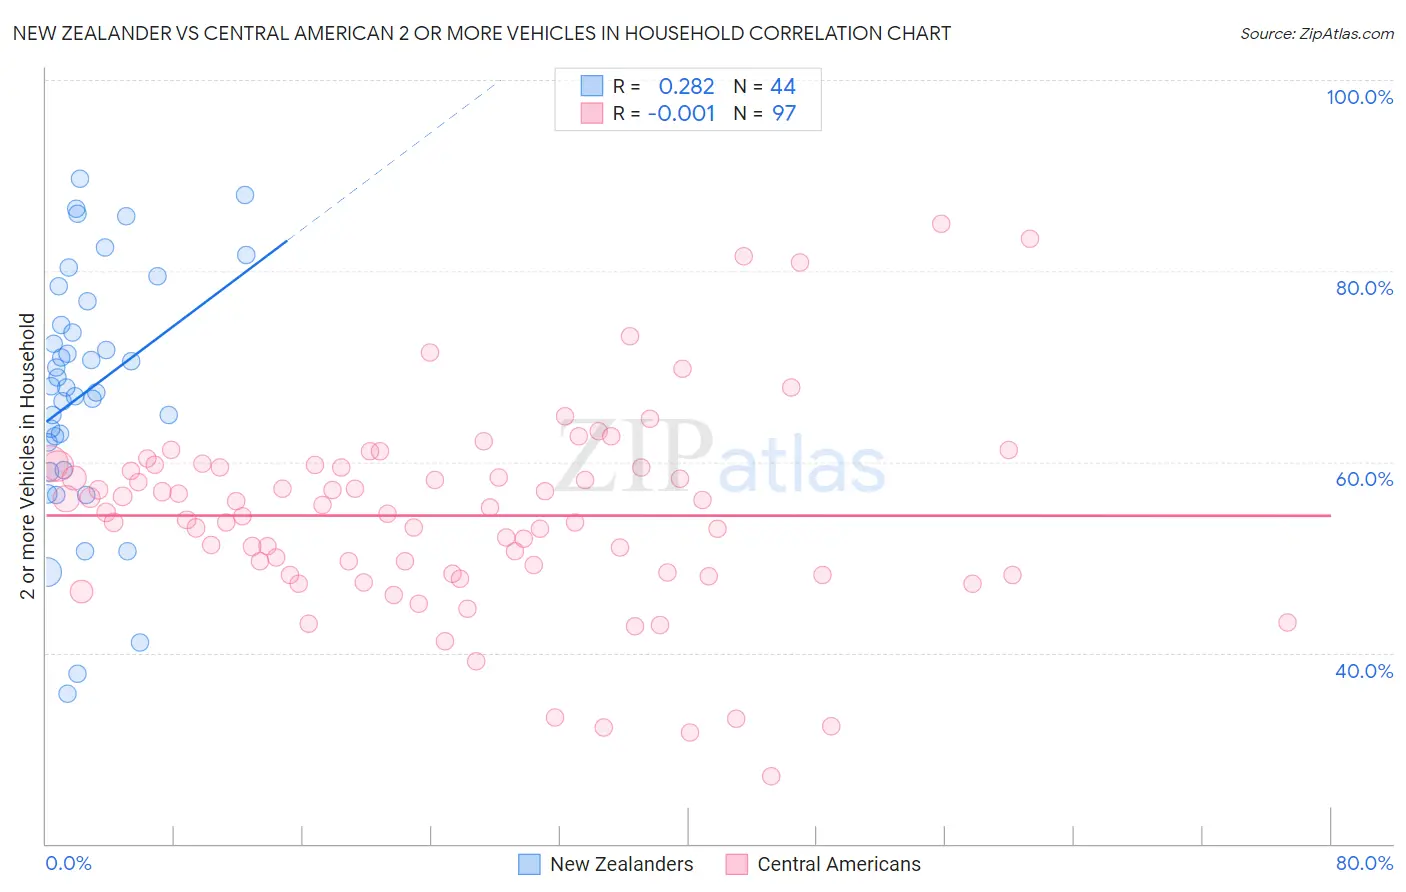
New Zealander vs Central American 2 or more Vehicles in Household Correlation Chart
The statistical analysis conducted on geographies consisting of 106,900,392 people shows a weak positive correlation between the proportion of New Zealanders and percentage of households with 2 or more vehicles available in the United States with a correlation coefficient (R) of 0.282 and weighted average of 56.7%. Similarly, the statistical analysis conducted on geographies consisting of 504,126,351 people shows no correlation between the proportion of Central Americans and percentage of households with 2 or more vehicles available in the United States with a correlation coefficient (R) of -0.001 and weighted average of 54.7%, a difference of 3.6%.
2 or more Vehicles in Household Correlation Summary
| Measurement | New Zealander | Central American |
| Minimum | 35.8% | 27.0% |
| Maximum | 89.7% | 85.0% |
| Range | 53.9% | 58.0% |
| Mean | 67.4% | 54.4% |
| Median | 67.9% | 54.7% |
| Interquartile 25% (IQ1) | 60.6% | 48.2% |
| Interquartile 75% (IQ3) | 75.6% | 59.5% |
| Interquartile Range (IQR) | 15.0% | 11.3% |
| Standard Deviation (Sample) | 12.9% | 10.4% |
| Standard Deviation (Population) | 12.8% | 10.3% |
Similar Demographics by 2 or more Vehicles in Household
Demographics Similar to New Zealanders by 2 or more Vehicles in Household
In terms of 2 or more vehicles in household, the demographic groups most similar to New Zealanders are Australian (56.7%, a difference of 0.0%), Tsimshian (56.7%, a difference of 0.020%), Immigrants from South Africa (56.7%, a difference of 0.10%), Estonian (56.6%, a difference of 0.10%), and Immigrants from Thailand (56.6%, a difference of 0.13%).
| Demographics | Rating | Rank | 2 or more Vehicles in Household |
| Iraqis | 95.8 /100 | #117 | Exceptional 57.1% |
| Asians | 95.1 /100 | #118 | Exceptional 57.0% |
| Natives/Alaskans | 95.0 /100 | #119 | Exceptional 57.0% |
| Costa Ricans | 94.7 /100 | #120 | Exceptional 56.9% |
| Sioux | 93.8 /100 | #121 | Exceptional 56.8% |
| Immigrants | South Africa | 92.5 /100 | #122 | Exceptional 56.7% |
| Australians | 91.8 /100 | #123 | Exceptional 56.7% |
| New Zealanders | 91.8 /100 | #124 | Exceptional 56.7% |
| Tsimshian | 91.6 /100 | #125 | Exceptional 56.7% |
| Estonians | 90.9 /100 | #126 | Exceptional 56.6% |
| Immigrants | Thailand | 90.7 /100 | #127 | Exceptional 56.6% |
| Immigrants | South Central Asia | 90.5 /100 | #128 | Exceptional 56.6% |
| Ute | 90.4 /100 | #129 | Exceptional 56.6% |
| Yugoslavians | 90.0 /100 | #130 | Exceptional 56.6% |
| Bulgarians | 89.7 /100 | #131 | Excellent 56.5% |
Demographics Similar to Central Americans by 2 or more Vehicles in Household
In terms of 2 or more vehicles in household, the demographic groups most similar to Central Americans are Immigrants from Japan (54.7%, a difference of 0.020%), Iroquois (54.7%, a difference of 0.030%), Immigrants from Romania (54.7%, a difference of 0.050%), Immigrants (54.7%, a difference of 0.11%), and Russian (54.8%, a difference of 0.18%).
| Demographics | Rating | Rank | 2 or more Vehicles in Household |
| Immigrants | Uganda | 33.4 /100 | #187 | Fair 55.0% |
| Marshallese | 30.5 /100 | #188 | Fair 54.9% |
| Eastern Europeans | 27.5 /100 | #189 | Fair 54.8% |
| Russians | 26.3 /100 | #190 | Fair 54.8% |
| Immigrants | Immigrants | 25.0 /100 | #191 | Fair 54.7% |
| Immigrants | Romania | 23.8 /100 | #192 | Fair 54.7% |
| Immigrants | Japan | 23.4 /100 | #193 | Fair 54.7% |
| Central Americans | 23.0 /100 | #194 | Fair 54.7% |
| Iroquois | 22.6 /100 | #195 | Fair 54.7% |
| Immigrants | Poland | 19.3 /100 | #196 | Poor 54.6% |
| Argentineans | 17.5 /100 | #197 | Poor 54.5% |
| Carpatho Rusyns | 16.2 /100 | #198 | Poor 54.4% |
| Immigrants | Norway | 15.9 /100 | #199 | Poor 54.4% |
| Houma | 15.8 /100 | #200 | Poor 54.4% |
| Immigrants | Italy | 15.5 /100 | #201 | Poor 54.4% |