Immigrants from Australia vs Central American 2 or more Vehicles in Household
COMPARE
Immigrants from Australia
Central American
2 or more Vehicles in Household
2 or more Vehicles in Household Comparison
Immigrants from Australia
Central Americans
52.4%
2 OR MORE VEHICLES IN HOUSEHOLD
0.5/ 100
METRIC RATING
261st/ 347
METRIC RANK
54.7%
2 OR MORE VEHICLES IN HOUSEHOLD
23.0/ 100
METRIC RATING
194th/ 347
METRIC RANK
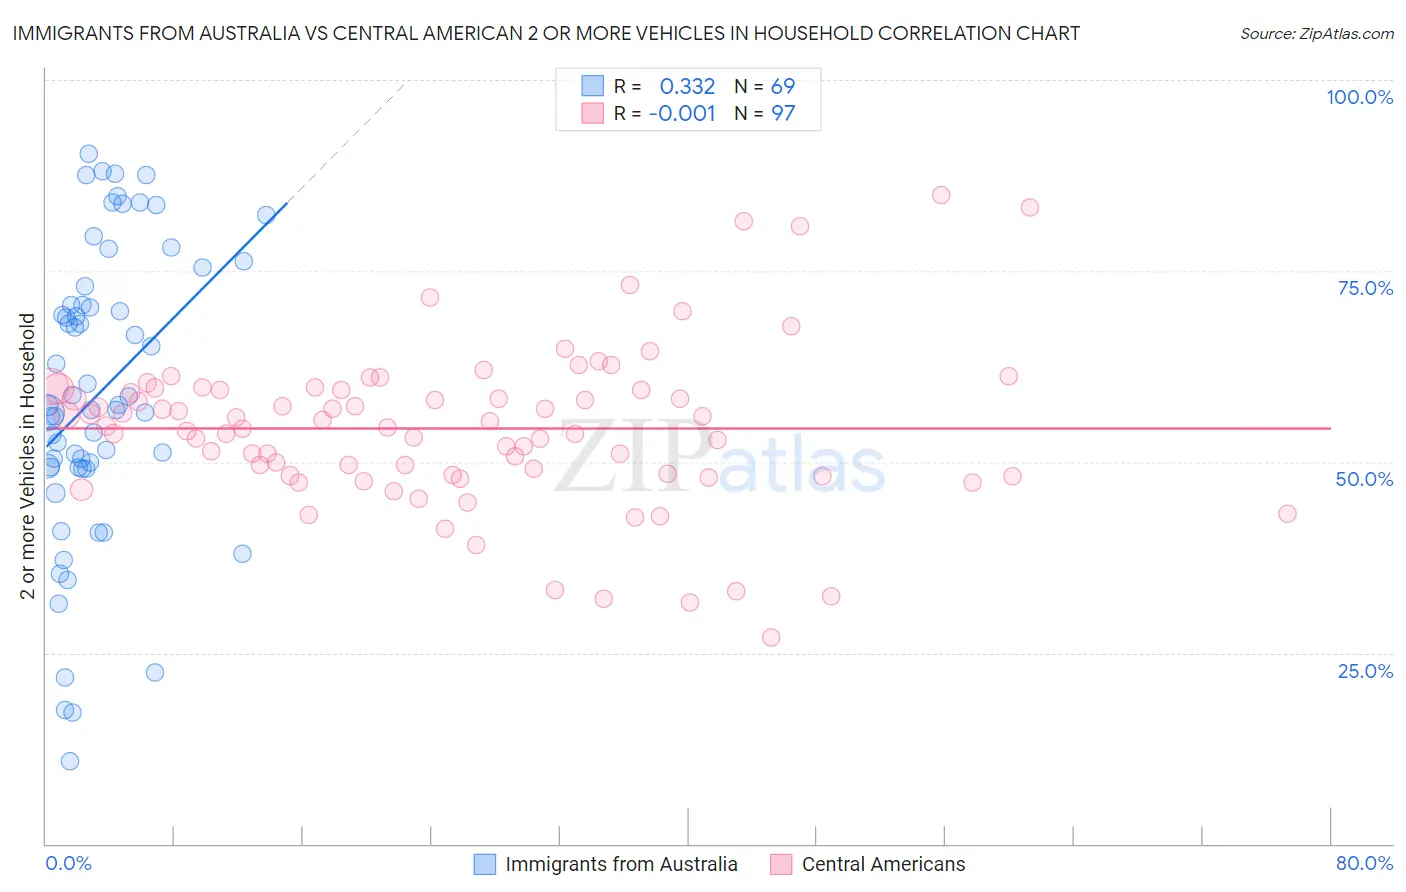
Immigrants from Australia vs Central American 2 or more Vehicles in Household Correlation Chart
The statistical analysis conducted on geographies consisting of 227,142,771 people shows a mild positive correlation between the proportion of Immigrants from Australia and percentage of households with 2 or more vehicles available in the United States with a correlation coefficient (R) of 0.332 and weighted average of 52.4%. Similarly, the statistical analysis conducted on geographies consisting of 504,126,351 people shows no correlation between the proportion of Central Americans and percentage of households with 2 or more vehicles available in the United States with a correlation coefficient (R) of -0.001 and weighted average of 54.7%, a difference of 4.3%.
2 or more Vehicles in Household Correlation Summary
| Measurement | Immigrants from Australia | Central American |
| Minimum | 10.8% | 27.0% |
| Maximum | 90.4% | 85.0% |
| Range | 79.7% | 58.0% |
| Mean | 58.9% | 54.4% |
| Median | 57.4% | 54.7% |
| Interquartile 25% (IQ1) | 49.3% | 48.2% |
| Interquartile 75% (IQ3) | 71.8% | 59.5% |
| Interquartile Range (IQR) | 22.5% | 11.3% |
| Standard Deviation (Sample) | 19.0% | 10.4% |
| Standard Deviation (Population) | 18.9% | 10.3% |
Similar Demographics by 2 or more Vehicles in Household
Demographics Similar to Immigrants from Australia by 2 or more Vehicles in Household
In terms of 2 or more vehicles in household, the demographic groups most similar to Immigrants from Australia are Immigrants from Bahamas (52.5%, a difference of 0.030%), Alsatian (52.5%, a difference of 0.10%), Central American Indian (52.5%, a difference of 0.14%), Immigrants from Northern Africa (52.3%, a difference of 0.20%), and Immigrants from Hong Kong (52.6%, a difference of 0.24%).
| Demographics | Rating | Rank | 2 or more Vehicles in Household |
| Immigrants | Malaysia | 0.8 /100 | #254 | Tragic 52.7% |
| Uruguayans | 0.7 /100 | #255 | Tragic 52.7% |
| Immigrants | Eritrea | 0.7 /100 | #256 | Tragic 52.6% |
| Immigrants | Hong Kong | 0.6 /100 | #257 | Tragic 52.6% |
| Central American Indians | 0.6 /100 | #258 | Tragic 52.5% |
| Alsatians | 0.6 /100 | #259 | Tragic 52.5% |
| Immigrants | Bahamas | 0.5 /100 | #260 | Tragic 52.5% |
| Immigrants | Australia | 0.5 /100 | #261 | Tragic 52.4% |
| Immigrants | Northern Africa | 0.4 /100 | #262 | Tragic 52.3% |
| Immigrants | Southern Europe | 0.4 /100 | #263 | Tragic 52.3% |
| Immigrants | Latvia | 0.4 /100 | #264 | Tragic 52.2% |
| Immigrants | Congo | 0.3 /100 | #265 | Tragic 52.1% |
| Immigrants | France | 0.2 /100 | #266 | Tragic 52.0% |
| Immigrants | Colombia | 0.2 /100 | #267 | Tragic 52.0% |
| Pima | 0.2 /100 | #268 | Tragic 52.0% |
Demographics Similar to Central Americans by 2 or more Vehicles in Household
In terms of 2 or more vehicles in household, the demographic groups most similar to Central Americans are Immigrants from Japan (54.7%, a difference of 0.020%), Iroquois (54.7%, a difference of 0.030%), Immigrants from Romania (54.7%, a difference of 0.050%), Immigrants (54.7%, a difference of 0.11%), and Russian (54.8%, a difference of 0.18%).
| Demographics | Rating | Rank | 2 or more Vehicles in Household |
| Immigrants | Uganda | 33.4 /100 | #187 | Fair 55.0% |
| Marshallese | 30.5 /100 | #188 | Fair 54.9% |
| Eastern Europeans | 27.5 /100 | #189 | Fair 54.8% |
| Russians | 26.3 /100 | #190 | Fair 54.8% |
| Immigrants | Immigrants | 25.0 /100 | #191 | Fair 54.7% |
| Immigrants | Romania | 23.8 /100 | #192 | Fair 54.7% |
| Immigrants | Japan | 23.4 /100 | #193 | Fair 54.7% |
| Central Americans | 23.0 /100 | #194 | Fair 54.7% |
| Iroquois | 22.6 /100 | #195 | Fair 54.7% |
| Immigrants | Poland | 19.3 /100 | #196 | Poor 54.6% |
| Argentineans | 17.5 /100 | #197 | Poor 54.5% |
| Carpatho Rusyns | 16.2 /100 | #198 | Poor 54.4% |
| Immigrants | Norway | 15.9 /100 | #199 | Poor 54.4% |
| Houma | 15.8 /100 | #200 | Poor 54.4% |
| Immigrants | Italy | 15.5 /100 | #201 | Poor 54.4% |