Immigrants from Venezuela vs Navajo No Vehicles in Household

COMPARE

Immigrants from Venezuela
Race
Ancestry
AfghanAfricanAlaska NativeAlaskan AthabascanAlbanianAleutAlsatianAmericanApacheArabArapahoArgentineanArmenianAssyrian/Chaldean/SyriacAustralianAustrianBahamianBangladeshiBarbadianBasqueBelgianBelizeanBermudanBhutaneseBlackfeetBolivianBrazilianBritishBritish West IndianBulgarianBurmeseCajunCambodianCanadianCape VerdeanCarpatho RusynCelticCentral AmericanCentral American IndianCherokeeCheyenneChickasawChileanChineseChippewaChoctawColombianColvilleComancheCosta RicanCreeCreekCroatianCrowCubanCypriotCzechCzechoslovakianDanishDelawareDominicanDutchDutch West IndianEastern EuropeanEcuadorianEgyptianEnglishEstonianEthiopianEuropeanFijianFilipinoFinnishFrenchFrench American IndianFrench CanadianGermanGerman RussianGhanaianGreekGuamanian/ChamorroGuatemalanGuyaneseHaitianHmongHonduranHopiHoumaHungarianIcelanderIndian (Asian)IndonesianInupiatIranianIraqiIrishIroquoisIsraeliItalianJamaicanJapaneseJordanianKenyanKiowaKoreanLaotianLatvianLebaneseLiberianLithuanianLumbeeLuxembourgerMacedonianMalaysianMalteseMarshalleseMenomineeMexicanMexican American IndianMongolianMoroccanNative HawaiianNepaleseNew ZealanderNicaraguanNigerianNorthern EuropeanNorwegianOkinawanOsageOttawaPaiutePakistaniPalestinianPanamanianParaguayanPennsylvania GermanPeruvianPimaPolishPortuguesePotawatomiPuebloPuerto RicanPuget Sound SalishRomanianRussianSalvadoranSamoanScandinavianScotch-IrishScottishSeminoleSenegaleseSerbianShoshoneSierra LeoneanSiouxSlavicSlovakSloveneSomaliSouth AfricanSouth AmericanSouth American IndianSoviet UnionSpaniardSpanishSpanish AmericanSpanish American IndianSri LankanSubsaharan AfricanSudaneseSwedishSwissSyrianTaiwaneseThaiTlingit-HaidaTohono O'OdhamTonganTrinidadian and TobagonianTsimshianTurkishU.S. Virgin IslanderUgandanUkrainianUruguayanUteVenezuelanVietnameseWelshWest IndianYakamaYaquiYugoslavianYumanYup'ikZimbabwean
Immigration
NonimmigrantsImmigrantsAfghanistanAfricaAlbaniaArgentinaArmeniaAsiaAustraliaAustriaBahamasBangladeshBarbadosBelarusBelgiumBelizeBoliviaBosnia and HerzegovinaBrazilBulgariaBurma/MyanmarCabo VerdeCambodiaCameroonCanadaCaribbeanCentral AmericaChileChinaColombiaCongoCosta RicaCroatiaCubaCzechoslovakiaDenmarkDominicaDominican RepublicEastern AfricaEastern AsiaEastern EuropeEcuadorEgyptEl SalvadorEnglandEritreaEthiopiaEuropeFijiFranceGermanyGhanaGreeceGrenadaGuatemalaGuyanaHaitiHondurasHong KongHungaryIndiaIndonesiaIranIraqIrelandIsraelItalyJamaicaJapanJordanKazakhstanKenyaKoreaKuwaitLaosLatin AmericaLatviaLebanonLiberiaLithuaniaMalaysiaMexicoMicronesiaMiddle AfricaMoldovaMoroccoNepalNetherlandsNicaraguaNigeriaNorth AmericaNorth MacedoniaNorthern AfricaNorthern EuropeNorwayOceaniaPakistanPanamaPeruPhilippinesPolandPortugalRomaniaRussiaSaudi ArabiaScotlandSenegalSerbiaSierra LeoneSingaporeSomaliaSouth AfricaSouth AmericaSouth Central AsiaSouth Eastern AsiaSouthern EuropeSpainSri LankaSt. Vincent and the GrenadinesSudanSwedenSwitzerlandSyriaTaiwanThailandTrinidad and TobagoTurkeyUgandaUkraineUruguayUzbekistanVenezuelaVietnamWest IndiesWestern AfricaWestern AsiaWestern EuropeYemenZaireZimbabweAzores
Navajo
Race
Ancestry
AfghanAfricanAlaska NativeAlaskan AthabascanAlbanianAleutAlsatianAmericanApacheArabArapahoArgentineanArmenianAssyrian/Chaldean/SyriacAustralianAustrianBahamianBangladeshiBarbadianBasqueBelgianBelizeanBermudanBhutaneseBlackfeetBolivianBrazilianBritishBritish West IndianBulgarianBurmeseCajunCambodianCanadianCape VerdeanCarpatho RusynCelticCentral AmericanCentral American IndianCherokeeCheyenneChickasawChileanChineseChippewaChoctawColombianColvilleComancheCosta RicanCreeCreekCroatianCrowCubanCypriotCzechCzechoslovakianDanishDelawareDominicanDutchDutch West IndianEastern EuropeanEcuadorianEgyptianEnglishEstonianEthiopianEuropeanFijianFilipinoFinnishFrenchFrench American IndianFrench CanadianGermanGerman RussianGhanaianGreekGuamanian/ChamorroGuatemalanGuyaneseHaitianHmongHonduranHopiHoumaHungarianIcelanderIndian (Asian)IndonesianInupiatIranianIraqiIrishIroquoisIsraeliItalianJamaicanJapaneseJordanianKenyanKiowaKoreanLaotianLatvianLebaneseLiberianLithuanianLumbeeLuxembourgerMacedonianMalaysianMalteseMarshalleseMenomineeMexicanMexican American IndianMongolianMoroccanNative HawaiianNavajoNepaleseNew ZealanderNicaraguanNigerianNorthern EuropeanNorwegianOkinawanOsageOttawaPaiutePakistaniPalestinianPanamanianParaguayanPennsylvania GermanPeruvianPimaPolishPortuguesePotawatomiPuebloPuerto RicanPuget Sound SalishRomanianRussianSalvadoranSamoanScandinavianScotch-IrishScottishSeminoleSenegaleseSerbianShoshoneSierra LeoneanSiouxSlavicSlovakSloveneSomaliSouth AfricanSouth AmericanSouth American IndianSoviet UnionSpaniardSpanishSpanish AmericanSpanish American IndianSri LankanSubsaharan AfricanSudaneseSwedishSwissSyrianTaiwaneseThaiTlingit-HaidaTohono O'OdhamTonganTrinidadian and TobagonianTsimshianTurkishU.S. Virgin IslanderUgandanUkrainianUruguayanUteVenezuelanVietnameseWelshWest IndianYakamaYaquiYugoslavianYumanYup'ikZimbabwean
Immigration
NonimmigrantsImmigrantsAfghanistanAfricaAlbaniaArgentinaArmeniaAsiaAustraliaAustriaBahamasBangladeshBarbadosBelarusBelgiumBelizeBoliviaBosnia and HerzegovinaBrazilBulgariaBurma/MyanmarCabo VerdeCambodiaCameroonCanadaCaribbeanCentral AmericaChileChinaColombiaCongoCosta RicaCroatiaCubaCzechoslovakiaDenmarkDominicaDominican RepublicEastern AfricaEastern AsiaEastern EuropeEcuadorEgyptEl SalvadorEnglandEritreaEthiopiaEuropeFijiFranceGermanyGhanaGreeceGrenadaGuatemalaGuyanaHaitiHondurasHong KongHungaryIndiaIndonesiaIranIraqIrelandIsraelItalyJamaicaJapanJordanKazakhstanKenyaKoreaKuwaitLaosLatin AmericaLatviaLebanonLiberiaLithuaniaMalaysiaMexicoMicronesiaMiddle AfricaMoldovaMoroccoNepalNetherlandsNicaraguaNigeriaNorth AmericaNorth MacedoniaNorthern AfricaNorthern EuropeNorwayOceaniaPakistanPanamaPeruPhilippinesPolandPortugalRomaniaRussiaSaudi ArabiaScotlandSenegalSerbiaSierra LeoneSingaporeSomaliaSouth AfricaSouth AmericaSouth Central AsiaSouth Eastern AsiaSouthern EuropeSpainSri LankaSt. Vincent and the GrenadinesSudanSwedenSwitzerlandSyriaTaiwanThailandTrinidad and TobagoTurkeyUgandaUkraineUruguayUzbekistanVietnamWest IndiesWestern AfricaWestern AsiaWestern EuropeYemenZaireZimbabweAzores
No Vehicles in Household
Income
Poverty
Unemployment
Labor Participation
Family Structure
Vehicle Availability
Education Level
Disability

No Vehicles in Household Comparison

Immigrants from Venezuela

Navajo

Exceptional
Exceptional
8.1%
NO VEHICLES IN HOUSEHOLD
99.9/ 100
METRIC RATING
54th/ 347
METRIC RANK
9.4%
NO VEHICLES IN HOUSEHOLD
94.2/ 100
METRIC RATING
115th/ 347
METRIC RANK

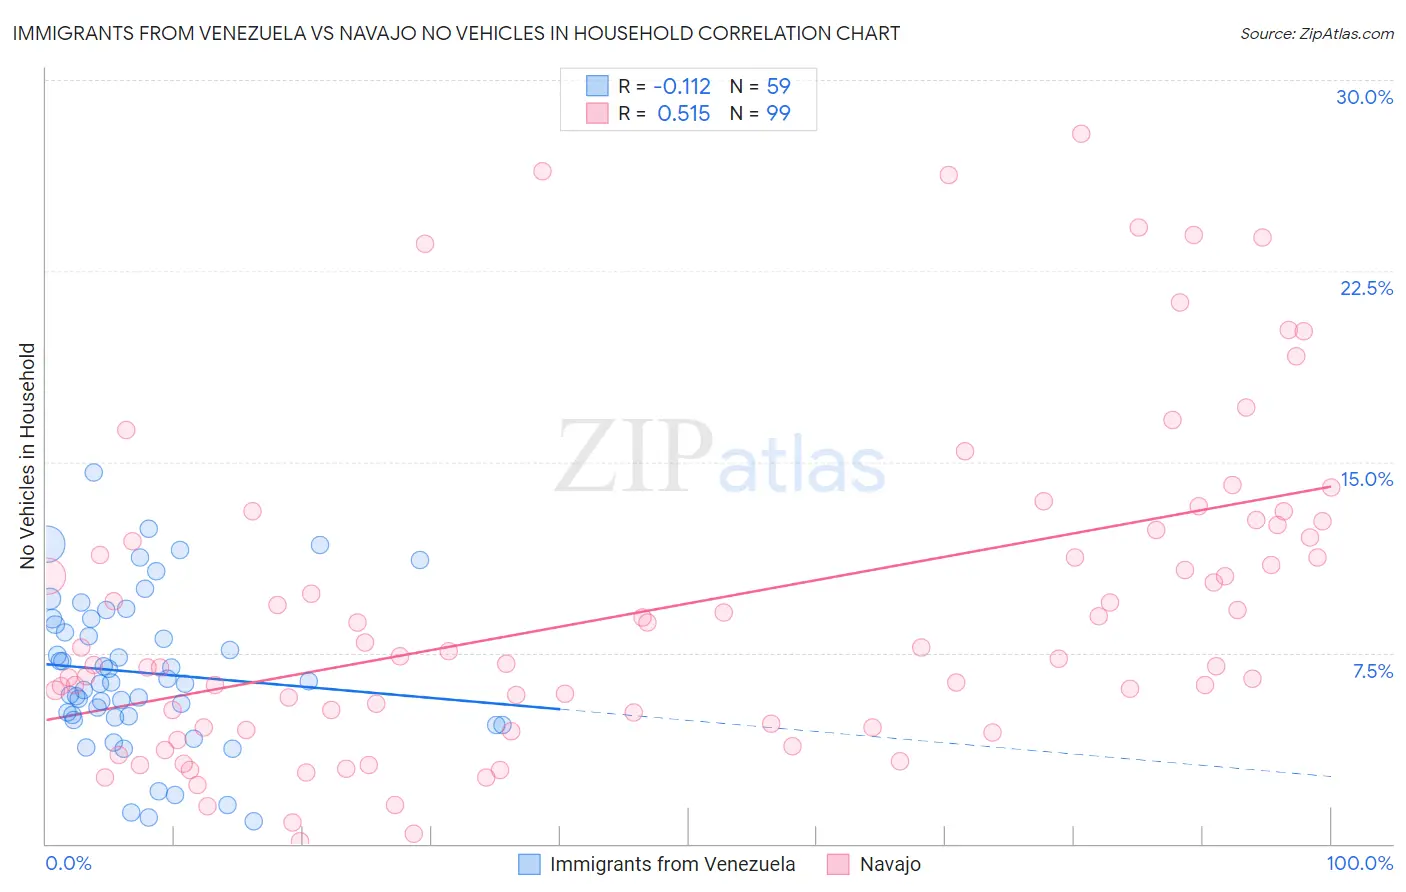
Immigrants from Venezuela vs Navajo No Vehicles in Household Correlation Chart

The statistical analysis conducted on geographies consisting of 287,495,682 people shows a poor negative correlation between the proportion of Immigrants from Venezuela and percentage of households with no vehicle available in the United States with a correlation coefficient (R) of -0.112 and weighted average of 8.1%. Similarly, the statistical analysis conducted on geographies consisting of 224,409,454 people shows a substantial positive correlation between the proportion of Navajo and percentage of households with no vehicle available in the United States with a correlation coefficient (R) of 0.515 and weighted average of 9.4%, a difference of 16.9%.
Immigrants from Venezuela vs Navajo No Vehicles in Household

No Vehicles in Household Correlation Summary

MeasurementImmigrants from VenezuelaNavajo
Minimum0.90%0.12%
Maximum14.6%27.9%
Range13.7%27.8%
Mean6.7%9.3%
Median6.3%7.4%
Interquartile 25% (IQ1)4.9%4.6%
Interquartile 75% (IQ3)8.8%12.3%
Interquartile Range (IQR)3.9%7.8%
Standard Deviation (Sample)3.0%6.3%
Standard Deviation (Population)3.0%6.3%

Similar Demographics by No Vehicles in Household

Demographics Similar to Immigrants from Venezuela by No Vehicles in Household

In terms of no vehicles in household, the demographic groups most similar to Immigrants from Venezuela are Celtic (8.1%, a difference of 0.090%), Hawaiian (8.0%, a difference of 0.31%), Slovene (8.0%, a difference of 0.31%), Immigrants from Afghanistan (8.1%, a difference of 0.48%), and Venezuelan (8.1%, a difference of 0.77%).
DemographicsRating | RankNo Vehicles in Household
Northern Europeans
99.9
/100
|
#47
Exceptional
7.9%
Afghans
99.9
/100
|
#48
Exceptional
8.0%
Guamanians/Chamorros
99.9
/100
|
#49
Exceptional
8.0%
Belgians
99.9
/100
|
#50
Exceptional
8.0%
Koreans
99.9
/100
|
#51
Exceptional
8.0%
Hawaiians
99.9
/100
|
#52
Exceptional
8.0%
Slovenes
99.9
/100
|
#53
Exceptional
8.0%
Immigrants | Venezuela
99.9
/100
|
#54
Exceptional
8.1%
Celtics
99.9
/100
|
#55
Exceptional
8.1%
Immigrants | Afghanistan
99.9
/100
|
#56
Exceptional
8.1%
Venezuelans
99.8
/100
|
#57
Exceptional
8.1%
Immigrants | Mexico
99.8
/100
|
#58
Exceptional
8.1%
Immigrants | India
99.8
/100
|
#59
Exceptional
8.2%
Immigrants | Laos
99.8
/100
|
#60
Exceptional
8.2%
Thais
99.8
/100
|
#61
Exceptional
8.2%

Demographics Similar to Navajo by No Vehicles in Household

In terms of no vehicles in household, the demographic groups most similar to Navajo are Serbian (9.4%, a difference of 0.070%), Japanese (9.4%, a difference of 0.070%), Chippewa (9.4%, a difference of 0.24%), Immigrants from Netherlands (9.4%, a difference of 0.49%), and Armenian (9.4%, a difference of 0.59%).
DemographicsRating | RankNo Vehicles in Household
Mexican American Indians
97.6
/100
|
#108
Exceptional
9.1%
Maltese
97.6
/100
|
#109
Exceptional
9.1%
Delaware
97.2
/100
|
#110
Exceptional
9.2%
Immigrants | Kuwait
95.1
/100
|
#111
Exceptional
9.4%
Armenians
95.0
/100
|
#112
Exceptional
9.4%
Immigrants | Netherlands
94.8
/100
|
#113
Exceptional
9.4%
Serbians
94.3
/100
|
#114
Exceptional
9.4%
Navajo
94.2
/100
|
#115
Exceptional
9.4%
Japanese
94.1
/100
|
#116
Exceptional
9.4%
Chippewa
93.8
/100
|
#117
Exceptional
9.4%
Greeks
92.9
/100
|
#118
Exceptional
9.5%
Fijians
92.7
/100
|
#119
Exceptional
9.5%
Immigrants | Thailand
92.6
/100
|
#120
Exceptional
9.5%
Puget Sound Salish
92.4
/100
|
#121
Exceptional
9.5%
Costa Ricans
92.3
/100
|
#122
Exceptional
9.5%