Immigrants from Sweden vs Immigrants from Africa 2 or more Vehicles in Household
COMPARE
Immigrants from Sweden
Immigrants from Africa
2 or more Vehicles in Household
2 or more Vehicles in Household Comparison
Immigrants from Sweden
Immigrants from Africa
55.2%
2 OR MORE VEHICLES IN HOUSEHOLD
45.3/ 100
METRIC RATING
178th/ 347
METRIC RANK
51.8%
2 OR MORE VEHICLES IN HOUSEHOLD
0.2/ 100
METRIC RATING
277th/ 347
METRIC RANK
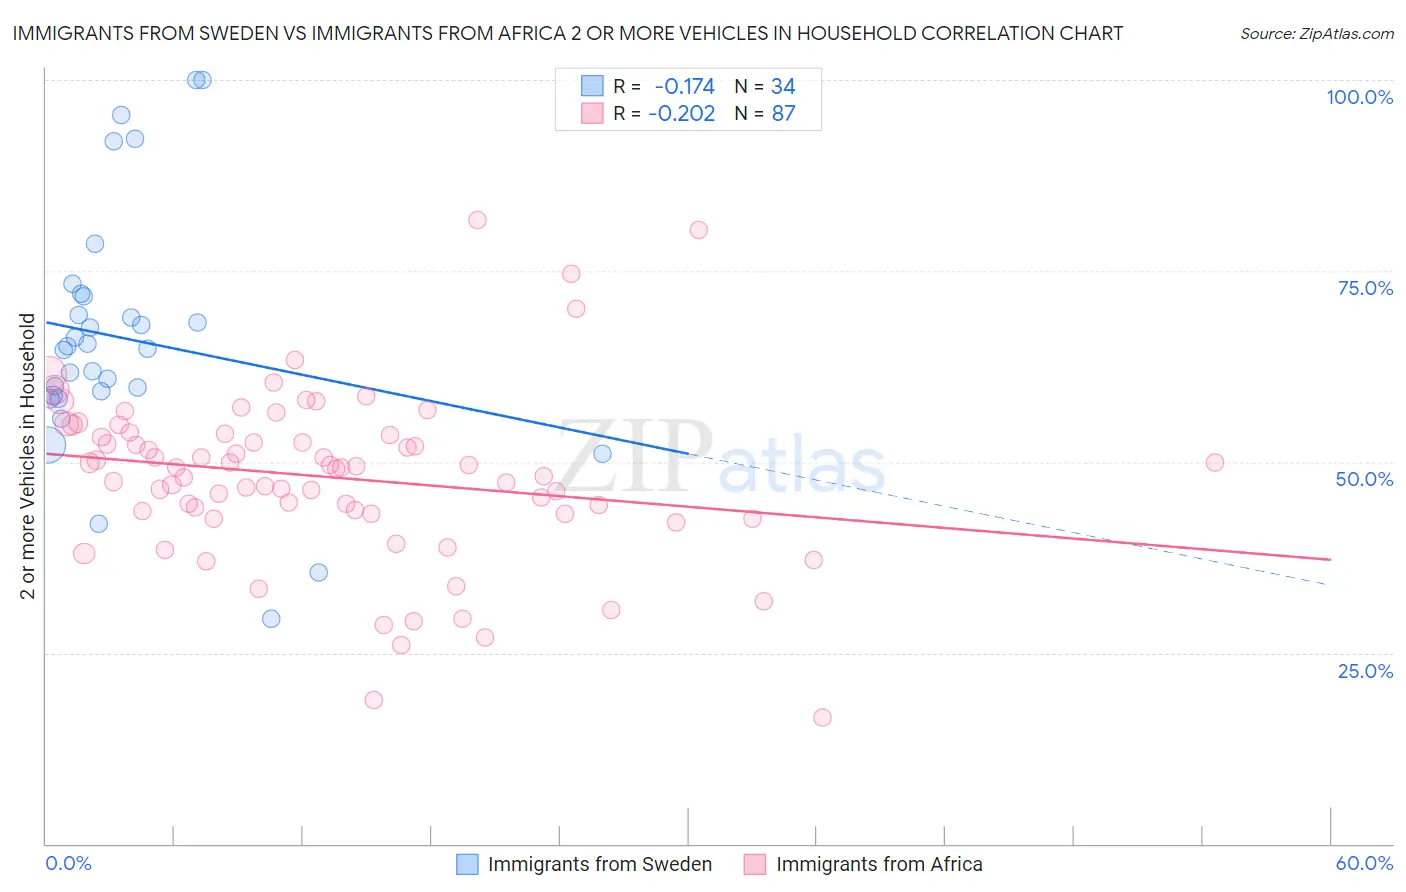
Immigrants from Sweden vs Immigrants from Africa 2 or more Vehicles in Household Correlation Chart
The statistical analysis conducted on geographies consisting of 164,706,538 people shows a poor negative correlation between the proportion of Immigrants from Sweden and percentage of households with 2 or more vehicles available in the United States with a correlation coefficient (R) of -0.174 and weighted average of 55.2%. Similarly, the statistical analysis conducted on geographies consisting of 468,994,559 people shows a weak negative correlation between the proportion of Immigrants from Africa and percentage of households with 2 or more vehicles available in the United States with a correlation coefficient (R) of -0.202 and weighted average of 51.8%, a difference of 6.7%.
2 or more Vehicles in Household Correlation Summary
| Measurement | Immigrants from Sweden | Immigrants from Africa |
| Minimum | 29.4% | 16.4% |
| Maximum | 100.0% | 81.7% |
| Range | 70.6% | 65.2% |
| Mean | 66.1% | 48.0% |
| Median | 65.0% | 49.2% |
| Interquartile 25% (IQ1) | 58.7% | 43.2% |
| Interquartile 75% (IQ3) | 71.7% | 53.7% |
| Interquartile Range (IQR) | 13.0% | 10.5% |
| Standard Deviation (Sample) | 16.1% | 11.3% |
| Standard Deviation (Population) | 15.9% | 11.2% |
Similar Demographics by 2 or more Vehicles in Household
Demographics Similar to Immigrants from Sweden by 2 or more Vehicles in Household
In terms of 2 or more vehicles in household, the demographic groups most similar to Immigrants from Sweden are Menominee (55.3%, a difference of 0.040%), Immigrants from Cuba (55.3%, a difference of 0.070%), Alaskan Athabascan (55.2%, a difference of 0.10%), Immigrants from Denmark (55.3%, a difference of 0.17%), and Navajo (55.3%, a difference of 0.19%).
| Demographics | Rating | Rank | 2 or more Vehicles in Household |
| Immigrants | Costa Rica | 54.4 /100 | #171 | Average 55.4% |
| Immigrants | Nicaragua | 51.6 /100 | #172 | Average 55.4% |
| Immigrants | Western Europe | 51.4 /100 | #173 | Average 55.4% |
| Navajo | 50.0 /100 | #174 | Average 55.3% |
| Immigrants | Denmark | 49.4 /100 | #175 | Average 55.3% |
| Immigrants | Cuba | 47.0 /100 | #176 | Average 55.3% |
| Menominee | 46.2 /100 | #177 | Average 55.3% |
| Immigrants | Sweden | 45.3 /100 | #178 | Average 55.2% |
| Alaskan Athabascans | 42.9 /100 | #179 | Average 55.2% |
| Immigrants | Kenya | 40.4 /100 | #180 | Average 55.1% |
| Immigrants | Micronesia | 38.2 /100 | #181 | Fair 55.1% |
| Cree | 38.2 /100 | #182 | Fair 55.1% |
| Immigrants | Cameroon | 37.3 /100 | #183 | Fair 55.1% |
| Apache | 36.7 /100 | #184 | Fair 55.1% |
| Arabs | 35.9 /100 | #185 | Fair 55.0% |
Demographics Similar to Immigrants from Africa by 2 or more Vehicles in Household
In terms of 2 or more vehicles in household, the demographic groups most similar to Immigrants from Africa are Immigrants from Croatia (51.8%, a difference of 0.050%), Yuman (51.7%, a difference of 0.060%), Liberian (51.7%, a difference of 0.070%), Immigrants from Honduras (51.8%, a difference of 0.080%), and African (51.8%, a difference of 0.090%).
| Demographics | Rating | Rank | 2 or more Vehicles in Household |
| Immigrants | Ireland | 0.2 /100 | #270 | Tragic 52.0% |
| South Americans | 0.2 /100 | #271 | Tragic 51.9% |
| Sub-Saharan Africans | 0.2 /100 | #272 | Tragic 51.9% |
| Israelis | 0.2 /100 | #273 | Tragic 51.9% |
| Africans | 0.2 /100 | #274 | Tragic 51.8% |
| Immigrants | Honduras | 0.2 /100 | #275 | Tragic 51.8% |
| Immigrants | Croatia | 0.2 /100 | #276 | Tragic 51.8% |
| Immigrants | Africa | 0.2 /100 | #277 | Tragic 51.8% |
| Yuman | 0.1 /100 | #278 | Tragic 51.7% |
| Liberians | 0.1 /100 | #279 | Tragic 51.7% |
| Immigrants | Eastern Europe | 0.1 /100 | #280 | Tragic 51.7% |
| Immigrants | Kazakhstan | 0.1 /100 | #281 | Tragic 51.6% |
| Bahamians | 0.1 /100 | #282 | Tragic 51.5% |
| Immigrants | China | 0.1 /100 | #283 | Tragic 51.5% |
| Immigrants | Zaire | 0.1 /100 | #284 | Tragic 51.5% |