Immigrants from Philippines vs Immigrants from Morocco No Vehicles in Household

COMPARE

Immigrants from Philippines
Race
Ancestry
AfghanAfricanAlaska NativeAlaskan AthabascanAlbanianAleutAlsatianAmericanApacheArabArapahoArgentineanArmenianAssyrian/Chaldean/SyriacAustralianAustrianBahamianBangladeshiBarbadianBasqueBelgianBelizeanBermudanBhutaneseBlackfeetBolivianBrazilianBritishBritish West IndianBulgarianBurmeseCajunCambodianCanadianCape VerdeanCarpatho RusynCelticCentral AmericanCentral American IndianCherokeeCheyenneChickasawChileanChineseChippewaChoctawColombianColvilleComancheCosta RicanCreeCreekCroatianCrowCubanCypriotCzechCzechoslovakianDanishDelawareDominicanDutchDutch West IndianEastern EuropeanEcuadorianEgyptianEnglishEstonianEthiopianEuropeanFijianFilipinoFinnishFrenchFrench American IndianFrench CanadianGermanGerman RussianGhanaianGreekGuamanian/ChamorroGuatemalanGuyaneseHaitianHmongHonduranHopiHoumaHungarianIcelanderIndian (Asian)IndonesianInupiatIranianIraqiIrishIroquoisIsraeliItalianJamaicanJapaneseJordanianKenyanKiowaKoreanLaotianLatvianLebaneseLiberianLithuanianLumbeeLuxembourgerMacedonianMalaysianMalteseMarshalleseMenomineeMexicanMexican American IndianMongolianMoroccanNative HawaiianNavajoNepaleseNew ZealanderNicaraguanNigerianNorthern EuropeanNorwegianOkinawanOsageOttawaPaiutePakistaniPalestinianPanamanianParaguayanPennsylvania GermanPeruvianPimaPolishPortuguesePotawatomiPuebloPuerto RicanPuget Sound SalishRomanianRussianSalvadoranSamoanScandinavianScotch-IrishScottishSeminoleSenegaleseSerbianShoshoneSierra LeoneanSiouxSlavicSlovakSloveneSomaliSouth AfricanSouth AmericanSouth American IndianSoviet UnionSpaniardSpanishSpanish AmericanSpanish American IndianSri LankanSubsaharan AfricanSudaneseSwedishSwissSyrianTaiwaneseThaiTlingit-HaidaTohono O'OdhamTonganTrinidadian and TobagonianTsimshianTurkishU.S. Virgin IslanderUgandanUkrainianUruguayanUteVenezuelanVietnameseWelshWest IndianYakamaYaquiYugoslavianYumanYup'ikZimbabwean
Immigration
NonimmigrantsImmigrantsAfghanistanAfricaAlbaniaArgentinaArmeniaAsiaAustraliaAustriaBahamasBangladeshBarbadosBelarusBelgiumBelizeBoliviaBosnia and HerzegovinaBrazilBulgariaBurma/MyanmarCabo VerdeCambodiaCameroonCanadaCaribbeanCentral AmericaChileChinaColombiaCongoCosta RicaCroatiaCubaCzechoslovakiaDenmarkDominicaDominican RepublicEastern AfricaEastern AsiaEastern EuropeEcuadorEgyptEl SalvadorEnglandEritreaEthiopiaEuropeFijiFranceGermanyGhanaGreeceGrenadaGuatemalaGuyanaHaitiHondurasHong KongHungaryIndiaIndonesiaIranIraqIrelandIsraelItalyJamaicaJapanJordanKazakhstanKenyaKoreaKuwaitLaosLatin AmericaLatviaLebanonLiberiaLithuaniaMalaysiaMexicoMicronesiaMiddle AfricaMoldovaNepalNetherlandsNicaraguaNigeriaNorth AmericaNorth MacedoniaNorthern AfricaNorthern EuropeNorwayOceaniaPakistanPanamaPeruPhilippinesPolandPortugalRomaniaRussiaSaudi ArabiaScotlandSenegalSerbiaSierra LeoneSingaporeSomaliaSouth AfricaSouth AmericaSouth Central AsiaSouth Eastern AsiaSouthern EuropeSpainSri LankaSt. Vincent and the GrenadinesSudanSwedenSwitzerlandSyriaTaiwanThailandTrinidad and TobagoTurkeyUgandaUkraineUruguayUzbekistanVenezuelaVietnamWest IndiesWestern AfricaWestern AsiaWestern EuropeYemenZaireZimbabweAzores
Immigrants from Morocco
Race
Ancestry
AfghanAfricanAlaska NativeAlaskan AthabascanAlbanianAleutAlsatianAmericanApacheArabArapahoArgentineanArmenianAssyrian/Chaldean/SyriacAustralianAustrianBahamianBangladeshiBarbadianBasqueBelgianBelizeanBermudanBhutaneseBlackfeetBolivianBrazilianBritishBritish West IndianBulgarianBurmeseCajunCambodianCanadianCape VerdeanCarpatho RusynCelticCentral AmericanCentral American IndianCherokeeCheyenneChickasawChileanChineseChippewaChoctawColombianColvilleComancheCosta RicanCreeCreekCroatianCrowCubanCypriotCzechCzechoslovakianDanishDelawareDominicanDutchDutch West IndianEastern EuropeanEcuadorianEgyptianEnglishEstonianEthiopianEuropeanFijianFilipinoFinnishFrenchFrench American IndianFrench CanadianGermanGerman RussianGhanaianGreekGuamanian/ChamorroGuatemalanGuyaneseHaitianHmongHonduranHopiHoumaHungarianIcelanderIndian (Asian)IndonesianInupiatIranianIraqiIrishIroquoisIsraeliItalianJamaicanJapaneseJordanianKenyanKiowaKoreanLaotianLatvianLebaneseLiberianLithuanianLumbeeLuxembourgerMacedonianMalaysianMalteseMarshalleseMenomineeMexicanMexican American IndianMongolianMoroccanNative HawaiianNavajoNepaleseNew ZealanderNicaraguanNigerianNorthern EuropeanNorwegianOkinawanOsageOttawaPaiutePakistaniPalestinianPanamanianParaguayanPennsylvania GermanPeruvianPimaPolishPortuguesePotawatomiPuebloPuerto RicanPuget Sound SalishRomanianRussianSalvadoranSamoanScandinavianScotch-IrishScottishSeminoleSenegaleseSerbianShoshoneSierra LeoneanSiouxSlavicSlovakSloveneSomaliSouth AfricanSouth AmericanSouth American IndianSoviet UnionSpaniardSpanishSpanish AmericanSpanish American IndianSri LankanSubsaharan AfricanSudaneseSwedishSwissSyrianTaiwaneseThaiTlingit-HaidaTohono O'OdhamTonganTrinidadian and TobagonianTsimshianTurkishU.S. Virgin IslanderUgandanUkrainianUruguayanUteVenezuelanVietnameseWelshWest IndianYakamaYaquiYugoslavianYumanYup'ikZimbabwean
Immigration
NonimmigrantsImmigrantsAfghanistanAfricaAlbaniaArgentinaArmeniaAsiaAustraliaAustriaBahamasBangladeshBarbadosBelarusBelgiumBelizeBoliviaBosnia and HerzegovinaBrazilBulgariaBurma/MyanmarCabo VerdeCambodiaCameroonCanadaCaribbeanCentral AmericaChileChinaColombiaCongoCosta RicaCroatiaCubaCzechoslovakiaDenmarkDominicaDominican RepublicEastern AfricaEastern AsiaEastern EuropeEcuadorEgyptEl SalvadorEnglandEritreaEthiopiaEuropeFijiFranceGermanyGhanaGreeceGrenadaGuatemalaGuyanaHaitiHondurasHong KongHungaryIndiaIndonesiaIranIraqIrelandIsraelItalyJamaicaJapanJordanKazakhstanKenyaKoreaKuwaitLaosLatin AmericaLatviaLebanonLiberiaLithuaniaMalaysiaMexicoMicronesiaMiddle AfricaMoldovaMoroccoNepalNetherlandsNicaraguaNigeriaNorth AmericaNorth MacedoniaNorthern AfricaNorthern EuropeNorwayOceaniaPakistanPanamaPeruPolandPortugalRomaniaRussiaSaudi ArabiaScotlandSenegalSerbiaSierra LeoneSingaporeSomaliaSouth AfricaSouth AmericaSouth Central AsiaSouth Eastern AsiaSouthern EuropeSpainSri LankaSt. Vincent and the GrenadinesSudanSwedenSwitzerlandSyriaTaiwanThailandTrinidad and TobagoTurkeyUgandaUkraineUruguayUzbekistanVenezuelaVietnamWest IndiesWestern AfricaWestern AsiaWestern EuropeYemenZaireZimbabweAzores
No Vehicles in Household
Income
Poverty
Unemployment
Labor Participation
Family Structure
Vehicle Availability
Education Level
Disability

No Vehicles in Household Comparison

Immigrants from Philippines

Immigrants from Morocco

Exceptional
Tragic
8.5%
NO VEHICLES IN HOUSEHOLD
99.5/ 100
METRIC RATING
76th/ 347
METRIC RANK
12.6%
NO VEHICLES IN HOUSEHOLD
0.2/ 100
METRIC RATING
271st/ 347
METRIC RANK

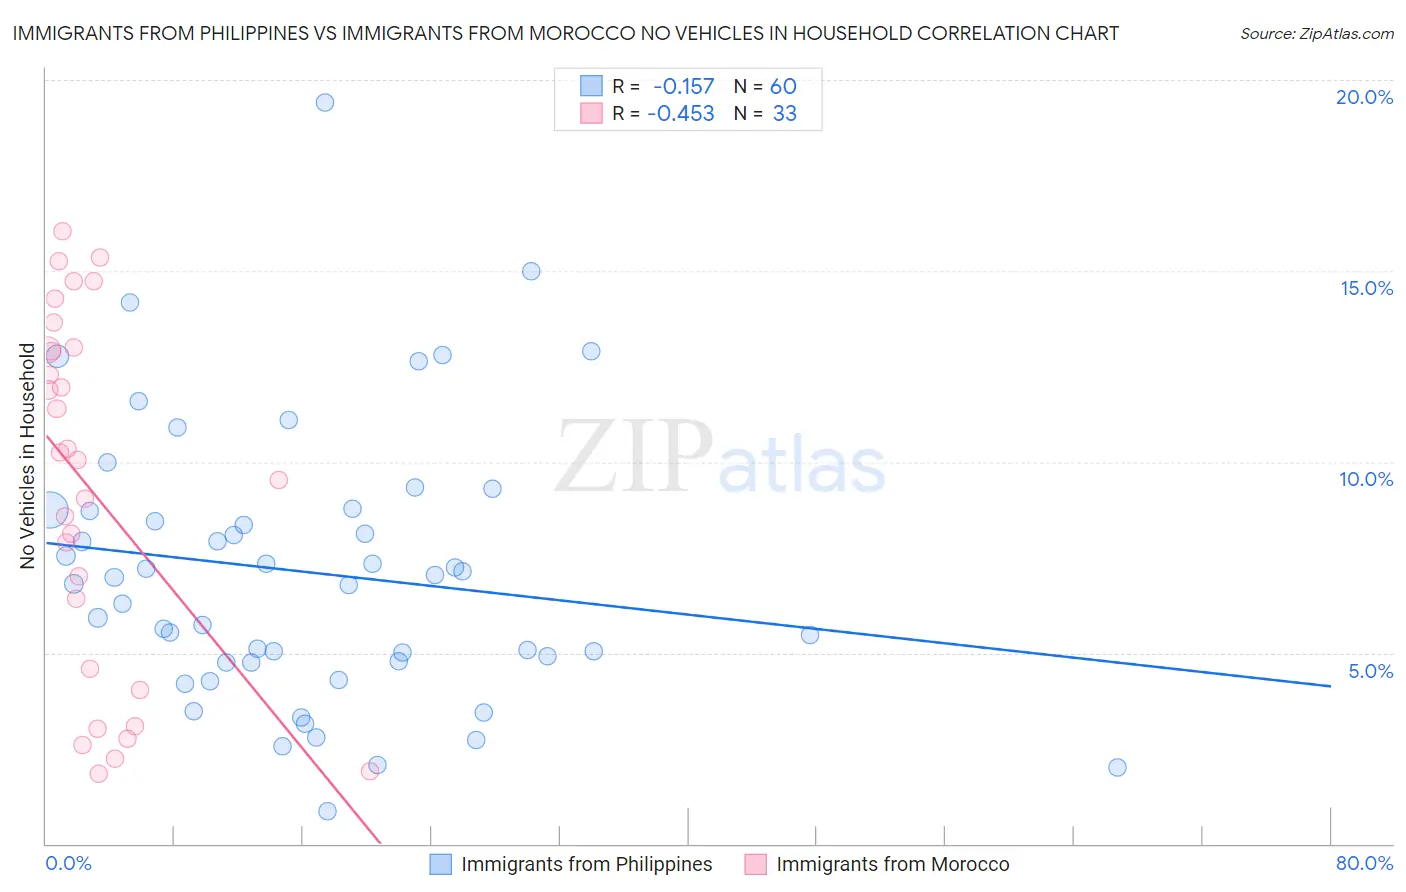
Immigrants from Philippines vs Immigrants from Morocco No Vehicles in Household Correlation Chart

The statistical analysis conducted on geographies consisting of 469,724,480 people shows a poor negative correlation between the proportion of Immigrants from Philippines and percentage of households with no vehicle available in the United States with a correlation coefficient (R) of -0.157 and weighted average of 8.5%. Similarly, the statistical analysis conducted on geographies consisting of 178,744,032 people shows a moderate negative correlation between the proportion of Immigrants from Morocco and percentage of households with no vehicle available in the United States with a correlation coefficient (R) of -0.453 and weighted average of 12.6%, a difference of 47.6%.
Immigrants from Philippines vs Immigrants from Morocco No Vehicles in Household

No Vehicles in Household Correlation Summary

MeasurementImmigrants from PhilippinesImmigrants from Morocco
Minimum0.84%1.8%
Maximum19.4%16.0%
Range18.6%14.2%
Mean7.1%9.2%
Median6.9%10.0%
Interquartile 25% (IQ1)4.8%4.3%
Interquartile 75% (IQ3)8.7%13.0%
Interquartile Range (IQR)4.0%8.7%
Standard Deviation (Sample)3.6%4.6%
Standard Deviation (Population)3.6%4.6%

Similar Demographics by No Vehicles in Household

Demographics Similar to Immigrants from Philippines by No Vehicles in Household

In terms of no vehicles in household, the demographic groups most similar to Immigrants from Philippines are Iranian (8.6%, a difference of 0.090%), Immigrants from South Central Asia (8.6%, a difference of 0.21%), Jordanian (8.5%, a difference of 0.24%), Portuguese (8.6%, a difference of 0.26%), and Bolivian (8.6%, a difference of 0.41%).
DemographicsRating | RankNo Vehicles in Household
Spaniards
99.7
/100
|
#69
Exceptional
8.4%
Cajuns
99.6
/100
|
#70
Exceptional
8.4%
Immigrants | Lebanon
99.6
/100
|
#71
Exceptional
8.4%
Lithuanians
99.6
/100
|
#72
Exceptional
8.4%
Poles
99.6
/100
|
#73
Exceptional
8.4%
Cubans
99.5
/100
|
#74
Exceptional
8.5%
Jordanians
99.5
/100
|
#75
Exceptional
8.5%
Immigrants | Philippines
99.5
/100
|
#76
Exceptional
8.5%
Iranians
99.5
/100
|
#77
Exceptional
8.6%
Immigrants | South Central Asia
99.5
/100
|
#78
Exceptional
8.6%
Portuguese
99.5
/100
|
#79
Exceptional
8.6%
Bolivians
99.4
/100
|
#80
Exceptional
8.6%
Tsimshian
99.4
/100
|
#81
Exceptional
8.6%
Immigrants | South Eastern Asia
99.4
/100
|
#82
Exceptional
8.6%
Italians
99.4
/100
|
#83
Exceptional
8.6%

Demographics Similar to Immigrants from Morocco by No Vehicles in Household

In terms of no vehicles in household, the demographic groups most similar to Immigrants from Morocco are Immigrants from Northern Africa (12.6%, a difference of 0.12%), Panamanian (12.5%, a difference of 0.67%), Immigrants from Africa (12.5%, a difference of 0.80%), Immigrants from Europe (12.5%, a difference of 0.85%), and Bermudan (12.8%, a difference of 1.3%).
DemographicsRating | RankNo Vehicles in Household
Immigrants | Switzerland
0.5
/100
|
#264
Tragic
12.3%
Africans
0.4
/100
|
#265
Tragic
12.3%
Israelis
0.3
/100
|
#266
Tragic
12.4%
Immigrants | Europe
0.3
/100
|
#267
Tragic
12.5%
Immigrants | Africa
0.2
/100
|
#268
Tragic
12.5%
Panamanians
0.2
/100
|
#269
Tragic
12.5%
Immigrants | Northern Africa
0.2
/100
|
#270
Tragic
12.6%
Immigrants | Morocco
0.2
/100
|
#271
Tragic
12.6%
Bermudans
0.1
/100
|
#272
Tragic
12.8%
Immigrants | France
0.1
/100
|
#273
Tragic
12.9%
Immigrants | Singapore
0.1
/100
|
#274
Tragic
12.9%
Immigrants | Albania
0.1
/100
|
#275
Tragic
13.0%
Immigrants | Southern Europe
0.1
/100
|
#276
Tragic
13.0%
Aleuts
0.1
/100
|
#277
Tragic
13.0%
Immigrants | Croatia
0.1
/100
|
#278
Tragic
13.0%