Immigrants from Italy vs Immigrants from Morocco No Vehicles in Household

COMPARE

Immigrants from Italy
Race
Ancestry
AfghanAfricanAlaska NativeAlaskan AthabascanAlbanianAleutAlsatianAmericanApacheArabArapahoArgentineanArmenianAssyrian/Chaldean/SyriacAustralianAustrianBahamianBangladeshiBarbadianBasqueBelgianBelizeanBermudanBhutaneseBlackfeetBolivianBrazilianBritishBritish West IndianBulgarianBurmeseCajunCambodianCanadianCape VerdeanCarpatho RusynCelticCentral AmericanCentral American IndianCherokeeCheyenneChickasawChileanChineseChippewaChoctawColombianColvilleComancheCosta RicanCreeCreekCroatianCrowCubanCypriotCzechCzechoslovakianDanishDelawareDominicanDutchDutch West IndianEastern EuropeanEcuadorianEgyptianEnglishEstonianEthiopianEuropeanFijianFilipinoFinnishFrenchFrench American IndianFrench CanadianGermanGerman RussianGhanaianGreekGuamanian/ChamorroGuatemalanGuyaneseHaitianHmongHonduranHopiHoumaHungarianIcelanderIndian (Asian)IndonesianInupiatIranianIraqiIrishIroquoisIsraeliItalianJamaicanJapaneseJordanianKenyanKiowaKoreanLaotianLatvianLebaneseLiberianLithuanianLumbeeLuxembourgerMacedonianMalaysianMalteseMarshalleseMenomineeMexicanMexican American IndianMongolianMoroccanNative HawaiianNavajoNepaleseNew ZealanderNicaraguanNigerianNorthern EuropeanNorwegianOkinawanOsageOttawaPaiutePakistaniPalestinianPanamanianParaguayanPennsylvania GermanPeruvianPimaPolishPortuguesePotawatomiPuebloPuerto RicanPuget Sound SalishRomanianRussianSalvadoranSamoanScandinavianScotch-IrishScottishSeminoleSenegaleseSerbianShoshoneSierra LeoneanSiouxSlavicSlovakSloveneSomaliSouth AfricanSouth AmericanSouth American IndianSoviet UnionSpaniardSpanishSpanish AmericanSpanish American IndianSri LankanSubsaharan AfricanSudaneseSwedishSwissSyrianTaiwaneseThaiTlingit-HaidaTohono O'OdhamTonganTrinidadian and TobagonianTsimshianTurkishU.S. Virgin IslanderUgandanUkrainianUruguayanUteVenezuelanVietnameseWelshWest IndianYakamaYaquiYugoslavianYumanYup'ikZimbabwean
Immigration
NonimmigrantsImmigrantsAfghanistanAfricaAlbaniaArgentinaArmeniaAsiaAustraliaAustriaBahamasBangladeshBarbadosBelarusBelgiumBelizeBoliviaBosnia and HerzegovinaBrazilBulgariaBurma/MyanmarCabo VerdeCambodiaCameroonCanadaCaribbeanCentral AmericaChileChinaColombiaCongoCosta RicaCroatiaCubaCzechoslovakiaDenmarkDominicaDominican RepublicEastern AfricaEastern AsiaEastern EuropeEcuadorEgyptEl SalvadorEnglandEritreaEthiopiaEuropeFijiFranceGermanyGhanaGreeceGrenadaGuatemalaGuyanaHaitiHondurasHong KongHungaryIndiaIndonesiaIranIraqIrelandIsraelItalyJamaicaJapanJordanKazakhstanKenyaKoreaKuwaitLaosLatin AmericaLatviaLebanonLiberiaLithuaniaMalaysiaMexicoMicronesiaMiddle AfricaMoldovaNepalNetherlandsNicaraguaNigeriaNorth AmericaNorth MacedoniaNorthern AfricaNorthern EuropeNorwayOceaniaPakistanPanamaPeruPhilippinesPolandPortugalRomaniaRussiaSaudi ArabiaScotlandSenegalSerbiaSierra LeoneSingaporeSomaliaSouth AfricaSouth AmericaSouth Central AsiaSouth Eastern AsiaSouthern EuropeSpainSri LankaSt. Vincent and the GrenadinesSudanSwedenSwitzerlandSyriaTaiwanThailandTrinidad and TobagoTurkeyUgandaUkraineUruguayUzbekistanVenezuelaVietnamWest IndiesWestern AfricaWestern AsiaWestern EuropeYemenZaireZimbabweAzores
Immigrants from Morocco
Race
Ancestry
AfghanAfricanAlaska NativeAlaskan AthabascanAlbanianAleutAlsatianAmericanApacheArabArapahoArgentineanArmenianAssyrian/Chaldean/SyriacAustralianAustrianBahamianBangladeshiBarbadianBasqueBelgianBelizeanBermudanBhutaneseBlackfeetBolivianBrazilianBritishBritish West IndianBulgarianBurmeseCajunCambodianCanadianCape VerdeanCarpatho RusynCelticCentral AmericanCentral American IndianCherokeeCheyenneChickasawChileanChineseChippewaChoctawColombianColvilleComancheCosta RicanCreeCreekCroatianCrowCubanCypriotCzechCzechoslovakianDanishDelawareDominicanDutchDutch West IndianEastern EuropeanEcuadorianEgyptianEnglishEstonianEthiopianEuropeanFijianFilipinoFinnishFrenchFrench American IndianFrench CanadianGermanGerman RussianGhanaianGreekGuamanian/ChamorroGuatemalanGuyaneseHaitianHmongHonduranHopiHoumaHungarianIcelanderIndian (Asian)IndonesianInupiatIranianIraqiIrishIroquoisIsraeliItalianJamaicanJapaneseJordanianKenyanKiowaKoreanLaotianLatvianLebaneseLiberianLithuanianLumbeeLuxembourgerMacedonianMalaysianMalteseMarshalleseMenomineeMexicanMexican American IndianMongolianMoroccanNative HawaiianNavajoNepaleseNew ZealanderNicaraguanNigerianNorthern EuropeanNorwegianOkinawanOsageOttawaPaiutePakistaniPalestinianPanamanianParaguayanPennsylvania GermanPeruvianPimaPolishPortuguesePotawatomiPuebloPuerto RicanPuget Sound SalishRomanianRussianSalvadoranSamoanScandinavianScotch-IrishScottishSeminoleSenegaleseSerbianShoshoneSierra LeoneanSiouxSlavicSlovakSloveneSomaliSouth AfricanSouth AmericanSouth American IndianSoviet UnionSpaniardSpanishSpanish AmericanSpanish American IndianSri LankanSubsaharan AfricanSudaneseSwedishSwissSyrianTaiwaneseThaiTlingit-HaidaTohono O'OdhamTonganTrinidadian and TobagonianTsimshianTurkishU.S. Virgin IslanderUgandanUkrainianUruguayanUteVenezuelanVietnameseWelshWest IndianYakamaYaquiYugoslavianYumanYup'ikZimbabwean
Immigration
NonimmigrantsImmigrantsAfghanistanAfricaAlbaniaArgentinaArmeniaAsiaAustraliaAustriaBahamasBangladeshBarbadosBelarusBelgiumBelizeBoliviaBosnia and HerzegovinaBrazilBulgariaBurma/MyanmarCabo VerdeCambodiaCameroonCanadaCaribbeanCentral AmericaChileChinaColombiaCongoCosta RicaCroatiaCubaCzechoslovakiaDenmarkDominicaDominican RepublicEastern AfricaEastern AsiaEastern EuropeEcuadorEgyptEl SalvadorEnglandEritreaEthiopiaEuropeFijiFranceGermanyGhanaGreeceGrenadaGuatemalaGuyanaHaitiHondurasHong KongHungaryIndiaIndonesiaIranIraqIrelandIsraelJamaicaJapanJordanKazakhstanKenyaKoreaKuwaitLaosLatin AmericaLatviaLebanonLiberiaLithuaniaMalaysiaMexicoMicronesiaMiddle AfricaMoldovaMoroccoNepalNetherlandsNicaraguaNigeriaNorth AmericaNorth MacedoniaNorthern AfricaNorthern EuropeNorwayOceaniaPakistanPanamaPeruPhilippinesPolandPortugalRomaniaRussiaSaudi ArabiaScotlandSenegalSerbiaSierra LeoneSingaporeSomaliaSouth AfricaSouth AmericaSouth Central AsiaSouth Eastern AsiaSouthern EuropeSpainSri LankaSt. Vincent and the GrenadinesSudanSwedenSwitzerlandSyriaTaiwanThailandTrinidad and TobagoTurkeyUgandaUkraineUruguayUzbekistanVenezuelaVietnamWest IndiesWestern AfricaWestern AsiaWestern EuropeYemenZaireZimbabweAzores
No Vehicles in Household
Income
Poverty
Unemployment
Labor Participation
Family Structure
Vehicle Availability
Education Level
Disability

No Vehicles in Household Comparison

Immigrants from Italy

Immigrants from Morocco

Poor
Tragic
11.0%
NO VEHICLES IN HOUSEHOLD
15.6/ 100
METRIC RATING
208th/ 347
METRIC RANK
12.6%
NO VEHICLES IN HOUSEHOLD
0.2/ 100
METRIC RATING
271st/ 347
METRIC RANK

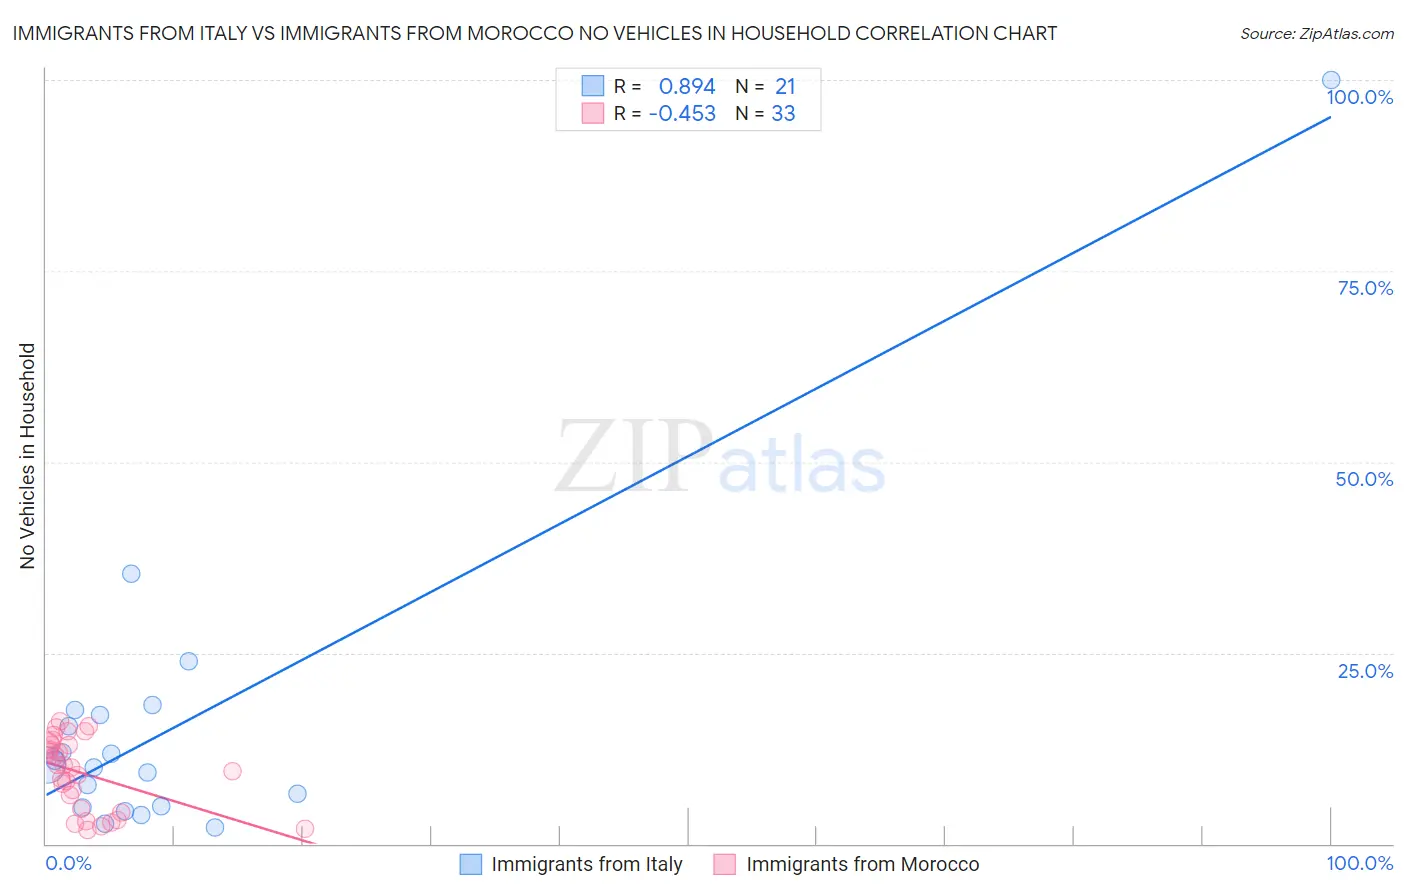
Immigrants from Italy vs Immigrants from Morocco No Vehicles in Household Correlation Chart

The statistical analysis conducted on geographies consisting of 323,696,139 people shows a very strong positive correlation between the proportion of Immigrants from Italy and percentage of households with no vehicle available in the United States with a correlation coefficient (R) of 0.894 and weighted average of 11.0%. Similarly, the statistical analysis conducted on geographies consisting of 178,744,032 people shows a moderate negative correlation between the proportion of Immigrants from Morocco and percentage of households with no vehicle available in the United States with a correlation coefficient (R) of -0.453 and weighted average of 12.6%, a difference of 14.7%.
Immigrants from Italy vs Immigrants from Morocco No Vehicles in Household

No Vehicles in Household Correlation Summary

MeasurementImmigrants from ItalyImmigrants from Morocco
Minimum2.1%1.8%
Maximum100.0%16.0%
Range97.9%14.2%
Mean15.6%9.2%
Median10.4%10.0%
Interquartile 25% (IQ1)4.8%4.3%
Interquartile 75% (IQ3)17.2%13.0%
Interquartile Range (IQR)12.3%8.7%
Standard Deviation (Sample)20.9%4.6%
Standard Deviation (Population)20.4%4.6%

Similar Demographics by No Vehicles in Household

Demographics Similar to Immigrants from Italy by No Vehicles in Household

In terms of no vehicles in household, the demographic groups most similar to Immigrants from Italy are Sierra Leonean (11.0%, a difference of 0.010%), Pennsylvania German (11.0%, a difference of 0.030%), Somali (11.0%, a difference of 0.060%), Immigrants from Chile (11.0%, a difference of 0.070%), and Guatemalan (11.0%, a difference of 0.11%).
DemographicsRating | RankNo Vehicles in Household
Immigrants | Western Europe
19.1
/100
|
#201
Poor
10.9%
Romanians
17.9
/100
|
#202
Poor
10.9%
Iroquois
17.6
/100
|
#203
Poor
10.9%
Guatemalans
16.1
/100
|
#204
Poor
11.0%
Immigrants | Chile
15.9
/100
|
#205
Poor
11.0%
Somalis
15.9
/100
|
#206
Poor
11.0%
Sierra Leoneans
15.7
/100
|
#207
Poor
11.0%
Immigrants | Italy
15.6
/100
|
#208
Poor
11.0%
Pennsylvania Germans
15.5
/100
|
#209
Poor
11.0%
Apache
14.8
/100
|
#210
Poor
11.0%
Crow
14.2
/100
|
#211
Poor
11.0%
Immigrants | Western Asia
13.9
/100
|
#212
Poor
11.0%
Immigrants | Hungary
12.3
/100
|
#213
Poor
11.1%
Immigrants | Denmark
12.1
/100
|
#214
Poor
11.1%
Immigrants | Sri Lanka
10.6
/100
|
#215
Poor
11.2%

Demographics Similar to Immigrants from Morocco by No Vehicles in Household

In terms of no vehicles in household, the demographic groups most similar to Immigrants from Morocco are Immigrants from Northern Africa (12.6%, a difference of 0.12%), Panamanian (12.5%, a difference of 0.67%), Immigrants from Africa (12.5%, a difference of 0.80%), Immigrants from Europe (12.5%, a difference of 0.85%), and Bermudan (12.8%, a difference of 1.3%).
DemographicsRating | RankNo Vehicles in Household
Immigrants | Switzerland
0.5
/100
|
#264
Tragic
12.3%
Africans
0.4
/100
|
#265
Tragic
12.3%
Israelis
0.3
/100
|
#266
Tragic
12.4%
Immigrants | Europe
0.3
/100
|
#267
Tragic
12.5%
Immigrants | Africa
0.2
/100
|
#268
Tragic
12.5%
Panamanians
0.2
/100
|
#269
Tragic
12.5%
Immigrants | Northern Africa
0.2
/100
|
#270
Tragic
12.6%
Immigrants | Morocco
0.2
/100
|
#271
Tragic
12.6%
Bermudans
0.1
/100
|
#272
Tragic
12.8%
Immigrants | France
0.1
/100
|
#273
Tragic
12.9%
Immigrants | Singapore
0.1
/100
|
#274
Tragic
12.9%
Immigrants | Albania
0.1
/100
|
#275
Tragic
13.0%
Immigrants | Southern Europe
0.1
/100
|
#276
Tragic
13.0%
Aleuts
0.1
/100
|
#277
Tragic
13.0%
Immigrants | Croatia
0.1
/100
|
#278
Tragic
13.0%