Immigrants from Pakistan vs Panamanian 3 or more Vehicles in Household
COMPARE
Immigrants from Pakistan
Panamanian
3 or more Vehicles in Household
3 or more Vehicles in Household Comparison
Immigrants from Pakistan
Panamanians
19.8%
3 OR MORE VEHICLES IN HOUSEHOLD
68.2/ 100
METRIC RATING
159th/ 347
METRIC RANK
18.8%
3 OR MORE VEHICLES IN HOUSEHOLD
11.6/ 100
METRIC RATING
212th/ 347
METRIC RANK
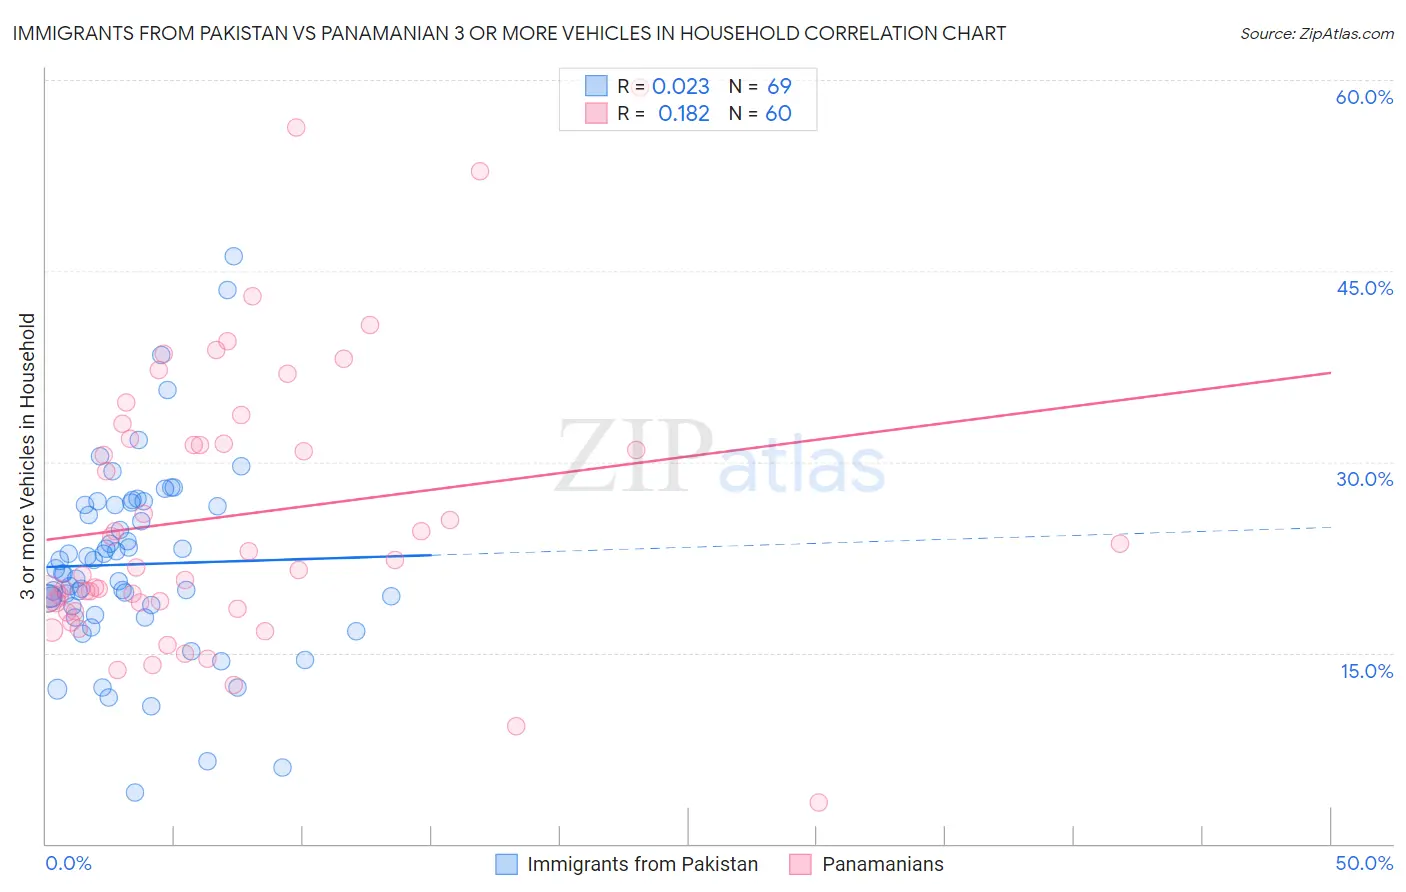
Immigrants from Pakistan vs Panamanian 3 or more Vehicles in Household Correlation Chart
The statistical analysis conducted on geographies consisting of 283,714,957 people shows no correlation between the proportion of Immigrants from Pakistan and percentage of households with 3 or more vehicles available in the United States with a correlation coefficient (R) of 0.023 and weighted average of 19.8%. Similarly, the statistical analysis conducted on geographies consisting of 281,018,762 people shows a poor positive correlation between the proportion of Panamanians and percentage of households with 3 or more vehicles available in the United States with a correlation coefficient (R) of 0.182 and weighted average of 18.8%, a difference of 5.5%.
3 or more Vehicles in Household Correlation Summary
| Measurement | Immigrants from Pakistan | Panamanian |
| Minimum | 4.0% | 3.2% |
| Maximum | 46.2% | 59.4% |
| Range | 42.1% | 56.1% |
| Mean | 21.9% | 25.7% |
| Median | 21.3% | 22.0% |
| Interquartile 25% (IQ1) | 18.3% | 18.7% |
| Interquartile 75% (IQ3) | 26.6% | 31.6% |
| Interquartile Range (IQR) | 8.3% | 12.9% |
| Standard Deviation (Sample) | 7.5% | 11.1% |
| Standard Deviation (Population) | 7.5% | 11.0% |
Similar Demographics by 3 or more Vehicles in Household
Demographics Similar to Immigrants from Pakistan by 3 or more Vehicles in Household
In terms of 3 or more vehicles in household, the demographic groups most similar to Immigrants from Pakistan are Armenian (19.8%, a difference of 0.050%), Immigrants from Lebanon (19.8%, a difference of 0.050%), Hungarian (19.8%, a difference of 0.21%), Immigrants from Guatemala (19.7%, a difference of 0.22%), and Thai (19.8%, a difference of 0.26%).
| Demographics | Rating | Rank | 3 or more Vehicles in Household |
| Lebanese | 79.8 /100 | #152 | Good 20.0% |
| Yuman | 75.6 /100 | #153 | Good 19.9% |
| Immigrants | Jordan | 75.0 /100 | #154 | Good 19.9% |
| Tlingit-Haida | 73.4 /100 | #155 | Good 19.9% |
| Thais | 71.1 /100 | #156 | Good 19.8% |
| Hungarians | 70.5 /100 | #157 | Good 19.8% |
| Armenians | 68.8 /100 | #158 | Good 19.8% |
| Immigrants | Pakistan | 68.2 /100 | #159 | Good 19.8% |
| Immigrants | Lebanon | 67.6 /100 | #160 | Good 19.8% |
| Immigrants | Guatemala | 65.6 /100 | #161 | Good 19.7% |
| Estonians | 63.2 /100 | #162 | Good 19.7% |
| Chileans | 63.0 /100 | #163 | Good 19.7% |
| Yugoslavians | 62.9 /100 | #164 | Good 19.7% |
| Immigrants | Costa Rica | 61.9 /100 | #165 | Good 19.7% |
| Immigrants | Cameroon | 60.9 /100 | #166 | Good 19.7% |
Demographics Similar to Panamanians by 3 or more Vehicles in Household
In terms of 3 or more vehicles in household, the demographic groups most similar to Panamanians are Immigrants from Cuba (18.8%, a difference of 0.010%), Immigrants from Kenya (18.8%, a difference of 0.14%), Immigrants from Sierra Leone (18.7%, a difference of 0.16%), Eastern European (18.7%, a difference of 0.21%), and Bulgarian (18.8%, a difference of 0.26%).
| Demographics | Rating | Rank | 3 or more Vehicles in Household |
| Russians | 14.2 /100 | #205 | Poor 18.8% |
| Immigrants | Eastern Asia | 14.1 /100 | #206 | Poor 18.8% |
| Immigrants | Chile | 13.6 /100 | #207 | Poor 18.8% |
| Immigrants | Burma/Myanmar | 13.6 /100 | #208 | Poor 18.8% |
| Immigrants | Egypt | 13.5 /100 | #209 | Poor 18.8% |
| Bulgarians | 13.1 /100 | #210 | Poor 18.8% |
| Immigrants | Kenya | 12.4 /100 | #211 | Poor 18.8% |
| Panamanians | 11.6 /100 | #212 | Poor 18.8% |
| Immigrants | Cuba | 11.6 /100 | #213 | Poor 18.8% |
| Immigrants | Sierra Leone | 10.8 /100 | #214 | Poor 18.7% |
| Eastern Europeans | 10.6 /100 | #215 | Poor 18.7% |
| Immigrants | Nigeria | 10.3 /100 | #216 | Poor 18.7% |
| Immigrants | Italy | 10.2 /100 | #217 | Poor 18.7% |
| Immigrants | Portugal | 8.9 /100 | #218 | Tragic 18.6% |
| Immigrants | Armenia | 8.6 /100 | #219 | Tragic 18.6% |