Immigrants from Pakistan vs Immigrants from Somalia 3 or more Vehicles in Household
COMPARE
Immigrants from Pakistan
Immigrants from Somalia
3 or more Vehicles in Household
3 or more Vehicles in Household Comparison
Immigrants from Pakistan
Immigrants from Somalia
19.8%
3 OR MORE VEHICLES IN HOUSEHOLD
68.2/ 100
METRIC RATING
159th/ 347
METRIC RANK
15.9%
3 OR MORE VEHICLES IN HOUSEHOLD
0.0/ 100
METRIC RATING
309th/ 347
METRIC RANK
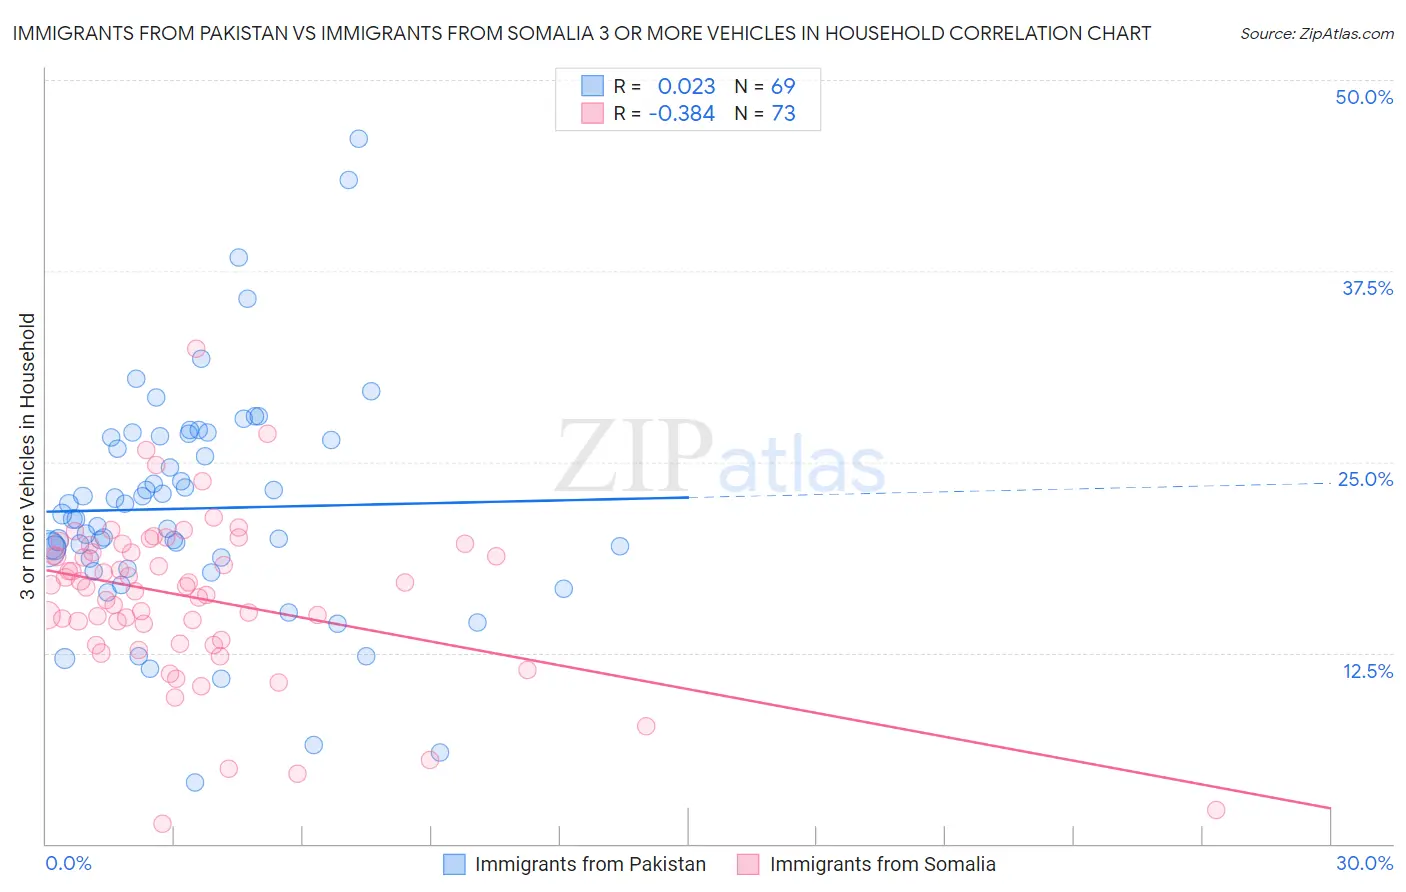
Immigrants from Pakistan vs Immigrants from Somalia 3 or more Vehicles in Household Correlation Chart
The statistical analysis conducted on geographies consisting of 283,714,957 people shows no correlation between the proportion of Immigrants from Pakistan and percentage of households with 3 or more vehicles available in the United States with a correlation coefficient (R) of 0.023 and weighted average of 19.8%. Similarly, the statistical analysis conducted on geographies consisting of 92,101,746 people shows a mild negative correlation between the proportion of Immigrants from Somalia and percentage of households with 3 or more vehicles available in the United States with a correlation coefficient (R) of -0.384 and weighted average of 15.9%, a difference of 24.3%.
3 or more Vehicles in Household Correlation Summary
| Measurement | Immigrants from Pakistan | Immigrants from Somalia |
| Minimum | 4.0% | 1.3% |
| Maximum | 46.2% | 32.4% |
| Range | 42.1% | 31.2% |
| Mean | 21.9% | 16.1% |
| Median | 21.3% | 16.9% |
| Interquartile 25% (IQ1) | 18.3% | 13.2% |
| Interquartile 75% (IQ3) | 26.6% | 19.3% |
| Interquartile Range (IQR) | 8.3% | 6.1% |
| Standard Deviation (Sample) | 7.5% | 5.3% |
| Standard Deviation (Population) | 7.5% | 5.3% |
Similar Demographics by 3 or more Vehicles in Household
Demographics Similar to Immigrants from Pakistan by 3 or more Vehicles in Household
In terms of 3 or more vehicles in household, the demographic groups most similar to Immigrants from Pakistan are Armenian (19.8%, a difference of 0.050%), Immigrants from Lebanon (19.8%, a difference of 0.050%), Hungarian (19.8%, a difference of 0.21%), Immigrants from Guatemala (19.7%, a difference of 0.22%), and Thai (19.8%, a difference of 0.26%).
| Demographics | Rating | Rank | 3 or more Vehicles in Household |
| Lebanese | 79.8 /100 | #152 | Good 20.0% |
| Yuman | 75.6 /100 | #153 | Good 19.9% |
| Immigrants | Jordan | 75.0 /100 | #154 | Good 19.9% |
| Tlingit-Haida | 73.4 /100 | #155 | Good 19.9% |
| Thais | 71.1 /100 | #156 | Good 19.8% |
| Hungarians | 70.5 /100 | #157 | Good 19.8% |
| Armenians | 68.8 /100 | #158 | Good 19.8% |
| Immigrants | Pakistan | 68.2 /100 | #159 | Good 19.8% |
| Immigrants | Lebanon | 67.6 /100 | #160 | Good 19.8% |
| Immigrants | Guatemala | 65.6 /100 | #161 | Good 19.7% |
| Estonians | 63.2 /100 | #162 | Good 19.7% |
| Chileans | 63.0 /100 | #163 | Good 19.7% |
| Yugoslavians | 62.9 /100 | #164 | Good 19.7% |
| Immigrants | Costa Rica | 61.9 /100 | #165 | Good 19.7% |
| Immigrants | Cameroon | 60.9 /100 | #166 | Good 19.7% |
Demographics Similar to Immigrants from Somalia by 3 or more Vehicles in Household
In terms of 3 or more vehicles in household, the demographic groups most similar to Immigrants from Somalia are Moroccan (15.9%, a difference of 0.24%), Albanian (15.8%, a difference of 0.74%), Houma (16.1%, a difference of 0.92%), Immigrants from Ghana (16.2%, a difference of 1.5%), and Somali (16.2%, a difference of 1.7%).
| Demographics | Rating | Rank | 3 or more Vehicles in Household |
| Immigrants | Greece | 0.0 /100 | #302 | Tragic 16.5% |
| Immigrants | Serbia | 0.0 /100 | #303 | Tragic 16.4% |
| Ghanaians | 0.0 /100 | #304 | Tragic 16.4% |
| Immigrants | Morocco | 0.0 /100 | #305 | Tragic 16.3% |
| Somalis | 0.0 /100 | #306 | Tragic 16.2% |
| Immigrants | Ghana | 0.0 /100 | #307 | Tragic 16.2% |
| Houma | 0.0 /100 | #308 | Tragic 16.1% |
| Immigrants | Somalia | 0.0 /100 | #309 | Tragic 15.9% |
| Moroccans | 0.0 /100 | #310 | Tragic 15.9% |
| Albanians | 0.0 /100 | #311 | Tragic 15.8% |
| Puerto Ricans | 0.0 /100 | #312 | Tragic 15.6% |
| Immigrants | Israel | 0.0 /100 | #313 | Tragic 15.6% |
| Immigrants | Belarus | 0.0 /100 | #314 | Tragic 15.5% |
| Haitians | 0.0 /100 | #315 | Tragic 15.5% |
| U.S. Virgin Islanders | 0.0 /100 | #316 | Tragic 15.4% |