Immigrants from Korea vs Armenian 4 or more Vehicles in Household
COMPARE
Immigrants from Korea
Armenian
4 or more Vehicles in Household
4 or more Vehicles in Household Comparison
Immigrants from Korea
Armenians
6.8%
4 OR MORE VEHICLES IN HOUSEHOLD
93.8/ 100
METRIC RATING
127th/ 347
METRIC RANK
6.6%
4 OR MORE VEHICLES IN HOUSEHOLD
86.9/ 100
METRIC RATING
133rd/ 347
METRIC RANK
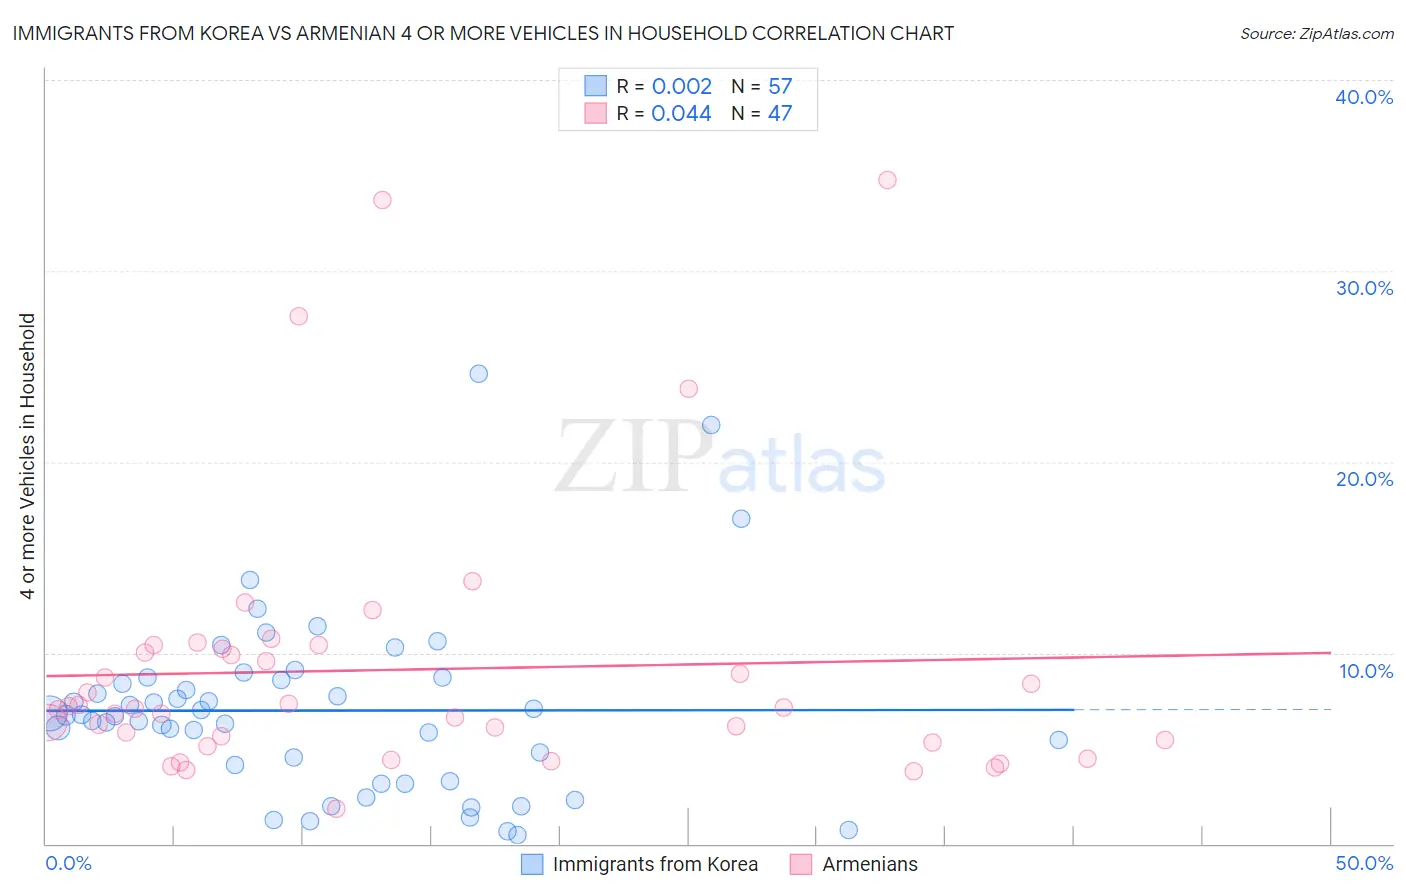
Immigrants from Korea vs Armenian 4 or more Vehicles in Household Correlation Chart
The statistical analysis conducted on geographies consisting of 414,077,591 people shows no correlation between the proportion of Immigrants from Korea and percentage of households with 4 or more vehicles available in the United States with a correlation coefficient (R) of 0.002 and weighted average of 6.8%. Similarly, the statistical analysis conducted on geographies consisting of 309,582,148 people shows no correlation between the proportion of Armenians and percentage of households with 4 or more vehicles available in the United States with a correlation coefficient (R) of 0.044 and weighted average of 6.6%, a difference of 2.0%.
4 or more Vehicles in Household Correlation Summary
| Measurement | Immigrants from Korea | Armenian |
| Minimum | 0.44% | 1.8% |
| Maximum | 24.6% | 34.8% |
| Range | 24.1% | 33.0% |
| Mean | 7.0% | 9.1% |
| Median | 6.7% | 7.1% |
| Interquartile 25% (IQ1) | 3.7% | 5.3% |
| Interquartile 75% (IQ3) | 8.6% | 10.2% |
| Interquartile Range (IQR) | 5.0% | 4.9% |
| Standard Deviation (Sample) | 4.7% | 7.1% |
| Standard Deviation (Population) | 4.6% | 7.0% |
Demographics Similar to Immigrants from Korea and Armenians by 4 or more Vehicles in Household
In terms of 4 or more vehicles in household, the demographic groups most similar to Immigrants from Korea are Belgian (6.8%, a difference of 0.12%), Austrian (6.8%, a difference of 0.13%), Immigrants from Asia (6.8%, a difference of 0.23%), Immigrants (6.8%, a difference of 0.33%), and Immigrants from Germany (6.8%, a difference of 0.39%). Similarly, the demographic groups most similar to Armenians are Ottawa (6.6%, a difference of 0.020%), Tohono O'odham (6.6%, a difference of 0.050%), Luxembourger (6.6%, a difference of 0.11%), Immigrants from Netherlands (6.6%, a difference of 0.19%), and French Canadian (6.6%, a difference of 0.32%).
| Demographics | Rating | Rank | 4 or more Vehicles in Household |
| Comanche | 94.8 /100 | #120 | Exceptional 6.8% |
| Immigrants | Germany | 94.7 /100 | #121 | Exceptional 6.8% |
| Immigrants | Nicaragua | 94.7 /100 | #122 | Exceptional 6.8% |
| Immigrants | Immigrants | 94.6 /100 | #123 | Exceptional 6.8% |
| Immigrants | Asia | 94.4 /100 | #124 | Exceptional 6.8% |
| Austrians | 94.1 /100 | #125 | Exceptional 6.8% |
| Belgians | 94.1 /100 | #126 | Exceptional 6.8% |
| Immigrants | Korea | 93.8 /100 | #127 | Exceptional 6.8% |
| Immigrants | Bolivia | 92.5 /100 | #128 | Exceptional 6.7% |
| Immigrants | England | 92.0 /100 | #129 | Exceptional 6.7% |
| Immigrants | Scotland | 89.0 /100 | #130 | Excellent 6.7% |
| Maltese | 88.4 /100 | #131 | Excellent 6.7% |
| Immigrants | Netherlands | 87.8 /100 | #132 | Excellent 6.6% |
| Armenians | 86.9 /100 | #133 | Excellent 6.6% |
| Ottawa | 86.9 /100 | #134 | Excellent 6.6% |
| Tohono O'odham | 86.7 /100 | #135 | Excellent 6.6% |
| Luxembourgers | 86.4 /100 | #136 | Excellent 6.6% |
| French Canadians | 85.4 /100 | #137 | Excellent 6.6% |
| Italians | 84.5 /100 | #138 | Excellent 6.6% |
| Jordanians | 82.1 /100 | #139 | Excellent 6.6% |
| Slavs | 81.6 /100 | #140 | Excellent 6.6% |