Immigrants from Kenya vs Potawatomi 2 or more Vehicles in Household
COMPARE
Immigrants from Kenya
Potawatomi
2 or more Vehicles in Household
2 or more Vehicles in Household Comparison
Immigrants from Kenya
Potawatomi
55.1%
2 OR MORE VEHICLES IN HOUSEHOLD
40.4/ 100
METRIC RATING
180th/ 347
METRIC RANK
58.0%
2 OR MORE VEHICLES IN HOUSEHOLD
99.1/ 100
METRIC RATING
86th/ 347
METRIC RANK
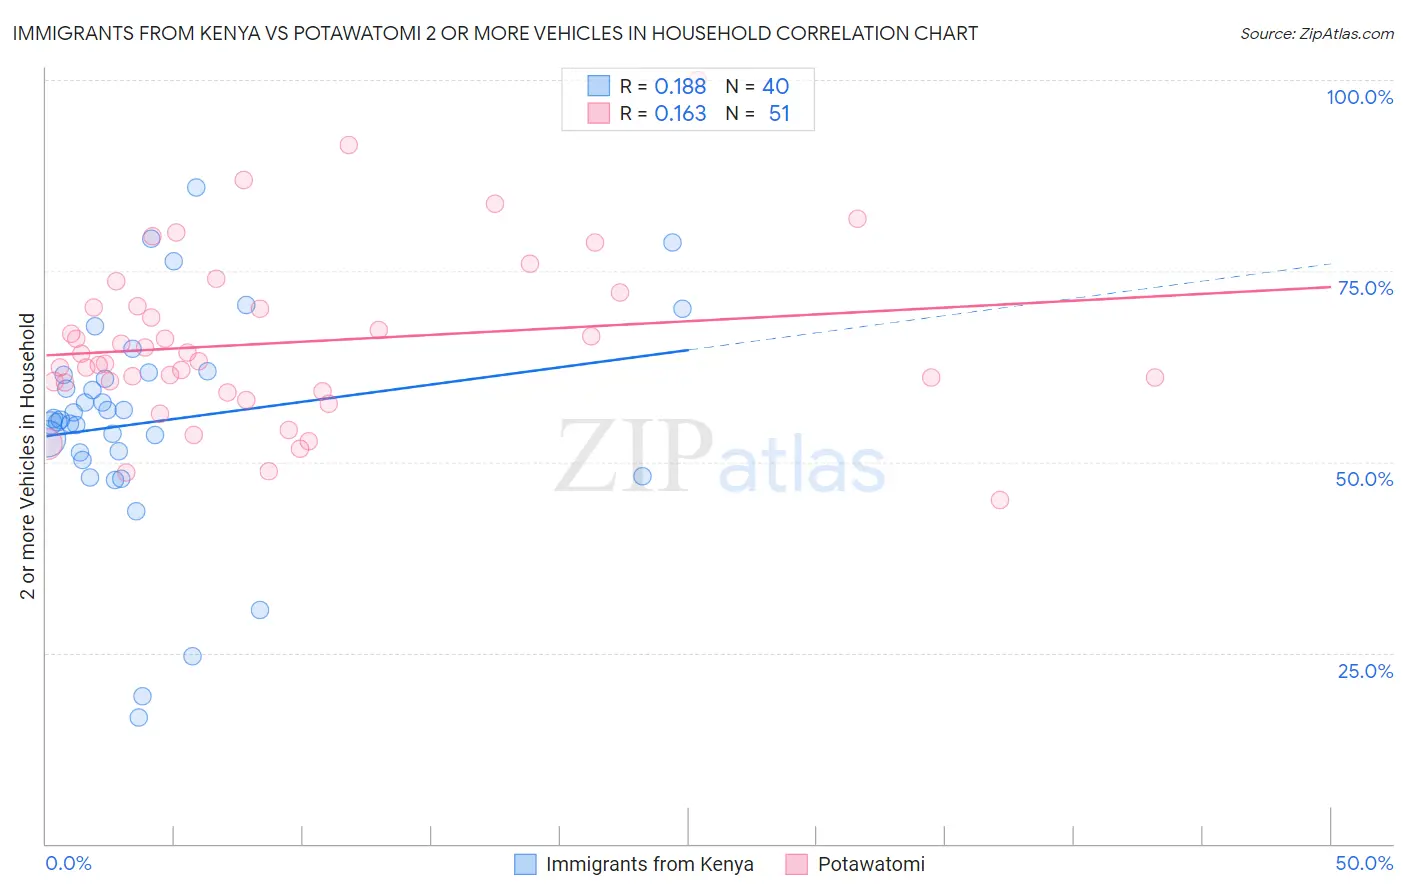
Immigrants from Kenya vs Potawatomi 2 or more Vehicles in Household Correlation Chart
The statistical analysis conducted on geographies consisting of 218,001,481 people shows a poor positive correlation between the proportion of Immigrants from Kenya and percentage of households with 2 or more vehicles available in the United States with a correlation coefficient (R) of 0.188 and weighted average of 55.1%. Similarly, the statistical analysis conducted on geographies consisting of 117,759,902 people shows a poor positive correlation between the proportion of Potawatomi and percentage of households with 2 or more vehicles available in the United States with a correlation coefficient (R) of 0.163 and weighted average of 58.0%, a difference of 5.1%.
2 or more Vehicles in Household Correlation Summary
| Measurement | Immigrants from Kenya | Potawatomi |
| Minimum | 16.4% | 45.0% |
| Maximum | 85.9% | 100.0% |
| Range | 69.4% | 55.0% |
| Mean | 55.3% | 65.6% |
| Median | 55.6% | 63.1% |
| Interquartile 25% (IQ1) | 50.7% | 59.2% |
| Interquartile 75% (IQ3) | 61.6% | 70.3% |
| Interquartile Range (IQR) | 10.9% | 11.1% |
| Standard Deviation (Sample) | 14.5% | 11.1% |
| Standard Deviation (Population) | 14.3% | 11.0% |
Similar Demographics by 2 or more Vehicles in Household
Demographics Similar to Immigrants from Kenya by 2 or more Vehicles in Household
In terms of 2 or more vehicles in household, the demographic groups most similar to Immigrants from Kenya are Immigrants from Micronesia (55.1%, a difference of 0.090%), Cree (55.1%, a difference of 0.090%), Alaskan Athabascan (55.2%, a difference of 0.11%), Immigrants from Cameroon (55.1%, a difference of 0.13%), and Apache (55.1%, a difference of 0.15%).
| Demographics | Rating | Rank | 2 or more Vehicles in Household |
| Immigrants | Western Europe | 51.4 /100 | #173 | Average 55.4% |
| Navajo | 50.0 /100 | #174 | Average 55.3% |
| Immigrants | Denmark | 49.4 /100 | #175 | Average 55.3% |
| Immigrants | Cuba | 47.0 /100 | #176 | Average 55.3% |
| Menominee | 46.2 /100 | #177 | Average 55.3% |
| Immigrants | Sweden | 45.3 /100 | #178 | Average 55.2% |
| Alaskan Athabascans | 42.9 /100 | #179 | Average 55.2% |
| Immigrants | Kenya | 40.4 /100 | #180 | Average 55.1% |
| Immigrants | Micronesia | 38.2 /100 | #181 | Fair 55.1% |
| Cree | 38.2 /100 | #182 | Fair 55.1% |
| Immigrants | Cameroon | 37.3 /100 | #183 | Fair 55.1% |
| Apache | 36.7 /100 | #184 | Fair 55.1% |
| Arabs | 35.9 /100 | #185 | Fair 55.0% |
| Peruvians | 33.7 /100 | #186 | Fair 55.0% |
| Immigrants | Uganda | 33.4 /100 | #187 | Fair 55.0% |
Demographics Similar to Potawatomi by 2 or more Vehicles in Household
In terms of 2 or more vehicles in household, the demographic groups most similar to Potawatomi are Slovak (58.0%, a difference of 0.030%), Thai (57.9%, a difference of 0.040%), Immigrants from Iran (57.9%, a difference of 0.050%), Maltese (58.0%, a difference of 0.080%), and Icelander (58.0%, a difference of 0.11%).
| Demographics | Rating | Rank | 2 or more Vehicles in Household |
| Delaware | 99.4 /100 | #79 | Exceptional 58.2% |
| Immigrants | England | 99.3 /100 | #80 | Exceptional 58.1% |
| Immigrants | Iraq | 99.3 /100 | #81 | Exceptional 58.1% |
| Iranians | 99.3 /100 | #82 | Exceptional 58.1% |
| Icelanders | 99.2 /100 | #83 | Exceptional 58.0% |
| Maltese | 99.2 /100 | #84 | Exceptional 58.0% |
| Slovaks | 99.2 /100 | #85 | Exceptional 58.0% |
| Potawatomi | 99.1 /100 | #86 | Exceptional 58.0% |
| Thais | 99.1 /100 | #87 | Exceptional 57.9% |
| Immigrants | Iran | 99.1 /100 | #88 | Exceptional 57.9% |
| Immigrants | Germany | 99.0 /100 | #89 | Exceptional 57.9% |
| Hispanics or Latinos | 99.0 /100 | #90 | Exceptional 57.9% |
| Pakistanis | 99.0 /100 | #91 | Exceptional 57.9% |
| Shoshone | 99.0 /100 | #92 | Exceptional 57.9% |
| Ottawa | 99.0 /100 | #93 | Exceptional 57.9% |