Immigrants from Kenya vs Potawatomi Child Poverty Among Boys Under 16
COMPARE
Immigrants from Kenya
Potawatomi
Child Poverty Among Boys Under 16
Child Poverty Among Boys Under 16 Comparison
Immigrants from Kenya
Potawatomi
17.1%
CHILD POVERTY AMONG BOYS UNDER 16
20.1/ 100
METRIC RATING
197th/ 347
METRIC RANK
19.4%
CHILD POVERTY AMONG BOYS UNDER 16
0.2/ 100
METRIC RATING
258th/ 347
METRIC RANK
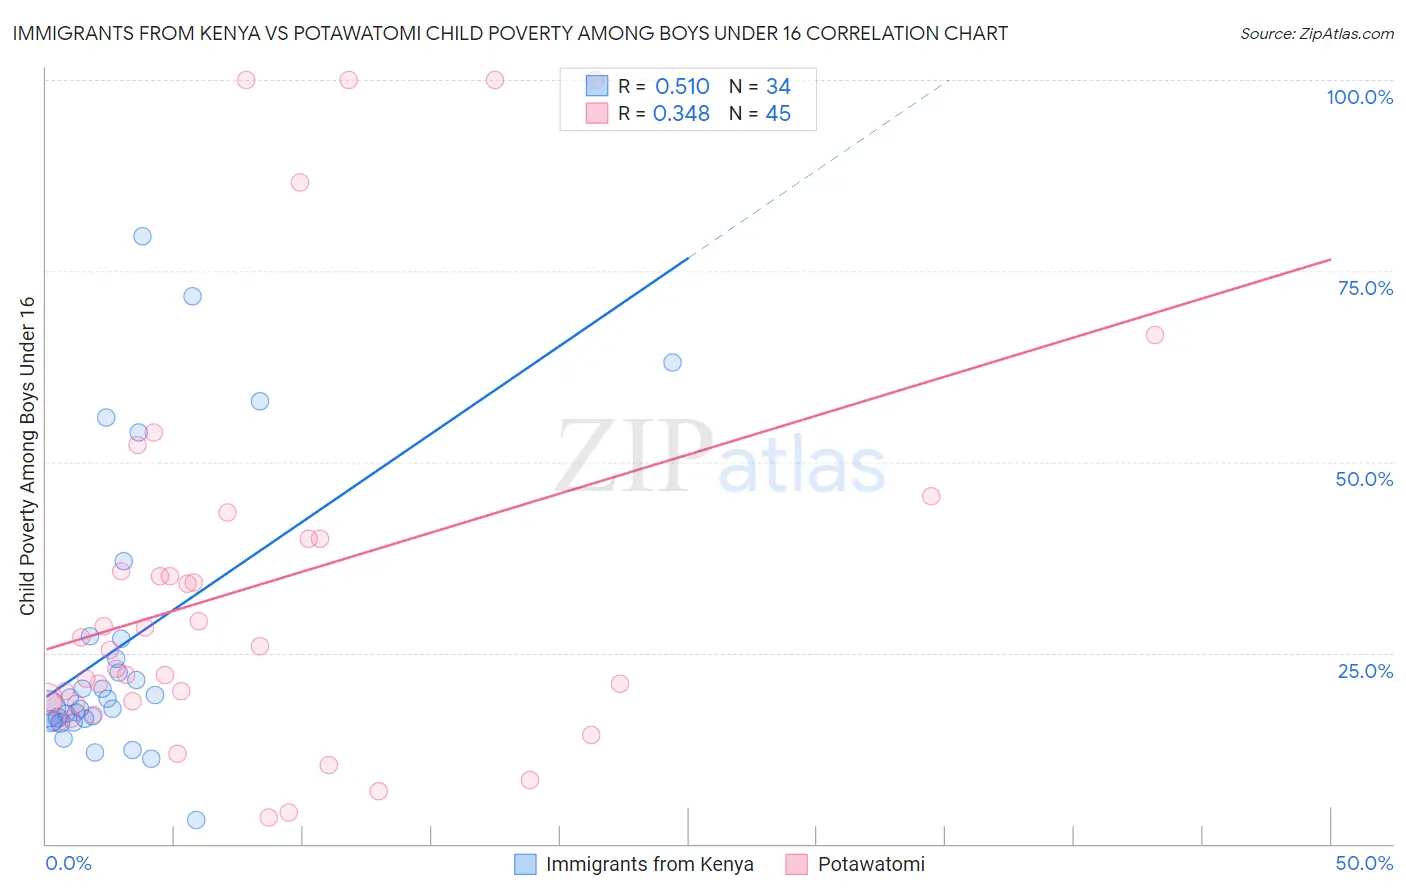
Immigrants from Kenya vs Potawatomi Child Poverty Among Boys Under 16 Correlation Chart
The statistical analysis conducted on geographies consisting of 216,714,978 people shows a substantial positive correlation between the proportion of Immigrants from Kenya and poverty level among boys under the age of 16 in the United States with a correlation coefficient (R) of 0.510 and weighted average of 17.1%. Similarly, the statistical analysis conducted on geographies consisting of 117,214,140 people shows a mild positive correlation between the proportion of Potawatomi and poverty level among boys under the age of 16 in the United States with a correlation coefficient (R) of 0.348 and weighted average of 19.4%, a difference of 13.5%.
Child Poverty Among Boys Under 16 Correlation Summary
| Measurement | Immigrants from Kenya | Potawatomi |
| Minimum | 3.0% | 3.5% |
| Maximum | 79.6% | 100.0% |
| Range | 76.5% | 96.5% |
| Mean | 26.2% | 33.8% |
| Median | 18.3% | 25.4% |
| Interquartile 25% (IQ1) | 16.1% | 18.4% |
| Interquartile 75% (IQ3) | 26.8% | 40.0% |
| Interquartile Range (IQR) | 10.7% | 21.6% |
| Standard Deviation (Sample) | 18.8% | 26.3% |
| Standard Deviation (Population) | 18.5% | 26.0% |
Similar Demographics by Child Poverty Among Boys Under 16
Demographics Similar to Immigrants from Kenya by Child Poverty Among Boys Under 16
In terms of child poverty among boys under 16, the demographic groups most similar to Immigrants from Kenya are Spaniard (17.1%, a difference of 0.060%), Spanish (17.0%, a difference of 0.11%), Immigrants from Lebanon (17.0%, a difference of 0.18%), Immigrants from Cameroon (17.1%, a difference of 0.19%), and Delaware (17.1%, a difference of 0.23%).
| Demographics | Rating | Rank | Child Poverty Among Boys Under 16 |
| Arabs | 31.1 /100 | #190 | Fair 16.8% |
| Alaska Natives | 29.8 /100 | #191 | Fair 16.8% |
| Immigrants | Uganda | 21.6 /100 | #192 | Fair 17.0% |
| Immigrants | Iraq | 21.6 /100 | #193 | Fair 17.0% |
| Immigrants | Lebanon | 21.2 /100 | #194 | Fair 17.0% |
| Spanish | 20.8 /100 | #195 | Fair 17.0% |
| Spaniards | 20.5 /100 | #196 | Fair 17.1% |
| Immigrants | Kenya | 20.1 /100 | #197 | Fair 17.1% |
| Immigrants | Cameroon | 19.0 /100 | #198 | Poor 17.1% |
| Delaware | 18.8 /100 | #199 | Poor 17.1% |
| Immigrants | Uruguay | 16.9 /100 | #200 | Poor 17.2% |
| Immigrants | Afghanistan | 13.7 /100 | #201 | Poor 17.3% |
| Immigrants | Sierra Leone | 13.4 /100 | #202 | Poor 17.3% |
| Immigrants | Uzbekistan | 13.3 /100 | #203 | Poor 17.3% |
| Ugandans | 12.5 /100 | #204 | Poor 17.3% |
Demographics Similar to Potawatomi by Child Poverty Among Boys Under 16
In terms of child poverty among boys under 16, the demographic groups most similar to Potawatomi are Mexican American Indian (19.4%, a difference of 0.020%), Spanish American (19.4%, a difference of 0.020%), Shoshone (19.4%, a difference of 0.12%), Immigrants from Ghana (19.4%, a difference of 0.13%), and Immigrants from Liberia (19.3%, a difference of 0.22%).
| Demographics | Rating | Rank | Child Poverty Among Boys Under 16 |
| French American Indians | 0.2 /100 | #251 | Tragic 19.2% |
| Immigrants | Western Africa | 0.2 /100 | #252 | Tragic 19.3% |
| Liberians | 0.2 /100 | #253 | Tragic 19.3% |
| Trinidadians and Tobagonians | 0.2 /100 | #254 | Tragic 19.3% |
| Ecuadorians | 0.2 /100 | #255 | Tragic 19.3% |
| Immigrants | Liberia | 0.2 /100 | #256 | Tragic 19.3% |
| Mexican American Indians | 0.2 /100 | #257 | Tragic 19.4% |
| Potawatomi | 0.2 /100 | #258 | Tragic 19.4% |
| Spanish Americans | 0.2 /100 | #259 | Tragic 19.4% |
| Shoshone | 0.2 /100 | #260 | Tragic 19.4% |
| Immigrants | Ghana | 0.2 /100 | #261 | Tragic 19.4% |
| Immigrants | Guyana | 0.1 /100 | #262 | Tragic 19.5% |
| Ottawa | 0.1 /100 | #263 | Tragic 19.5% |
| Iroquois | 0.1 /100 | #264 | Tragic 19.6% |
| Guyanese | 0.1 /100 | #265 | Tragic 19.6% |