Immigrants from Japan vs Immigrants from Netherlands 4 or more Vehicles in Household
COMPARE
Immigrants from Japan
Immigrants from Netherlands
4 or more Vehicles in Household
4 or more Vehicles in Household Comparison
Immigrants from Japan
Immigrants from Netherlands
6.3%
4 OR MORE VEHICLES IN HOUSEHOLD
43.1/ 100
METRIC RATING
179th/ 347
METRIC RANK
6.6%
4 OR MORE VEHICLES IN HOUSEHOLD
87.8/ 100
METRIC RATING
132nd/ 347
METRIC RANK
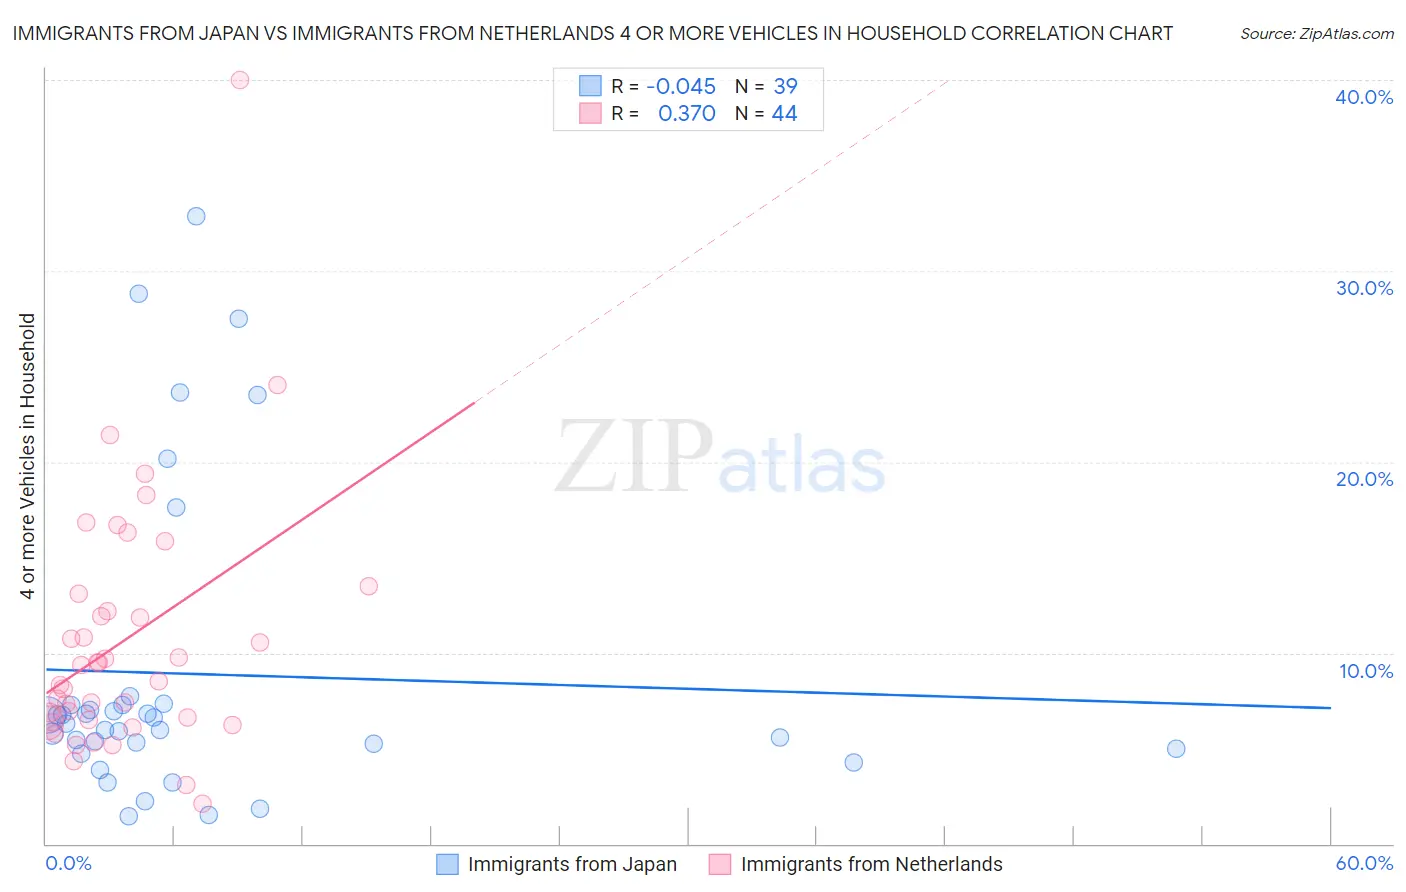
Immigrants from Japan vs Immigrants from Netherlands 4 or more Vehicles in Household Correlation Chart
The statistical analysis conducted on geographies consisting of 338,505,499 people shows no correlation between the proportion of Immigrants from Japan and percentage of households with 4 or more vehicles available in the United States with a correlation coefficient (R) of -0.045 and weighted average of 6.3%. Similarly, the statistical analysis conducted on geographies consisting of 237,226,549 people shows a mild positive correlation between the proportion of Immigrants from Netherlands and percentage of households with 4 or more vehicles available in the United States with a correlation coefficient (R) of 0.370 and weighted average of 6.6%, a difference of 5.8%.
4 or more Vehicles in Household Correlation Summary
| Measurement | Immigrants from Japan | Immigrants from Netherlands |
| Minimum | 1.5% | 2.1% |
| Maximum | 32.8% | 40.0% |
| Range | 31.4% | 37.9% |
| Mean | 8.9% | 10.6% |
| Median | 6.3% | 8.9% |
| Interquartile 25% (IQ1) | 5.0% | 6.4% |
| Interquartile 75% (IQ3) | 7.3% | 12.6% |
| Interquartile Range (IQR) | 2.3% | 6.2% |
| Standard Deviation (Sample) | 8.0% | 6.7% |
| Standard Deviation (Population) | 7.9% | 6.6% |
Similar Demographics by 4 or more Vehicles in Household
Demographics Similar to Immigrants from Japan by 4 or more Vehicles in Household
In terms of 4 or more vehicles in household, the demographic groups most similar to Immigrants from Japan are Syrian (6.3%, a difference of 0.11%), Belizean (6.3%, a difference of 0.15%), Yugoslavian (6.3%, a difference of 0.20%), South American Indian (6.3%, a difference of 0.25%), and Slovak (6.3%, a difference of 0.39%).
| Demographics | Rating | Rank | 4 or more Vehicles in Household |
| Immigrants | Lebanon | 51.7 /100 | #172 | Average 6.3% |
| Slovenes | 51.1 /100 | #173 | Average 6.3% |
| Lithuanians | 50.0 /100 | #174 | Average 6.3% |
| Immigrants | Western Europe | 48.8 /100 | #175 | Average 6.3% |
| Ukrainians | 47.6 /100 | #176 | Average 6.3% |
| Slovaks | 46.9 /100 | #177 | Average 6.3% |
| Belizeans | 44.5 /100 | #178 | Average 6.3% |
| Immigrants | Japan | 43.1 /100 | #179 | Average 6.3% |
| Syrians | 42.0 /100 | #180 | Average 6.3% |
| Yugoslavians | 41.1 /100 | #181 | Average 6.3% |
| South American Indians | 40.7 /100 | #182 | Average 6.3% |
| Immigrants | Burma/Myanmar | 37.5 /100 | #183 | Fair 6.2% |
| Iraqis | 37.3 /100 | #184 | Fair 6.2% |
| Thais | 36.9 /100 | #185 | Fair 6.2% |
| Immigrants | Northern Europe | 36.8 /100 | #186 | Fair 6.2% |
Demographics Similar to Immigrants from Netherlands by 4 or more Vehicles in Household
In terms of 4 or more vehicles in household, the demographic groups most similar to Immigrants from Netherlands are Maltese (6.7%, a difference of 0.14%), Armenian (6.6%, a difference of 0.19%), Ottawa (6.6%, a difference of 0.21%), Tohono O'odham (6.6%, a difference of 0.24%), and Immigrants from Scotland (6.7%, a difference of 0.29%).
| Demographics | Rating | Rank | 4 or more Vehicles in Household |
| Austrians | 94.1 /100 | #125 | Exceptional 6.8% |
| Belgians | 94.1 /100 | #126 | Exceptional 6.8% |
| Immigrants | Korea | 93.8 /100 | #127 | Exceptional 6.8% |
| Immigrants | Bolivia | 92.5 /100 | #128 | Exceptional 6.7% |
| Immigrants | England | 92.0 /100 | #129 | Exceptional 6.7% |
| Immigrants | Scotland | 89.0 /100 | #130 | Excellent 6.7% |
| Maltese | 88.4 /100 | #131 | Excellent 6.7% |
| Immigrants | Netherlands | 87.8 /100 | #132 | Excellent 6.6% |
| Armenians | 86.9 /100 | #133 | Excellent 6.6% |
| Ottawa | 86.9 /100 | #134 | Excellent 6.6% |
| Tohono O'odham | 86.7 /100 | #135 | Excellent 6.6% |
| Luxembourgers | 86.4 /100 | #136 | Excellent 6.6% |
| French Canadians | 85.4 /100 | #137 | Excellent 6.6% |
| Italians | 84.5 /100 | #138 | Excellent 6.6% |
| Jordanians | 82.1 /100 | #139 | Excellent 6.6% |