Immigrants from Greece vs Immigrants from India 2 or more Vehicles in Household
COMPARE
Immigrants from Greece
Immigrants from India
2 or more Vehicles in Household
2 or more Vehicles in Household Comparison
Immigrants from Greece
Immigrants from India
50.2%
2 OR MORE VEHICLES IN HOUSEHOLD
0.0/ 100
METRIC RATING
301st/ 347
METRIC RANK
59.3%
2 OR MORE VEHICLES IN HOUSEHOLD
99.9/ 100
METRIC RATING
48th/ 347
METRIC RANK
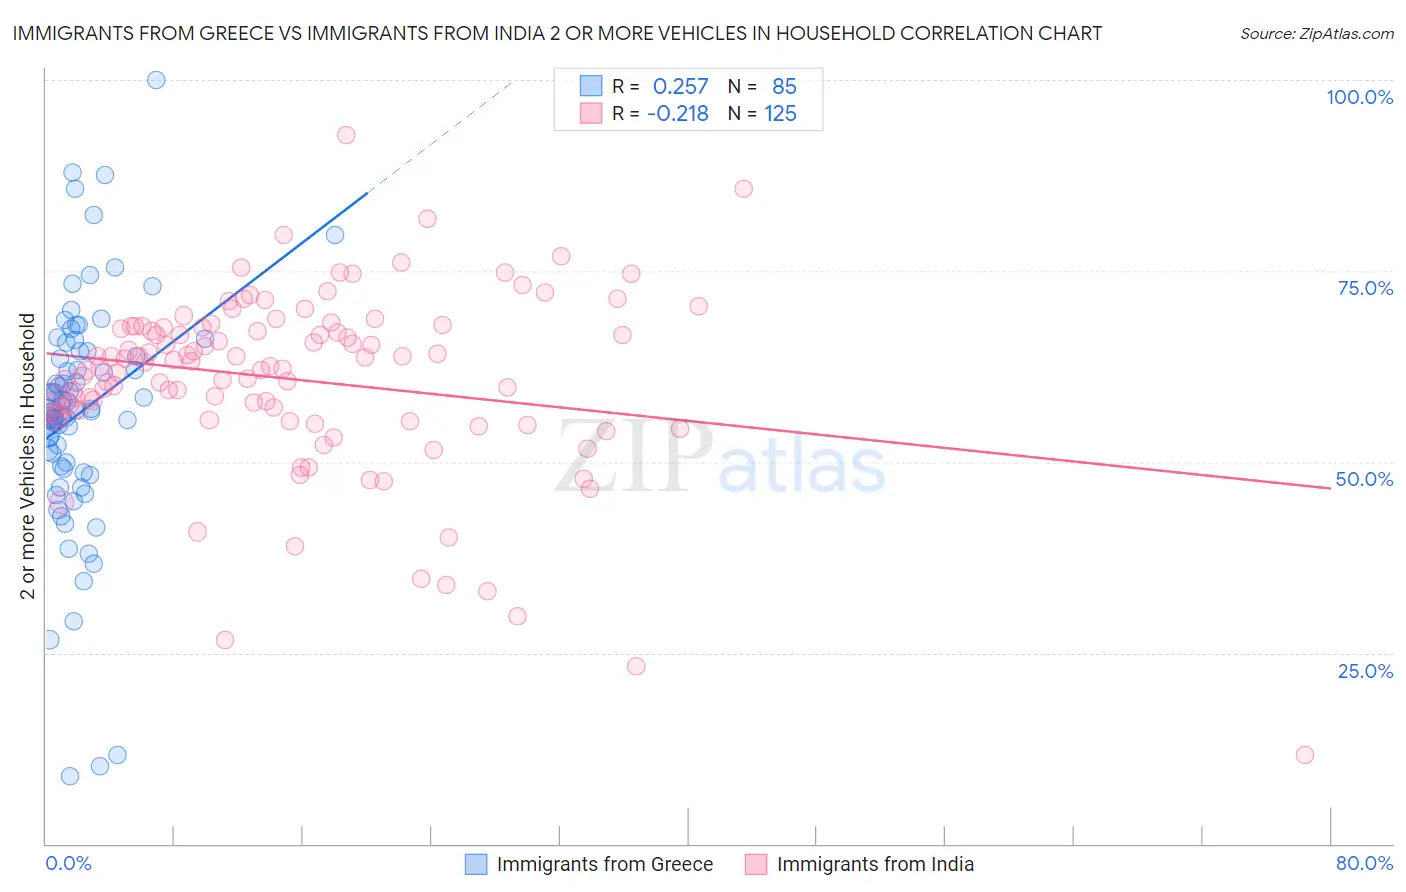
Immigrants from Greece vs Immigrants from India 2 or more Vehicles in Household Correlation Chart
The statistical analysis conducted on geographies consisting of 216,819,966 people shows a weak positive correlation between the proportion of Immigrants from Greece and percentage of households with 2 or more vehicles available in the United States with a correlation coefficient (R) of 0.257 and weighted average of 50.2%. Similarly, the statistical analysis conducted on geographies consisting of 433,787,530 people shows a weak negative correlation between the proportion of Immigrants from India and percentage of households with 2 or more vehicles available in the United States with a correlation coefficient (R) of -0.218 and weighted average of 59.3%, a difference of 18.1%.
2 or more Vehicles in Household Correlation Summary
| Measurement | Immigrants from Greece | Immigrants from India |
| Minimum | 8.9% | 11.6% |
| Maximum | 100.0% | 92.9% |
| Range | 91.1% | 81.2% |
| Mean | 56.4% | 60.8% |
| Median | 56.7% | 63.0% |
| Interquartile 25% (IQ1) | 49.3% | 55.9% |
| Interquartile 75% (IQ3) | 64.5% | 67.7% |
| Interquartile Range (IQR) | 15.2% | 11.7% |
| Standard Deviation (Sample) | 15.5% | 12.0% |
| Standard Deviation (Population) | 15.4% | 12.0% |
Similar Demographics by 2 or more Vehicles in Household
Demographics Similar to Immigrants from Greece by 2 or more Vehicles in Household
In terms of 2 or more vehicles in household, the demographic groups most similar to Immigrants from Greece are Immigrants from South America (50.2%, a difference of 0.060%), Immigrants from Russia (50.3%, a difference of 0.18%), Immigrants from Morocco (50.3%, a difference of 0.22%), Paraguayan (50.3%, a difference of 0.25%), and Immigrants from Spain (50.4%, a difference of 0.38%).
| Demographics | Rating | Rank | 2 or more Vehicles in Household |
| Bermudans | 0.0 /100 | #294 | Tragic 50.6% |
| Cypriots | 0.0 /100 | #295 | Tragic 50.6% |
| Immigrants | Somalia | 0.0 /100 | #296 | Tragic 50.5% |
| Immigrants | Spain | 0.0 /100 | #297 | Tragic 50.4% |
| Paraguayans | 0.0 /100 | #298 | Tragic 50.3% |
| Immigrants | Morocco | 0.0 /100 | #299 | Tragic 50.3% |
| Immigrants | Russia | 0.0 /100 | #300 | Tragic 50.3% |
| Immigrants | Greece | 0.0 /100 | #301 | Tragic 50.2% |
| Immigrants | South America | 0.0 /100 | #302 | Tragic 50.2% |
| Tohono O'odham | 0.0 /100 | #303 | Tragic 50.0% |
| Immigrants | Belize | 0.0 /100 | #304 | Tragic 49.9% |
| Immigrants | Western Africa | 0.0 /100 | #305 | Tragic 49.4% |
| Immigrants | Israel | 0.0 /100 | #306 | Tragic 49.2% |
| Hopi | 0.0 /100 | #307 | Tragic 49.0% |
| Albanians | 0.0 /100 | #308 | Tragic 49.0% |
Demographics Similar to Immigrants from India by 2 or more Vehicles in Household
In terms of 2 or more vehicles in household, the demographic groups most similar to Immigrants from India are Yaqui (59.3%, a difference of 0.020%), Belgian (59.3%, a difference of 0.040%), Choctaw (59.3%, a difference of 0.040%), Spaniard (59.2%, a difference of 0.18%), and Immigrants from Laos (59.2%, a difference of 0.19%).
| Demographics | Rating | Rank | 2 or more Vehicles in Household |
| Northern Europeans | 100.0 /100 | #41 | Exceptional 59.9% |
| Malaysians | 100.0 /100 | #42 | Exceptional 59.8% |
| Czechoslovakians | 100.0 /100 | #43 | Exceptional 59.8% |
| French | 100.0 /100 | #44 | Exceptional 59.8% |
| Immigrants | Taiwan | 100.0 /100 | #45 | Exceptional 59.7% |
| Immigrants | South Eastern Asia | 100.0 /100 | #46 | Exceptional 59.6% |
| Yaqui | 99.9 /100 | #47 | Exceptional 59.3% |
| Immigrants | India | 99.9 /100 | #48 | Exceptional 59.3% |
| Belgians | 99.9 /100 | #49 | Exceptional 59.3% |
| Choctaw | 99.9 /100 | #50 | Exceptional 59.3% |
| Spaniards | 99.9 /100 | #51 | Exceptional 59.2% |
| Immigrants | Laos | 99.9 /100 | #52 | Exceptional 59.2% |
| Celtics | 99.9 /100 | #53 | Exceptional 59.2% |
| Bhutanese | 99.9 /100 | #54 | Exceptional 59.1% |
| Luxembourgers | 99.9 /100 | #55 | Exceptional 59.1% |