Immigrants from Ghana vs Immigrants from Brazil No Vehicles in Household
COMPARE
Immigrants from Ghana
Immigrants from Brazil
No Vehicles in Household
No Vehicles in Household Comparison
Immigrants from Ghana
Immigrants from Brazil
16.6%
NO VEHICLES IN HOUSEHOLD
0.0/ 100
METRIC RATING
317th/ 347
METRIC RANK
10.8%
NO VEHICLES IN HOUSEHOLD
26.3/ 100
METRIC RATING
195th/ 347
METRIC RANK
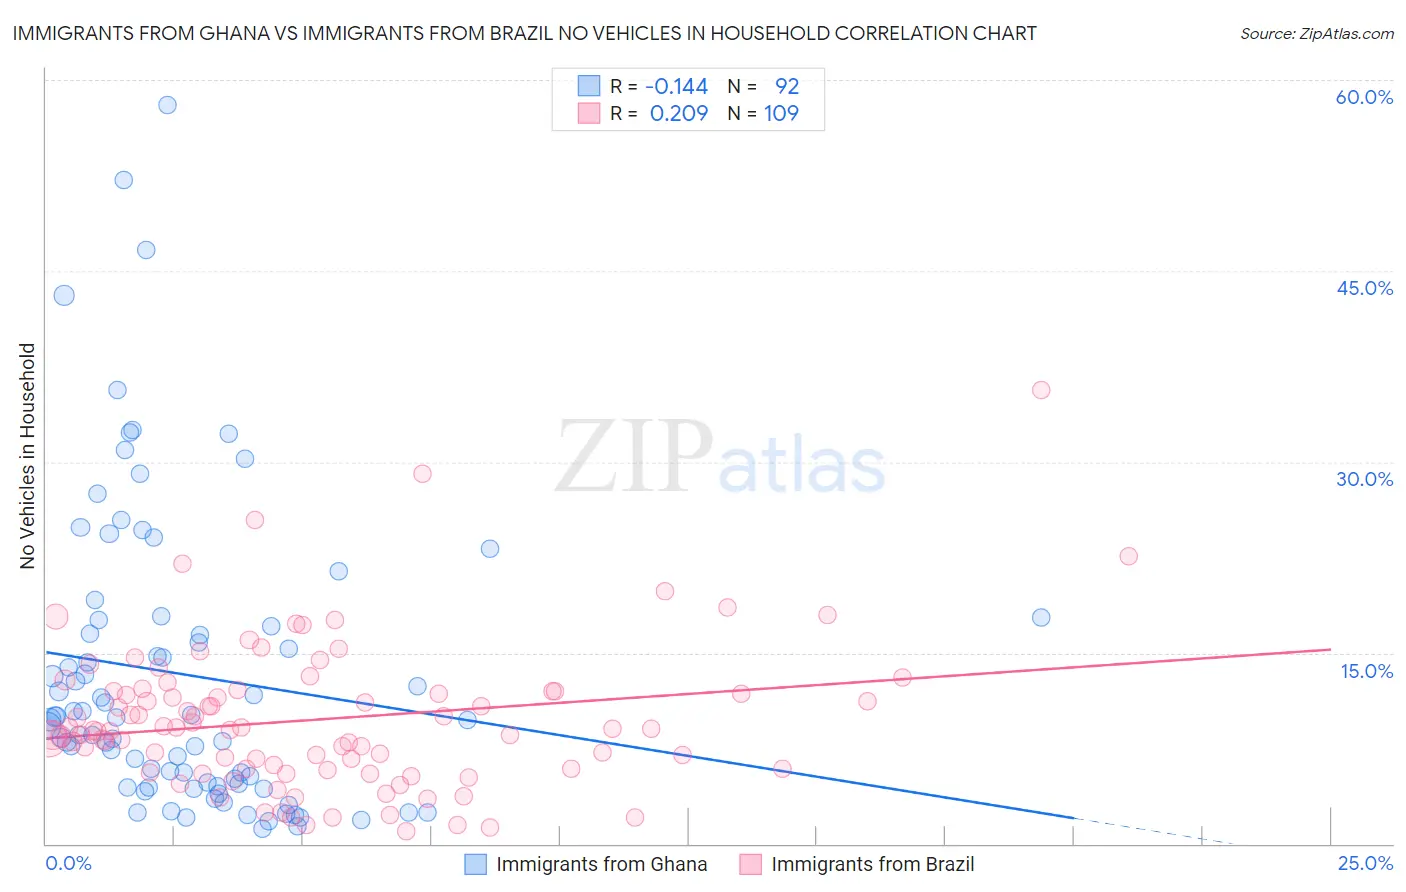
Immigrants from Ghana vs Immigrants from Brazil No Vehicles in Household Correlation Chart
The statistical analysis conducted on geographies consisting of 199,471,025 people shows a poor negative correlation between the proportion of Immigrants from Ghana and percentage of households with no vehicle available in the United States with a correlation coefficient (R) of -0.144 and weighted average of 16.6%. Similarly, the statistical analysis conducted on geographies consisting of 341,931,543 people shows a weak positive correlation between the proportion of Immigrants from Brazil and percentage of households with no vehicle available in the United States with a correlation coefficient (R) of 0.209 and weighted average of 10.8%, a difference of 54.2%.
No Vehicles in Household Correlation Summary
| Measurement | Immigrants from Ghana | Immigrants from Brazil |
| Minimum | 1.2% | 0.95% |
| Maximum | 58.0% | 35.7% |
| Range | 56.8% | 34.7% |
| Mean | 13.3% | 9.8% |
| Median | 9.8% | 8.9% |
| Interquartile 25% (IQ1) | 4.6% | 5.9% |
| Interquartile 75% (IQ3) | 17.3% | 12.0% |
| Interquartile Range (IQR) | 12.7% | 6.1% |
| Standard Deviation (Sample) | 11.8% | 5.8% |
| Standard Deviation (Population) | 11.7% | 5.8% |
Similar Demographics by No Vehicles in Household
Demographics Similar to Immigrants from Ghana by No Vehicles in Household
In terms of no vehicles in household, the demographic groups most similar to Immigrants from Ghana are Immigrants from Belarus (16.7%, a difference of 0.86%), Ghanaian (16.4%, a difference of 0.95%), Alaska Native (17.4%, a difference of 4.8%), Soviet Union (17.4%, a difference of 5.0%), and Cypriot (15.7%, a difference of 6.0%).
| Demographics | Rating | Rank | No Vehicles in Household |
| Cape Verdeans | 0.0 /100 | #310 | Tragic 15.6% |
| Immigrants | Israel | 0.0 /100 | #311 | Tragic 15.6% |
| Alaskan Athabascans | 0.0 /100 | #312 | Tragic 15.6% |
| Tohono O'odham | 0.0 /100 | #313 | Tragic 15.6% |
| Albanians | 0.0 /100 | #314 | Tragic 15.6% |
| Cypriots | 0.0 /100 | #315 | Tragic 15.7% |
| Ghanaians | 0.0 /100 | #316 | Tragic 16.4% |
| Immigrants | Ghana | 0.0 /100 | #317 | Tragic 16.6% |
| Immigrants | Belarus | 0.0 /100 | #318 | Tragic 16.7% |
| Alaska Natives | 0.0 /100 | #319 | Tragic 17.4% |
| Soviet Union | 0.0 /100 | #320 | Tragic 17.4% |
| Jamaicans | 0.0 /100 | #321 | Tragic 17.9% |
| Immigrants | Cabo Verde | 0.0 /100 | #322 | Tragic 18.4% |
| Immigrants | Yemen | 0.0 /100 | #323 | Tragic 19.5% |
| Immigrants | Caribbean | 0.0 /100 | #324 | Tragic 19.6% |
Demographics Similar to Immigrants from Brazil by No Vehicles in Household
In terms of no vehicles in household, the demographic groups most similar to Immigrants from Brazil are Pueblo (10.8%, a difference of 0.11%), Ukrainian (10.7%, a difference of 0.29%), Central American (10.8%, a difference of 0.34%), Shoshone (10.8%, a difference of 0.38%), and Immigrants from Sweden (10.8%, a difference of 0.59%).
| Demographics | Rating | Rank | No Vehicles in Household |
| Immigrants | Armenia | 37.5 /100 | #188 | Fair 10.6% |
| Immigrants | Eritrea | 36.3 /100 | #189 | Fair 10.6% |
| Immigrants | North Macedonia | 34.6 /100 | #190 | Fair 10.6% |
| Immigrants | Northern Europe | 33.1 /100 | #191 | Fair 10.7% |
| Carpatho Rusyns | 32.1 /100 | #192 | Fair 10.7% |
| Ukrainians | 28.0 /100 | #193 | Fair 10.7% |
| Pueblo | 27.0 /100 | #194 | Fair 10.8% |
| Immigrants | Brazil | 26.3 /100 | #195 | Fair 10.8% |
| Central Americans | 24.3 /100 | #196 | Fair 10.8% |
| Shoshone | 24.1 /100 | #197 | Fair 10.8% |
| Immigrants | Sweden | 22.9 /100 | #198 | Fair 10.8% |
| Immigrants | Asia | 21.3 /100 | #199 | Fair 10.9% |
| Cambodians | 19.6 /100 | #200 | Poor 10.9% |
| Immigrants | Western Europe | 19.1 /100 | #201 | Poor 10.9% |
| Romanians | 17.9 /100 | #202 | Poor 10.9% |