Immigrants from Eritrea vs Chippewa 4 or more Vehicles in Household
COMPARE
Immigrants from Eritrea
Chippewa
4 or more Vehicles in Household
4 or more Vehicles in Household Comparison
Immigrants from Eritrea
Chippewa
5.8%
4 OR MORE VEHICLES IN HOUSEHOLD
4.5/ 100
METRIC RATING
236th/ 347
METRIC RANK
7.6%
4 OR MORE VEHICLES IN HOUSEHOLD
100.0/ 100
METRIC RATING
62nd/ 347
METRIC RANK
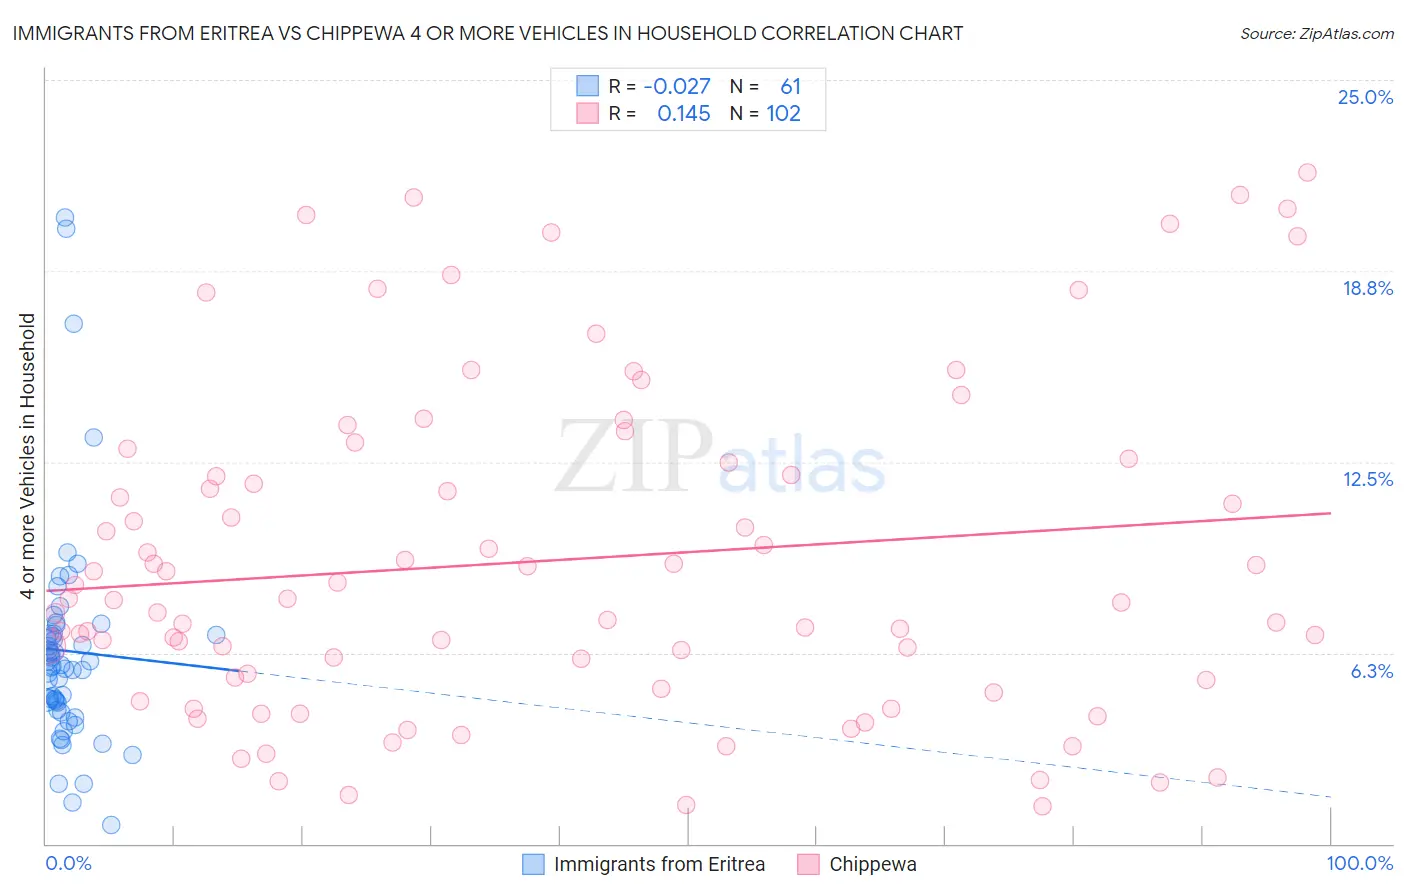
Immigrants from Eritrea vs Chippewa 4 or more Vehicles in Household Correlation Chart
The statistical analysis conducted on geographies consisting of 104,728,093 people shows no correlation between the proportion of Immigrants from Eritrea and percentage of households with 4 or more vehicles available in the United States with a correlation coefficient (R) of -0.027 and weighted average of 5.8%. Similarly, the statistical analysis conducted on geographies consisting of 214,617,305 people shows a poor positive correlation between the proportion of Chippewa and percentage of households with 4 or more vehicles available in the United States with a correlation coefficient (R) of 0.145 and weighted average of 7.6%, a difference of 29.7%.
4 or more Vehicles in Household Correlation Summary
| Measurement | Immigrants from Eritrea | Chippewa |
| Minimum | 0.61% | 1.2% |
| Maximum | 20.5% | 22.0% |
| Range | 19.9% | 20.8% |
| Mean | 6.3% | 9.3% |
| Median | 5.8% | 8.0% |
| Interquartile 25% (IQ1) | 4.5% | 5.4% |
| Interquartile 75% (IQ3) | 6.9% | 12.5% |
| Interquartile Range (IQR) | 2.4% | 7.1% |
| Standard Deviation (Sample) | 3.6% | 5.3% |
| Standard Deviation (Population) | 3.6% | 5.3% |
Similar Demographics by 4 or more Vehicles in Household
Demographics Similar to Immigrants from Eritrea by 4 or more Vehicles in Household
In terms of 4 or more vehicles in household, the demographic groups most similar to Immigrants from Eritrea are Immigrants from Hungary (5.8%, a difference of 0.010%), African (5.8%, a difference of 0.030%), Turkish (5.8%, a difference of 0.27%), Immigrants from Belgium (5.8%, a difference of 0.40%), and Immigrants from Australia (5.8%, a difference of 0.49%).
| Demographics | Rating | Rank | 4 or more Vehicles in Household |
| Eastern Europeans | 6.8 /100 | #229 | Tragic 5.9% |
| Immigrants | Malaysia | 6.7 /100 | #230 | Tragic 5.9% |
| Immigrants | Switzerland | 6.4 /100 | #231 | Tragic 5.9% |
| Immigrants | Argentina | 6.0 /100 | #232 | Tragic 5.9% |
| Sierra Leoneans | 6.0 /100 | #233 | Tragic 5.9% |
| Africans | 4.6 /100 | #234 | Tragic 5.8% |
| Immigrants | Hungary | 4.6 /100 | #235 | Tragic 5.8% |
| Immigrants | Eritrea | 4.5 /100 | #236 | Tragic 5.8% |
| Turks | 4.1 /100 | #237 | Tragic 5.8% |
| Immigrants | Belgium | 4.0 /100 | #238 | Tragic 5.8% |
| Immigrants | Australia | 3.8 /100 | #239 | Tragic 5.8% |
| Immigrants | Poland | 3.8 /100 | #240 | Tragic 5.8% |
| Mongolians | 3.7 /100 | #241 | Tragic 5.8% |
| Immigrants | Middle Africa | 3.4 /100 | #242 | Tragic 5.8% |
| Immigrants | Czechoslovakia | 3.2 /100 | #243 | Tragic 5.8% |
Demographics Similar to Chippewa by 4 or more Vehicles in Household
In terms of 4 or more vehicles in household, the demographic groups most similar to Chippewa are Immigrants from Micronesia (7.6%, a difference of 0.010%), Bangladeshi (7.6%, a difference of 0.25%), European (7.6%, a difference of 0.26%), Immigrants from the Azores (7.5%, a difference of 0.29%), and Spaniard (7.6%, a difference of 0.52%).
| Demographics | Rating | Rank | 4 or more Vehicles in Household |
| Immigrants | Oceania | 100.0 /100 | #55 | Exceptional 7.6% |
| English | 100.0 /100 | #56 | Exceptional 7.6% |
| Pennsylvania Germans | 100.0 /100 | #57 | Exceptional 7.6% |
| Swedes | 100.0 /100 | #58 | Exceptional 7.6% |
| Hispanics or Latinos | 100.0 /100 | #59 | Exceptional 7.6% |
| Spaniards | 100.0 /100 | #60 | Exceptional 7.6% |
| Europeans | 100.0 /100 | #61 | Exceptional 7.6% |
| Chippewa | 100.0 /100 | #62 | Exceptional 7.6% |
| Immigrants | Micronesia | 100.0 /100 | #63 | Exceptional 7.6% |
| Bangladeshis | 100.0 /100 | #64 | Exceptional 7.6% |
| Immigrants | Azores | 100.0 /100 | #65 | Exceptional 7.5% |
| Immigrants | Taiwan | 99.9 /100 | #66 | Exceptional 7.5% |
| Americans | 99.9 /100 | #67 | Exceptional 7.5% |
| Welsh | 99.9 /100 | #68 | Exceptional 7.5% |
| Germans | 99.9 /100 | #69 | Exceptional 7.5% |