Immigrants from Eastern Africa vs Immigrants from Poland 3 or more Vehicles in Household
COMPARE
Immigrants from Eastern Africa
Immigrants from Poland
3 or more Vehicles in Household
3 or more Vehicles in Household Comparison
Immigrants from Eastern Africa
Immigrants from Poland
18.0%
3 OR MORE VEHICLES IN HOUSEHOLD
1.8/ 100
METRIC RATING
248th/ 347
METRIC RANK
18.6%
3 OR MORE VEHICLES IN HOUSEHOLD
7.5/ 100
METRIC RATING
221st/ 347
METRIC RANK
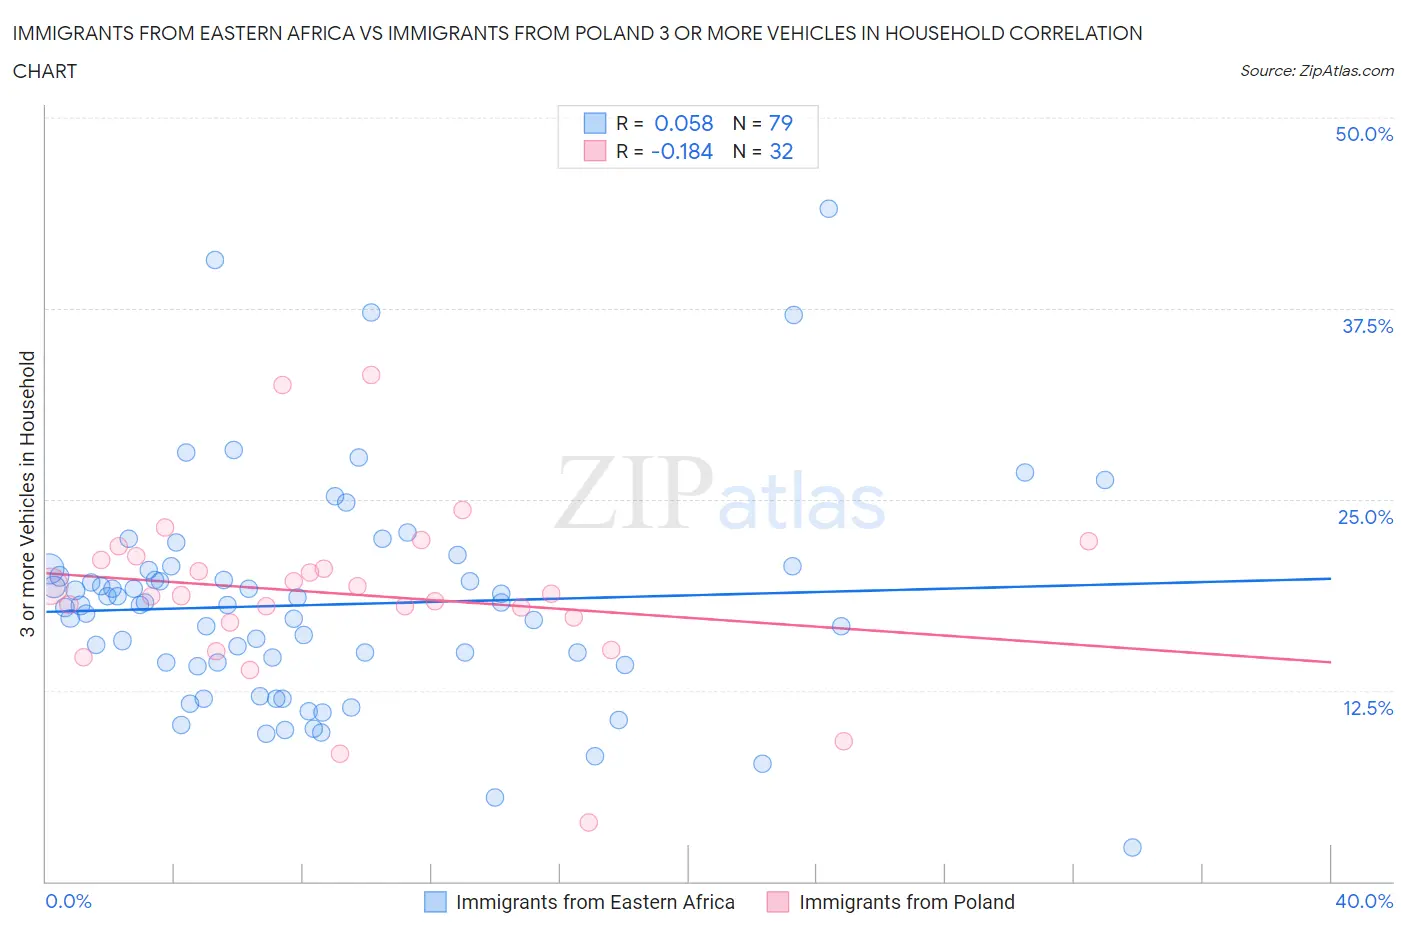
Immigrants from Eastern Africa vs Immigrants from Poland 3 or more Vehicles in Household Correlation Chart
The statistical analysis conducted on geographies consisting of 354,834,893 people shows a slight positive correlation between the proportion of Immigrants from Eastern Africa and percentage of households with 3 or more vehicles available in the United States with a correlation coefficient (R) of 0.058 and weighted average of 18.0%. Similarly, the statistical analysis conducted on geographies consisting of 304,731,133 people shows a poor negative correlation between the proportion of Immigrants from Poland and percentage of households with 3 or more vehicles available in the United States with a correlation coefficient (R) of -0.184 and weighted average of 18.6%, a difference of 3.1%.
3 or more Vehicles in Household Correlation Summary
| Measurement | Immigrants from Eastern Africa | Immigrants from Poland |
| Minimum | 2.2% | 3.8% |
| Maximum | 44.0% | 33.1% |
| Range | 41.8% | 29.3% |
| Mean | 18.1% | 18.8% |
| Median | 18.1% | 18.8% |
| Interquartile 25% (IQ1) | 14.1% | 17.1% |
| Interquartile 75% (IQ3) | 20.4% | 21.2% |
| Interquartile Range (IQR) | 6.3% | 4.0% |
| Standard Deviation (Sample) | 7.2% | 5.7% |
| Standard Deviation (Population) | 7.2% | 5.6% |
Similar Demographics by 3 or more Vehicles in Household
Demographics Similar to Immigrants from Eastern Africa by 3 or more Vehicles in Household
In terms of 3 or more vehicles in household, the demographic groups most similar to Immigrants from Eastern Africa are Immigrants from Saudi Arabia (18.0%, a difference of 0.060%), Venezuelan (18.0%, a difference of 0.080%), Carpatho Rusyn (18.0%, a difference of 0.13%), Alsatian (18.0%, a difference of 0.28%), and Immigrants from Australia (18.1%, a difference of 0.29%).
| Demographics | Rating | Rank | 3 or more Vehicles in Household |
| Africans | 2.7 /100 | #241 | Tragic 18.2% |
| Hopi | 2.5 /100 | #242 | Tragic 18.2% |
| Immigrants | Europe | 2.4 /100 | #243 | Tragic 18.1% |
| Mongolians | 2.3 /100 | #244 | Tragic 18.1% |
| Immigrants | Belize | 2.1 /100 | #245 | Tragic 18.1% |
| Immigrants | Australia | 2.0 /100 | #246 | Tragic 18.1% |
| Carpatho Rusyns | 1.9 /100 | #247 | Tragic 18.0% |
| Immigrants | Eastern Africa | 1.8 /100 | #248 | Tragic 18.0% |
| Immigrants | Saudi Arabia | 1.7 /100 | #249 | Tragic 18.0% |
| Venezuelans | 1.7 /100 | #250 | Tragic 18.0% |
| Alsatians | 1.5 /100 | #251 | Tragic 18.0% |
| Immigrants | Southern Europe | 1.4 /100 | #252 | Tragic 17.9% |
| Immigrants | Ethiopia | 1.3 /100 | #253 | Tragic 17.9% |
| Ethiopians | 1.2 /100 | #254 | Tragic 17.9% |
| Immigrants | Turkey | 1.2 /100 | #255 | Tragic 17.9% |
Demographics Similar to Immigrants from Poland by 3 or more Vehicles in Household
In terms of 3 or more vehicles in household, the demographic groups most similar to Immigrants from Poland are Belizean (18.6%, a difference of 0.050%), Nigerian (18.6%, a difference of 0.090%), Immigrants from Armenia (18.6%, a difference of 0.29%), Immigrants from Portugal (18.6%, a difference of 0.37%), and Immigrants from Czechoslovakia (18.5%, a difference of 0.52%).
| Demographics | Rating | Rank | 3 or more Vehicles in Household |
| Immigrants | Sierra Leone | 10.8 /100 | #214 | Poor 18.7% |
| Eastern Europeans | 10.6 /100 | #215 | Poor 18.7% |
| Immigrants | Nigeria | 10.3 /100 | #216 | Poor 18.7% |
| Immigrants | Italy | 10.2 /100 | #217 | Poor 18.7% |
| Immigrants | Portugal | 8.9 /100 | #218 | Tragic 18.6% |
| Immigrants | Armenia | 8.6 /100 | #219 | Tragic 18.6% |
| Nigerians | 7.9 /100 | #220 | Tragic 18.6% |
| Immigrants | Poland | 7.5 /100 | #221 | Tragic 18.6% |
| Belizeans | 7.3 /100 | #222 | Tragic 18.6% |
| Immigrants | Czechoslovakia | 5.9 /100 | #223 | Tragic 18.5% |
| Immigrants | Argentina | 5.6 /100 | #224 | Tragic 18.5% |
| Immigrants | Lithuania | 5.6 /100 | #225 | Tragic 18.5% |
| Immigrants | Hungary | 5.5 /100 | #226 | Tragic 18.5% |
| Immigrants | Singapore | 5.4 /100 | #227 | Tragic 18.4% |
| Turks | 5.4 /100 | #228 | Tragic 18.4% |