Immigrants from Caribbean vs Immigrants from Czechoslovakia 4 or more Vehicles in Household
COMPARE
Immigrants from Caribbean
Immigrants from Czechoslovakia
4 or more Vehicles in Household
4 or more Vehicles in Household Comparison
Immigrants from Caribbean
Immigrants from Czechoslovakia
4.4%
4 OR MORE VEHICLES IN HOUSEHOLD
0.0/ 100
METRIC RATING
323rd/ 347
METRIC RANK
5.8%
4 OR MORE VEHICLES IN HOUSEHOLD
3.2/ 100
METRIC RATING
243rd/ 347
METRIC RANK
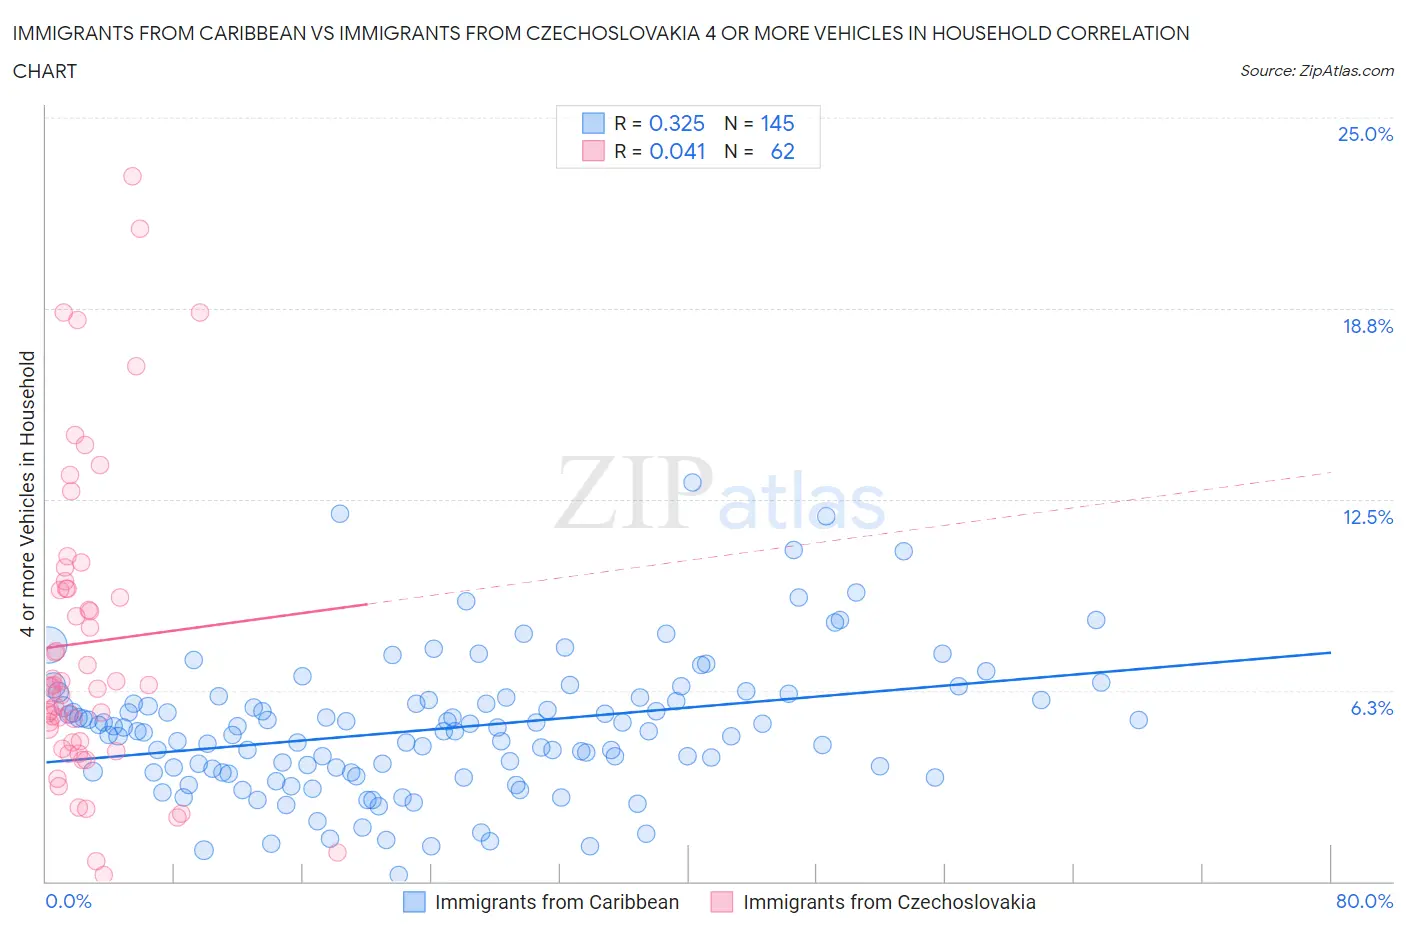
Immigrants from Caribbean vs Immigrants from Czechoslovakia 4 or more Vehicles in Household Correlation Chart
The statistical analysis conducted on geographies consisting of 447,619,354 people shows a mild positive correlation between the proportion of Immigrants from Caribbean and percentage of households with 4 or more vehicles available in the United States with a correlation coefficient (R) of 0.325 and weighted average of 4.4%. Similarly, the statistical analysis conducted on geographies consisting of 194,652,046 people shows no correlation between the proportion of Immigrants from Czechoslovakia and percentage of households with 4 or more vehicles available in the United States with a correlation coefficient (R) of 0.041 and weighted average of 5.8%, a difference of 30.2%.
4 or more Vehicles in Household Correlation Summary
| Measurement | Immigrants from Caribbean | Immigrants from Czechoslovakia |
| Minimum | 0.20% | 0.19% |
| Maximum | 13.0% | 23.1% |
| Range | 12.8% | 22.9% |
| Mean | 5.0% | 7.8% |
| Median | 4.9% | 6.4% |
| Interquartile 25% (IQ1) | 3.6% | 4.5% |
| Interquartile 75% (IQ3) | 5.9% | 9.6% |
| Interquartile Range (IQR) | 2.4% | 5.1% |
| Standard Deviation (Sample) | 2.2% | 5.1% |
| Standard Deviation (Population) | 2.2% | 5.0% |
Similar Demographics by 4 or more Vehicles in Household
Demographics Similar to Immigrants from Caribbean by 4 or more Vehicles in Household
In terms of 4 or more vehicles in household, the demographic groups most similar to Immigrants from Caribbean are Soviet Union (4.4%, a difference of 0.28%), Immigrants from Yemen (4.5%, a difference of 0.40%), Ecuadorian (4.5%, a difference of 0.58%), Immigrants from Jamaica (4.4%, a difference of 0.60%), and Cape Verdean (4.4%, a difference of 0.92%).
| Demographics | Rating | Rank | 4 or more Vehicles in Household |
| Puerto Ricans | 0.0 /100 | #316 | Tragic 4.7% |
| U.S. Virgin Islanders | 0.0 /100 | #317 | Tragic 4.6% |
| Jamaicans | 0.0 /100 | #318 | Tragic 4.6% |
| Haitians | 0.0 /100 | #319 | Tragic 4.6% |
| Immigrants | Haiti | 0.0 /100 | #320 | Tragic 4.5% |
| Ecuadorians | 0.0 /100 | #321 | Tragic 4.5% |
| Immigrants | Yemen | 0.0 /100 | #322 | Tragic 4.5% |
| Immigrants | Caribbean | 0.0 /100 | #323 | Tragic 4.4% |
| Soviet Union | 0.0 /100 | #324 | Tragic 4.4% |
| Immigrants | Jamaica | 0.0 /100 | #325 | Tragic 4.4% |
| Cape Verdeans | 0.0 /100 | #326 | Tragic 4.4% |
| Senegalese | 0.0 /100 | #327 | Tragic 4.3% |
| Trinidadians and Tobagonians | 0.0 /100 | #328 | Tragic 4.3% |
| Immigrants | Senegal | 0.0 /100 | #329 | Tragic 4.2% |
| Immigrants | Ecuador | 0.0 /100 | #330 | Tragic 4.2% |
Demographics Similar to Immigrants from Czechoslovakia by 4 or more Vehicles in Household
In terms of 4 or more vehicles in household, the demographic groups most similar to Immigrants from Czechoslovakia are Ethiopian (5.8%, a difference of 0.010%), Bulgarian (5.8%, a difference of 0.050%), Immigrants from Middle Africa (5.8%, a difference of 0.19%), Mongolian (5.8%, a difference of 0.40%), and Immigrants from Poland (5.8%, a difference of 0.49%).
| Demographics | Rating | Rank | 4 or more Vehicles in Household |
| Immigrants | Eritrea | 4.5 /100 | #236 | Tragic 5.8% |
| Turks | 4.1 /100 | #237 | Tragic 5.8% |
| Immigrants | Belgium | 4.0 /100 | #238 | Tragic 5.8% |
| Immigrants | Australia | 3.8 /100 | #239 | Tragic 5.8% |
| Immigrants | Poland | 3.8 /100 | #240 | Tragic 5.8% |
| Mongolians | 3.7 /100 | #241 | Tragic 5.8% |
| Immigrants | Middle Africa | 3.4 /100 | #242 | Tragic 5.8% |
| Immigrants | Czechoslovakia | 3.2 /100 | #243 | Tragic 5.8% |
| Ethiopians | 3.2 /100 | #244 | Tragic 5.8% |
| Bulgarians | 3.1 /100 | #245 | Tragic 5.8% |
| Immigrants | North Macedonia | 2.5 /100 | #246 | Tragic 5.7% |
| Immigrants | Ethiopia | 2.4 /100 | #247 | Tragic 5.7% |
| Immigrants | Eastern Africa | 2.4 /100 | #248 | Tragic 5.7% |
| Immigrants | Southern Europe | 2.3 /100 | #249 | Tragic 5.7% |
| Immigrants | Europe | 2.3 /100 | #250 | Tragic 5.7% |