Immigrants from Bosnia and Herzegovina vs Immigrants from Korea 3 or more Vehicles in Household
COMPARE
Immigrants from Bosnia and Herzegovina
Immigrants from Korea
3 or more Vehicles in Household
3 or more Vehicles in Household Comparison
Immigrants from Bosnia and Herzegovina
Immigrants from Korea
17.5%
3 OR MORE VEHICLES IN HOUSEHOLD
0.5/ 100
METRIC RATING
274th/ 347
METRIC RANK
20.5%
3 OR MORE VEHICLES IN HOUSEHOLD
93.7/ 100
METRIC RATING
123rd/ 347
METRIC RANK
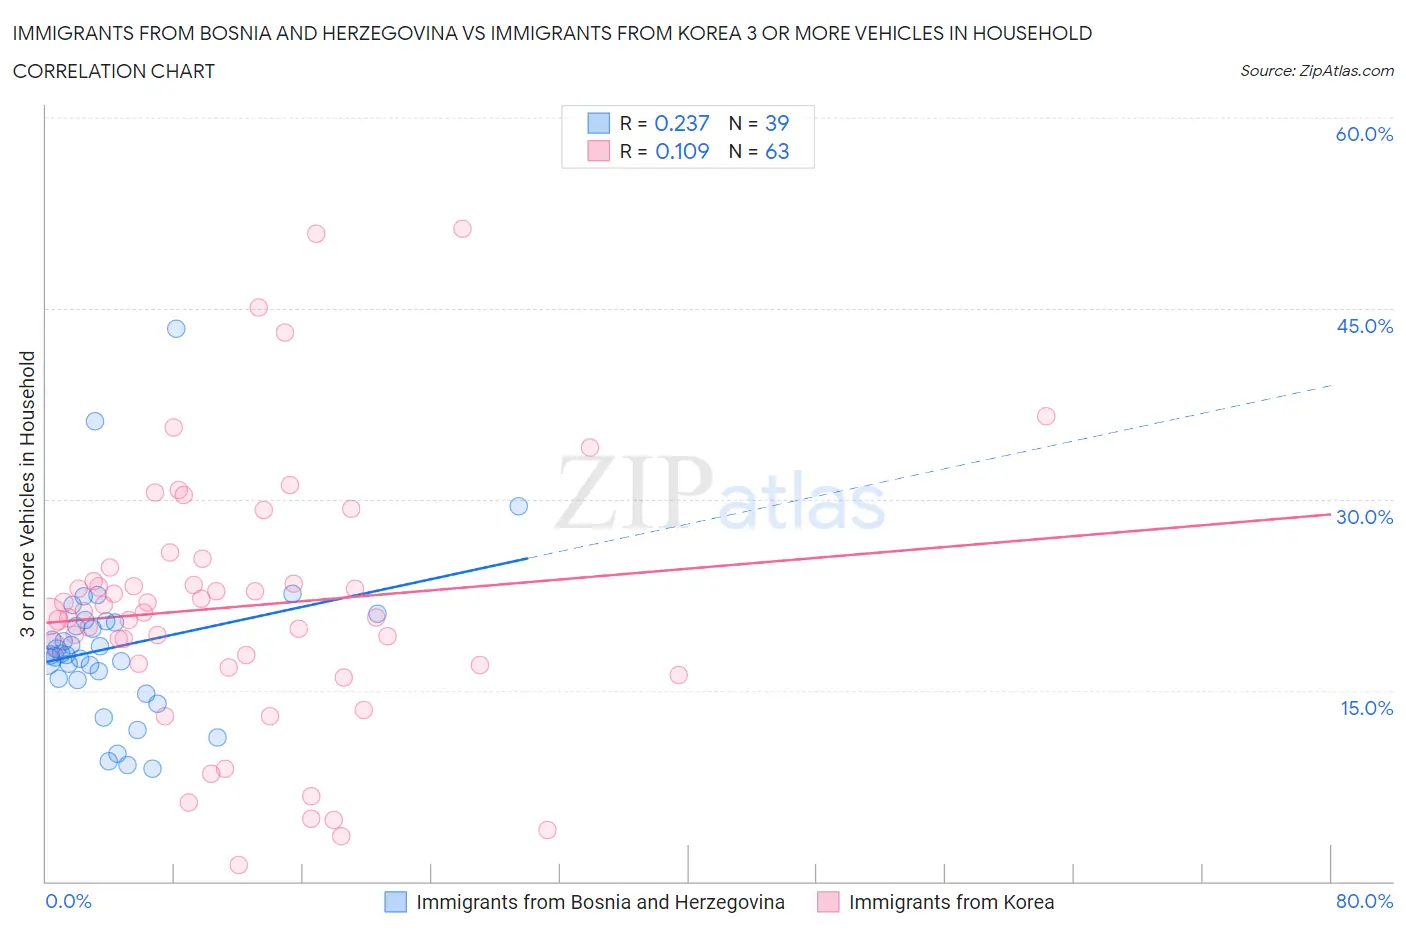
Immigrants from Bosnia and Herzegovina vs Immigrants from Korea 3 or more Vehicles in Household Correlation Chart
The statistical analysis conducted on geographies consisting of 156,800,746 people shows a weak positive correlation between the proportion of Immigrants from Bosnia and Herzegovina and percentage of households with 3 or more vehicles available in the United States with a correlation coefficient (R) of 0.237 and weighted average of 17.5%. Similarly, the statistical analysis conducted on geographies consisting of 415,786,030 people shows a poor positive correlation between the proportion of Immigrants from Korea and percentage of households with 3 or more vehicles available in the United States with a correlation coefficient (R) of 0.109 and weighted average of 20.5%, a difference of 16.9%.
3 or more Vehicles in Household Correlation Summary
| Measurement | Immigrants from Bosnia and Herzegovina | Immigrants from Korea |
| Minimum | 8.8% | 1.2% |
| Maximum | 43.4% | 51.2% |
| Range | 34.6% | 50.0% |
| Mean | 18.5% | 21.6% |
| Median | 17.8% | 21.1% |
| Interquartile 25% (IQ1) | 15.8% | 17.0% |
| Interquartile 75% (IQ3) | 20.4% | 24.6% |
| Interquartile Range (IQR) | 4.7% | 7.6% |
| Standard Deviation (Sample) | 6.6% | 10.3% |
| Standard Deviation (Population) | 6.5% | 10.3% |
Similar Demographics by 3 or more Vehicles in Household
Demographics Similar to Immigrants from Bosnia and Herzegovina by 3 or more Vehicles in Household
In terms of 3 or more vehicles in household, the demographic groups most similar to Immigrants from Bosnia and Herzegovina are Immigrants from Sudan (17.6%, a difference of 0.15%), Immigrants from Africa (17.6%, a difference of 0.18%), Immigrants from Ukraine (17.5%, a difference of 0.29%), Okinawan (17.4%, a difference of 0.45%), and Brazilian (17.4%, a difference of 0.59%).
| Demographics | Rating | Rank | 3 or more Vehicles in Household |
| Immigrants | Venezuela | 0.8 /100 | #267 | Tragic 17.7% |
| Immigrants | Bulgaria | 0.8 /100 | #268 | Tragic 17.7% |
| Immigrants | France | 0.6 /100 | #269 | Tragic 17.6% |
| Immigrants | Nepal | 0.6 /100 | #270 | Tragic 17.6% |
| South Americans | 0.6 /100 | #271 | Tragic 17.6% |
| Immigrants | Africa | 0.5 /100 | #272 | Tragic 17.6% |
| Immigrants | Sudan | 0.5 /100 | #273 | Tragic 17.6% |
| Immigrants | Bosnia and Herzegovina | 0.5 /100 | #274 | Tragic 17.5% |
| Immigrants | Ukraine | 0.4 /100 | #275 | Tragic 17.5% |
| Okinawans | 0.4 /100 | #276 | Tragic 17.4% |
| Brazilians | 0.4 /100 | #277 | Tragic 17.4% |
| Immigrants | Bahamas | 0.3 /100 | #278 | Tragic 17.4% |
| Immigrants | Kazakhstan | 0.3 /100 | #279 | Tragic 17.4% |
| Immigrants | Eastern Europe | 0.3 /100 | #280 | Tragic 17.4% |
| Immigrants | Latvia | 0.3 /100 | #281 | Tragic 17.4% |
Demographics Similar to Immigrants from Korea by 3 or more Vehicles in Household
In terms of 3 or more vehicles in household, the demographic groups most similar to Immigrants from Korea are German Russian (20.5%, a difference of 0.010%), Immigrants from Thailand (20.5%, a difference of 0.050%), Maltese (20.5%, a difference of 0.060%), Central American (20.5%, a difference of 0.17%), and Immigrants from Netherlands (20.4%, a difference of 0.20%).
| Demographics | Rating | Rank | 3 or more Vehicles in Household |
| Italians | 94.9 /100 | #116 | Exceptional 20.6% |
| Croatians | 94.9 /100 | #117 | Exceptional 20.6% |
| Costa Ricans | 94.6 /100 | #118 | Exceptional 20.6% |
| Immigrants | Latin America | 94.5 /100 | #119 | Exceptional 20.5% |
| Maltese | 93.9 /100 | #120 | Exceptional 20.5% |
| Immigrants | Thailand | 93.8 /100 | #121 | Exceptional 20.5% |
| German Russians | 93.7 /100 | #122 | Exceptional 20.5% |
| Immigrants | Korea | 93.7 /100 | #123 | Exceptional 20.5% |
| Central Americans | 93.1 /100 | #124 | Exceptional 20.5% |
| Immigrants | Netherlands | 92.9 /100 | #125 | Exceptional 20.4% |
| Slavs | 92.1 /100 | #126 | Exceptional 20.4% |
| Immigrants | Bolivia | 92.0 /100 | #127 | Exceptional 20.4% |
| New Zealanders | 91.3 /100 | #128 | Exceptional 20.4% |
| Zimbabweans | 88.7 /100 | #129 | Excellent 20.3% |
| Greeks | 88.6 /100 | #130 | Excellent 20.3% |