Immigrants from Austria vs Polish 3 or more Vehicles in Household
COMPARE
Immigrants from Austria
Polish
3 or more Vehicles in Household
3 or more Vehicles in Household Comparison
Immigrants from Austria
Poles
18.9%
3 OR MORE VEHICLES IN HOUSEHOLD
15.4/ 100
METRIC RATING
202nd/ 347
METRIC RANK
20.2%
3 OR MORE VEHICLES IN HOUSEHOLD
87.3/ 100
METRIC RATING
134th/ 347
METRIC RANK
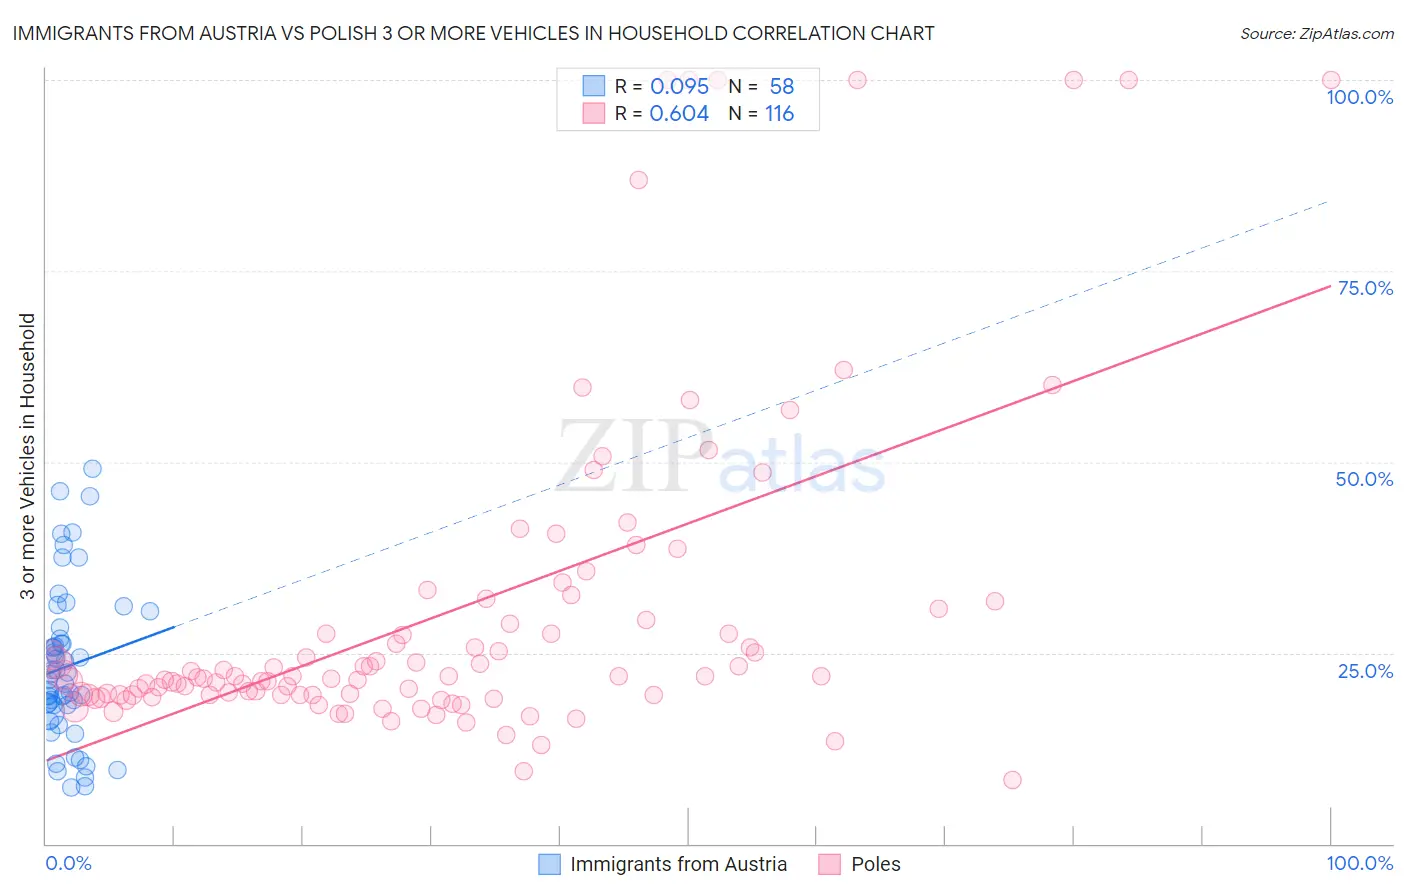
Immigrants from Austria vs Polish 3 or more Vehicles in Household Correlation Chart
The statistical analysis conducted on geographies consisting of 167,924,568 people shows a slight positive correlation between the proportion of Immigrants from Austria and percentage of households with 3 or more vehicles available in the United States with a correlation coefficient (R) of 0.095 and weighted average of 18.9%. Similarly, the statistical analysis conducted on geographies consisting of 559,689,592 people shows a significant positive correlation between the proportion of Poles and percentage of households with 3 or more vehicles available in the United States with a correlation coefficient (R) of 0.604 and weighted average of 20.2%, a difference of 7.1%.
3 or more Vehicles in Household Correlation Summary
| Measurement | Immigrants from Austria | Polish |
| Minimum | 7.4% | 8.4% |
| Maximum | 49.1% | 100.0% |
| Range | 41.7% | 91.6% |
| Mean | 23.2% | 30.3% |
| Median | 21.9% | 21.9% |
| Interquartile 25% (IQ1) | 18.2% | 19.5% |
| Interquartile 75% (IQ3) | 26.9% | 30.0% |
| Interquartile Range (IQR) | 8.7% | 10.6% |
| Standard Deviation (Sample) | 9.9% | 21.4% |
| Standard Deviation (Population) | 9.8% | 21.3% |
Similar Demographics by 3 or more Vehicles in Household
Demographics Similar to Immigrants from Austria by 3 or more Vehicles in Household
In terms of 3 or more vehicles in household, the demographic groups most similar to Immigrants from Austria are Tohono O'odham (18.9%, a difference of 0.090%), Immigrants from Romania (18.9%, a difference of 0.12%), Russian (18.8%, a difference of 0.19%), Immigrants from Eastern Asia (18.8%, a difference of 0.20%), and Immigrants from Chile (18.8%, a difference of 0.28%).
| Demographics | Rating | Rank | 3 or more Vehicles in Household |
| Immigrants | Moldova | 23.6 /100 | #195 | Fair 19.1% |
| Central American Indians | 22.2 /100 | #196 | Fair 19.0% |
| Immigrants | Japan | 22.0 /100 | #197 | Fair 19.0% |
| Egyptians | 19.5 /100 | #198 | Poor 19.0% |
| Immigrants | Norway | 19.0 /100 | #199 | Poor 19.0% |
| Argentineans | 18.2 /100 | #200 | Poor 18.9% |
| Arabs | 17.7 /100 | #201 | Poor 18.9% |
| Immigrants | Austria | 15.4 /100 | #202 | Poor 18.9% |
| Tohono O'odham | 14.8 /100 | #203 | Poor 18.9% |
| Immigrants | Romania | 14.6 /100 | #204 | Poor 18.9% |
| Russians | 14.2 /100 | #205 | Poor 18.8% |
| Immigrants | Eastern Asia | 14.1 /100 | #206 | Poor 18.8% |
| Immigrants | Chile | 13.6 /100 | #207 | Poor 18.8% |
| Immigrants | Burma/Myanmar | 13.6 /100 | #208 | Poor 18.8% |
| Immigrants | Egypt | 13.5 /100 | #209 | Poor 18.8% |
Demographics Similar to Poles by 3 or more Vehicles in Household
In terms of 3 or more vehicles in household, the demographic groups most similar to Poles are Immigrants from India (20.2%, a difference of 0.020%), Immigrants from Nicaragua (20.2%, a difference of 0.030%), Immigrants from Iraq (20.2%, a difference of 0.040%), Immigrants from Canada (20.2%, a difference of 0.090%), and Immigrants from North America (20.2%, a difference of 0.090%).
| Demographics | Rating | Rank | 3 or more Vehicles in Household |
| Immigrants | Bolivia | 92.0 /100 | #127 | Exceptional 20.4% |
| New Zealanders | 91.3 /100 | #128 | Exceptional 20.4% |
| Zimbabweans | 88.7 /100 | #129 | Excellent 20.3% |
| Greeks | 88.6 /100 | #130 | Excellent 20.3% |
| Immigrants | Asia | 88.1 /100 | #131 | Excellent 20.2% |
| Immigrants | Canada | 87.8 /100 | #132 | Excellent 20.2% |
| Immigrants | North America | 87.8 /100 | #133 | Excellent 20.2% |
| Poles | 87.3 /100 | #134 | Excellent 20.2% |
| Immigrants | India | 87.2 /100 | #135 | Excellent 20.2% |
| Immigrants | Nicaragua | 87.1 /100 | #136 | Excellent 20.2% |
| Immigrants | Iraq | 87.1 /100 | #137 | Excellent 20.2% |
| Aleuts | 86.3 /100 | #138 | Excellent 20.2% |
| Slovenes | 85.5 /100 | #139 | Excellent 20.2% |
| French American Indians | 85.3 /100 | #140 | Excellent 20.1% |
| Ottawa | 84.9 /100 | #141 | Excellent 20.1% |