Guyanese vs Immigrants from Saudi Arabia No Vehicles in Household
COMPARE
Guyanese
Immigrants from Saudi Arabia
No Vehicles in Household
No Vehicles in Household Comparison
Guyanese
Immigrants from Saudi Arabia
29.3%
NO VEHICLES IN HOUSEHOLD
0.0/ 100
METRIC RATING
338th/ 347
METRIC RANK
10.3%
NO VEHICLES IN HOUSEHOLD
58.8/ 100
METRIC RATING
167th/ 347
METRIC RANK
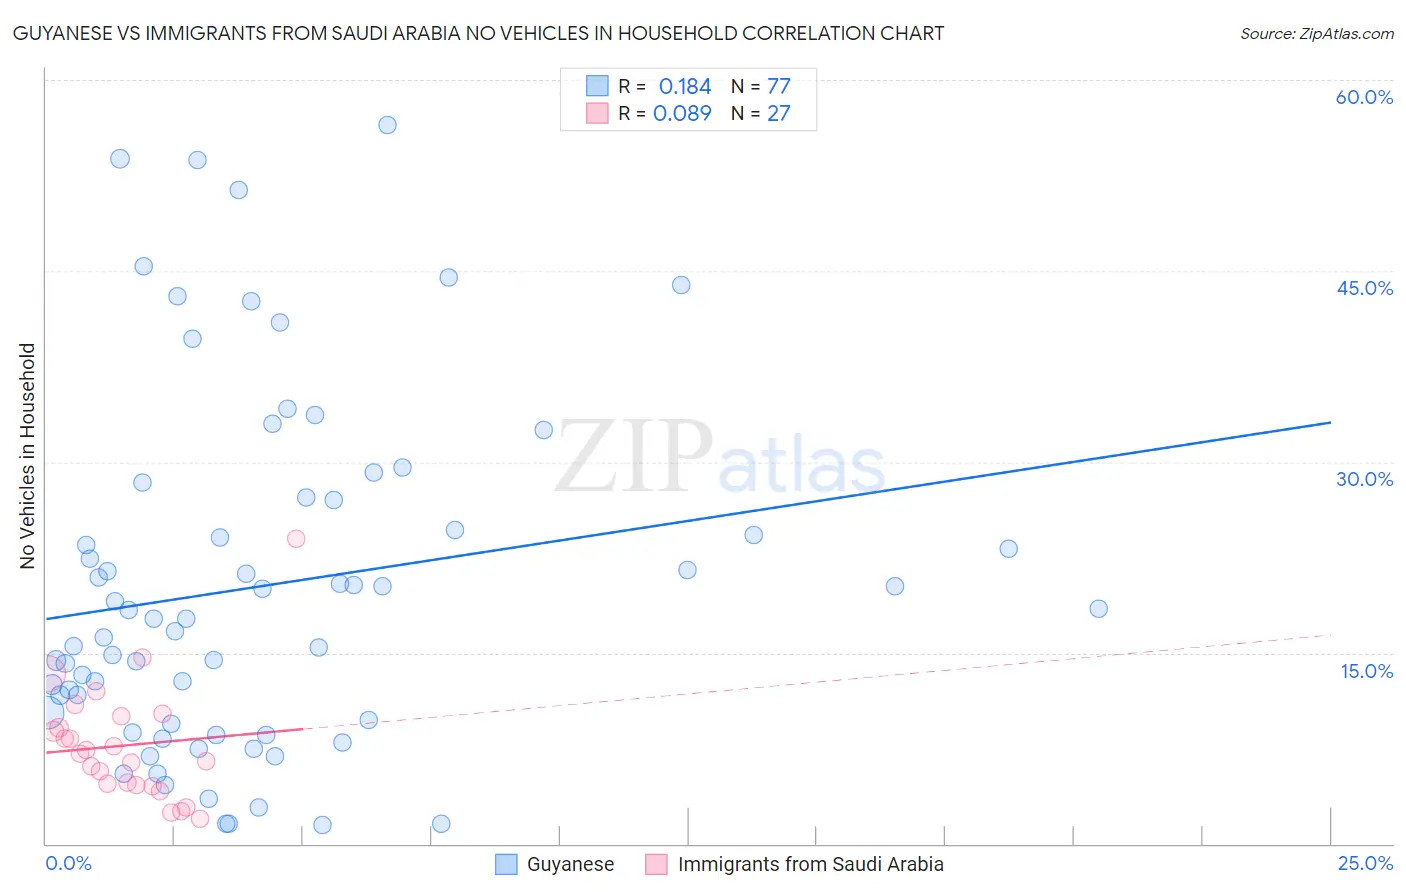
Guyanese vs Immigrants from Saudi Arabia No Vehicles in Household Correlation Chart
The statistical analysis conducted on geographies consisting of 176,563,698 people shows a poor positive correlation between the proportion of Guyanese and percentage of households with no vehicle available in the United States with a correlation coefficient (R) of 0.184 and weighted average of 29.3%. Similarly, the statistical analysis conducted on geographies consisting of 164,171,346 people shows a slight positive correlation between the proportion of Immigrants from Saudi Arabia and percentage of households with no vehicle available in the United States with a correlation coefficient (R) of 0.089 and weighted average of 10.3%, a difference of 185.1%.
No Vehicles in Household Correlation Summary
| Measurement | Guyanese | Immigrants from Saudi Arabia |
| Minimum | 1.4% | 1.9% |
| Maximum | 56.4% | 24.0% |
| Range | 55.0% | 22.0% |
| Mean | 20.3% | 7.7% |
| Median | 17.7% | 7.1% |
| Interquartile 25% (IQ1) | 9.6% | 4.6% |
| Interquartile 75% (IQ3) | 27.1% | 10.0% |
| Interquartile Range (IQR) | 17.6% | 5.4% |
| Standard Deviation (Sample) | 13.7% | 4.6% |
| Standard Deviation (Population) | 13.6% | 4.6% |
Similar Demographics by No Vehicles in Household
Demographics Similar to Guyanese by No Vehicles in Household
In terms of no vehicles in household, the demographic groups most similar to Guyanese are Dominican (29.4%, a difference of 0.36%), Immigrants from Barbados (29.5%, a difference of 0.59%), Immigrants from Guyana (29.5%, a difference of 0.64%), British West Indian (29.7%, a difference of 1.5%), and Inupiat (29.9%, a difference of 1.9%).
| Demographics | Rating | Rank | No Vehicles in Household |
| Trinidadians and Tobagonians | 0.0 /100 | #331 | Tragic 23.7% |
| Immigrants | Ecuador | 0.0 /100 | #332 | Tragic 23.8% |
| Immigrants | Trinidad and Tobago | 0.0 /100 | #333 | Tragic 24.6% |
| Immigrants | Bangladesh | 0.0 /100 | #334 | Tragic 25.8% |
| Barbadians | 0.0 /100 | #335 | Tragic 26.1% |
| Vietnamese | 0.0 /100 | #336 | Tragic 26.2% |
| Immigrants | Uzbekistan | 0.0 /100 | #337 | Tragic 26.7% |
| Guyanese | 0.0 /100 | #338 | Tragic 29.3% |
| Dominicans | 0.0 /100 | #339 | Tragic 29.4% |
| Immigrants | Barbados | 0.0 /100 | #340 | Tragic 29.5% |
| Immigrants | Guyana | 0.0 /100 | #341 | Tragic 29.5% |
| British West Indians | 0.0 /100 | #342 | Tragic 29.7% |
| Inupiat | 0.0 /100 | #343 | Tragic 29.9% |
| Immigrants | Dominican Republic | 0.0 /100 | #344 | Tragic 31.4% |
| Immigrants | St. Vincent and the Grenadines | 0.0 /100 | #345 | Tragic 35.4% |
Demographics Similar to Immigrants from Saudi Arabia by No Vehicles in Household
In terms of no vehicles in household, the demographic groups most similar to Immigrants from Saudi Arabia are Immigrants from Costa Rica (10.3%, a difference of 0.24%), Indonesian (10.3%, a difference of 0.29%), Comanche (10.2%, a difference of 0.30%), South African (10.2%, a difference of 0.34%), and Lumbee (10.3%, a difference of 0.56%).
| Demographics | Rating | Rank | No Vehicles in Household |
| Immigrants | Middle Africa | 65.7 /100 | #160 | Good 10.2% |
| New Zealanders | 65.1 /100 | #161 | Good 10.2% |
| Immigrants | Austria | 64.4 /100 | #162 | Good 10.2% |
| Immigrants | Cambodia | 63.7 /100 | #163 | Good 10.2% |
| South Africans | 61.1 /100 | #164 | Good 10.2% |
| Comanche | 60.8 /100 | #165 | Good 10.2% |
| Immigrants | Costa Rica | 60.5 /100 | #166 | Good 10.3% |
| Immigrants | Saudi Arabia | 58.8 /100 | #167 | Average 10.3% |
| Indonesians | 56.7 /100 | #168 | Average 10.3% |
| Lumbee | 54.7 /100 | #169 | Average 10.3% |
| Immigrants | Latin America | 53.2 /100 | #170 | Average 10.4% |
| Hmong | 52.7 /100 | #171 | Average 10.4% |
| Brazilians | 51.7 /100 | #172 | Average 10.4% |
| Filipinos | 50.1 /100 | #173 | Average 10.4% |
| Immigrants | Sudan | 50.0 /100 | #174 | Average 10.4% |