Black/African American vs Greek No Vehicles in Household
COMPARE
Black/African American
Greek
No Vehicles in Household
No Vehicles in Household Comparison
Blacks/African Americans
Greeks
11.9%
NO VEHICLES IN HOUSEHOLD
1.6/ 100
METRIC RATING
251st/ 347
METRIC RANK
9.5%
NO VEHICLES IN HOUSEHOLD
92.9/ 100
METRIC RATING
118th/ 347
METRIC RANK
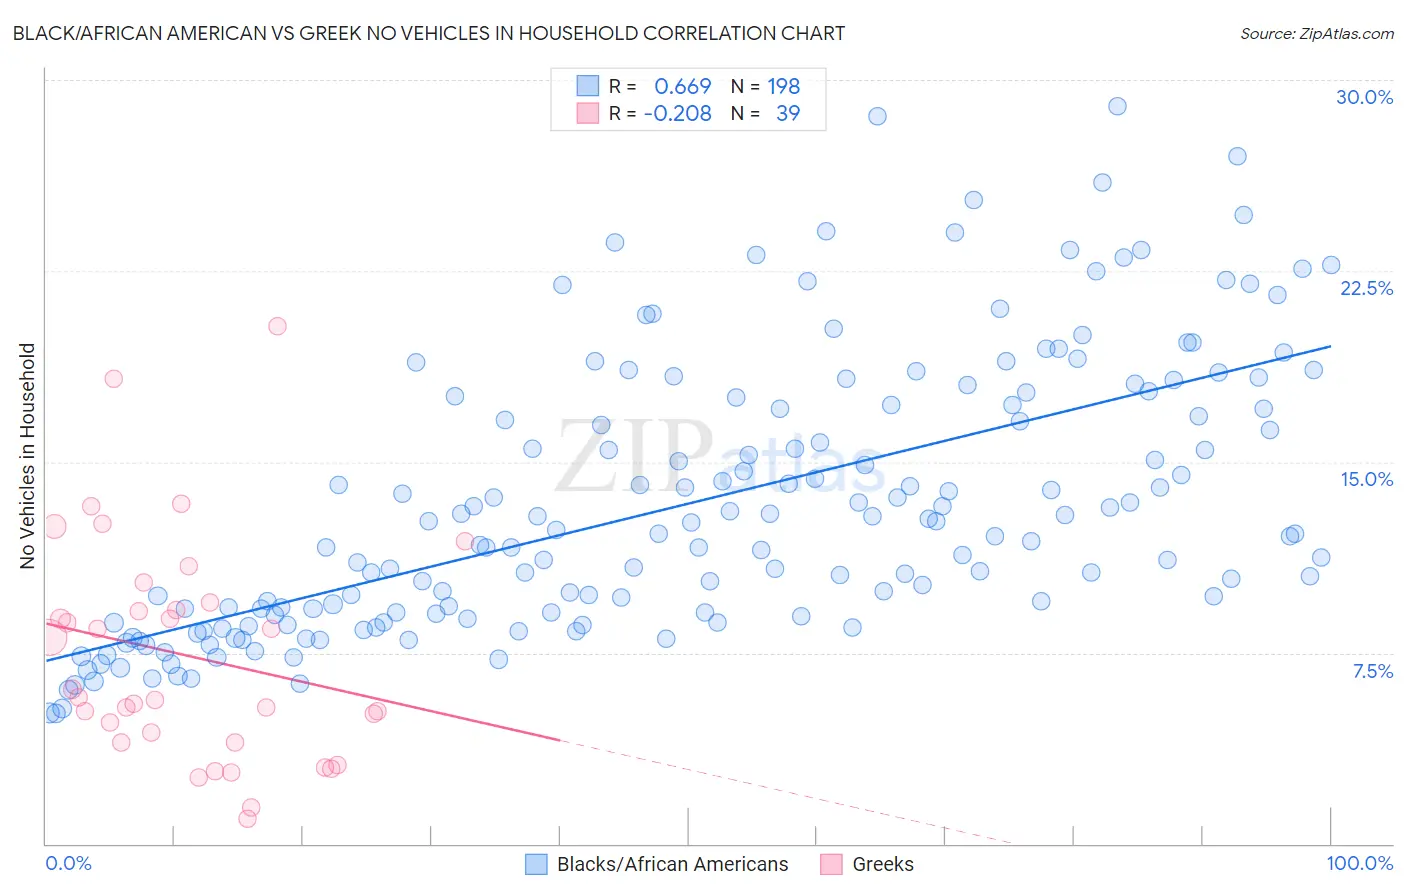
Black/African American vs Greek No Vehicles in Household Correlation Chart
The statistical analysis conducted on geographies consisting of 549,724,013 people shows a significant positive correlation between the proportion of Blacks/African Americans and percentage of households with no vehicle available in the United States with a correlation coefficient (R) of 0.669 and weighted average of 11.9%. Similarly, the statistical analysis conducted on geographies consisting of 480,584,341 people shows a weak negative correlation between the proportion of Greeks and percentage of households with no vehicle available in the United States with a correlation coefficient (R) of -0.208 and weighted average of 9.5%, a difference of 24.8%.
No Vehicles in Household Correlation Summary
| Measurement | Black/African American | Greek |
| Minimum | 5.1% | 1.00% |
| Maximum | 29.0% | 20.3% |
| Range | 23.8% | 19.3% |
| Mean | 13.4% | 7.4% |
| Median | 12.2% | 5.7% |
| Interquartile 25% (IQ1) | 9.1% | 4.0% |
| Interquartile 75% (IQ3) | 17.3% | 9.5% |
| Interquartile Range (IQR) | 8.2% | 5.5% |
| Standard Deviation (Sample) | 5.4% | 4.4% |
| Standard Deviation (Population) | 5.3% | 4.4% |
Similar Demographics by No Vehicles in Household
Demographics Similar to Blacks/African Americans by No Vehicles in Household
In terms of no vehicles in household, the demographic groups most similar to Blacks/African Americans are Immigrants from Serbia (11.9%, a difference of 0.25%), Egyptian (11.9%, a difference of 0.32%), Paiute (11.8%, a difference of 0.35%), Immigrants from Nigeria (11.8%, a difference of 0.57%), and Immigrants from Belgium (11.8%, a difference of 0.60%).
| Demographics | Rating | Rank | No Vehicles in Household |
| Immigrants | Portugal | 2.2 /100 | #244 | Tragic 11.7% |
| Immigrants | Honduras | 2.1 /100 | #245 | Tragic 11.8% |
| Menominee | 2.0 /100 | #246 | Tragic 11.8% |
| Immigrants | Czechoslovakia | 2.0 /100 | #247 | Tragic 11.8% |
| Immigrants | Belgium | 1.9 /100 | #248 | Tragic 11.8% |
| Immigrants | Nigeria | 1.9 /100 | #249 | Tragic 11.8% |
| Paiute | 1.8 /100 | #250 | Tragic 11.8% |
| Blacks/African Americans | 1.6 /100 | #251 | Tragic 11.9% |
| Immigrants | Serbia | 1.5 /100 | #252 | Tragic 11.9% |
| Egyptians | 1.4 /100 | #253 | Tragic 11.9% |
| Immigrants | Uruguay | 1.3 /100 | #254 | Tragic 11.9% |
| Hondurans | 1.2 /100 | #255 | Tragic 12.0% |
| Liberians | 1.2 /100 | #256 | Tragic 12.0% |
| Nigerians | 0.9 /100 | #257 | Tragic 12.1% |
| South American Indians | 0.9 /100 | #258 | Tragic 12.1% |
Demographics Similar to Greeks by No Vehicles in Household
In terms of no vehicles in household, the demographic groups most similar to Greeks are Fijian (9.5%, a difference of 0.11%), Immigrants from Thailand (9.5%, a difference of 0.17%), Puget Sound Salish (9.5%, a difference of 0.27%), Costa Rican (9.5%, a difference of 0.32%), and Chippewa (9.4%, a difference of 0.55%).
| Demographics | Rating | Rank | No Vehicles in Household |
| Immigrants | Kuwait | 95.1 /100 | #111 | Exceptional 9.4% |
| Armenians | 95.0 /100 | #112 | Exceptional 9.4% |
| Immigrants | Netherlands | 94.8 /100 | #113 | Exceptional 9.4% |
| Serbians | 94.3 /100 | #114 | Exceptional 9.4% |
| Navajo | 94.2 /100 | #115 | Exceptional 9.4% |
| Japanese | 94.1 /100 | #116 | Exceptional 9.4% |
| Chippewa | 93.8 /100 | #117 | Exceptional 9.4% |
| Greeks | 92.9 /100 | #118 | Exceptional 9.5% |
| Fijians | 92.7 /100 | #119 | Exceptional 9.5% |
| Immigrants | Thailand | 92.6 /100 | #120 | Exceptional 9.5% |
| Puget Sound Salish | 92.4 /100 | #121 | Exceptional 9.5% |
| Costa Ricans | 92.3 /100 | #122 | Exceptional 9.5% |
| Blackfeet | 91.4 /100 | #123 | Exceptional 9.6% |
| Immigrants | Korea | 90.9 /100 | #124 | Exceptional 9.6% |
| Immigrants | Cameroon | 90.6 /100 | #125 | Exceptional 9.6% |