Zip Codes with the Highest Percentage of Population Employed in Legal Services & Support in Winchester, VA
RELATED REPORTS & OPTIONS
Legal Services & Support
Winchester
Compare Zip Codes
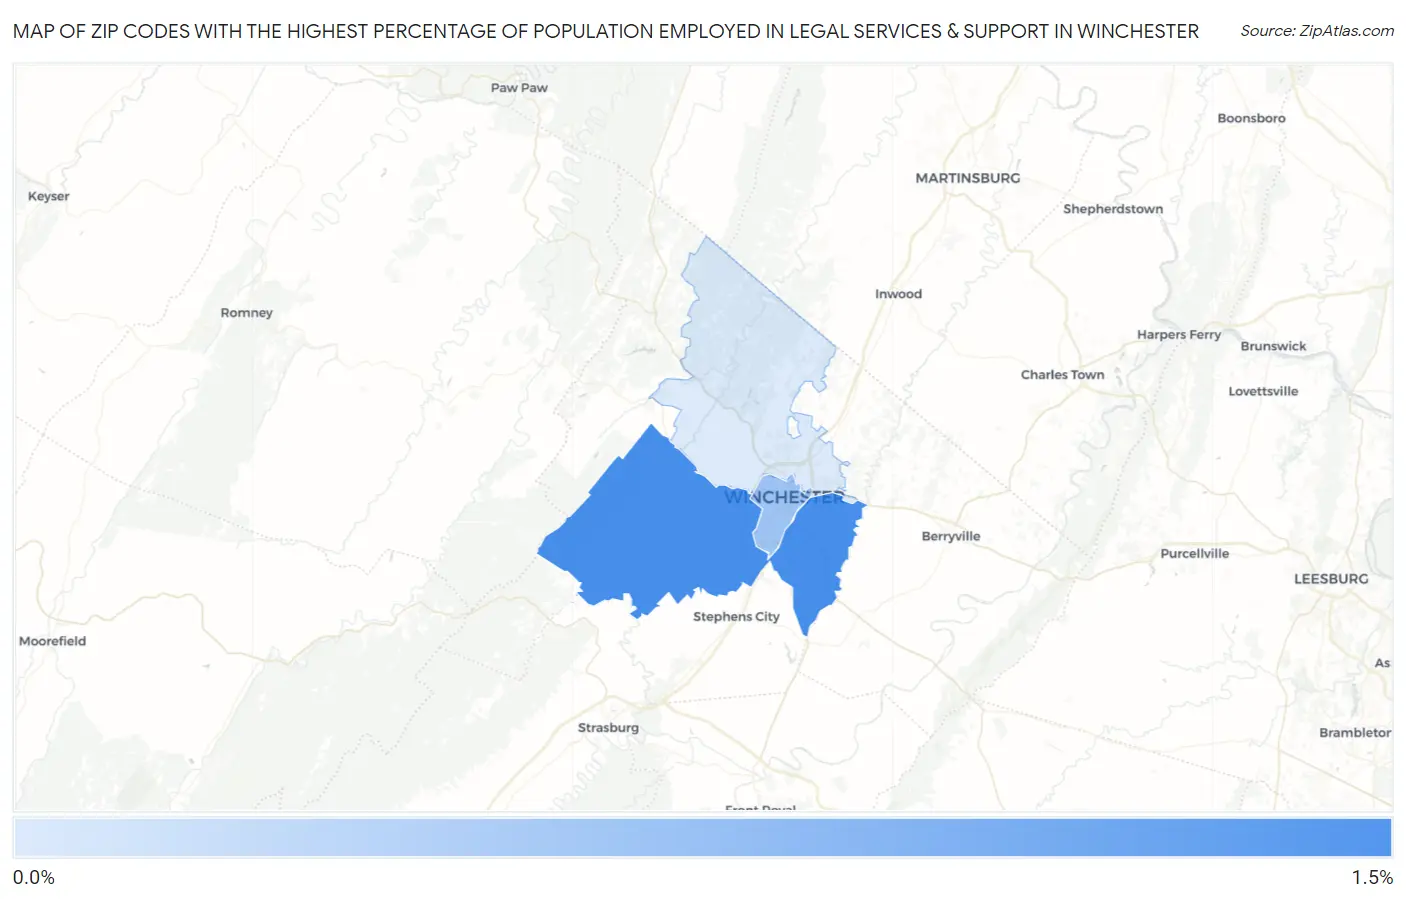
Map of Zip Codes with the Highest Percentage of Population Employed in Legal Services & Support in Winchester
0.31%
1.1%
Zip Codes with the Highest Percentage of Population Employed in Legal Services & Support in Winchester, VA
| Zip Code | % Employed | vs State | vs National | |
| 1. | 22602 | 1.1% | 1.6%(-0.508)#231 | 1.2%(-0.070)#7,060 |
| 2. | 22601 | 0.65% | 1.6%(-0.974)#325 | 1.2%(-0.536)#10,962 |
| 3. | 22603 | 0.31% | 1.6%(-1.31)#405 | 1.2%(-0.870)#14,877 |
1
Common Questions
What are the Top Zip Codes with the Highest Percentage of Population Employed in Legal Services & Support in Winchester, VA?
Top Zip Codes with the Highest Percentage of Population Employed in Legal Services & Support in Winchester, VA are:
What zip code has the Highest Percentage of Population Employed in Legal Services & Support in Winchester, VA?
22602 has the Highest Percentage of Population Employed in Legal Services & Support in Winchester, VA with 1.1%.
What is the Percentage of Population Employed in Legal Services & Support in Winchester, VA?
Percentage of Population Employed in Legal Services & Support in Winchester is 0.68%.
What is the Percentage of Population Employed in Legal Services & Support in Virginia?
Percentage of Population Employed in Legal Services & Support in Virginia is 1.6%.
What is the Percentage of Population Employed in Legal Services & Support in the United States?
Percentage of Population Employed in Legal Services & Support in the United States is 1.2%.