Waverly, VA Map & Demographics
Waverly Map
Waverly Overview
$29,280
PER CAPITA INCOME
$66,522
AVG FAMILY INCOME
$75,000
AVG HOUSEHOLD INCOME
21.9%
WAGE / INCOME GAP [ % ]
78.1¢/ $1
WAGE / INCOME GAP [ $ ]
0.46
INEQUALITY / GINI INDEX
2,890
TOTAL POPULATION
1,516
MALE POPULATION
1,374
FEMALE POPULATION
110.33
MALES / 100 FEMALES
90.63
FEMALES / 100 MALES
34.3
MEDIAN AGE
4.3
AVG FAMILY SIZE
3.1
AVG HOUSEHOLD SIZE
1,353
LABOR FORCE [ PEOPLE ]
61.1%
PERCENT IN LABOR FORCE
9.5%
UNEMPLOYMENT RATE
Waverly Area Codes
Income in Waverly
Income Overview in Waverly
Per Capita Income in Waverly is $29,280, while median incomes of families and households are $66,522 and $75,000 respectively.
| Characteristic | Number | Measure |
| Per Capita Income | 2,890 | $29,280 |
| Median Family Income | 538 | $66,522 |
| Mean Family Income | 538 | $101,566 |
| Median Household Income | 878 | $75,000 |
| Mean Household Income | 878 | $88,696 |
| Income Deficit | 538 | $0 |
| Wage / Income Gap (%) | 2,890 | 21.91% |
| Wage / Income Gap ($) | 2,890 | 78.09¢ per $1 |
| Gini / Inequality Index | 2,890 | 0.46 |
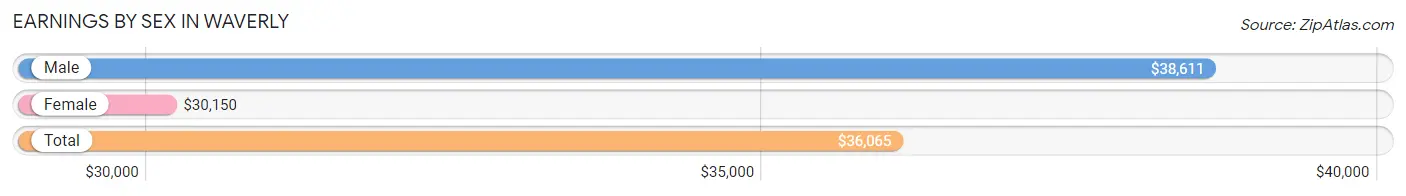
Earnings by Sex in Waverly
Average Earnings in Waverly are $36,065, $38,611 for men and $30,150 for women, a difference of 21.9%.
| Sex | Number | Average Earnings |
| Male | 732 (53.9%) | $38,611 |
| Female | 627 (46.1%) | $30,150 |
| Total | 1,359 (100.0%) | $36,065 |
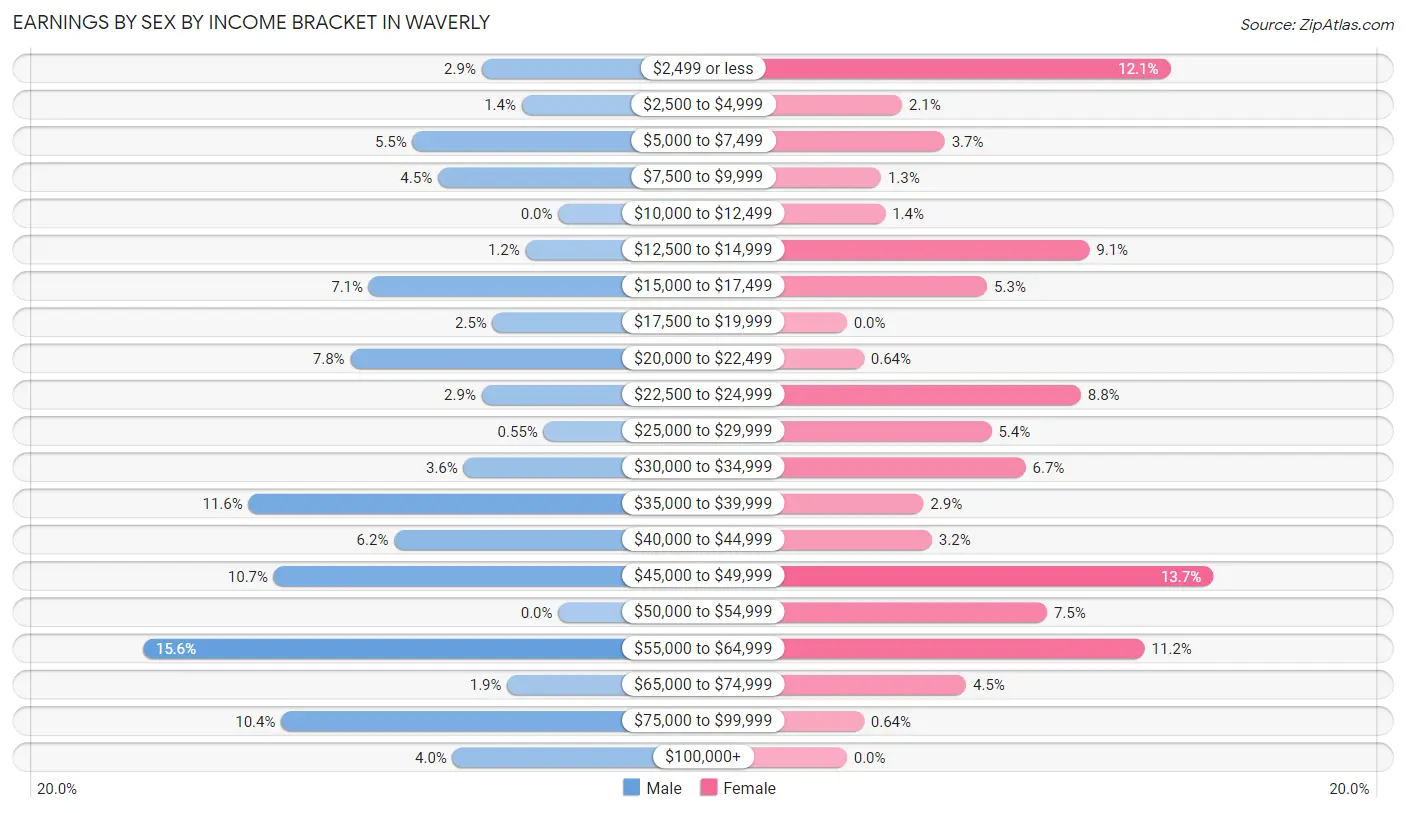
Earnings by Sex by Income Bracket in Waverly
The most common earnings brackets in Waverly are $55,000 to $64,999 for men (114 | 15.6%) and $45,000 to $49,999 for women (86 | 13.7%).
| Income | Male | Female |
| $2,499 or less | 21 (2.9%) | 76 (12.1%) |
| $2,500 to $4,999 | 10 (1.4%) | 13 (2.1%) |
| $5,000 to $7,499 | 40 (5.5%) | 23 (3.7%) |
| $7,500 to $9,999 | 33 (4.5%) | 8 (1.3%) |
| $10,000 to $12,499 | 0 (0.0%) | 9 (1.4%) |
| $12,500 to $14,999 | 9 (1.2%) | 57 (9.1%) |
| $15,000 to $17,499 | 52 (7.1%) | 33 (5.3%) |
| $17,500 to $19,999 | 18 (2.5%) | 0 (0.0%) |
| $20,000 to $22,499 | 57 (7.8%) | 4 (0.6%) |
| $22,500 to $24,999 | 21 (2.9%) | 55 (8.8%) |
| $25,000 to $29,999 | 4 (0.5%) | 34 (5.4%) |
| $30,000 to $34,999 | 26 (3.5%) | 42 (6.7%) |
| $35,000 to $39,999 | 85 (11.6%) | 18 (2.9%) |
| $40,000 to $44,999 | 45 (6.1%) | 20 (3.2%) |
| $45,000 to $49,999 | 78 (10.7%) | 86 (13.7%) |
| $50,000 to $54,999 | 0 (0.0%) | 47 (7.5%) |
| $55,000 to $64,999 | 114 (15.6%) | 70 (11.2%) |
| $65,000 to $74,999 | 14 (1.9%) | 28 (4.5%) |
| $75,000 to $99,999 | 76 (10.4%) | 4 (0.6%) |
| $100,000+ | 29 (4.0%) | 0 (0.0%) |
| Total | 732 (100.0%) | 627 (100.0%) |
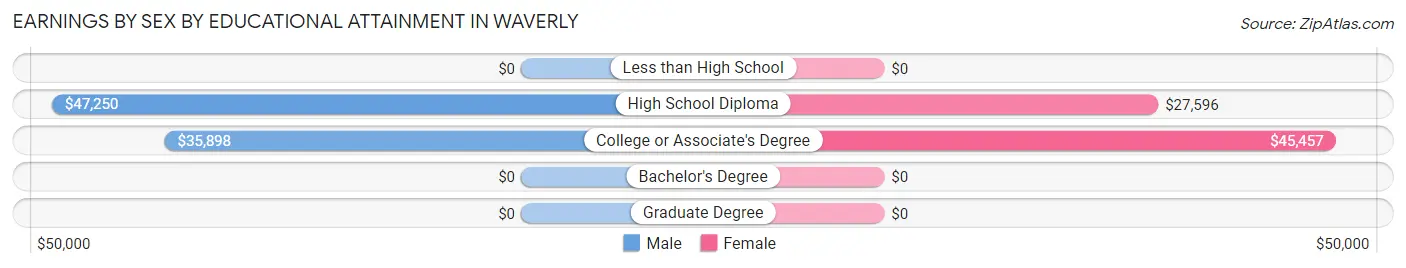
Earnings by Sex by Educational Attainment in Waverly
Average earnings in Waverly are $46,821 for men and $35,089 for women, a difference of 25.1%. Men with an educational attainment of high school diploma enjoy the highest average annual earnings of $47,250, while those with college or associate's degree education earn the least with $35,898. Women with an educational attainment of college or associate's degree earn the most with the average annual earnings of $45,457, while those with high school diploma education have the smallest earnings of $27,596.
| Educational Attainment | Male Income | Female Income |
| Less than High School | - | - |
| High School Diploma | $47,250 | $27,596 |
| College or Associate's Degree | $35,898 | $45,457 |
| Bachelor's Degree | - | - |
| Graduate Degree | - | - |
| Total | $46,821 | $35,089 |
Family Income in Waverly
Family Income Brackets in Waverly
According to the Waverly family income data, there are 136 families falling into the $100,000 to $149,999 income range, which is the most common income bracket and makes up 25.3% of all families. Conversely, the $15,000 to $24,999 income bracket is the least frequent group with only 1 families (0.2%) belonging to this category.
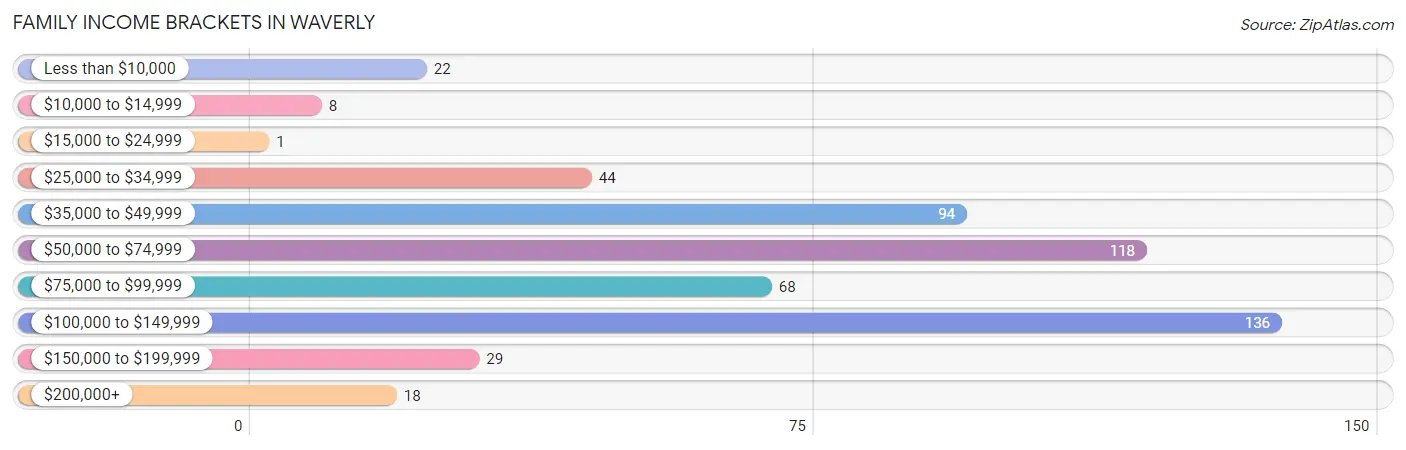
| Income Bracket | # Families | % Families |
| Less than $10,000 | 22 | 4.1% |
| $10,000 to $14,999 | 8 | 1.5% |
| $15,000 to $24,999 | 1 | 0.2% |
| $25,000 to $34,999 | 44 | 8.2% |
| $35,000 to $49,999 | 94 | 17.5% |
| $50,000 to $74,999 | 118 | 21.9% |
| $75,000 to $99,999 | 68 | 12.6% |
| $100,000 to $149,999 | 136 | 25.3% |
| $150,000 to $199,999 | 29 | 5.4% |
| $200,000+ | 18 | 3.3% |
Family Income by Famaliy Size in Waverly
4-person families (110 | 20.4%) account for the highest median family income in Waverly with $102,206 per family, while 2-person families (184 | 34.2%) have the highest median income of $26,875 per family member.
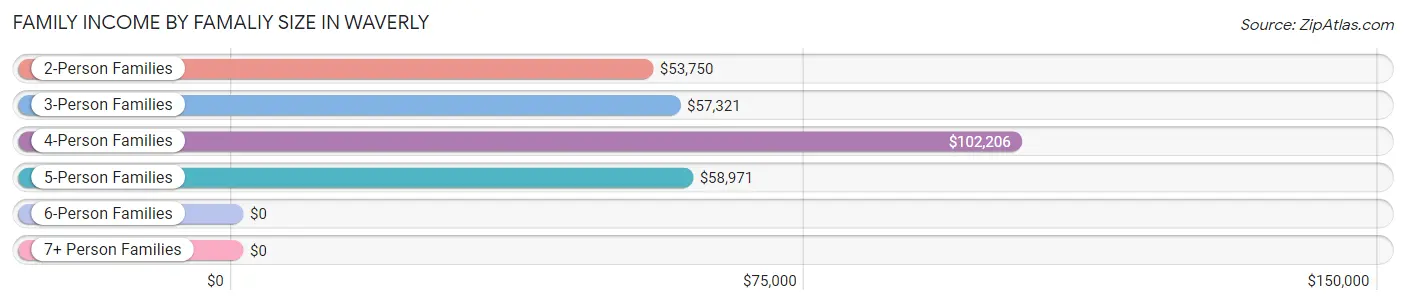
| Income Bracket | # Families | Median Income |
| 2-Person Families | 184 (34.2%) | $53,750 |
| 3-Person Families | 129 (24.0%) | $57,321 |
| 4-Person Families | 110 (20.4%) | $102,206 |
| 5-Person Families | 76 (14.1%) | $58,971 |
| 6-Person Families | 33 (6.1%) | $0 |
| 7+ Person Families | 6 (1.1%) | $0 |
| Total | 538 (100.0%) | $66,522 |
Family Income by Number of Earners in Waverly
The median family income in Waverly is $66,522, with families comprising 3+ earners (117) having the highest median family income of $131,350, while families with no earners (47) have the lowest median family income of $57,083, accounting for 21.7% and 8.7% of families, respectively.
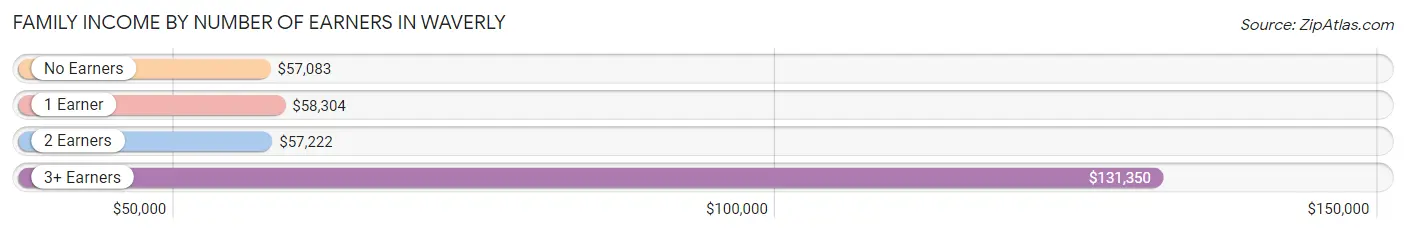
| Number of Earners | # Families | Median Income |
| No Earners | 47 (8.7%) | $57,083 |
| 1 Earner | 210 (39.0%) | $58,304 |
| 2 Earners | 164 (30.5%) | $57,222 |
| 3+ Earners | 117 (21.7%) | $131,350 |
| Total | 538 (100.0%) | $66,522 |
Household Income in Waverly
Household Income Brackets in Waverly
With 189 households falling in the category, the $75,000 to $99,999 income range is the most frequent in Waverly, accounting for 21.5% of all households. In contrast, only 18 households (2.1%) fall into the $200,000+ income bracket, making it the least populous group.
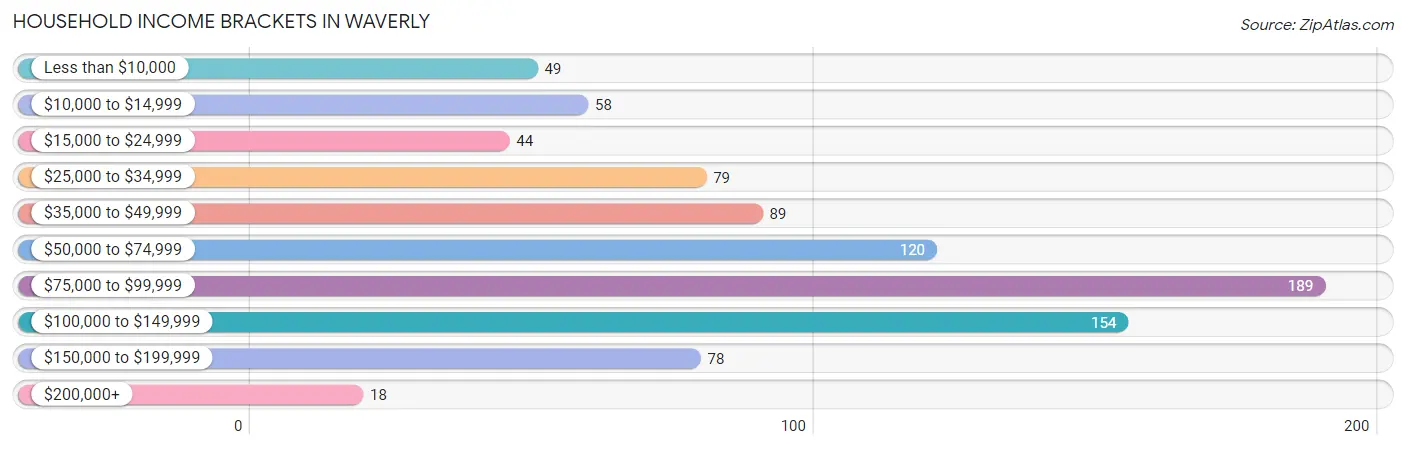
| Income Bracket | # Households | % Households |
| Less than $10,000 | 49 | 5.6% |
| $10,000 to $14,999 | 58 | 6.6% |
| $15,000 to $24,999 | 44 | 5.0% |
| $25,000 to $34,999 | 79 | 9.0% |
| $35,000 to $49,999 | 89 | 10.1% |
| $50,000 to $74,999 | 120 | 13.7% |
| $75,000 to $99,999 | 189 | 21.5% |
| $100,000 to $149,999 | 154 | 17.5% |
| $150,000 to $199,999 | 78 | 8.9% |
| $200,000+ | 18 | 2.1% |
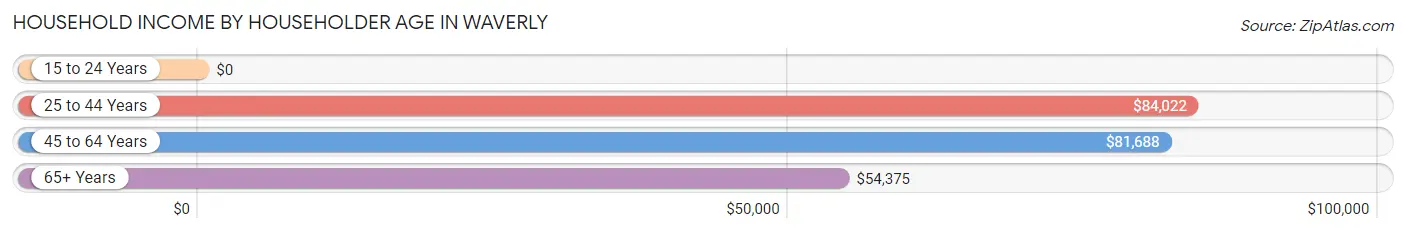
Household Income by Householder Age in Waverly
The median household income in Waverly is $75,000, with the highest median household income of $84,022 found in the 25 to 44 years age bracket for the primary householder. A total of 250 households (28.5%) fall into this category. Meanwhile, the 15 to 24 years age bracket for the primary householder has the lowest median household income of $0, with 25 households (2.9%) in this group.
| Income Bracket | # Households | Median Income |
| 15 to 24 Years | 25 (2.9%) | $0 |
| 25 to 44 Years | 250 (28.5%) | $84,022 |
| 45 to 64 Years | 381 (43.4%) | $81,688 |
| 65+ Years | 222 (25.3%) | $54,375 |
| Total | 878 (100.0%) | $75,000 |
Poverty in Waverly
Income Below Poverty by Sex and Age in Waverly
With 6.1% poverty level for males and 10.6% for females among the residents of Waverly, 12 to 14 year old males and 12 to 14 year old females are the most vulnerable to poverty, with 12 males (24.5%) and 11 females (100.0%) in their respective age groups living below the poverty level.
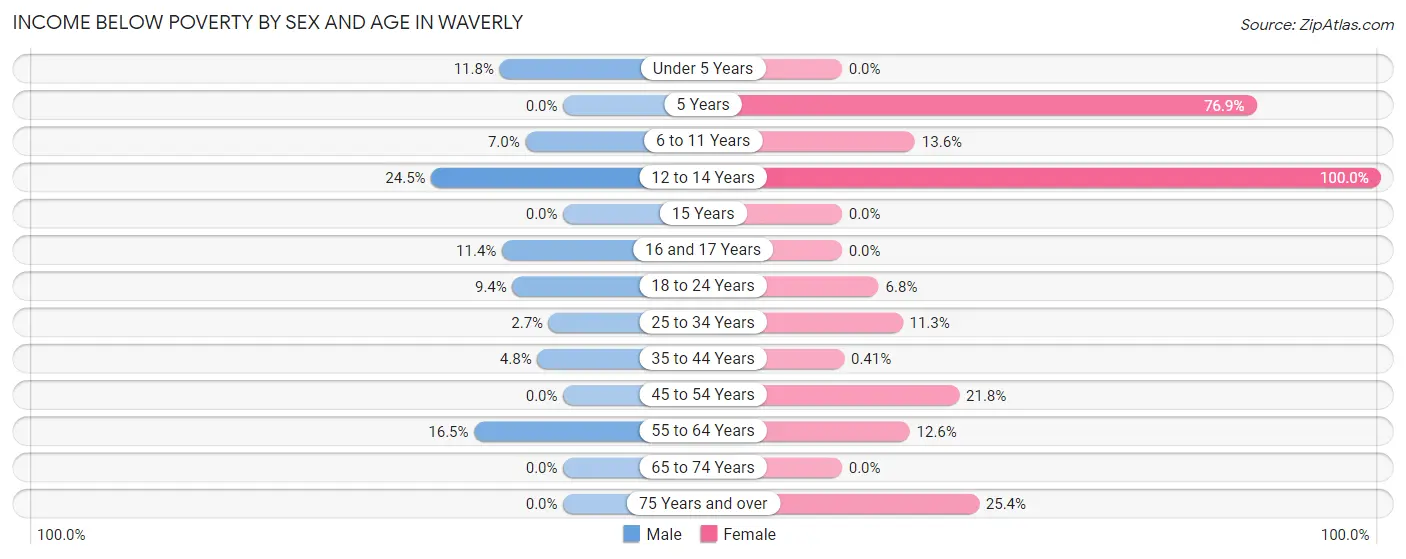
| Age Bracket | Male | Female |
| Under 5 Years | 15 (11.8%) | 0 (0.0%) |
| 5 Years | 0 (0.0%) | 10 (76.9%) |
| 6 to 11 Years | 8 (7.0%) | 19 (13.6%) |
| 12 to 14 Years | 12 (24.5%) | 11 (100.0%) |
| 15 Years | 0 (0.0%) | 0 (0.0%) |
| 16 and 17 Years | 5 (11.4%) | 0 (0.0%) |
| 18 to 24 Years | 18 (9.4%) | 13 (6.8%) |
| 25 to 34 Years | 7 (2.7%) | 8 (11.3%) |
| 35 to 44 Years | 6 (4.8%) | 1 (0.4%) |
| 45 to 54 Years | 0 (0.0%) | 32 (21.8%) |
| 55 to 64 Years | 19 (16.5%) | 17 (12.6%) |
| 65 to 74 Years | 0 (0.0%) | 0 (0.0%) |
| 75 Years and over | 0 (0.0%) | 29 (25.4%) |
| Total | 90 (6.1%) | 140 (10.6%) |
Income Above Poverty by Sex and Age in Waverly
According to the poverty statistics in Waverly, males aged 5 years and females aged under 5 years are the age groups that are most secure financially, with 100.0% of males and 100.0% of females in these age groups living above the poverty line.
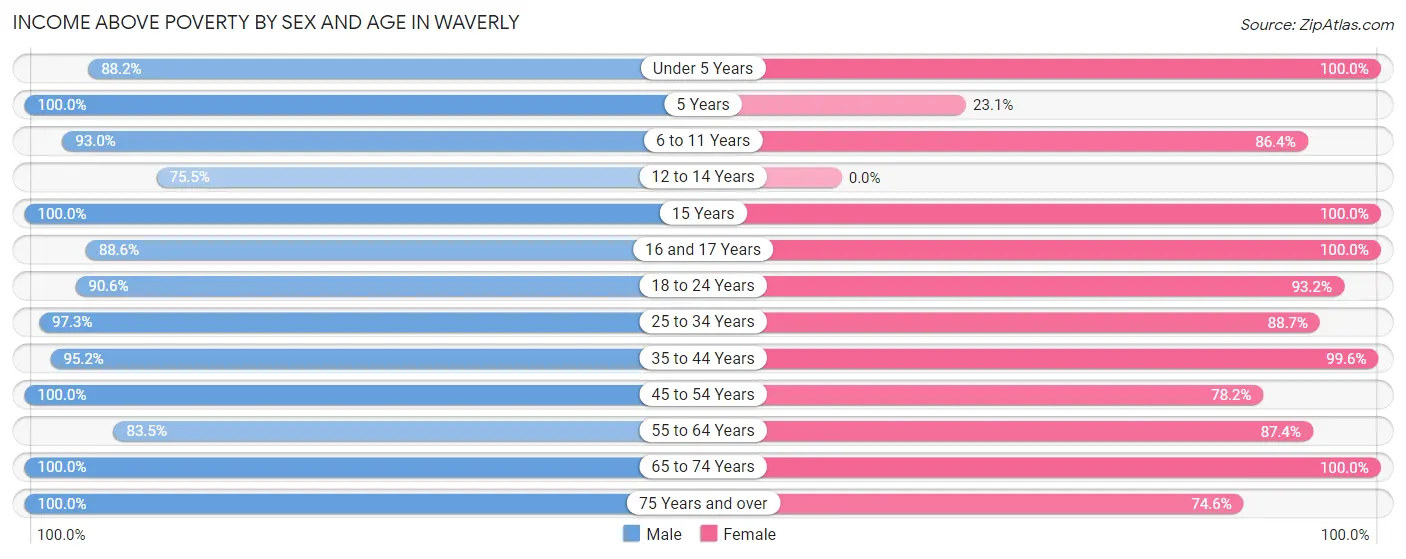
| Age Bracket | Male | Female |
| Under 5 Years | 112 (88.2%) | 61 (100.0%) |
| 5 Years | 63 (100.0%) | 3 (23.1%) |
| 6 to 11 Years | 106 (93.0%) | 121 (86.4%) |
| 12 to 14 Years | 37 (75.5%) | 0 (0.0%) |
| 15 Years | 30 (100.0%) | 64 (100.0%) |
| 16 and 17 Years | 39 (88.6%) | 30 (100.0%) |
| 18 to 24 Years | 173 (90.6%) | 177 (93.2%) |
| 25 to 34 Years | 254 (97.3%) | 63 (88.7%) |
| 35 to 44 Years | 119 (95.2%) | 241 (99.6%) |
| 45 to 54 Years | 174 (100.0%) | 115 (78.2%) |
| 55 to 64 Years | 96 (83.5%) | 118 (87.4%) |
| 65 to 74 Years | 152 (100.0%) | 104 (100.0%) |
| 75 Years and over | 24 (100.0%) | 85 (74.6%) |
| Total | 1,379 (93.9%) | 1,182 (89.4%) |
Income Below Poverty Among Married-Couple Families in Waverly
The poverty statistics for married-couple families in Waverly show that 1.8% or 6 of the total 326 families live below the poverty line. Families with 5 or more children have the highest poverty rate of 100.0%, comprising of 6 families. On the other hand, families with no children have the lowest poverty rate of 0.0%, which includes 0 families.
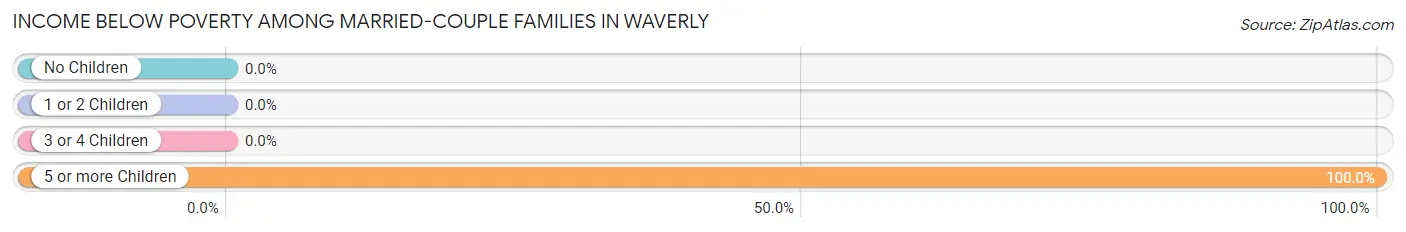
| Children | Above Poverty | Below Poverty |
| No Children | 144 (100.0%) | 0 (0.0%) |
| 1 or 2 Children | 109 (100.0%) | 0 (0.0%) |
| 3 or 4 Children | 67 (100.0%) | 0 (0.0%) |
| 5 or more Children | 0 (0.0%) | 6 (100.0%) |
| Total | 320 (98.2%) | 6 (1.8%) |
Income Below Poverty Among Single-Parent Households in Waverly
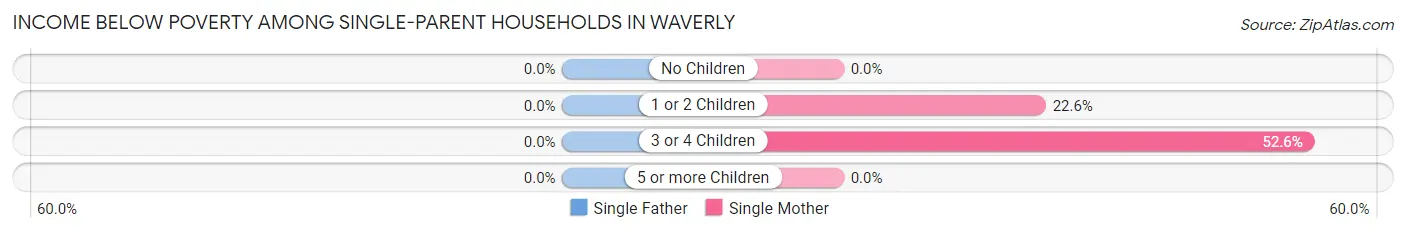
| Children | Single Father | Single Mother |
| No Children | 0 (0.0%) | 0 (0.0%) |
| 1 or 2 Children | 0 (0.0%) | 14 (22.6%) |
| 3 or 4 Children | 0 (0.0%) | 10 (52.6%) |
| 5 or more Children | 0 (0.0%) | 0 (0.0%) |
| Total | 0 (0.0%) | 24 (17.3%) |
Income Below Poverty Among Married-Couple vs Single-Parent Households in Waverly
The poverty data for Waverly shows that 6 of the married-couple family households (1.8%) and 24 of the single-parent households (11.3%) are living below the poverty level. Within the married-couple family households, those with 5 or more children have the highest poverty rate, with 6 households (100.0%) falling below the poverty line. Among the single-parent households, those with 3 or 4 children have the highest poverty rate, with 10 household (52.6%) living below poverty.
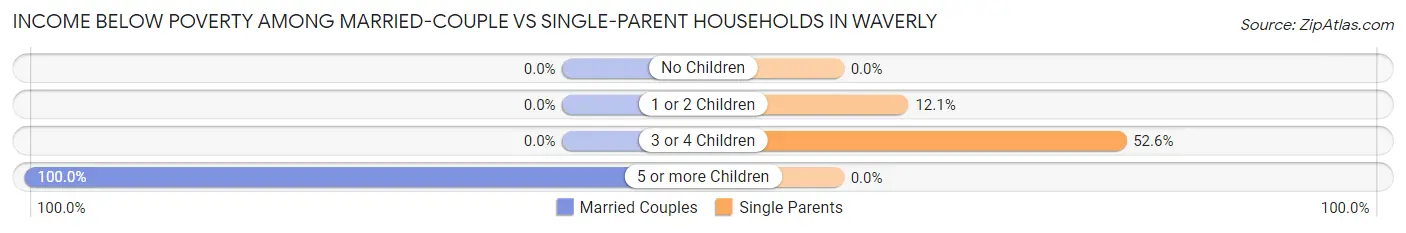
| Children | Married-Couple Families | Single-Parent Households |
| No Children | 0 (0.0%) | 0 (0.0%) |
| 1 or 2 Children | 0 (0.0%) | 14 (12.1%) |
| 3 or 4 Children | 0 (0.0%) | 10 (52.6%) |
| 5 or more Children | 6 (100.0%) | 0 (0.0%) |
| Total | 6 (1.8%) | 24 (11.3%) |
Race in Waverly
The most populous races in Waverly are Black / African American (2,010 | 69.6%), White / Caucasian (746 | 25.8%), and Hispanic or Latino (255 | 8.8%).
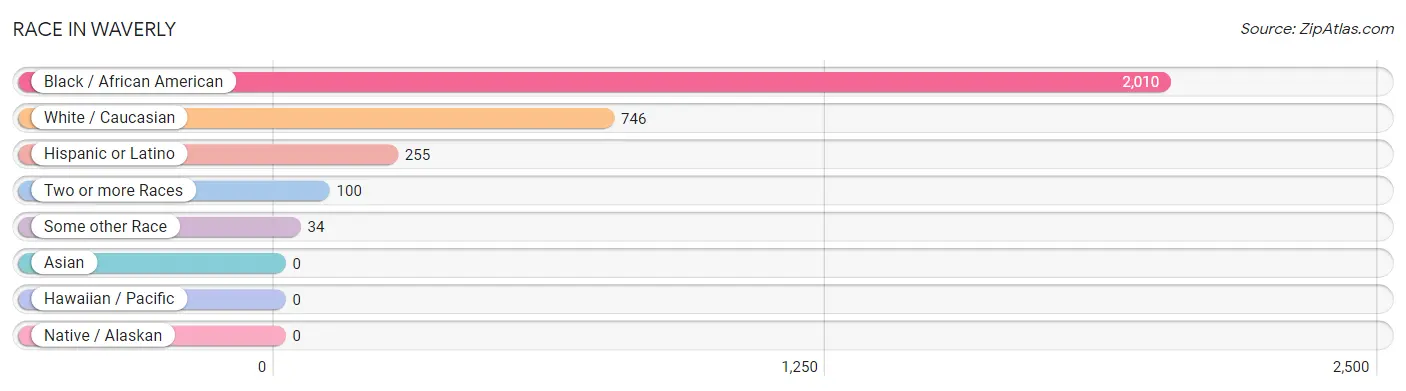
| Race | # Population | % Population |
| Asian | 0 | 0.0% |
| Black / African American | 2,010 | 69.6% |
| Hawaiian / Pacific | 0 | 0.0% |
| Hispanic or Latino | 255 | 8.8% |
| Native / Alaskan | 0 | 0.0% |
| White / Caucasian | 746 | 25.8% |
| Two or more Races | 100 | 3.5% |
| Some other Race | 34 | 1.2% |
| Total | 2,890 | 100.0% |
Ancestry in Waverly
The most populous ancestries reported in Waverly are African (540 | 18.7%), Subsaharan African (540 | 18.7%), Mexican (215 | 7.4%), American (122 | 4.2%), and English (100 | 3.5%), together accounting for 52.5% of all Waverly residents.
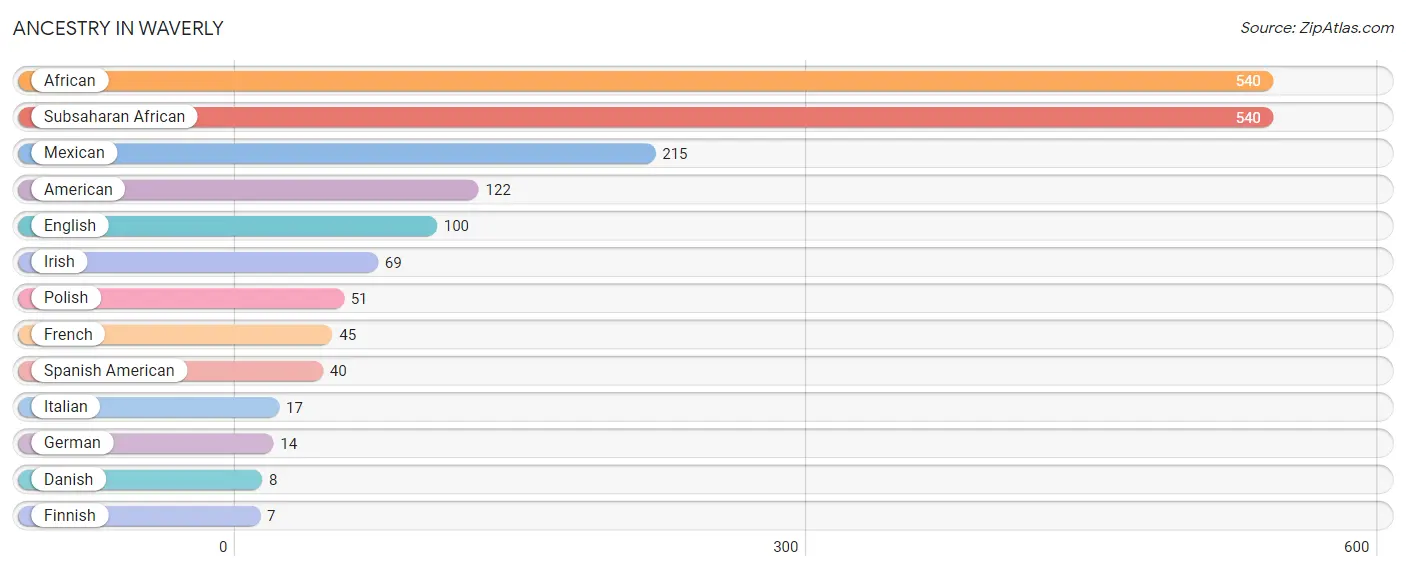
| Ancestry | # Population | % Population |
| African | 540 | 18.7% |
| American | 122 | 4.2% |
| Danish | 8 | 0.3% |
| English | 100 | 3.5% |
| Finnish | 7 | 0.2% |
| French | 45 | 1.6% |
| German | 14 | 0.5% |
| Irish | 69 | 2.4% |
| Italian | 17 | 0.6% |
| Mexican | 215 | 7.4% |
| Polish | 51 | 1.8% |
| Spanish American | 40 | 1.4% |
| Subsaharan African | 540 | 18.7% | View All 13 Rows |
Immigrants in Waverly
The most numerous immigrant groups reported in Waverly came from Central America (98 | 3.4%), Latin America (98 | 3.4%), Mexico (98 | 3.4%), Asia (2 | 0.1%), and Eastern Europe (2 | 0.1%), together accounting for 10.3% of all Waverly residents.
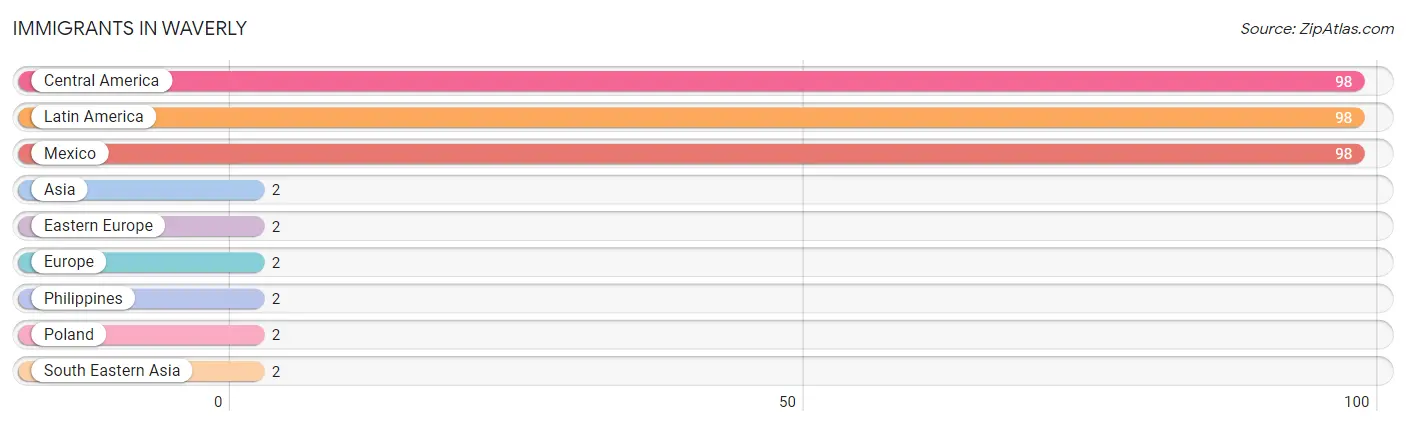
| Immigration Origin | # Population | % Population |
| Asia | 2 | 0.1% |
| Central America | 98 | 3.4% |
| Eastern Europe | 2 | 0.1% |
| Europe | 2 | 0.1% |
| Latin America | 98 | 3.4% |
| Mexico | 98 | 3.4% |
| Philippines | 2 | 0.1% |
| Poland | 2 | 0.1% |
| South Eastern Asia | 2 | 0.1% | View All 9 Rows |
Sex and Age in Waverly
Sex and Age in Waverly
The most populous age groups in Waverly are 15 to 19 Years (172 | 11.4%) for men and 20 to 24 Years (170 | 12.4%) for women.
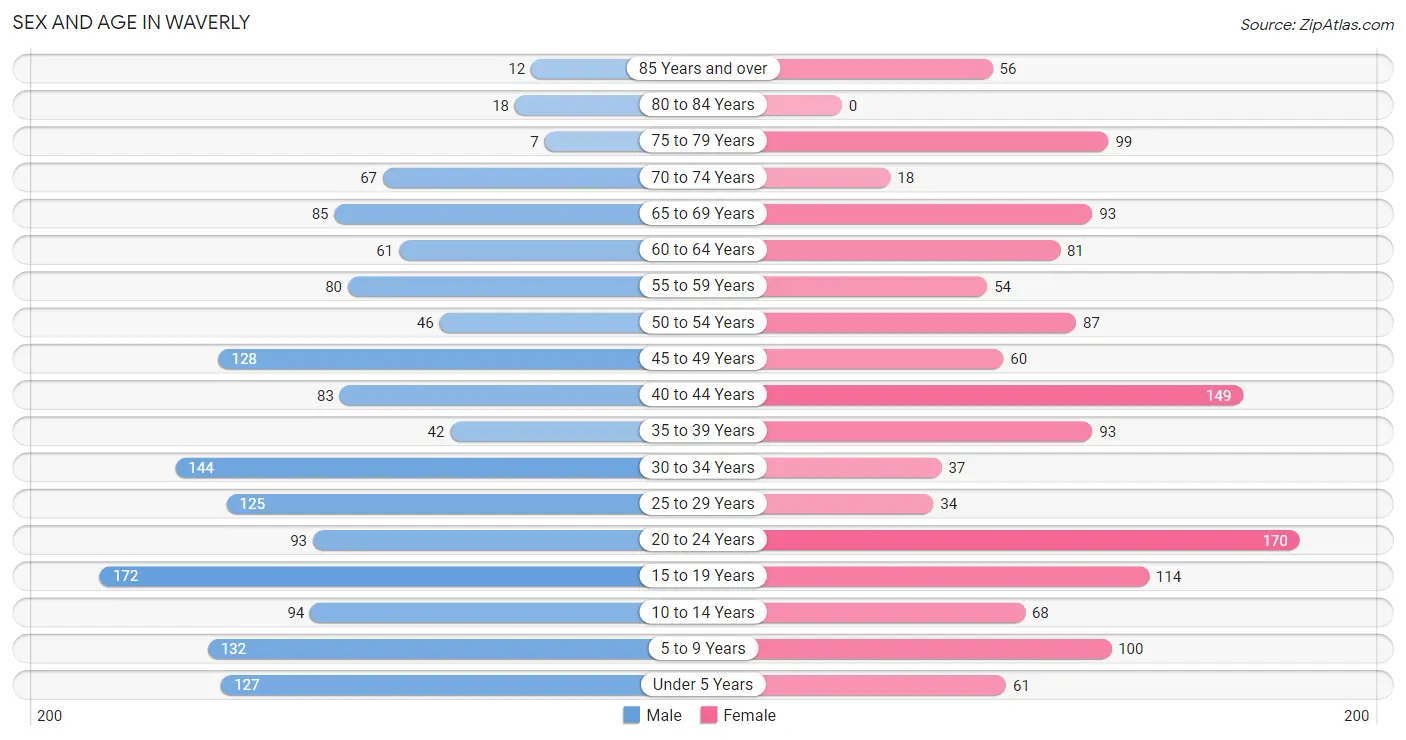
| Age Bracket | Male | Female |
| Under 5 Years | 127 (8.4%) | 61 (4.4%) |
| 5 to 9 Years | 132 (8.7%) | 100 (7.3%) |
| 10 to 14 Years | 94 (6.2%) | 68 (5.0%) |
| 15 to 19 Years | 172 (11.4%) | 114 (8.3%) |
| 20 to 24 Years | 93 (6.1%) | 170 (12.4%) |
| 25 to 29 Years | 125 (8.3%) | 34 (2.5%) |
| 30 to 34 Years | 144 (9.5%) | 37 (2.7%) |
| 35 to 39 Years | 42 (2.8%) | 93 (6.8%) |
| 40 to 44 Years | 83 (5.5%) | 149 (10.8%) |
| 45 to 49 Years | 128 (8.4%) | 60 (4.4%) |
| 50 to 54 Years | 46 (3.0%) | 87 (6.3%) |
| 55 to 59 Years | 80 (5.3%) | 54 (3.9%) |
| 60 to 64 Years | 61 (4.0%) | 81 (5.9%) |
| 65 to 69 Years | 85 (5.6%) | 93 (6.8%) |
| 70 to 74 Years | 67 (4.4%) | 18 (1.3%) |
| 75 to 79 Years | 7 (0.5%) | 99 (7.2%) |
| 80 to 84 Years | 18 (1.2%) | 0 (0.0%) |
| 85 Years and over | 12 (0.8%) | 56 (4.1%) |
| Total | 1,516 (100.0%) | 1,374 (100.0%) |
Families and Households in Waverly
Median Family Size in Waverly
The median family size in Waverly is 4.30 persons per family, with single female/mother families (139 | 25.8%) accounting for the largest median family size of 5.27 persons per family. On the other hand, single male/father families (73 | 13.6%) represent the smallest median family size with 2.05 persons per family.
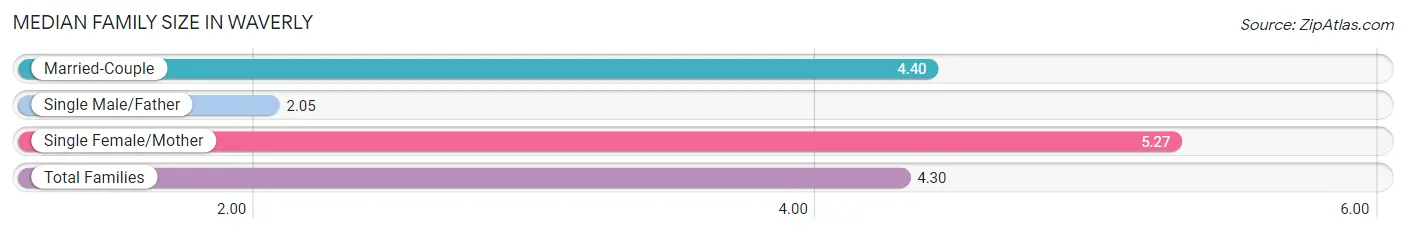
| Family Type | # Families | Family Size |
| Married-Couple | 326 (60.6%) | 4.40 |
| Single Male/Father | 73 (13.6%) | 2.05 |
| Single Female/Mother | 139 (25.8%) | 5.27 |
| Total Families | 538 (100.0%) | 4.30 |
Median Household Size in Waverly
The median household size in Waverly is 3.14 persons per household, with single female/mother households (139 | 15.8%) accounting for the largest median household size of 5.29 persons per household. non-family households (340 | 38.7%) represent the smallest median household size with 1.16 persons per household.
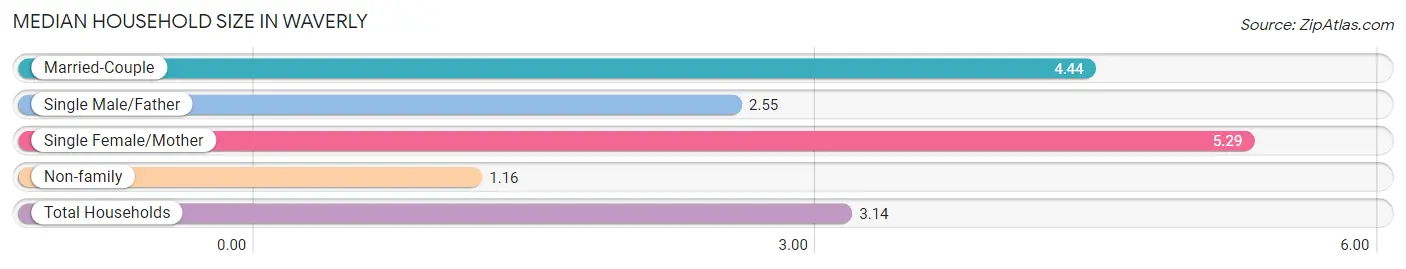
| Household Type | # Households | Household Size |
| Married-Couple | 326 (37.1%) | 4.44 |
| Single Male/Father | 73 (8.3%) | 2.55 |
| Single Female/Mother | 139 (15.8%) | 5.29 |
| Non-family | 340 (38.7%) | 1.16 |
| Total Households | 878 (100.0%) | 3.14 |
Household Size by Marriage Status in Waverly
Out of a total of 878 households in Waverly, 538 (61.3%) are family households, while 340 (38.7%) are nonfamily households. The most numerous type of family households are 2-person households, comprising 145, and the most common type of nonfamily households are 1-person households, comprising 305.
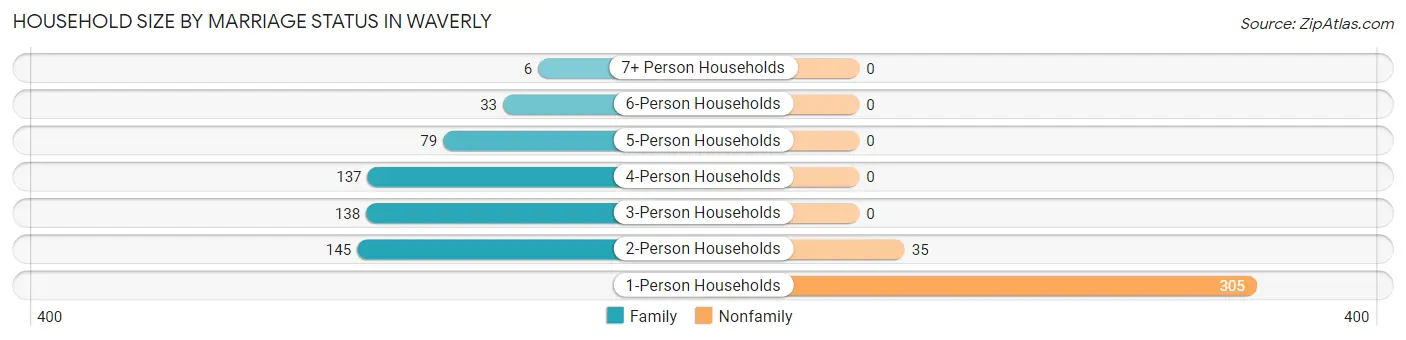
| Household Size | Family Households | Nonfamily Households |
| 1-Person Households | - | 305 (34.7%) |
| 2-Person Households | 145 (16.5%) | 35 (4.0%) |
| 3-Person Households | 138 (15.7%) | 0 (0.0%) |
| 4-Person Households | 137 (15.6%) | 0 (0.0%) |
| 5-Person Households | 79 (9.0%) | 0 (0.0%) |
| 6-Person Households | 33 (3.8%) | 0 (0.0%) |
| 7+ Person Households | 6 (0.7%) | 0 (0.0%) |
| Total | 538 (61.3%) | 340 (38.7%) |
Female Fertility in Waverly
Fertility by Age in Waverly
Average fertility rate in Waverly is 126.0 births per 1,000 women. Women in the age bracket of 20 to 34 years have the highest fertility rate with 349.0 births per 1,000 women. Women in the age bracket of 20 to 34 years acount for 98.8% of all women with births.
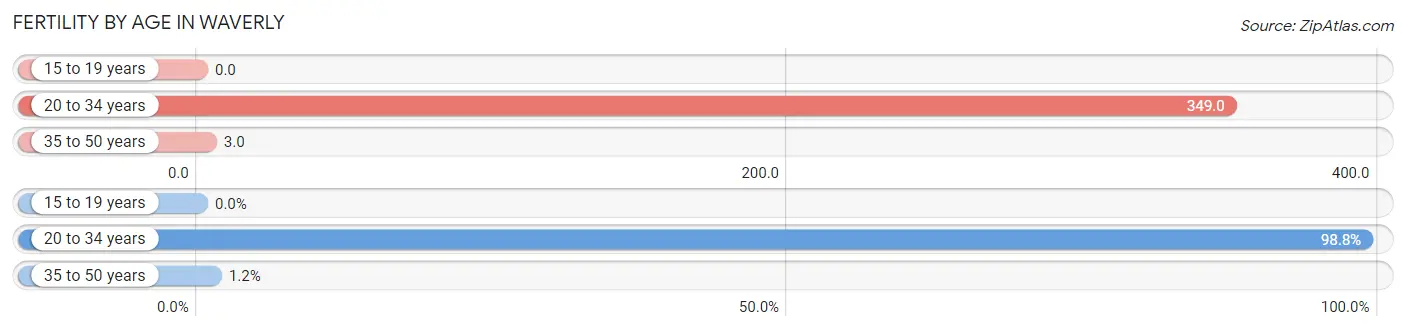
| Age Bracket | Women with Births | Births / 1,000 Women |
| 15 to 19 years | 0 (0.0%) | 0.0 |
| 20 to 34 years | 84 (98.8%) | 349.0 |
| 35 to 50 years | 1 (1.2%) | 3.0 |
| Total | 85 (100.0%) | 126.0 |
Fertility by Age by Marriage Status in Waverly
1.2% of women with births (85) in Waverly are married. The highest percentage of unmarried women with births falls into 20 to 34 years age bracket with 100.0% of them unmarried at the time of birth, while the lowest percentage of unmarried women with births belong to 35 to 50 years age bracket with 0.0% of them unmarried.
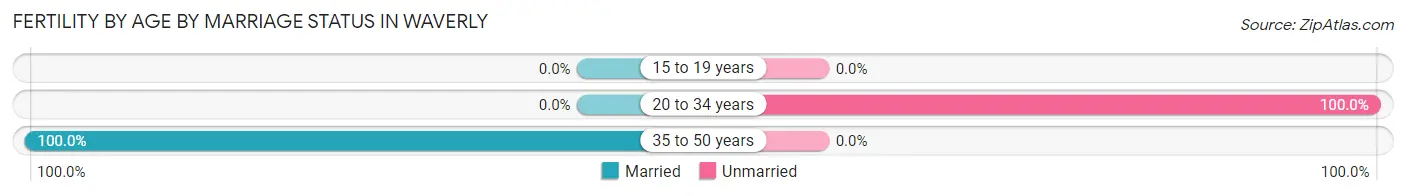
| Age Bracket | Married | Unmarried |
| 15 to 19 years | 0 (0.0%) | 0 (0.0%) |
| 20 to 34 years | 0 (0.0%) | 84 (100.0%) |
| 35 to 50 years | 1 (100.0%) | 0 (0.0%) |
| Total | 1 (1.2%) | 84 (98.8%) |
Fertility by Education in Waverly
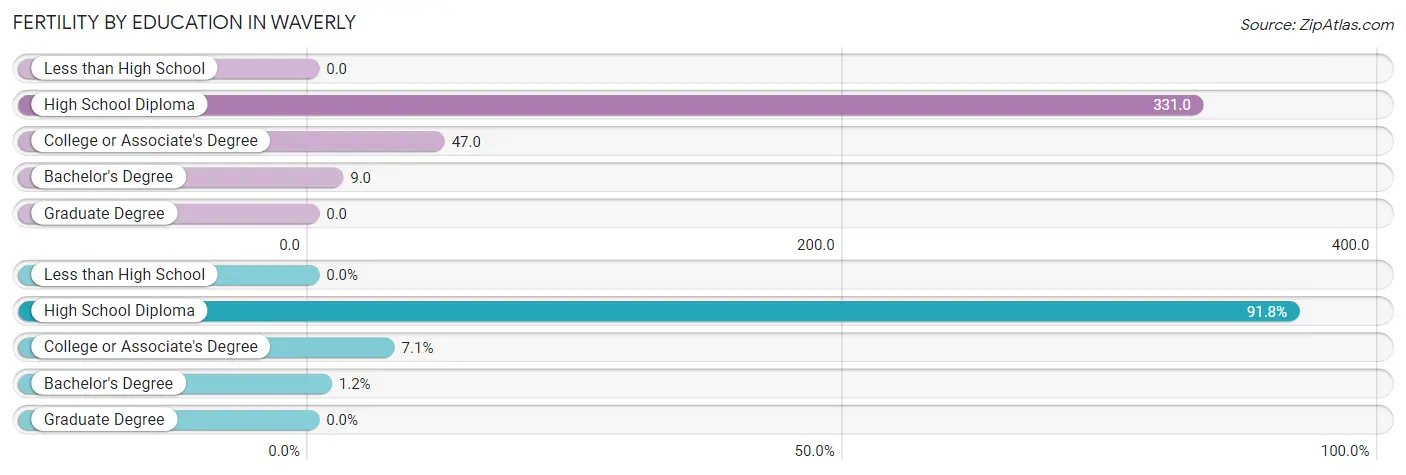
| Educational Attainment | Women with Births | Births / 1,000 Women |
| Less than High School | 0 (0.0%) | 0.0 |
| High School Diploma | 78 (91.8%) | 331.0 |
| College or Associate's Degree | 6 (7.1%) | 47.0 |
| Bachelor's Degree | 1 (1.2%) | 9.0 |
| Graduate Degree | 0 (0.0%) | 0.0 |
| Total | 85 (100.0%) | 126.0 |
Fertility by Education by Marriage Status in Waverly
98.8% of women with births in Waverly are unmarried. Women with the educational attainment of bachelor's degree are most likely to be married with 100.0% of them married at childbirth, while women with the educational attainment of high school diploma are least likely to be married with 100.0% of them unmarried at childbirth.
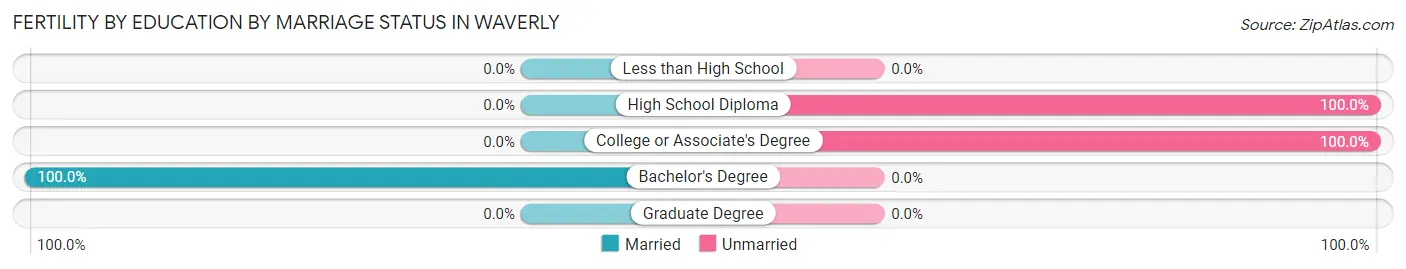
| Educational Attainment | Married | Unmarried |
| Less than High School | 0 (0.0%) | 0 (0.0%) |
| High School Diploma | 0 (0.0%) | 78 (100.0%) |
| College or Associate's Degree | 0 (0.0%) | 6 (100.0%) |
| Bachelor's Degree | 1 (100.0%) | 0 (0.0%) |
| Graduate Degree | 0 (0.0%) | 0 (0.0%) |
| Total | 1 (1.2%) | 84 (98.8%) |
Employment Characteristics in Waverly
Employment by Class of Employer in Waverly
Among the 1,202 employed individuals in Waverly, private company employees (792 | 65.9%), local government employees (118 | 9.8%), and state government employees (79 | 6.6%) make up the most common classes of employment.
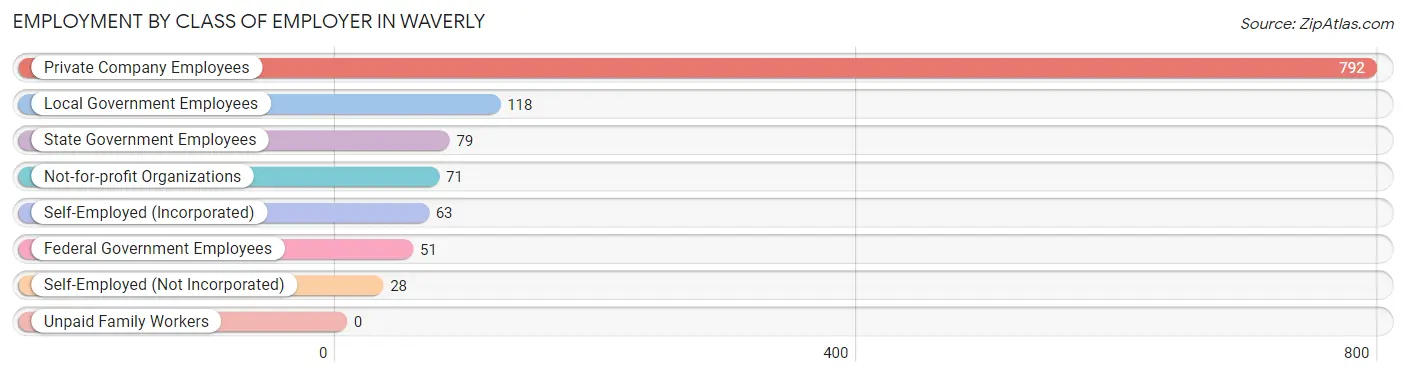
| Employer Class | # Employees | % Employees |
| Private Company Employees | 792 | 65.9% |
| Self-Employed (Incorporated) | 63 | 5.2% |
| Self-Employed (Not Incorporated) | 28 | 2.3% |
| Not-for-profit Organizations | 71 | 5.9% |
| Local Government Employees | 118 | 9.8% |
| State Government Employees | 79 | 6.6% |
| Federal Government Employees | 51 | 4.2% |
| Unpaid Family Workers | 0 | 0.0% |
| Total | 1,202 | 100.0% |
Employment Status by Age in Waverly
According to the labor force statistics for Waverly, out of the total population over 16 years of age (2,214), 61.1% or 1,353 individuals are in the labor force, with 9.5% or 129 of them unemployed. The age group with the highest labor force participation rate is 30 to 34 years, with 100.0% or 181 individuals in the labor force. Within the labor force, the 20 to 24 years age range has the highest percentage of unemployed individuals, with 46.9% or 97 of them being unemployed.
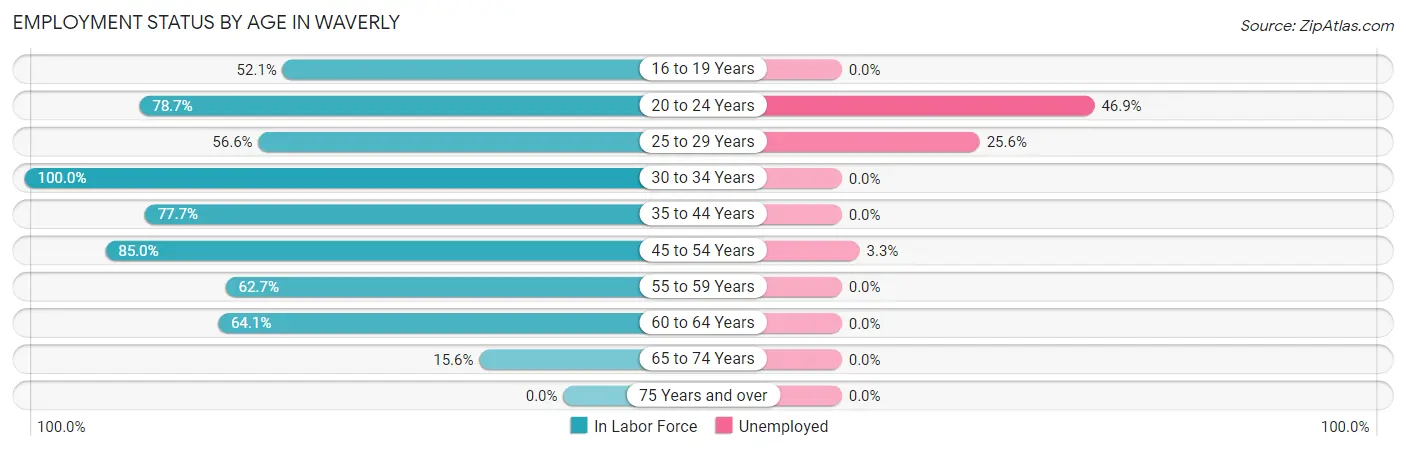
| Age Bracket | In Labor Force | Unemployed |
| 16 to 19 Years | 100 (52.1%) | 0 (0.0%) |
| 20 to 24 Years | 207 (78.7%) | 97 (46.9%) |
| 25 to 29 Years | 90 (56.6%) | 23 (25.6%) |
| 30 to 34 Years | 181 (100.0%) | 0 (0.0%) |
| 35 to 44 Years | 285 (77.7%) | 0 (0.0%) |
| 45 to 54 Years | 273 (85.0%) | 9 (3.3%) |
| 55 to 59 Years | 84 (62.7%) | 0 (0.0%) |
| 60 to 64 Years | 91 (64.1%) | 0 (0.0%) |
| 65 to 74 Years | 41 (15.6%) | 0 (0.0%) |
| 75 Years and over | 0 (0.0%) | 0 (0.0%) |
| Total | 1,353 (61.1%) | 129 (9.5%) |
Employment Status by Educational Attainment in Waverly
According to labor force statistics for Waverly, 77.0% of individuals (1,004) out of the total population between 25 and 64 years of age (1,304) are in the labor force, with 3.2% or 32 of them being unemployed. The group with the highest labor force participation rate are those with the educational attainment of college / associate degree, with 82.1% or 349 individuals in the labor force. Within the labor force, individuals with college / associate degree education have the highest percentage of unemployment, with 4.6% or 16 of them being unemployed.
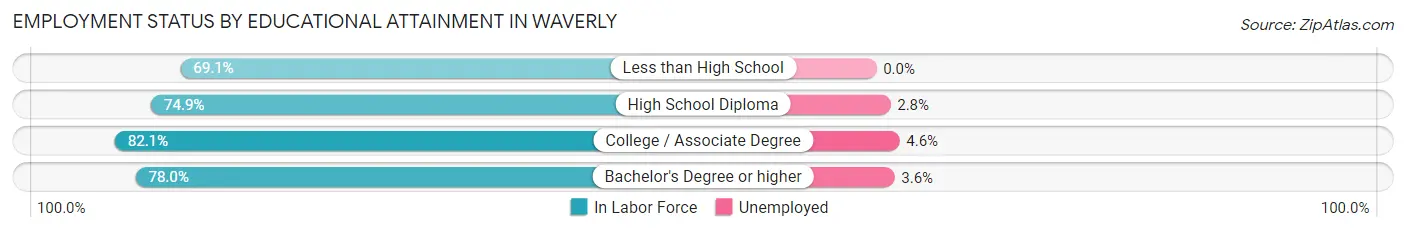
| Educational Attainment | In Labor Force | Unemployed |
| Less than High School | 134 (69.1%) | 0 (0.0%) |
| High School Diploma | 326 (74.9%) | 12 (2.8%) |
| College / Associate Degree | 349 (82.1%) | 20 (4.6%) |
| Bachelor's Degree or higher | 195 (78.0%) | 9 (3.6%) |
| Total | 1,004 (77.0%) | 42 (3.2%) |
Employment Occupations by Sex in Waverly
Management, Business, Science and Arts Occupations
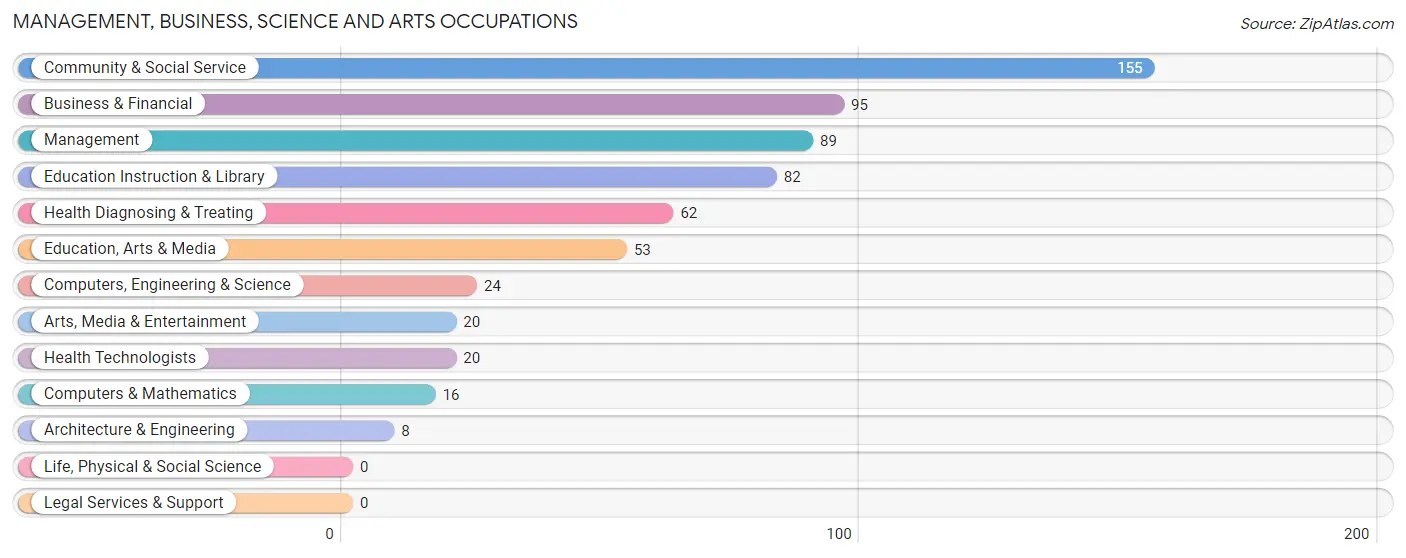
The most common Management, Business, Science and Arts occupations in Waverly are Community & Social Service (155 | 12.7%), Business & Financial (95 | 7.8%), Management (89 | 7.3%), Education Instruction & Library (82 | 6.7%), and Health Diagnosing & Treating (62 | 5.1%).
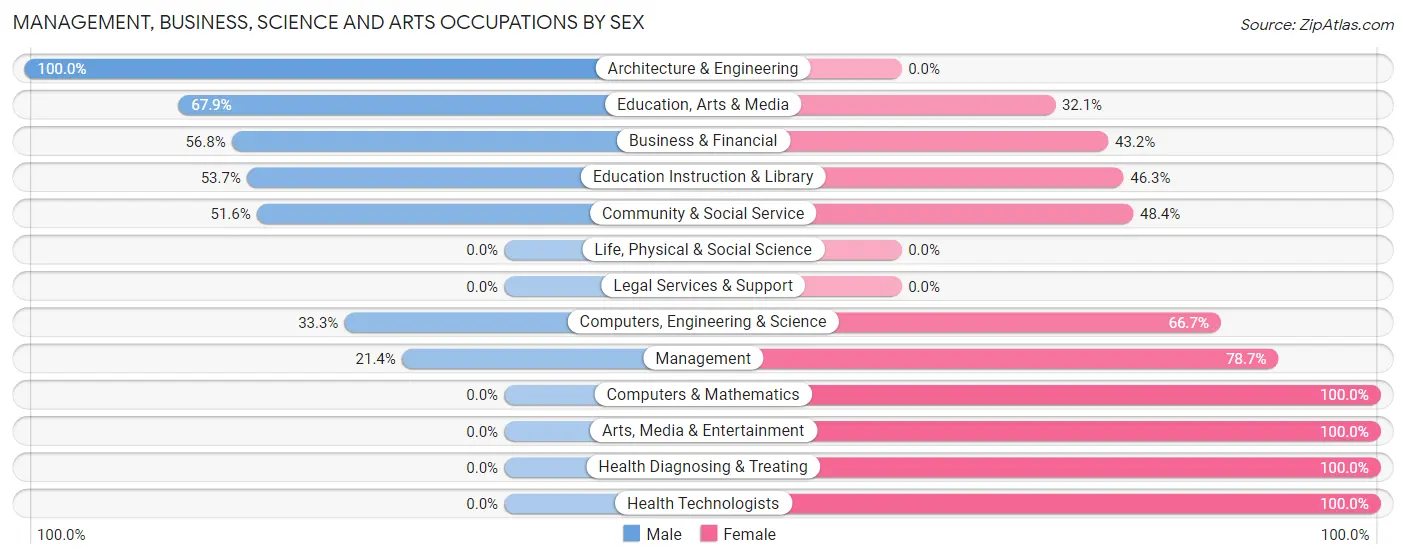
Management, Business, Science and Arts Occupations by Sex
Within the Management, Business, Science and Arts occupations in Waverly, the most male-oriented occupations are Architecture & Engineering (100.0%), Education, Arts & Media (67.9%), and Business & Financial (56.8%), while the most female-oriented occupations are Computers & Mathematics (100.0%), Arts, Media & Entertainment (100.0%), and Health Diagnosing & Treating (100.0%).
| Occupation | Male | Female |
| Management | 19 (21.3%) | 70 (78.6%) |
| Business & Financial | 54 (56.8%) | 41 (43.2%) |
| Computers, Engineering & Science | 8 (33.3%) | 16 (66.7%) |
| Computers & Mathematics | 0 (0.0%) | 16 (100.0%) |
| Architecture & Engineering | 8 (100.0%) | 0 (0.0%) |
| Life, Physical & Social Science | 0 (0.0%) | 0 (0.0%) |
| Community & Social Service | 80 (51.6%) | 75 (48.4%) |
| Education, Arts & Media | 36 (67.9%) | 17 (32.1%) |
| Legal Services & Support | 0 (0.0%) | 0 (0.0%) |
| Education Instruction & Library | 44 (53.7%) | 38 (46.3%) |
| Arts, Media & Entertainment | 0 (0.0%) | 20 (100.0%) |
| Health Diagnosing & Treating | 0 (0.0%) | 62 (100.0%) |
| Health Technologists | 0 (0.0%) | 20 (100.0%) |
| Total (Category) | 161 (37.9%) | 264 (62.1%) |
| Total (Overall) | 700 (57.2%) | 523 (42.8%) |
Services Occupations
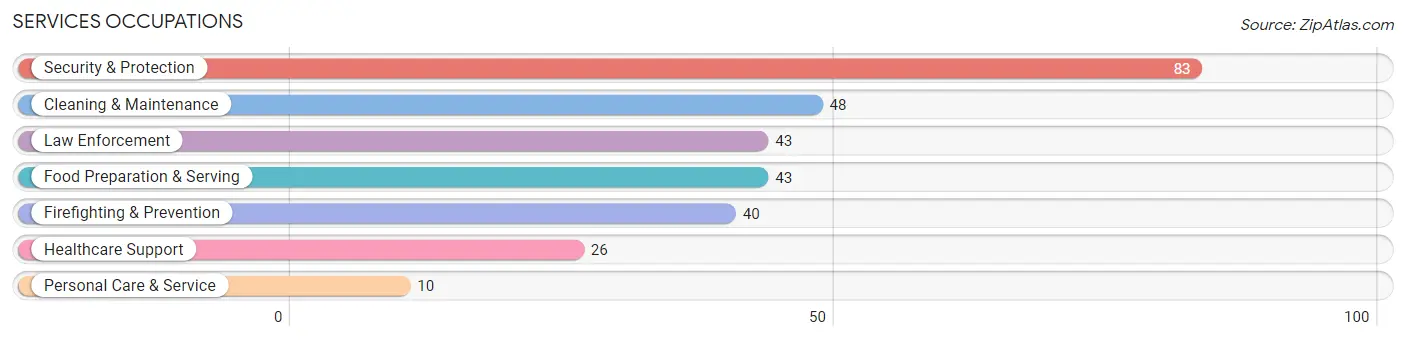
The most common Services occupations in Waverly are Security & Protection (83 | 6.8%), Cleaning & Maintenance (48 | 3.9%), Law Enforcement (43 | 3.5%), Food Preparation & Serving (43 | 3.5%), and Firefighting & Prevention (40 | 3.3%).
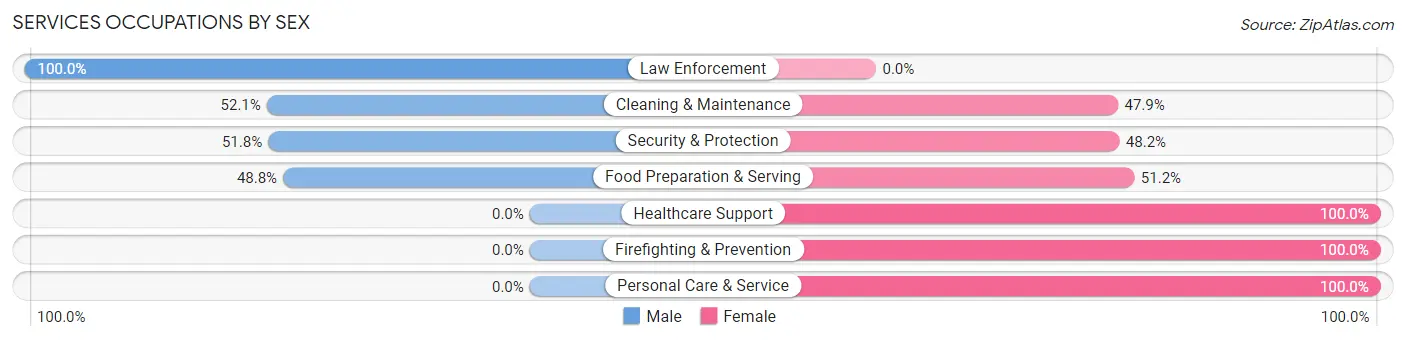
Services Occupations by Sex
Within the Services occupations in Waverly, the most male-oriented occupations are Law Enforcement (100.0%), Cleaning & Maintenance (52.1%), and Security & Protection (51.8%), while the most female-oriented occupations are Healthcare Support (100.0%), Firefighting & Prevention (100.0%), and Personal Care & Service (100.0%).
| Occupation | Male | Female |
| Healthcare Support | 0 (0.0%) | 26 (100.0%) |
| Security & Protection | 43 (51.8%) | 40 (48.2%) |
| Firefighting & Prevention | 0 (0.0%) | 40 (100.0%) |
| Law Enforcement | 43 (100.0%) | 0 (0.0%) |
| Food Preparation & Serving | 21 (48.8%) | 22 (51.2%) |
| Cleaning & Maintenance | 25 (52.1%) | 23 (47.9%) |
| Personal Care & Service | 0 (0.0%) | 10 (100.0%) |
| Total (Category) | 89 (42.4%) | 121 (57.6%) |
| Total (Overall) | 700 (57.2%) | 523 (42.8%) |
Sales and Office Occupations
The most common Sales and Office occupations in Waverly are Office & Administration (89 | 7.3%), and Sales & Related (54 | 4.4%).
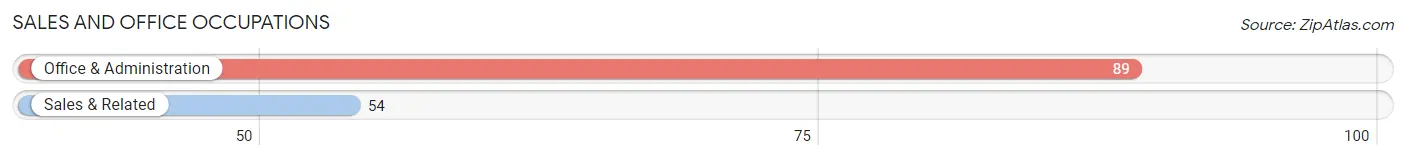
Sales and Office Occupations by Sex
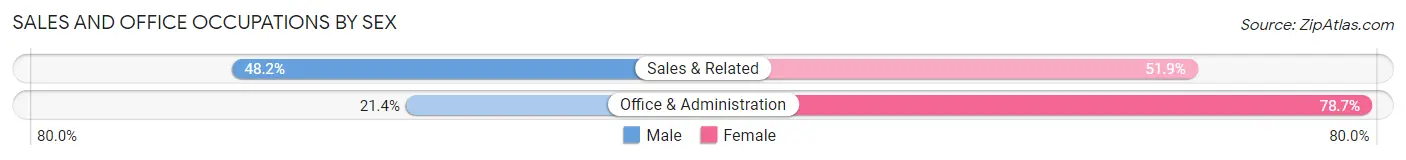
| Occupation | Male | Female |
| Sales & Related | 26 (48.1%) | 28 (51.8%) |
| Office & Administration | 19 (21.3%) | 70 (78.6%) |
| Total (Category) | 45 (31.5%) | 98 (68.5%) |
| Total (Overall) | 700 (57.2%) | 523 (42.8%) |
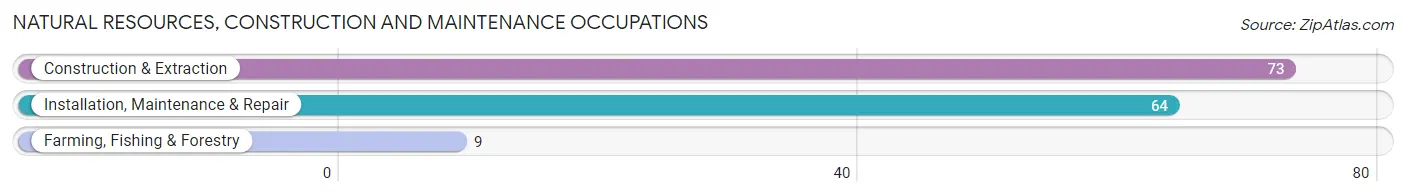
Natural Resources, Construction and Maintenance Occupations
The most common Natural Resources, Construction and Maintenance occupations in Waverly are Construction & Extraction (73 | 6.0%), Installation, Maintenance & Repair (64 | 5.2%), and Farming, Fishing & Forestry (9 | 0.7%).
Natural Resources, Construction and Maintenance Occupations by Sex
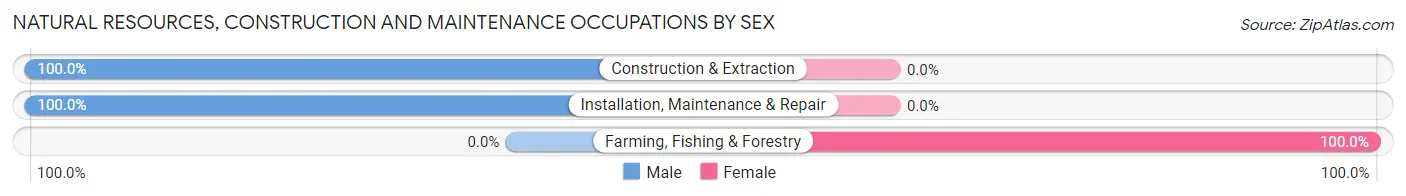
| Occupation | Male | Female |
| Farming, Fishing & Forestry | 0 (0.0%) | 9 (100.0%) |
| Construction & Extraction | 73 (100.0%) | 0 (0.0%) |
| Installation, Maintenance & Repair | 64 (100.0%) | 0 (0.0%) |
| Total (Category) | 137 (93.8%) | 9 (6.2%) |
| Total (Overall) | 700 (57.2%) | 523 (42.8%) |
Production, Transportation and Moving Occupations
The most common Production, Transportation and Moving occupations in Waverly are Production (164 | 13.4%), Material Moving (73 | 6.0%), and Transportation (62 | 5.1%).
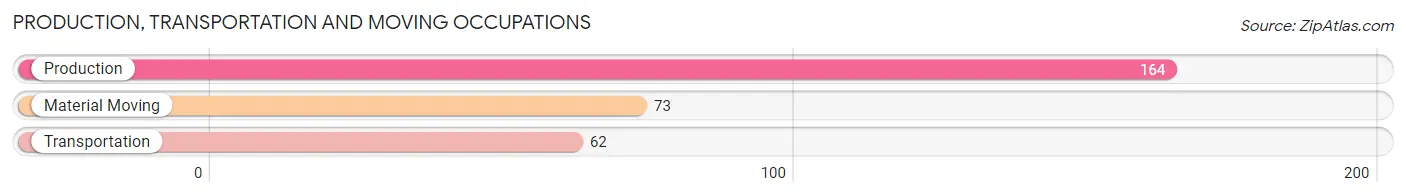
Production, Transportation and Moving Occupations by Sex
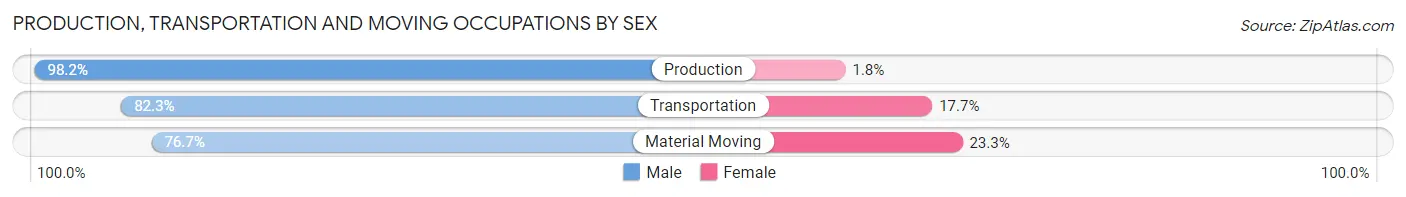
| Occupation | Male | Female |
| Production | 161 (98.2%) | 3 (1.8%) |
| Transportation | 51 (82.3%) | 11 (17.7%) |
| Material Moving | 56 (76.7%) | 17 (23.3%) |
| Total (Category) | 268 (89.6%) | 31 (10.4%) |
| Total (Overall) | 700 (57.2%) | 523 (42.8%) |
Employment Industries by Sex in Waverly
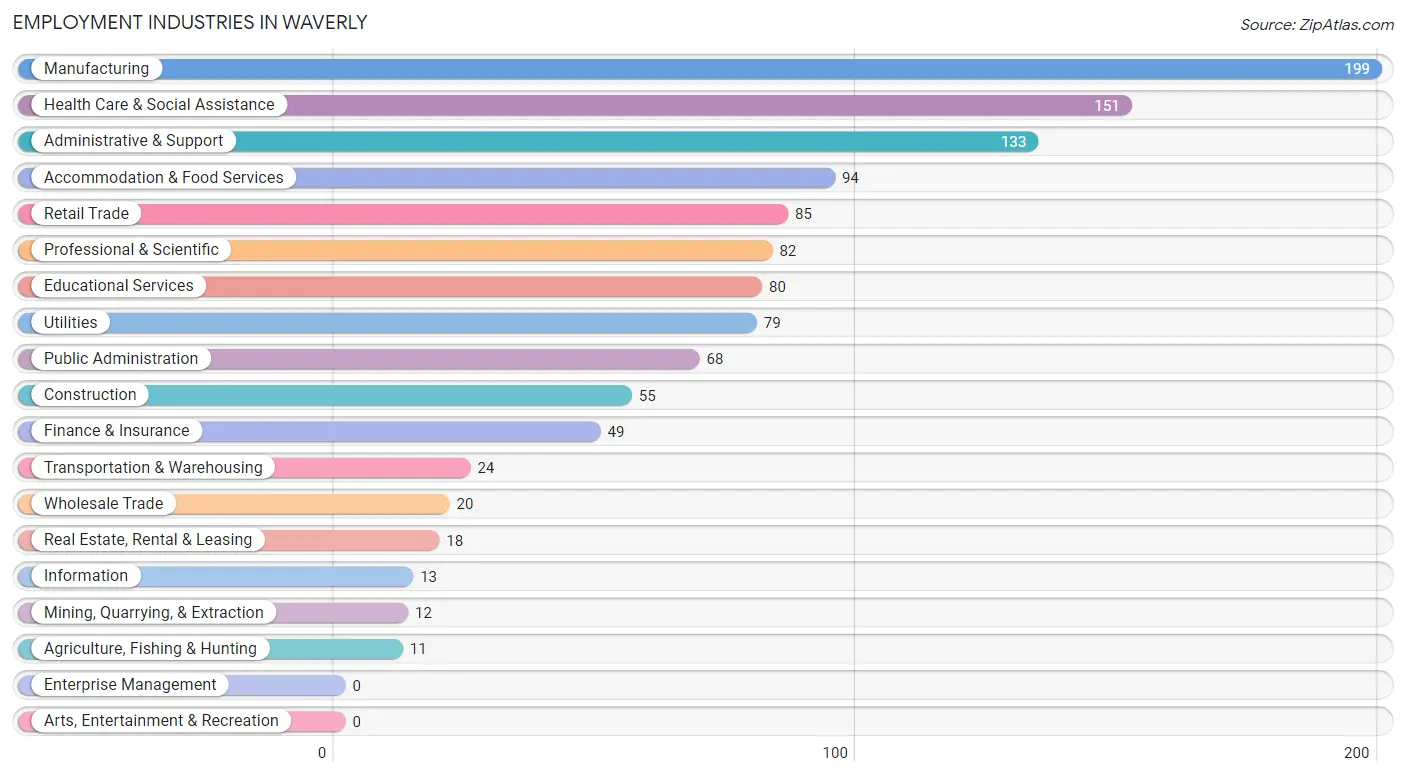
Employment Industries in Waverly
The major employment industries in Waverly include Manufacturing (199 | 16.3%), Health Care & Social Assistance (151 | 12.3%), Administrative & Support (133 | 10.9%), Accommodation & Food Services (94 | 7.7%), and Retail Trade (85 | 7.0%).
Employment Industries by Sex in Waverly
The Waverly industries that see more men than women are Construction (100.0%), Transportation & Warehousing (100.0%), and Real Estate, Rental & Leasing (100.0%), whereas the industries that tend to have a higher number of women are Information (100.0%), Finance & Insurance (100.0%), and Professional & Scientific (76.8%).
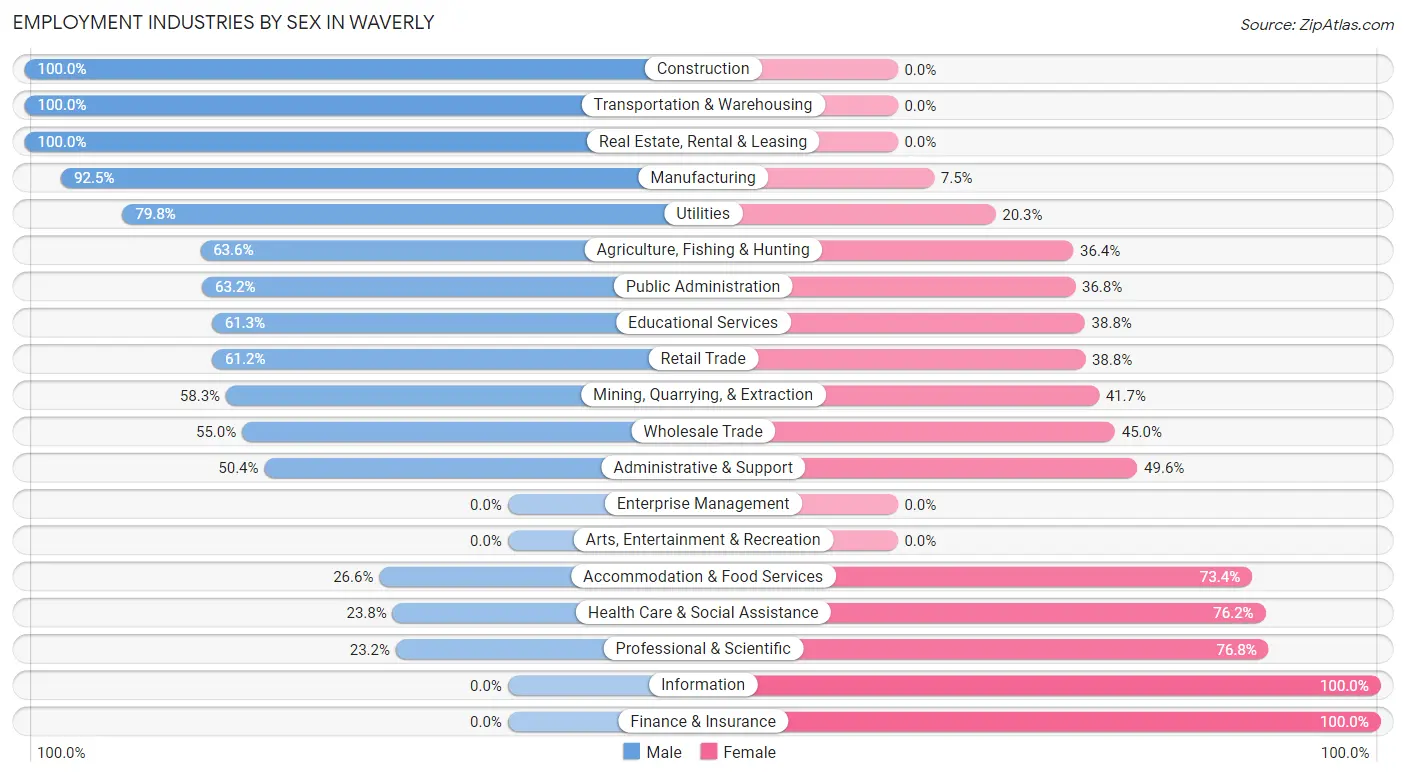
| Industry | Male | Female |
| Agriculture, Fishing & Hunting | 7 (63.6%) | 4 (36.4%) |
| Mining, Quarrying, & Extraction | 7 (58.3%) | 5 (41.7%) |
| Construction | 55 (100.0%) | 0 (0.0%) |
| Manufacturing | 184 (92.5%) | 15 (7.5%) |
| Wholesale Trade | 11 (55.0%) | 9 (45.0%) |
| Retail Trade | 52 (61.2%) | 33 (38.8%) |
| Transportation & Warehousing | 24 (100.0%) | 0 (0.0%) |
| Utilities | 63 (79.7%) | 16 (20.3%) |
| Information | 0 (0.0%) | 13 (100.0%) |
| Finance & Insurance | 0 (0.0%) | 49 (100.0%) |
| Real Estate, Rental & Leasing | 18 (100.0%) | 0 (0.0%) |
| Professional & Scientific | 19 (23.2%) | 63 (76.8%) |
| Enterprise Management | 0 (0.0%) | 0 (0.0%) |
| Administrative & Support | 67 (50.4%) | 66 (49.6%) |
| Educational Services | 49 (61.3%) | 31 (38.8%) |
| Health Care & Social Assistance | 36 (23.8%) | 115 (76.2%) |
| Arts, Entertainment & Recreation | 0 (0.0%) | 0 (0.0%) |
| Accommodation & Food Services | 25 (26.6%) | 69 (73.4%) |
| Public Administration | 43 (63.2%) | 25 (36.8%) |
| Total | 700 (57.2%) | 523 (42.8%) |
Education in Waverly
School Enrollment in Waverly
The most common levels of schooling among the 668 students in Waverly are elementary school (183 | 27.4%), high school (163 | 24.4%), and middle school (124 | 18.6%).
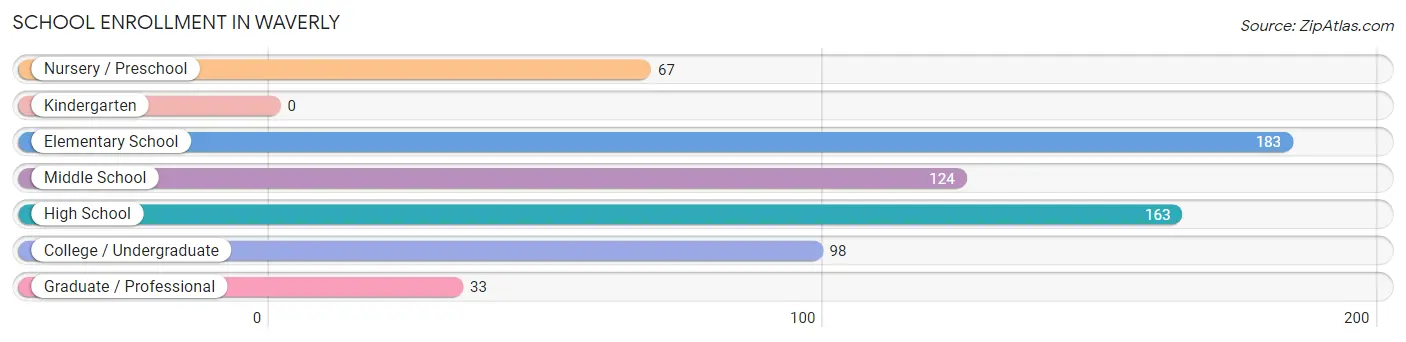
| School Level | # Students | % Students |
| Nursery / Preschool | 67 | 10.0% |
| Kindergarten | 0 | 0.0% |
| Elementary School | 183 | 27.4% |
| Middle School | 124 | 18.6% |
| High School | 163 | 24.4% |
| College / Undergraduate | 98 | 14.7% |
| Graduate / Professional | 33 | 4.9% |
| Total | 668 | 100.0% |
School Enrollment by Age by Funding Source in Waverly
Out of a total of 668 students who are enrolled in schools in Waverly, 82 (12.3%) attend a private institution, while the remaining 586 (87.7%) are enrolled in public schools. The age group of 5 to 9 year old has the highest likelihood of being enrolled in private schools, with 57 (26.9% in the age bracket) enrolled. Conversely, the age group of 3 to 4 year olds has the lowest likelihood of being enrolled in a private school, with 11 (100.0% in the age bracket) attending a public institution.
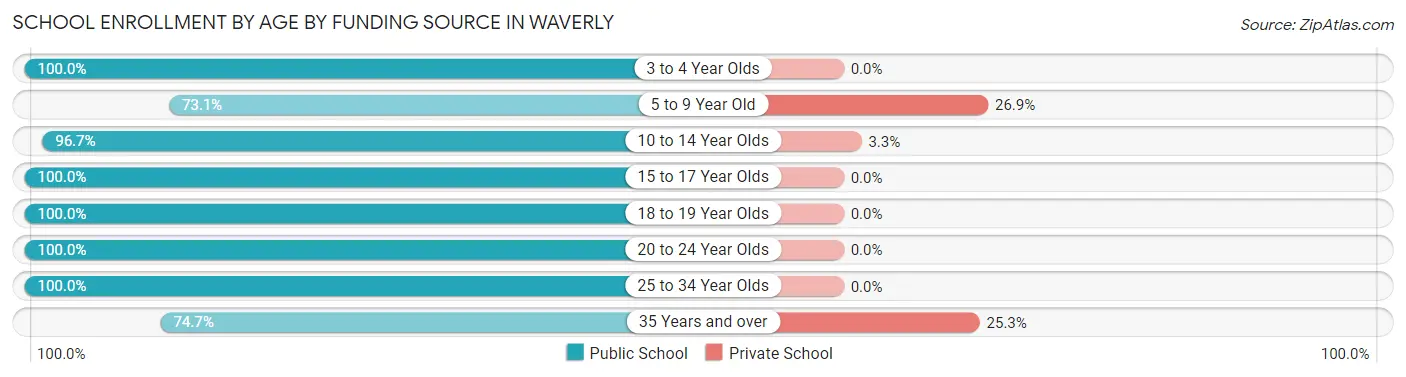
| Age Bracket | Public School | Private School |
| 3 to 4 Year Olds | 11 (100.0%) | 0 (0.0%) |
| 5 to 9 Year Old | 155 (73.1%) | 57 (26.9%) |
| 10 to 14 Year Olds | 146 (96.7%) | 5 (3.3%) |
| 15 to 17 Year Olds | 150 (100.0%) | 0 (0.0%) |
| 18 to 19 Year Olds | 13 (100.0%) | 0 (0.0%) |
| 20 to 24 Year Olds | 13 (100.0%) | 0 (0.0%) |
| 25 to 34 Year Olds | 39 (100.0%) | 0 (0.0%) |
| 35 Years and over | 59 (74.7%) | 20 (25.3%) |
| Total | 586 (87.7%) | 82 (12.3%) |
Educational Attainment by Field of Study in Waverly
Education (81 | 24.2%), bio, nature & agricultural (39 | 11.7%), liberal arts & history (38 | 11.4%), visual & performing arts (33 | 9.9%), and psychology (29 | 8.7%) are the most common fields of study among 334 individuals in Waverly who have obtained a bachelor's degree or higher.
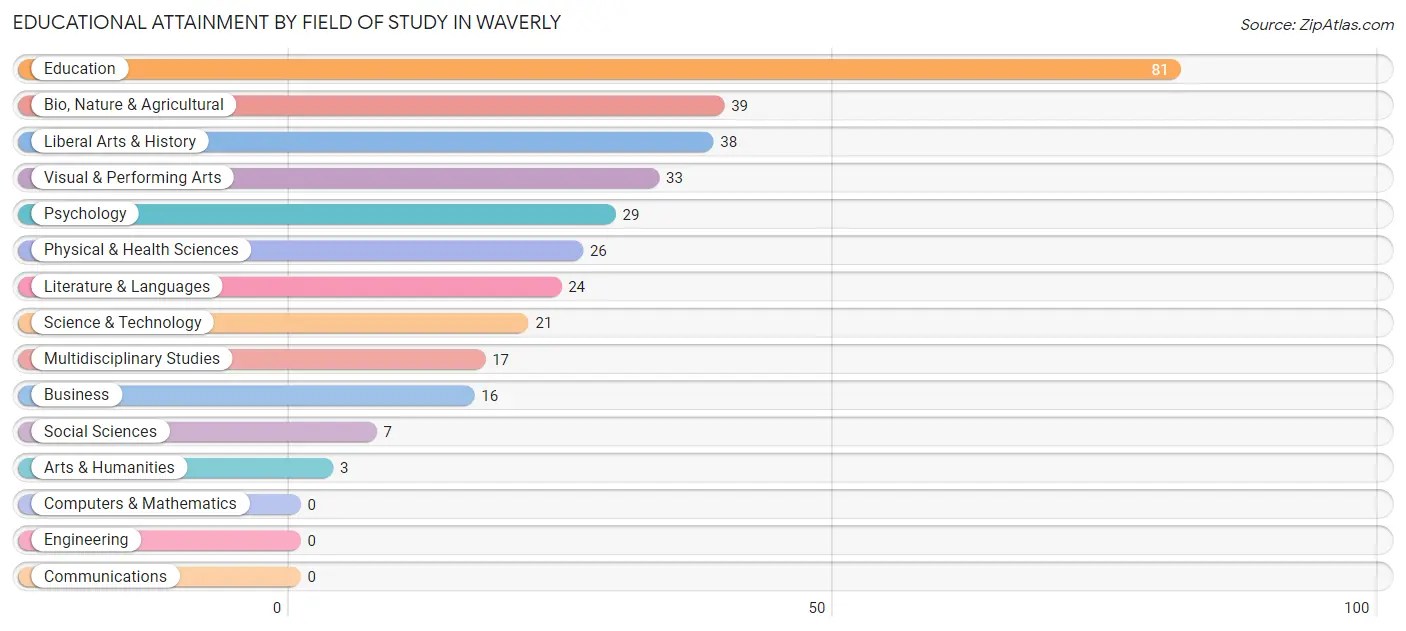
| Field of Study | # Graduates | % Graduates |
| Computers & Mathematics | 0 | 0.0% |
| Bio, Nature & Agricultural | 39 | 11.7% |
| Physical & Health Sciences | 26 | 7.8% |
| Psychology | 29 | 8.7% |
| Social Sciences | 7 | 2.1% |
| Engineering | 0 | 0.0% |
| Multidisciplinary Studies | 17 | 5.1% |
| Science & Technology | 21 | 6.3% |
| Business | 16 | 4.8% |
| Education | 81 | 24.2% |
| Literature & Languages | 24 | 7.2% |
| Liberal Arts & History | 38 | 11.4% |
| Visual & Performing Arts | 33 | 9.9% |
| Communications | 0 | 0.0% |
| Arts & Humanities | 3 | 0.9% |
| Total | 334 | 100.0% |
Transportation & Commute in Waverly
Vehicle Availability by Sex in Waverly
The most prevalent vehicle ownership categories in Waverly are males with 2 vehicles (290, accounting for 42.0%) and females with 2 vehicles (227, making up 57.0%).
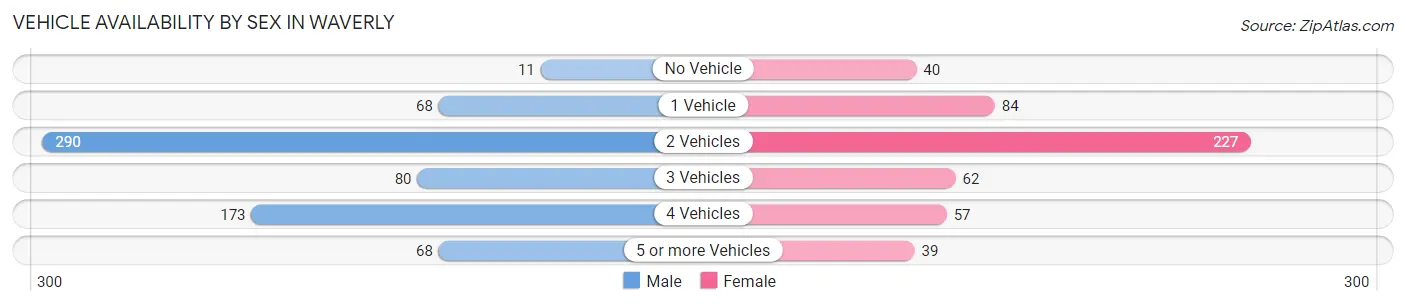
| Vehicles Available | Male | Female |
| No Vehicle | 11 (1.6%) | 40 (7.9%) |
| 1 Vehicle | 68 (9.9%) | 84 (16.5%) |
| 2 Vehicles | 290 (42.0%) | 227 (44.6%) |
| 3 Vehicles | 80 (11.6%) | 62 (12.2%) |
| 4 Vehicles | 173 (25.1%) | 57 (11.2%) |
| 5 or more Vehicles | 68 (9.9%) | 39 (7.7%) |
| Total | 690 (100.0%) | 509 (100.0%) |
Commute Time in Waverly
The most frequently occuring commute durations in Waverly are 30 to 34 minutes (230 commuters, 20.2%), 45 to 59 minutes (213 commuters, 18.7%), and 15 to 19 minutes (153 commuters, 13.4%).
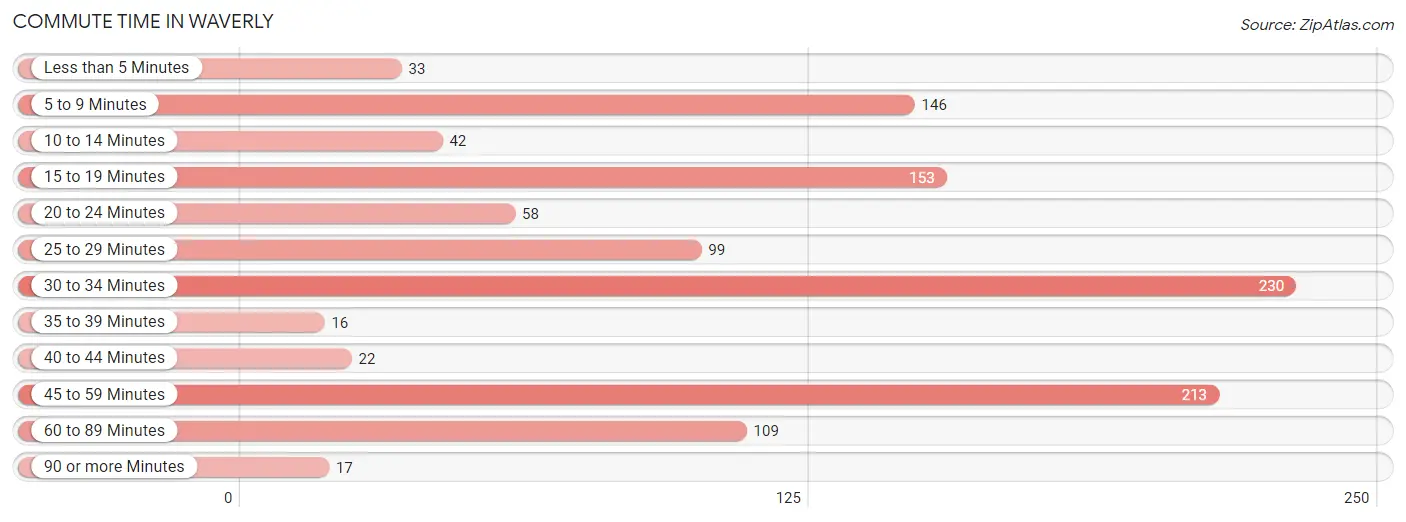
| Commute Time | # Commuters | % Commuters |
| Less than 5 Minutes | 33 | 2.9% |
| 5 to 9 Minutes | 146 | 12.8% |
| 10 to 14 Minutes | 42 | 3.7% |
| 15 to 19 Minutes | 153 | 13.4% |
| 20 to 24 Minutes | 58 | 5.1% |
| 25 to 29 Minutes | 99 | 8.7% |
| 30 to 34 Minutes | 230 | 20.2% |
| 35 to 39 Minutes | 16 | 1.4% |
| 40 to 44 Minutes | 22 | 1.9% |
| 45 to 59 Minutes | 213 | 18.7% |
| 60 to 89 Minutes | 109 | 9.6% |
| 90 or more Minutes | 17 | 1.5% |
Commute Time by Sex in Waverly
The most common commute times in Waverly are 30 to 34 minutes (164 commuters, 24.3%) for males and 15 to 19 minutes (122 commuters, 26.4%) for females.
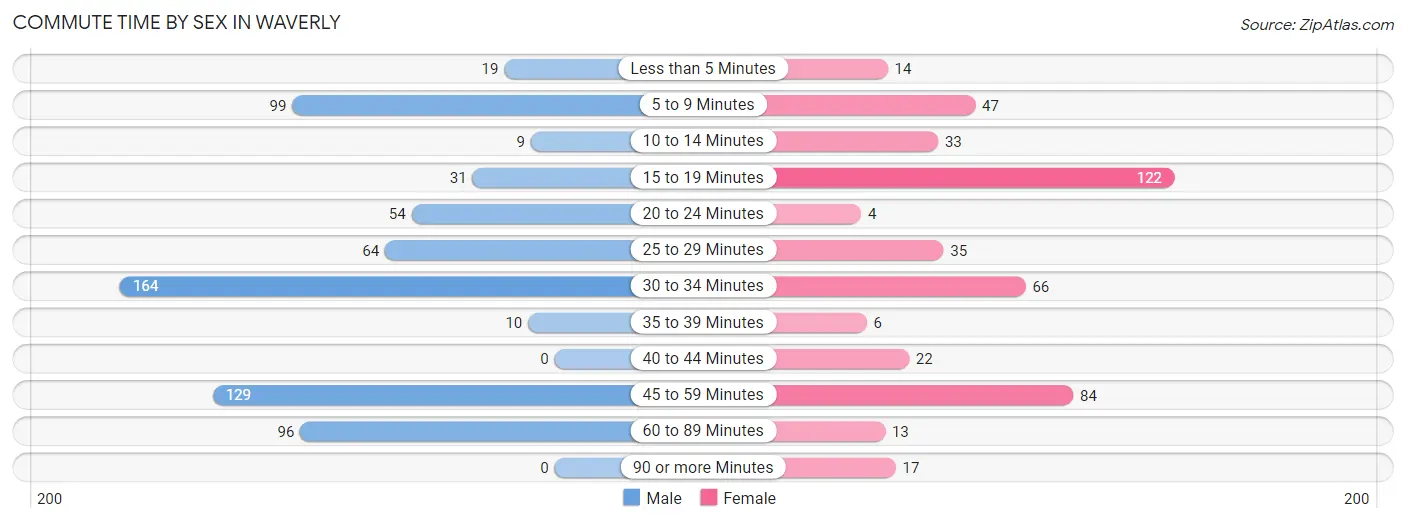
| Commute Time | Male | Female |
| Less than 5 Minutes | 19 (2.8%) | 14 (3.0%) |
| 5 to 9 Minutes | 99 (14.7%) | 47 (10.2%) |
| 10 to 14 Minutes | 9 (1.3%) | 33 (7.1%) |
| 15 to 19 Minutes | 31 (4.6%) | 122 (26.4%) |
| 20 to 24 Minutes | 54 (8.0%) | 4 (0.9%) |
| 25 to 29 Minutes | 64 (9.5%) | 35 (7.6%) |
| 30 to 34 Minutes | 164 (24.3%) | 66 (14.2%) |
| 35 to 39 Minutes | 10 (1.5%) | 6 (1.3%) |
| 40 to 44 Minutes | 0 (0.0%) | 22 (4.8%) |
| 45 to 59 Minutes | 129 (19.1%) | 84 (18.1%) |
| 60 to 89 Minutes | 96 (14.2%) | 13 (2.8%) |
| 90 or more Minutes | 0 (0.0%) | 17 (3.7%) |
Time of Departure to Work by Sex in Waverly
The most frequent times of departure to work in Waverly are 5:00 AM to 5:29 AM (122, 18.1%) for males and 6:00 AM to 6:29 AM (86, 18.6%) for females.
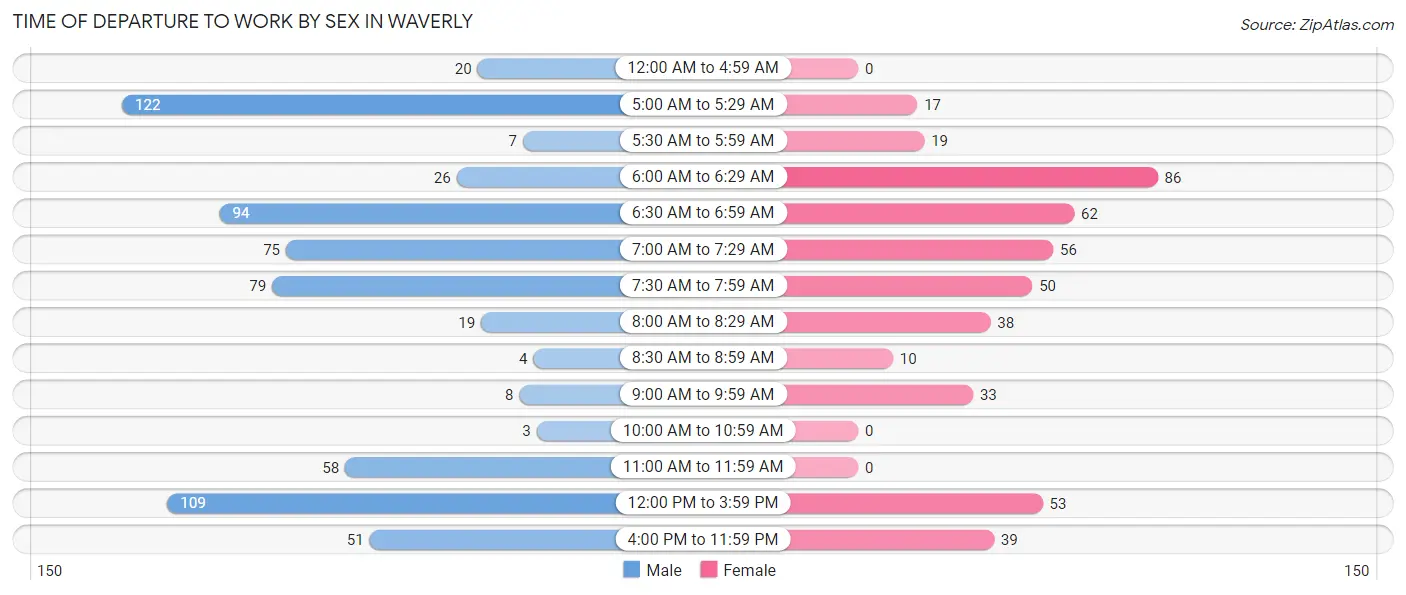
| Time of Departure | Male | Female |
| 12:00 AM to 4:59 AM | 20 (3.0%) | 0 (0.0%) |
| 5:00 AM to 5:29 AM | 122 (18.1%) | 17 (3.7%) |
| 5:30 AM to 5:59 AM | 7 (1.0%) | 19 (4.1%) |
| 6:00 AM to 6:29 AM | 26 (3.8%) | 86 (18.6%) |
| 6:30 AM to 6:59 AM | 94 (13.9%) | 62 (13.4%) |
| 7:00 AM to 7:29 AM | 75 (11.1%) | 56 (12.1%) |
| 7:30 AM to 7:59 AM | 79 (11.7%) | 50 (10.8%) |
| 8:00 AM to 8:29 AM | 19 (2.8%) | 38 (8.2%) |
| 8:30 AM to 8:59 AM | 4 (0.6%) | 10 (2.2%) |
| 9:00 AM to 9:59 AM | 8 (1.2%) | 33 (7.1%) |
| 10:00 AM to 10:59 AM | 3 (0.4%) | 0 (0.0%) |
| 11:00 AM to 11:59 AM | 58 (8.6%) | 0 (0.0%) |
| 12:00 PM to 3:59 PM | 109 (16.2%) | 53 (11.5%) |
| 4:00 PM to 11:59 PM | 51 (7.6%) | 39 (8.4%) |
| Total | 675 (100.0%) | 463 (100.0%) |
Housing Occupancy in Waverly
Occupancy by Ownership in Waverly
Of the total 878 dwellings in Waverly, owner-occupied units account for 473 (53.9%), while renter-occupied units make up 405 (46.1%).
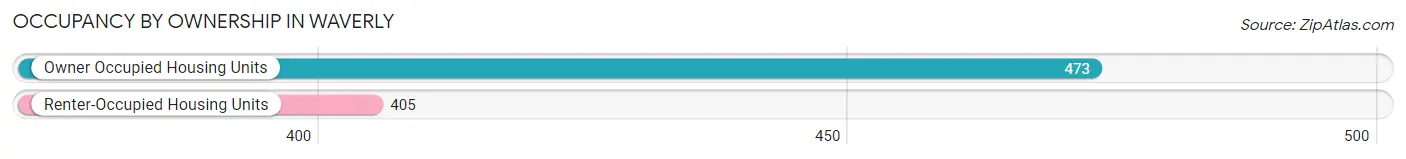
| Occupancy | # Housing Units | % Housing Units |
| Owner Occupied Housing Units | 473 | 53.9% |
| Renter-Occupied Housing Units | 405 | 46.1% |
| Total Occupied Housing Units | 878 | 100.0% |
Occupancy by Household Size in Waverly
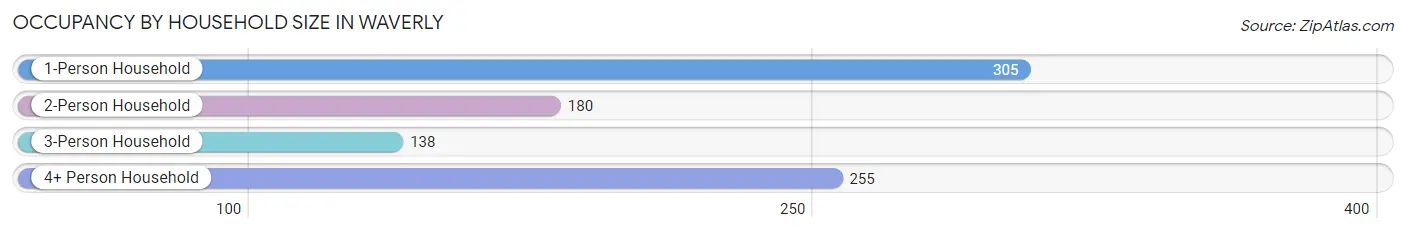
| Household Size | # Housing Units | % Housing Units |
| 1-Person Household | 305 | 34.7% |
| 2-Person Household | 180 | 20.5% |
| 3-Person Household | 138 | 15.7% |
| 4+ Person Household | 255 | 29.0% |
| Total Housing Units | 878 | 100.0% |
Occupancy by Ownership by Household Size in Waverly
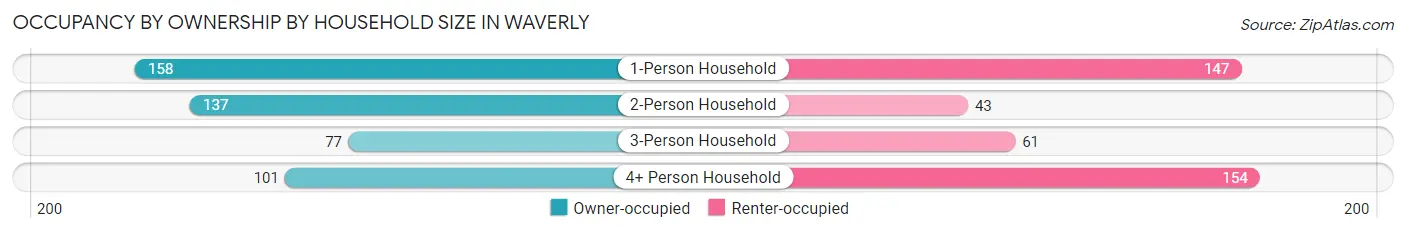
| Household Size | Owner-occupied | Renter-occupied |
| 1-Person Household | 158 (51.8%) | 147 (48.2%) |
| 2-Person Household | 137 (76.1%) | 43 (23.9%) |
| 3-Person Household | 77 (55.8%) | 61 (44.2%) |
| 4+ Person Household | 101 (39.6%) | 154 (60.4%) |
| Total Housing Units | 473 (53.9%) | 405 (46.1%) |
Occupancy by Educational Attainment in Waverly
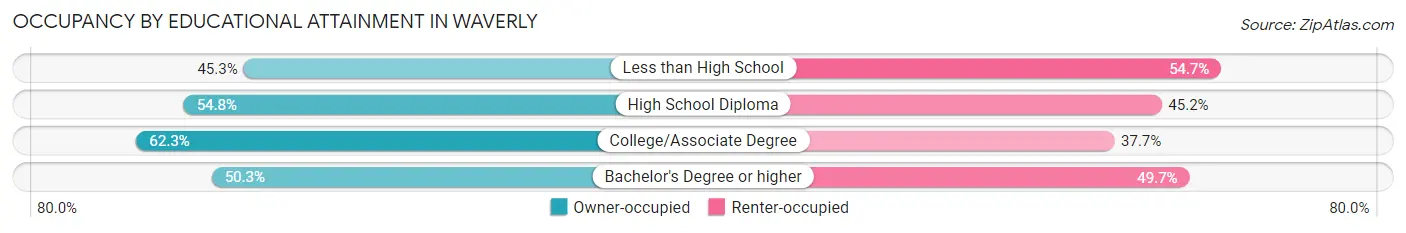
| Household Size | Owner-occupied | Renter-occupied |
| Less than High School | 96 (45.3%) | 116 (54.7%) |
| High School Diploma | 138 (54.8%) | 114 (45.2%) |
| College/Associate Degree | 160 (62.3%) | 97 (37.7%) |
| Bachelor's Degree or higher | 79 (50.3%) | 78 (49.7%) |
Occupancy by Age of Householder in Waverly
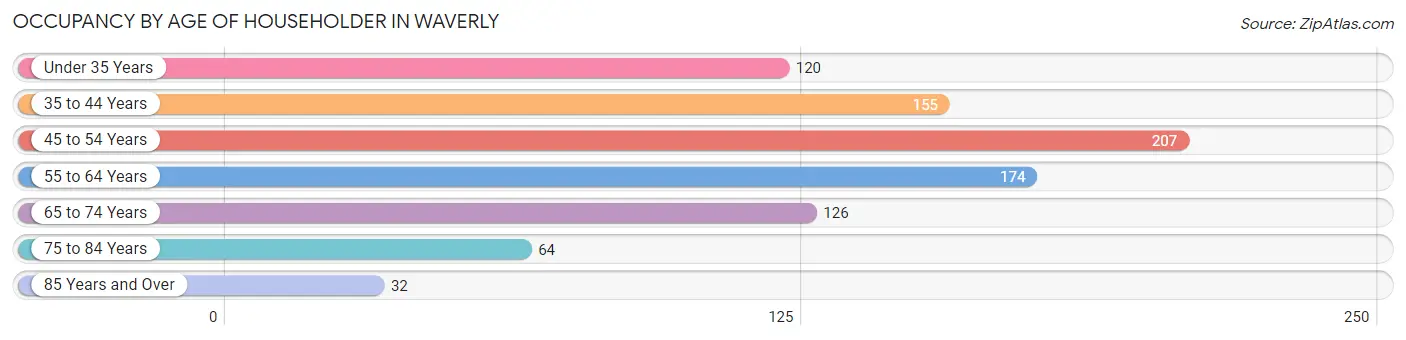
| Age Bracket | # Households | % Households |
| Under 35 Years | 120 | 13.7% |
| 35 to 44 Years | 155 | 17.6% |
| 45 to 54 Years | 207 | 23.6% |
| 55 to 64 Years | 174 | 19.8% |
| 65 to 74 Years | 126 | 14.3% |
| 75 to 84 Years | 64 | 7.3% |
| 85 Years and Over | 32 | 3.6% |
| Total | 878 | 100.0% |
Housing Finances in Waverly
Median Income by Occupancy in Waverly
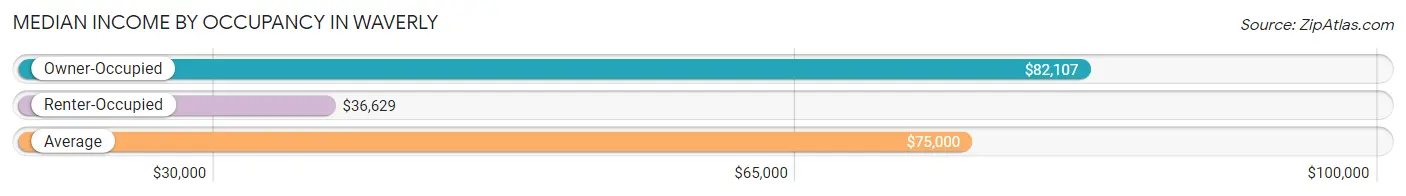
| Occupancy Type | # Households | Median Income |
| Owner-Occupied | 473 (53.9%) | $82,107 |
| Renter-Occupied | 405 (46.1%) | $36,629 |
| Average | 878 (100.0%) | $75,000 |
Occupancy by Householder Income Bracket in Waverly
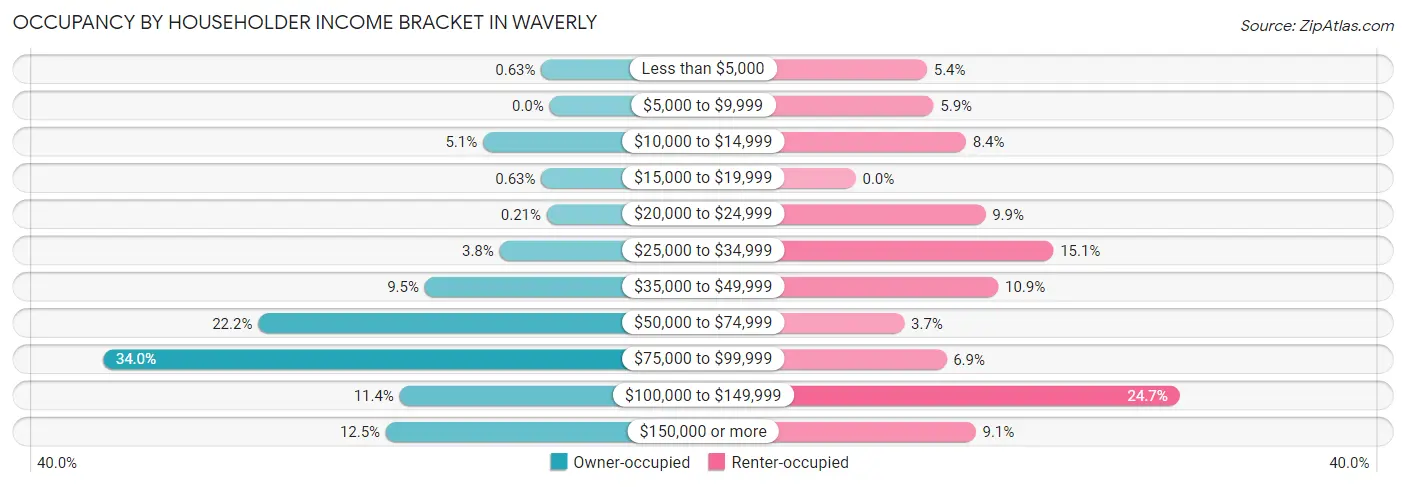
| Income Bracket | Owner-occupied | Renter-occupied |
| Less than $5,000 | 3 (0.6%) | 22 (5.4%) |
| $5,000 to $9,999 | 0 (0.0%) | 24 (5.9%) |
| $10,000 to $14,999 | 24 (5.1%) | 34 (8.4%) |
| $15,000 to $19,999 | 3 (0.6%) | 0 (0.0%) |
| $20,000 to $24,999 | 1 (0.2%) | 40 (9.9%) |
| $25,000 to $34,999 | 18 (3.8%) | 61 (15.1%) |
| $35,000 to $49,999 | 45 (9.5%) | 44 (10.9%) |
| $50,000 to $74,999 | 105 (22.2%) | 15 (3.7%) |
| $75,000 to $99,999 | 161 (34.0%) | 28 (6.9%) |
| $100,000 to $149,999 | 54 (11.4%) | 100 (24.7%) |
| $150,000 or more | 59 (12.5%) | 37 (9.1%) |
| Total | 473 (100.0%) | 405 (100.0%) |
Monthly Housing Cost Tiers in Waverly
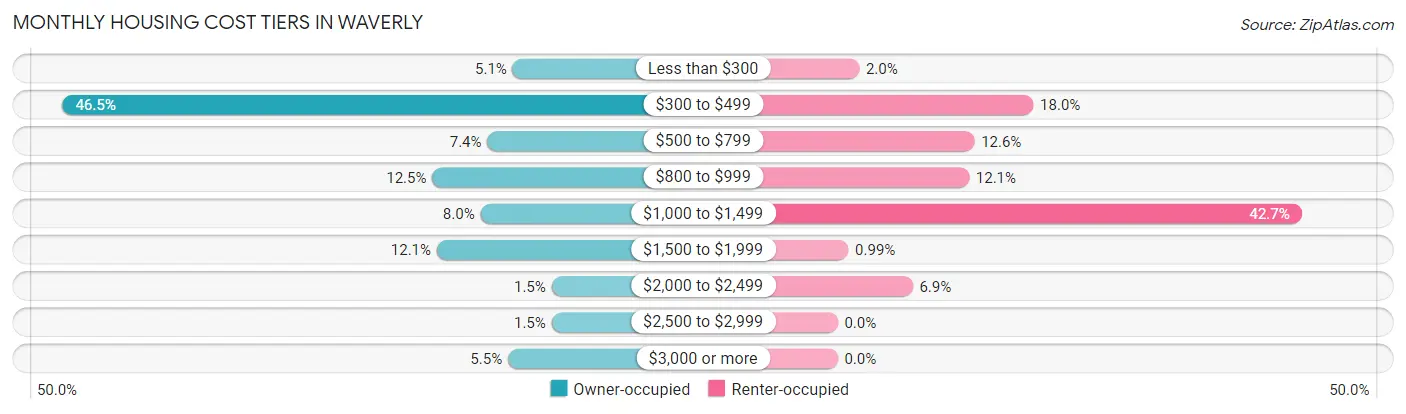
| Monthly Cost | Owner-occupied | Renter-occupied |
| Less than $300 | 24 (5.1%) | 8 (2.0%) |
| $300 to $499 | 220 (46.5%) | 73 (18.0%) |
| $500 to $799 | 35 (7.4%) | 51 (12.6%) |
| $800 to $999 | 59 (12.5%) | 49 (12.1%) |
| $1,000 to $1,499 | 38 (8.0%) | 173 (42.7%) |
| $1,500 to $1,999 | 57 (12.0%) | 4 (1.0%) |
| $2,000 to $2,499 | 7 (1.5%) | 28 (6.9%) |
| $2,500 to $2,999 | 7 (1.5%) | 0 (0.0%) |
| $3,000 or more | 26 (5.5%) | 0 (0.0%) |
| Total | 473 (100.0%) | 405 (100.0%) |
Physical Housing Characteristics in Waverly
Housing Structures in Waverly
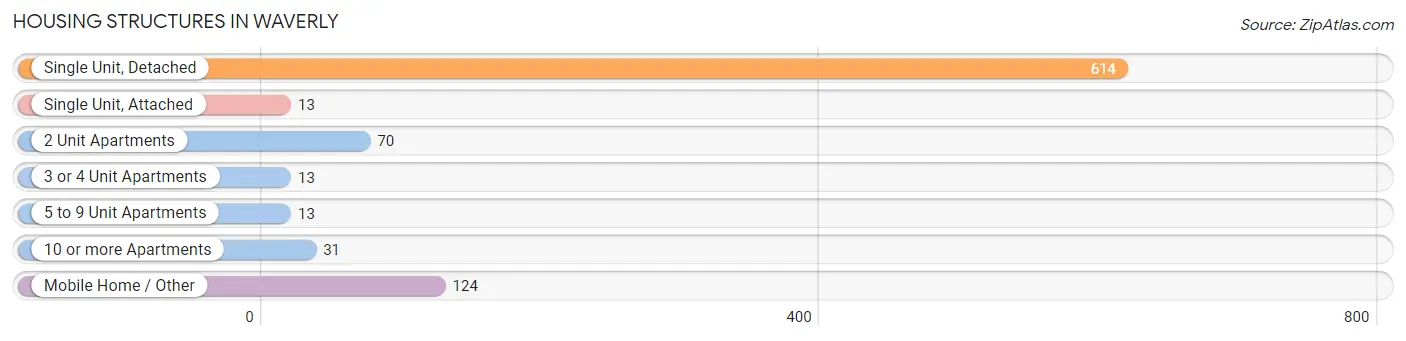
| Structure Type | # Housing Units | % Housing Units |
| Single Unit, Detached | 614 | 69.9% |
| Single Unit, Attached | 13 | 1.5% |
| 2 Unit Apartments | 70 | 8.0% |
| 3 or 4 Unit Apartments | 13 | 1.5% |
| 5 to 9 Unit Apartments | 13 | 1.5% |
| 10 or more Apartments | 31 | 3.5% |
| Mobile Home / Other | 124 | 14.1% |
| Total | 878 | 100.0% |
Housing Structures by Occupancy in Waverly
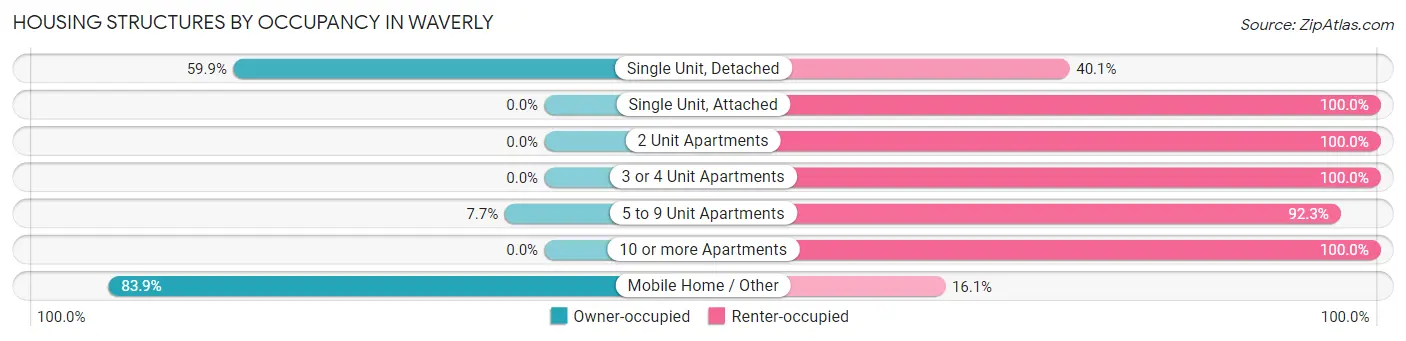
| Structure Type | Owner-occupied | Renter-occupied |
| Single Unit, Detached | 368 (59.9%) | 246 (40.1%) |
| Single Unit, Attached | 0 (0.0%) | 13 (100.0%) |
| 2 Unit Apartments | 0 (0.0%) | 70 (100.0%) |
| 3 or 4 Unit Apartments | 0 (0.0%) | 13 (100.0%) |
| 5 to 9 Unit Apartments | 1 (7.7%) | 12 (92.3%) |
| 10 or more Apartments | 0 (0.0%) | 31 (100.0%) |
| Mobile Home / Other | 104 (83.9%) | 20 (16.1%) |
| Total | 473 (53.9%) | 405 (46.1%) |
Housing Structures by Number of Rooms in Waverly
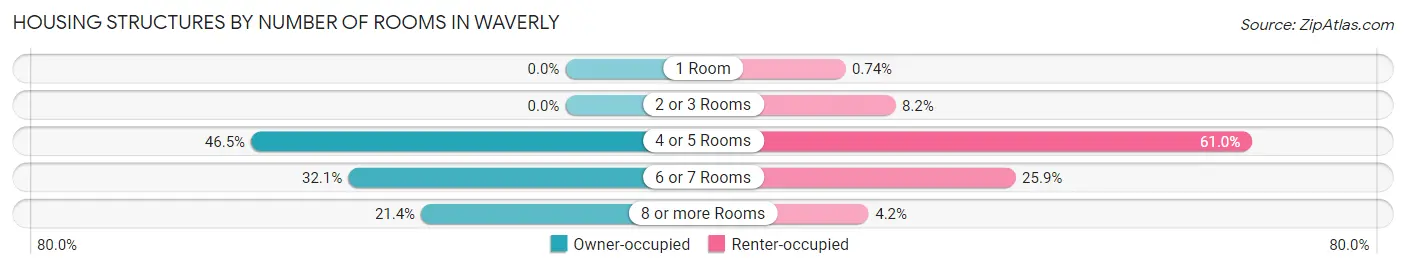
| Number of Rooms | Owner-occupied | Renter-occupied |
| 1 Room | 0 (0.0%) | 3 (0.7%) |
| 2 or 3 Rooms | 0 (0.0%) | 33 (8.2%) |
| 4 or 5 Rooms | 220 (46.5%) | 247 (61.0%) |
| 6 or 7 Rooms | 152 (32.1%) | 105 (25.9%) |
| 8 or more Rooms | 101 (21.3%) | 17 (4.2%) |
| Total | 473 (100.0%) | 405 (100.0%) |
Housing Structure by Heating Type in Waverly
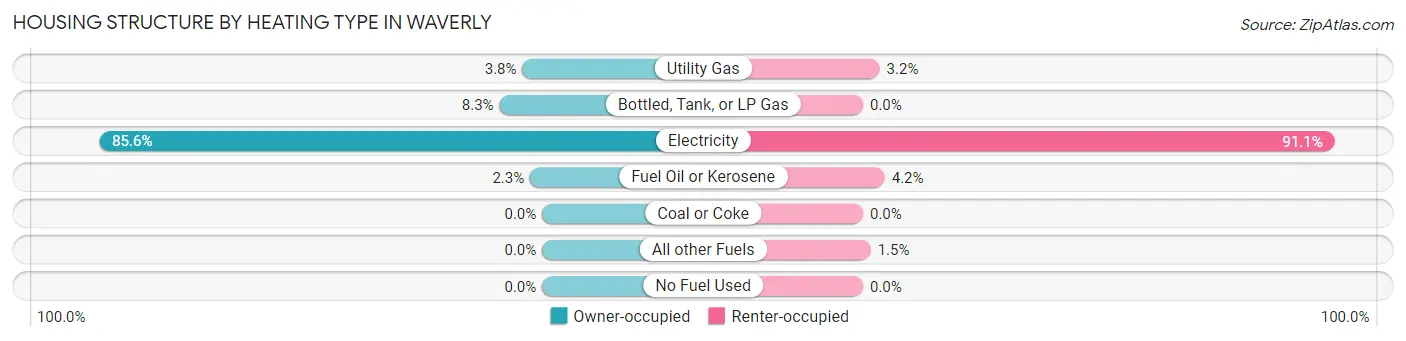
| Heating Type | Owner-occupied | Renter-occupied |
| Utility Gas | 18 (3.8%) | 13 (3.2%) |
| Bottled, Tank, or LP Gas | 39 (8.3%) | 0 (0.0%) |
| Electricity | 405 (85.6%) | 369 (91.1%) |
| Fuel Oil or Kerosene | 11 (2.3%) | 17 (4.2%) |
| Coal or Coke | 0 (0.0%) | 0 (0.0%) |
| All other Fuels | 0 (0.0%) | 6 (1.5%) |
| No Fuel Used | 0 (0.0%) | 0 (0.0%) |
| Total | 473 (100.0%) | 405 (100.0%) |
Household Vehicle Usage in Waverly
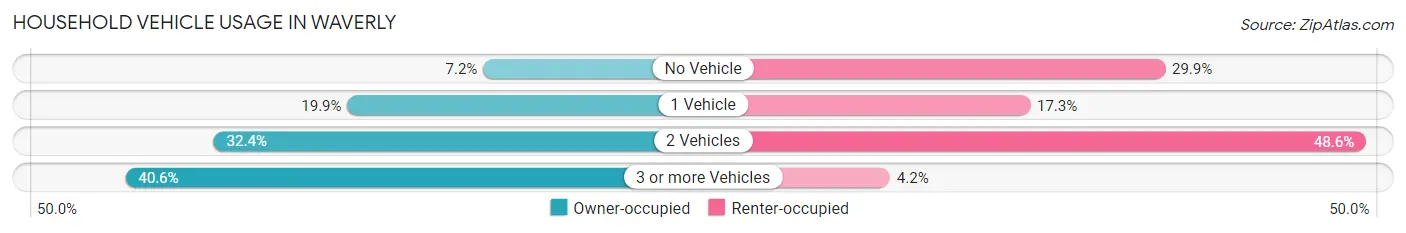
| Vehicles per Household | Owner-occupied | Renter-occupied |
| No Vehicle | 34 (7.2%) | 121 (29.9%) |
| 1 Vehicle | 94 (19.9%) | 70 (17.3%) |
| 2 Vehicles | 153 (32.4%) | 197 (48.6%) |
| 3 or more Vehicles | 192 (40.6%) | 17 (4.2%) |
| Total | 473 (100.0%) | 405 (100.0%) |
Real Estate & Mortgages in Waverly
Real Estate and Mortgage Overview in Waverly
| Characteristic | Without Mortgage | With Mortgage |
| Housing Units | 291 | 182 |
| Median Property Value | $89,600 | $193,500 |
| Median Household Income | $81,417 | $39 |
| Monthly Housing Costs | $447 | $26 |
| Real Estate Taxes | $558 | $17 |
Property Value by Mortgage Status in Waverly
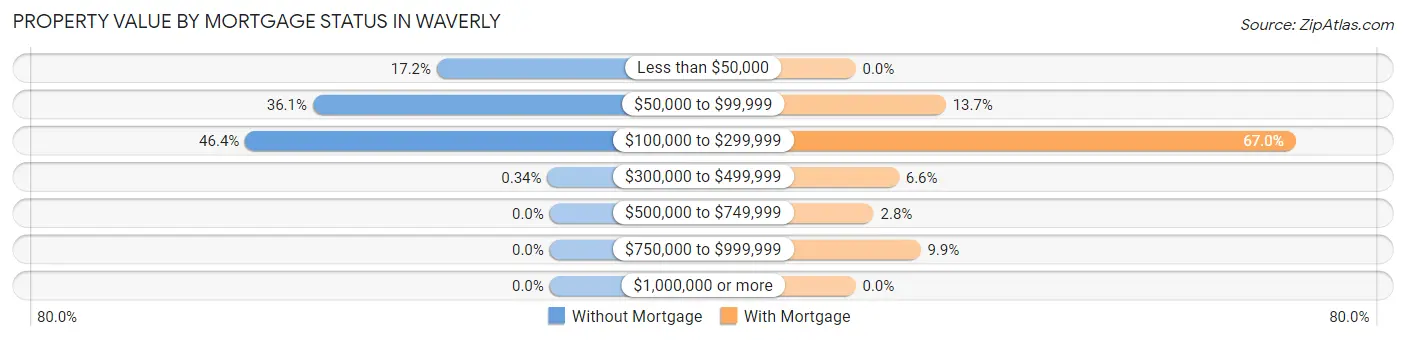
| Property Value | Without Mortgage | With Mortgage |
| Less than $50,000 | 50 (17.2%) | 0 (0.0%) |
| $50,000 to $99,999 | 105 (36.1%) | 25 (13.7%) |
| $100,000 to $299,999 | 135 (46.4%) | 122 (67.0%) |
| $300,000 to $499,999 | 1 (0.3%) | 12 (6.6%) |
| $500,000 to $749,999 | 0 (0.0%) | 5 (2.8%) |
| $750,000 to $999,999 | 0 (0.0%) | 18 (9.9%) |
| $1,000,000 or more | 0 (0.0%) | 0 (0.0%) |
| Total | 291 (100.0%) | 182 (100.0%) |
Household Income by Mortgage Status in Waverly
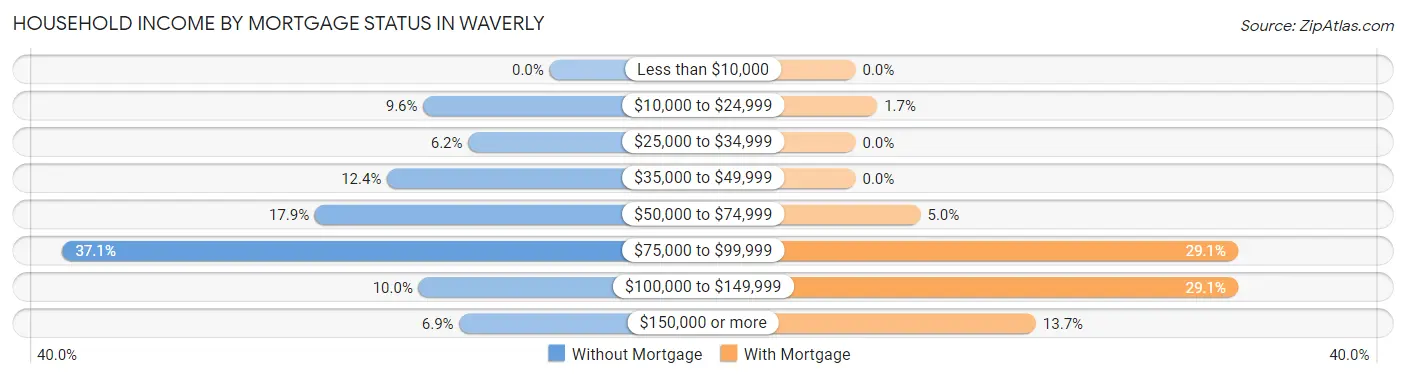
| Household Income | Without Mortgage | With Mortgage |
| Less than $10,000 | 0 (0.0%) | 0 (0.0%) |
| $10,000 to $24,999 | 28 (9.6%) | 3 (1.7%) |
| $25,000 to $34,999 | 18 (6.2%) | 0 (0.0%) |
| $35,000 to $49,999 | 36 (12.4%) | 0 (0.0%) |
| $50,000 to $74,999 | 52 (17.9%) | 9 (5.0%) |
| $75,000 to $99,999 | 108 (37.1%) | 53 (29.1%) |
| $100,000 to $149,999 | 29 (10.0%) | 53 (29.1%) |
| $150,000 or more | 20 (6.9%) | 25 (13.7%) |
| Total | 291 (100.0%) | 182 (100.0%) |
Property Value to Household Income Ratio in Waverly
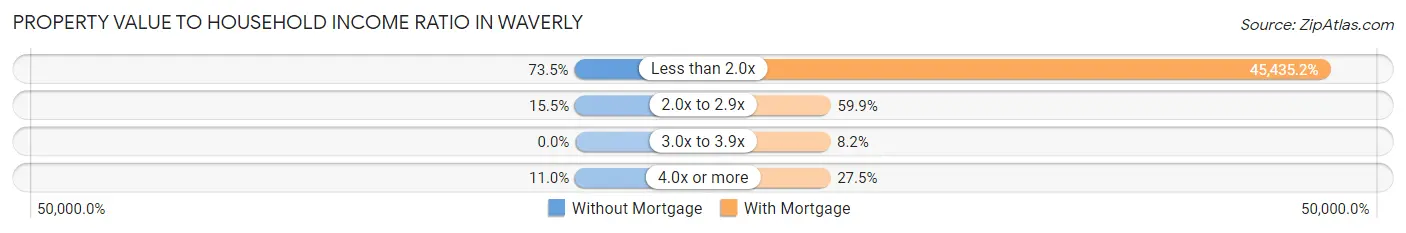
| Value-to-Income Ratio | Without Mortgage | With Mortgage |
| Less than 2.0x | 214 (73.5%) | 82,692 (45,435.2%) |
| 2.0x to 2.9x | 45 (15.5%) | 109 (59.9%) |
| 3.0x to 3.9x | 0 (0.0%) | 15 (8.2%) |
| 4.0x or more | 32 (11.0%) | 50 (27.5%) |
| Total | 291 (100.0%) | 182 (100.0%) |
Real Estate Taxes by Mortgage Status in Waverly
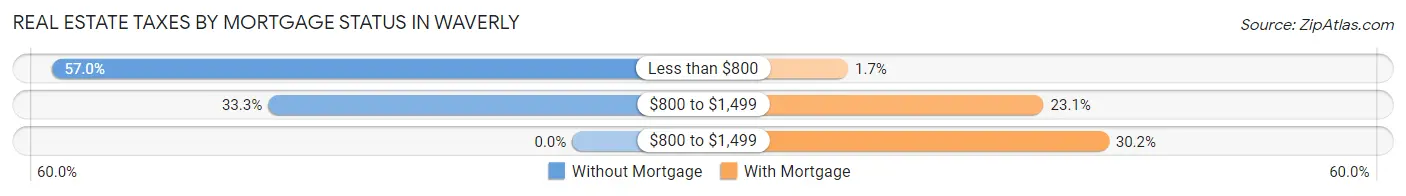
| Property Taxes | Without Mortgage | With Mortgage |
| Less than $800 | 166 (57.0%) | 3 (1.7%) |
| $800 to $1,499 | 97 (33.3%) | 42 (23.1%) |
| $800 to $1,499 | 0 (0.0%) | 55 (30.2%) |
| Total | 291 (100.0%) | 182 (100.0%) |
Health & Disability in Waverly
Health Insurance Coverage by Age in Waverly
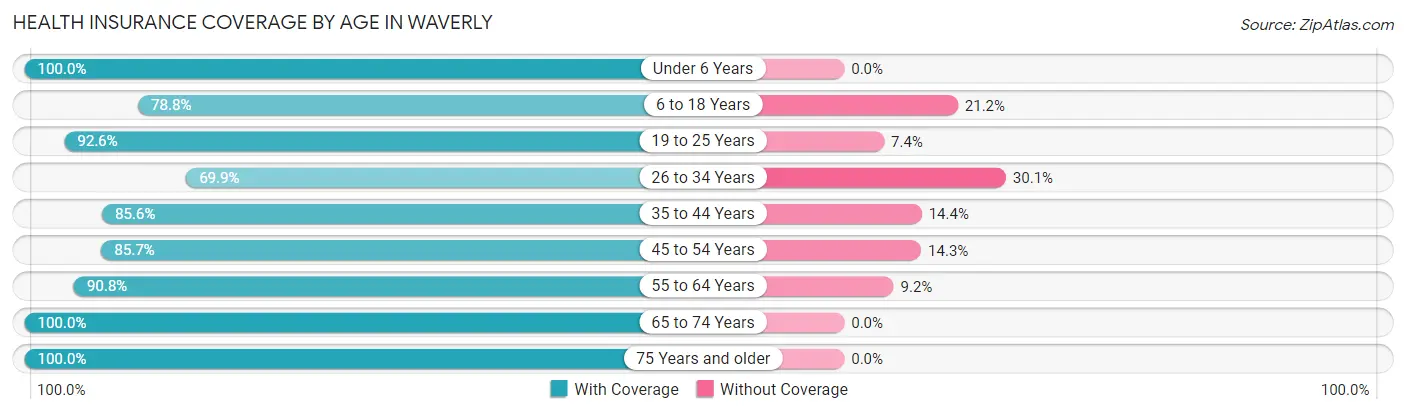
| Age Bracket | With Coverage | Without Coverage |
| Under 6 Years | 264 (100.0%) | 0 (0.0%) |
| 6 to 18 Years | 428 (78.8%) | 115 (21.2%) |
| 19 to 25 Years | 337 (92.6%) | 27 (7.4%) |
| 26 to 34 Years | 204 (69.9%) | 88 (30.1%) |
| 35 to 44 Years | 314 (85.6%) | 53 (14.4%) |
| 45 to 54 Years | 275 (85.7%) | 46 (14.3%) |
| 55 to 64 Years | 227 (90.8%) | 23 (9.2%) |
| 65 to 74 Years | 256 (100.0%) | 0 (0.0%) |
| 75 Years and older | 138 (100.0%) | 0 (0.0%) |
| Total | 2,443 (87.4%) | 352 (12.6%) |
Health Insurance Coverage by Citizenship Status in Waverly
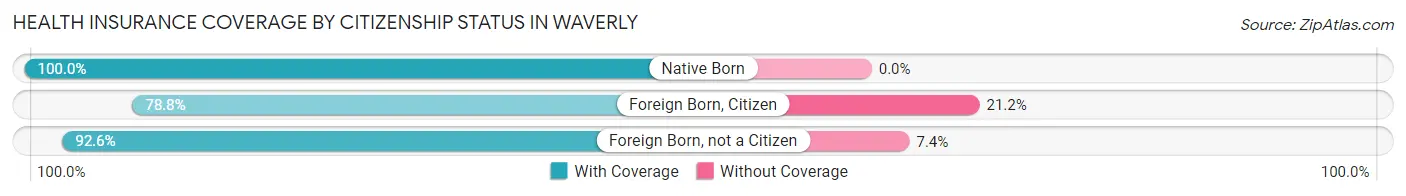
| Citizenship Status | With Coverage | Without Coverage |
| Native Born | 264 (100.0%) | 0 (0.0%) |
| Foreign Born, Citizen | 428 (78.8%) | 115 (21.2%) |
| Foreign Born, not a Citizen | 337 (92.6%) | 27 (7.4%) |
Health Insurance Coverage by Household Income in Waverly
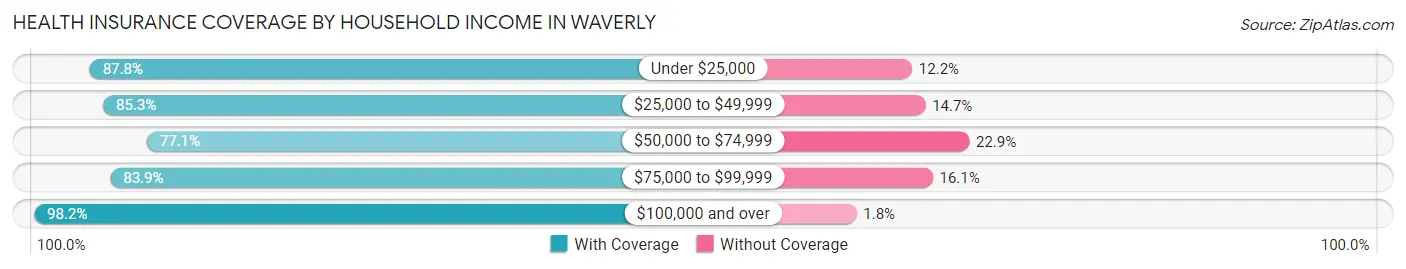
| Household Income | With Coverage | Without Coverage |
| Under $25,000 | 223 (87.8%) | 31 (12.2%) |
| $25,000 to $49,999 | 331 (85.3%) | 57 (14.7%) |
| $50,000 to $74,999 | 542 (77.1%) | 161 (22.9%) |
| $75,000 to $99,999 | 439 (83.9%) | 84 (16.1%) |
| $100,000 and over | 877 (98.2%) | 16 (1.8%) |
Public vs Private Health Insurance Coverage by Age in Waverly
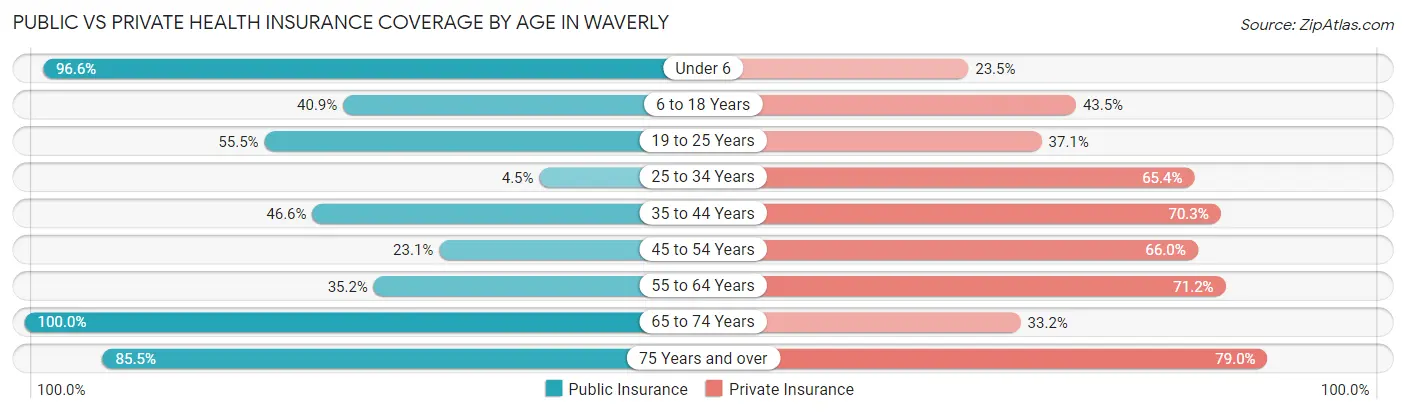
| Age Bracket | Public Insurance | Private Insurance |
| Under 6 | 255 (96.6%) | 62 (23.5%) |
| 6 to 18 Years | 222 (40.9%) | 236 (43.5%) |
| 19 to 25 Years | 202 (55.5%) | 135 (37.1%) |
| 25 to 34 Years | 13 (4.4%) | 191 (65.4%) |
| 35 to 44 Years | 171 (46.6%) | 258 (70.3%) |
| 45 to 54 Years | 74 (23.1%) | 212 (66.0%) |
| 55 to 64 Years | 88 (35.2%) | 178 (71.2%) |
| 65 to 74 Years | 256 (100.0%) | 85 (33.2%) |
| 75 Years and over | 118 (85.5%) | 109 (79.0%) |
| Total | 1,399 (50.0%) | 1,466 (52.4%) |
Disability Status by Sex by Age in Waverly
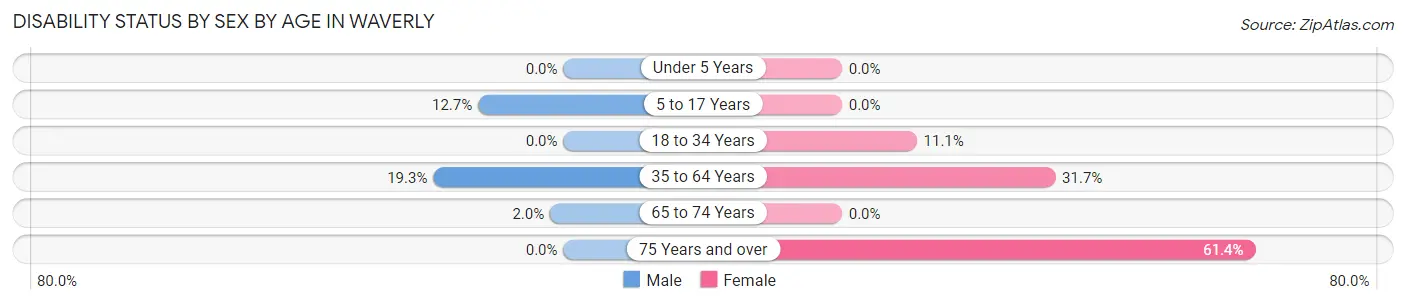
| Age Bracket | Male | Female |
| Under 5 Years | 0 (0.0%) | 0 (0.0%) |
| 5 to 17 Years | 38 (12.7%) | 0 (0.0%) |
| 18 to 34 Years | 0 (0.0%) | 29 (11.1%) |
| 35 to 64 Years | 80 (19.3%) | 166 (31.7%) |
| 65 to 74 Years | 3 (2.0%) | 0 (0.0%) |
| 75 Years and over | 0 (0.0%) | 70 (61.4%) |
Disability Class by Sex by Age in Waverly
Disability Class: Hearing Difficulty
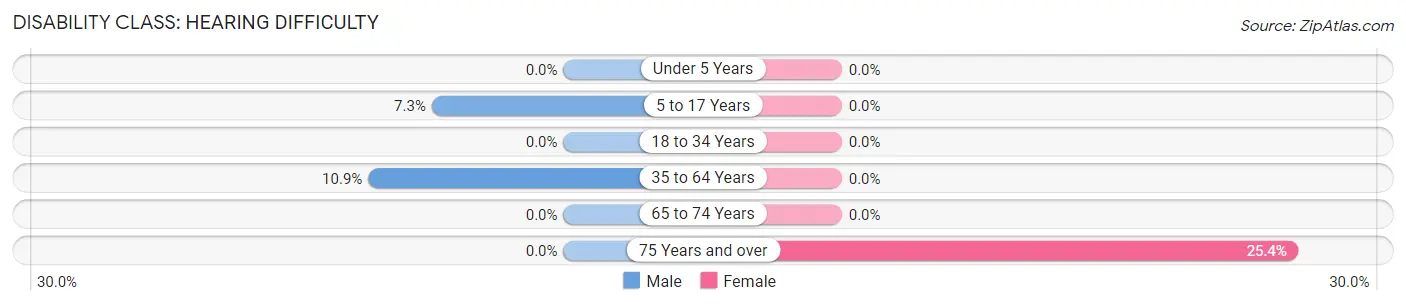
| Age Bracket | Male | Female |
| Under 5 Years | 0 (0.0%) | 0 (0.0%) |
| 5 to 17 Years | 22 (7.3%) | 0 (0.0%) |
| 18 to 34 Years | 0 (0.0%) | 0 (0.0%) |
| 35 to 64 Years | 45 (10.9%) | 0 (0.0%) |
| 65 to 74 Years | 0 (0.0%) | 0 (0.0%) |
| 75 Years and over | 0 (0.0%) | 29 (25.4%) |
Disability Class: Vision Difficulty
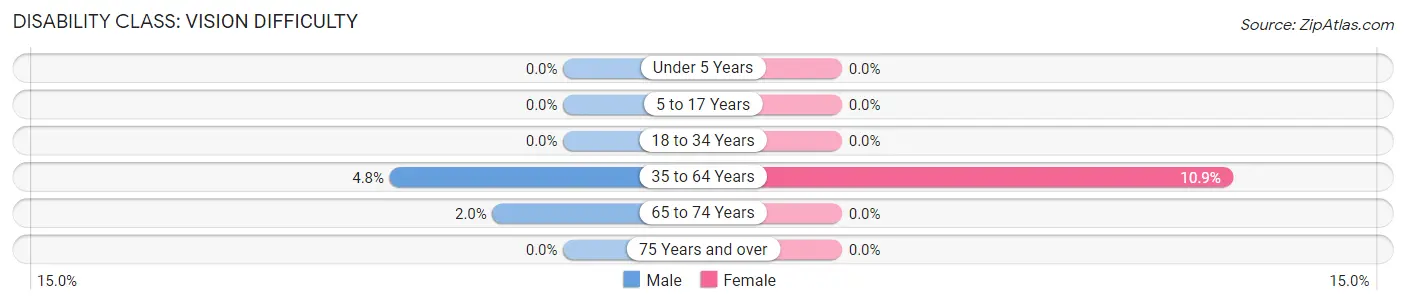
| Age Bracket | Male | Female |
| Under 5 Years | 0 (0.0%) | 0 (0.0%) |
| 5 to 17 Years | 0 (0.0%) | 0 (0.0%) |
| 18 to 34 Years | 0 (0.0%) | 0 (0.0%) |
| 35 to 64 Years | 20 (4.8%) | 57 (10.9%) |
| 65 to 74 Years | 3 (2.0%) | 0 (0.0%) |
| 75 Years and over | 0 (0.0%) | 0 (0.0%) |
Disability Class: Cognitive Difficulty
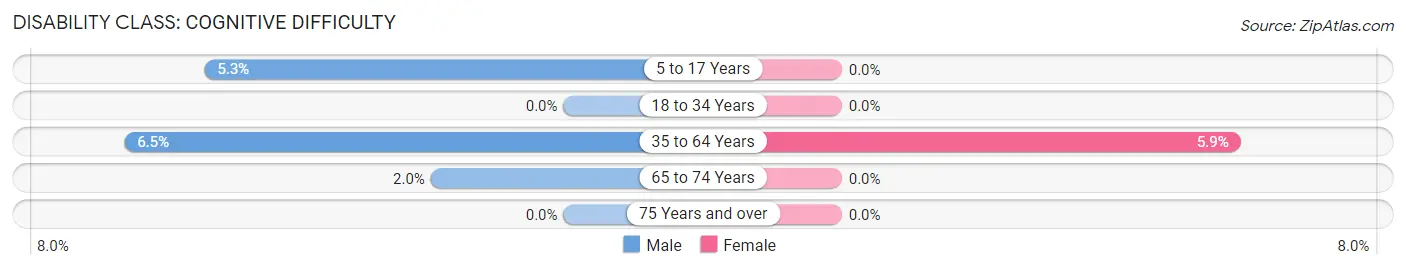
| Age Bracket | Male | Female |
| 5 to 17 Years | 16 (5.3%) | 0 (0.0%) |
| 18 to 34 Years | 0 (0.0%) | 0 (0.0%) |
| 35 to 64 Years | 27 (6.5%) | 31 (5.9%) |
| 65 to 74 Years | 3 (2.0%) | 0 (0.0%) |
| 75 Years and over | 0 (0.0%) | 0 (0.0%) |
Disability Class: Ambulatory Difficulty
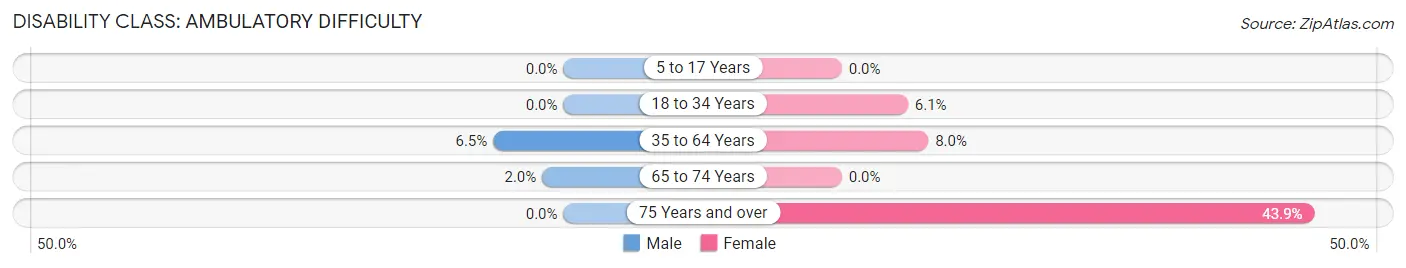
| Age Bracket | Male | Female |
| 5 to 17 Years | 0 (0.0%) | 0 (0.0%) |
| 18 to 34 Years | 0 (0.0%) | 16 (6.1%) |
| 35 to 64 Years | 27 (6.5%) | 42 (8.0%) |
| 65 to 74 Years | 3 (2.0%) | 0 (0.0%) |
| 75 Years and over | 0 (0.0%) | 50 (43.9%) |
Disability Class: Self-Care Difficulty
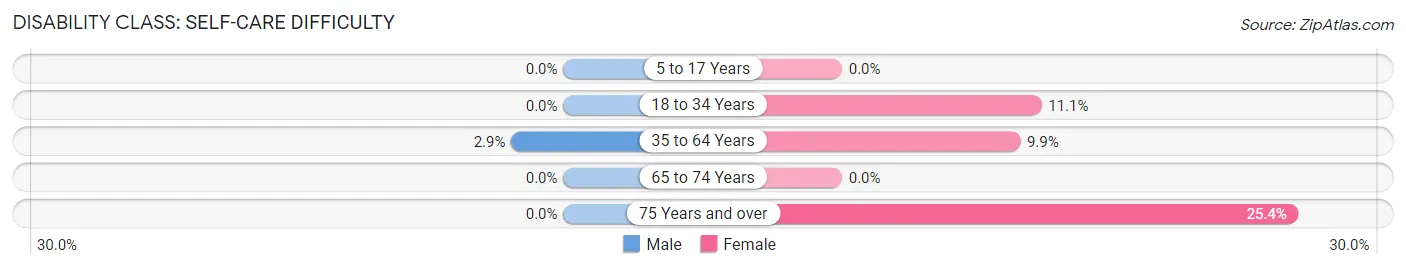
| Age Bracket | Male | Female |
| 5 to 17 Years | 0 (0.0%) | 0 (0.0%) |
| 18 to 34 Years | 0 (0.0%) | 29 (11.1%) |
| 35 to 64 Years | 12 (2.9%) | 52 (9.9%) |
| 65 to 74 Years | 0 (0.0%) | 0 (0.0%) |
| 75 Years and over | 0 (0.0%) | 29 (25.4%) |
Technology Access in Waverly
Computing Device Access in Waverly

| Device Type | # Households | % Households |
| Desktop or Laptop | 509 | 58.0% |
| Smartphone | 709 | 80.7% |
| Tablet | 501 | 57.1% |
| No Computing Device | 130 | 14.8% |
| Total | 878 | 100.0% |
Internet Access in Waverly
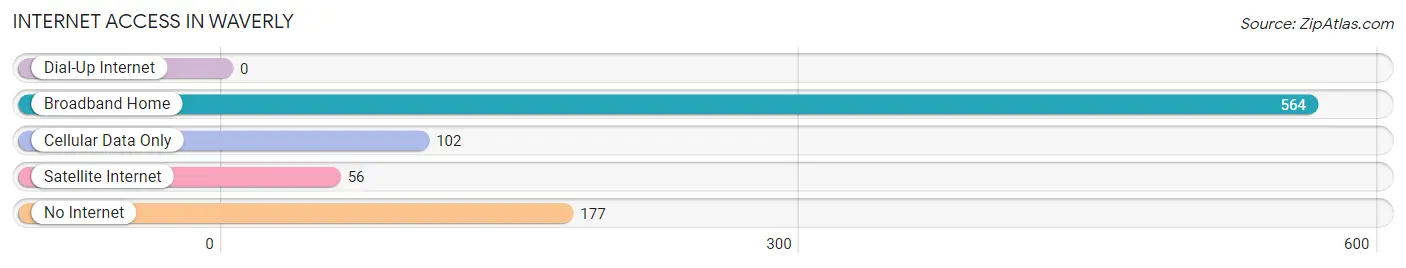
| Internet Type | # Households | % Households |
| Dial-Up Internet | 0 | 0.0% |
| Broadband Home | 564 | 64.2% |
| Cellular Data Only | 102 | 11.6% |
| Satellite Internet | 56 | 6.4% |
| No Internet | 177 | 20.2% |
| Total | 878 | 100.0% |
Waverly Summary
Waverly, Virginia is a small town located in Sussex County, Virginia. It is situated on the banks of the Nottoway River, about 30 miles south of the state capital of Richmond. The town has a population of approximately 2,000 people and is part of the larger Hampton Roads metropolitan area.
History
Waverly was founded in 1790 by William Waverly, a Revolutionary War veteran. The town was named after him and was originally known as Waverlyville. The town was incorporated in 1832 and has remained a small, rural community ever since.
The town was an important stop on the Southside Railroad, which connected Petersburg and Suffolk. The railroad was a major factor in the town's growth and development. The town was also home to a number of mills, including a cotton mill, a grist mill, and a sawmill.
Geography
Waverly is located in the southeastern corner of Virginia, about 30 miles south of the state capital of Richmond. The town is situated on the banks of the Nottoway River, which flows through the town and provides a scenic backdrop. The town is surrounded by rolling hills and farmland, and is located in the Coastal Plain region of Virginia.
The climate in Waverly is humid subtropical, with hot, humid summers and mild winters. The average annual temperature is around 60 degrees Fahrenheit, and the average annual precipitation is around 45 inches.
Economy
The economy of Waverly is largely based on agriculture and tourism. The town is home to a number of farms, which produce a variety of crops, including corn, soybeans, wheat, and hay. The town is also home to a number of tourist attractions, including the Waverly Historic District, the Waverly Mill, and the Nottoway River.
The town is also home to a number of small businesses, including restaurants, shops, and other services. The town is also home to a number of manufacturing companies, including a furniture factory and a paper mill.
Demographics
As of the 2010 census, the population of Waverly was 2,000. The racial makeup of the town was 79.2% White, 17.2% African American, 0.7% Native American, 0.3% Asian, 0.1% Pacific Islander, and 2.5% from other races. The median household income was $35,000, and the median family income was $41,000.
The town is home to a number of churches, including the Waverly United Methodist Church, the Waverly Baptist Church, and the Waverly Presbyterian Church. The town is also home to a number of schools, including Waverly Elementary School, Waverly Middle School, and Waverly High School.
Conclusion
Waverly, Virginia is a small town located in Sussex County, Virginia. It is situated on the banks of the Nottoway River, about 30 miles south of the state capital of Richmond. The town has a population of approximately 2,000 people and is part of the larger Hampton Roads metropolitan area. The town was founded in 1790 by William Waverly, a Revolutionary War veteran, and has remained a small, rural community ever since. The economy of Waverly is largely based on agriculture and tourism, and the town is home to a number of small businesses, churches, and schools. The racial makeup of the town is 79.2% White, 17.2% African American, 0.7% Native American, 0.3% Asian, 0.1% Pacific Islander, and 2.5% from other races. The median household income was $35,000, and the median family income was $41,000. Waverly is a small, rural town with a rich history and a vibrant economy.
Common Questions
What is Per Capita Income in Waverly?
Per Capita income in Waverly is $29,280.
What is the Median Family Income in Waverly?
Median Family Income in Waverly is $66,522.
What is the Median Household income in Waverly?
Median Household Income in Waverly is $75,000.
What is Income or Wage Gap in Waverly?
Income or Wage Gap in Waverly is 21.9%.
Women in Waverly earn 78.1 cents for every dollar earned by a man.
What is Inequality or Gini Index in Waverly?
Inequality or Gini Index in Waverly is 0.46.
What is the Total Population of Waverly?
Total Population of Waverly is 2,890.
What is the Total Male Population of Waverly?
Total Male Population of Waverly is 1,516.
What is the Total Female Population of Waverly?
Total Female Population of Waverly is 1,374.
What is the Ratio of Males per 100 Females in Waverly?
There are 110.33 Males per 100 Females in Waverly.
What is the Ratio of Females per 100 Males in Waverly?
There are 90.63 Females per 100 Males in Waverly.
What is the Median Population Age in Waverly?
Median Population Age in Waverly is 34.3 Years.
What is the Average Family Size in Waverly
Average Family Size in Waverly is 4.3 People.
What is the Average Household Size in Waverly
Average Household Size in Waverly is 3.1 People.
How Large is the Labor Force in Waverly?
There are 1,353 People in the Labor Forcein in Waverly.
What is the Percentage of People in the Labor Force in Waverly?
61.1% of People are in the Labor Force in Waverly.
What is the Unemployment Rate in Waverly?
Unemployment Rate in Waverly is 9.5%.