Wachapreague, VA Map & Demographics
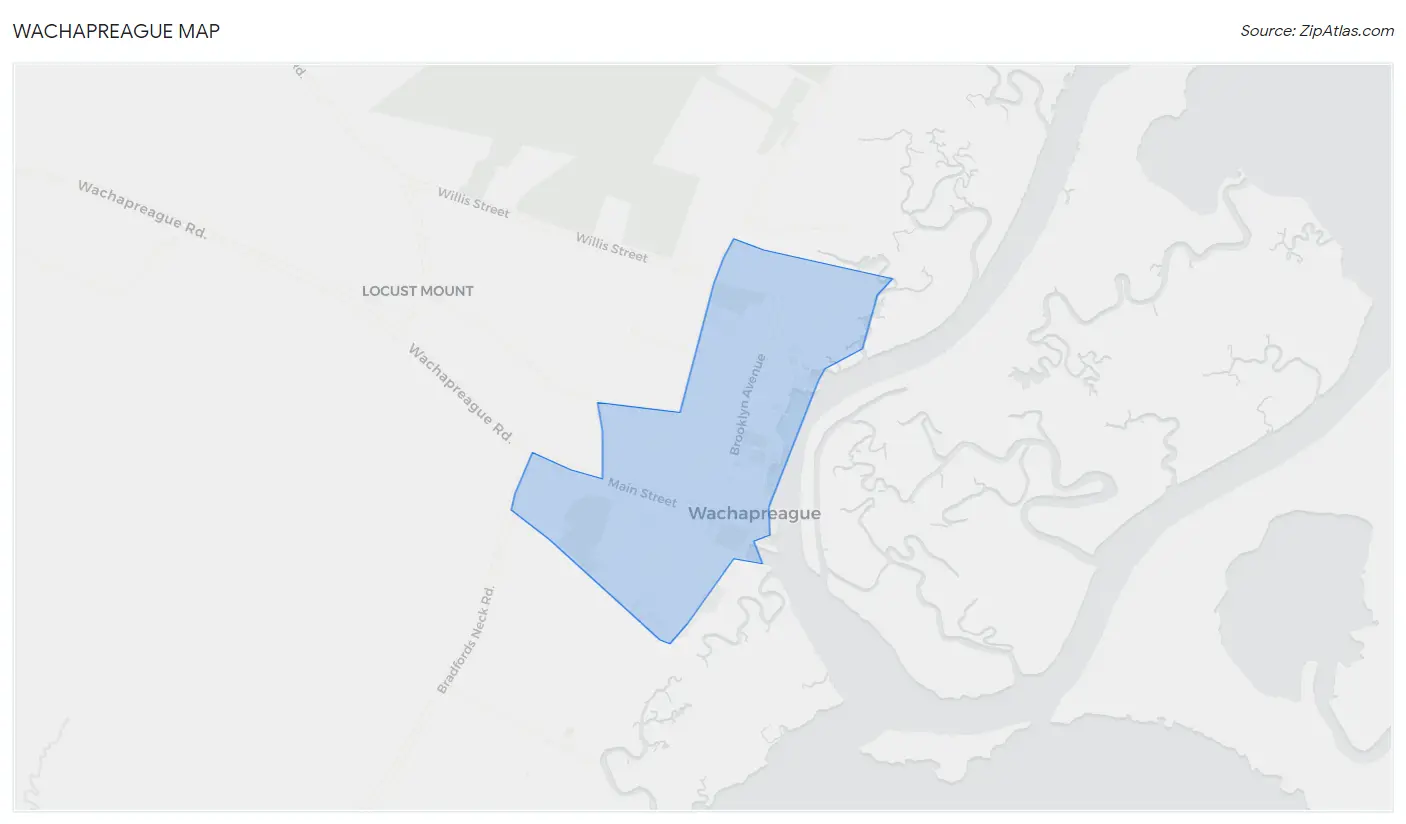
Wachapreague Map
Wachapreague Overview
$33,759
PER CAPITA INCOME
$91,250
AVG FAMILY INCOME
$54,844
AVG HOUSEHOLD INCOME
40.7%
WAGE / INCOME GAP [ % ]
59.3¢/ $1
WAGE / INCOME GAP [ $ ]
0.34
INEQUALITY / GINI INDEX
270
TOTAL POPULATION
127
MALE POPULATION
143
FEMALE POPULATION
88.81
MALES / 100 FEMALES
112.60
FEMALES / 100 MALES
65.5
MEDIAN AGE
2.6
AVG FAMILY SIZE
1.9
AVG HOUSEHOLD SIZE
100
LABOR FORCE [ PEOPLE ]
38.3%
PERCENT IN LABOR FORCE
2.0%
UNEMPLOYMENT RATE
Wachapreague Zip Codes
Wachapreague Area Codes
Income in Wachapreague
Income Overview in Wachapreague
Per Capita Income in Wachapreague is $33,759, while median incomes of families and households are $91,250 and $54,844 respectively.
| Characteristic | Number | Measure |
| Per Capita Income | 270 | $33,759 |
| Median Family Income | 73 | $91,250 |
| Mean Family Income | 73 | $85,442 |
| Median Household Income | 137 | $54,844 |
| Mean Household Income | 137 | $65,604 |
| Income Deficit | 73 | $0 |
| Wage / Income Gap (%) | 270 | 40.68% |
| Wage / Income Gap ($) | 270 | 59.32¢ per $1 |
| Gini / Inequality Index | 270 | 0.34 |
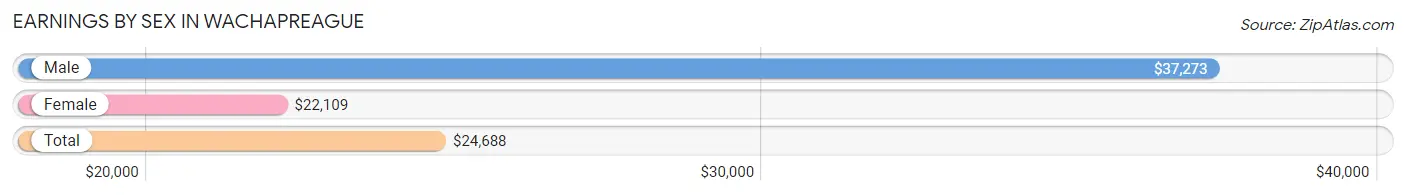
Earnings by Sex in Wachapreague
Average Earnings in Wachapreague are $24,688, $37,273 for men and $22,109 for women, a difference of 40.7%.
| Sex | Number | Average Earnings |
| Male | 50 (44.3%) | $37,273 |
| Female | 63 (55.7%) | $22,109 |
| Total | 113 (100.0%) | $24,688 |
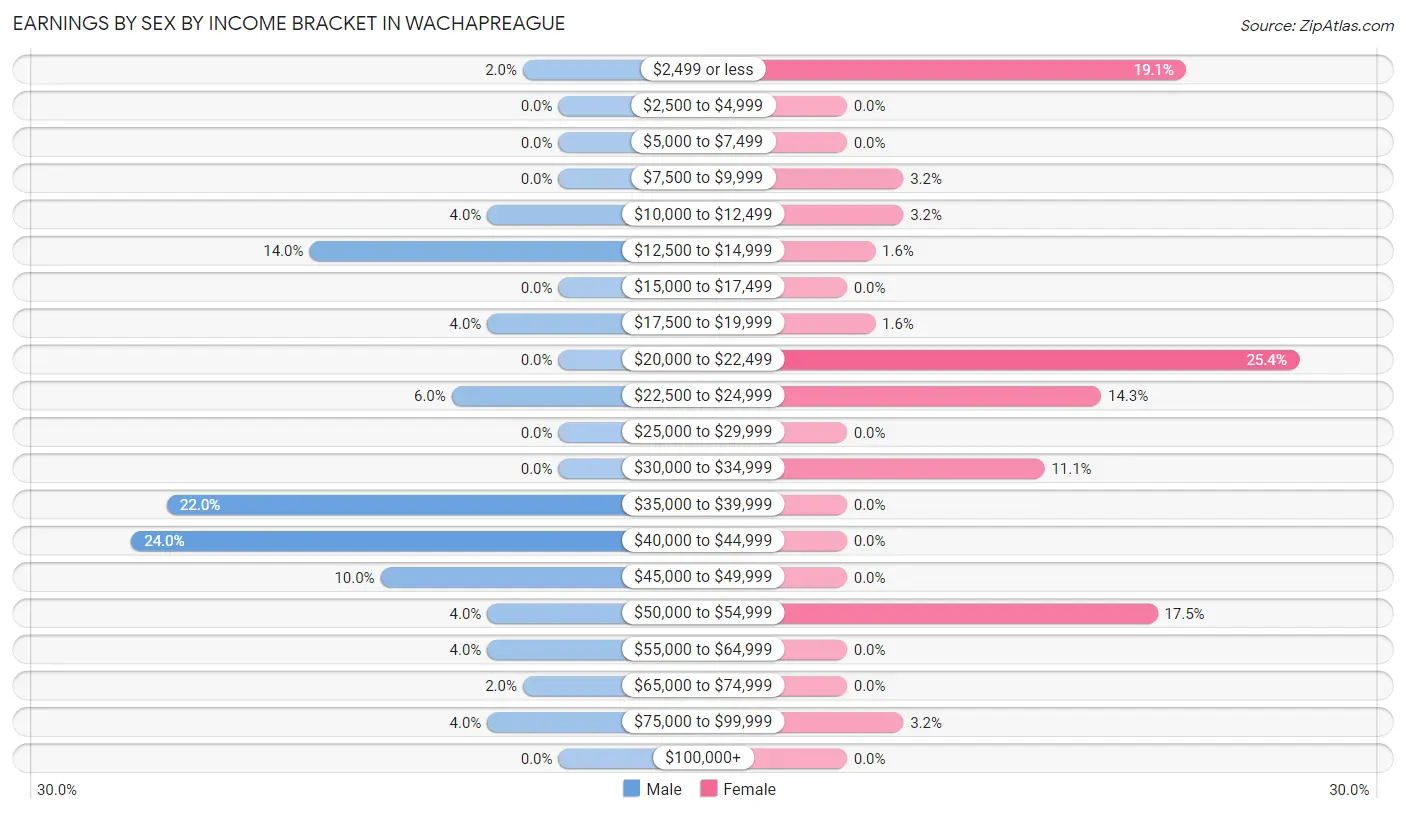
Earnings by Sex by Income Bracket in Wachapreague
The most common earnings brackets in Wachapreague are $40,000 to $44,999 for men (12 | 24.0%) and $20,000 to $22,499 for women (16 | 25.4%).
| Income | Male | Female |
| $2,499 or less | 1 (2.0%) | 12 (19.1%) |
| $2,500 to $4,999 | 0 (0.0%) | 0 (0.0%) |
| $5,000 to $7,499 | 0 (0.0%) | 0 (0.0%) |
| $7,500 to $9,999 | 0 (0.0%) | 2 (3.2%) |
| $10,000 to $12,499 | 2 (4.0%) | 2 (3.2%) |
| $12,500 to $14,999 | 7 (14.0%) | 1 (1.6%) |
| $15,000 to $17,499 | 0 (0.0%) | 0 (0.0%) |
| $17,500 to $19,999 | 2 (4.0%) | 1 (1.6%) |
| $20,000 to $22,499 | 0 (0.0%) | 16 (25.4%) |
| $22,500 to $24,999 | 3 (6.0%) | 9 (14.3%) |
| $25,000 to $29,999 | 0 (0.0%) | 0 (0.0%) |
| $30,000 to $34,999 | 0 (0.0%) | 7 (11.1%) |
| $35,000 to $39,999 | 11 (22.0%) | 0 (0.0%) |
| $40,000 to $44,999 | 12 (24.0%) | 0 (0.0%) |
| $45,000 to $49,999 | 5 (10.0%) | 0 (0.0%) |
| $50,000 to $54,999 | 2 (4.0%) | 11 (17.5%) |
| $55,000 to $64,999 | 2 (4.0%) | 0 (0.0%) |
| $65,000 to $74,999 | 1 (2.0%) | 0 (0.0%) |
| $75,000 to $99,999 | 2 (4.0%) | 2 (3.2%) |
| $100,000+ | 0 (0.0%) | 0 (0.0%) |
| Total | 50 (100.0%) | 63 (100.0%) |
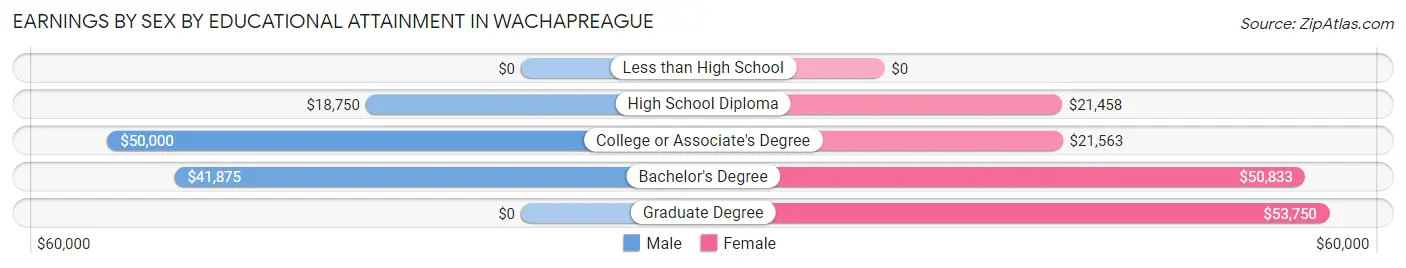
Earnings by Sex by Educational Attainment in Wachapreague
Average earnings in Wachapreague are $36,875 for men and $22,266 for women, a difference of 39.6%. Men with an educational attainment of college or associate's degree enjoy the highest average annual earnings of $50,000, while those with high school diploma education earn the least with $18,750. Women with an educational attainment of graduate degree earn the most with the average annual earnings of $53,750, while those with high school diploma education have the smallest earnings of $21,458.
| Educational Attainment | Male Income | Female Income |
| Less than High School | - | - |
| High School Diploma | $18,750 | $21,458 |
| College or Associate's Degree | $50,000 | $21,563 |
| Bachelor's Degree | $41,875 | $50,833 |
| Graduate Degree | - | - |
| Total | $36,875 | $22,266 |
Family Income in Wachapreague
Family Income Brackets in Wachapreague
According to the Wachapreague family income data, there are 25 families falling into the $75,000 to $99,999 income range, which is the most common income bracket and makes up 34.3% of all families.
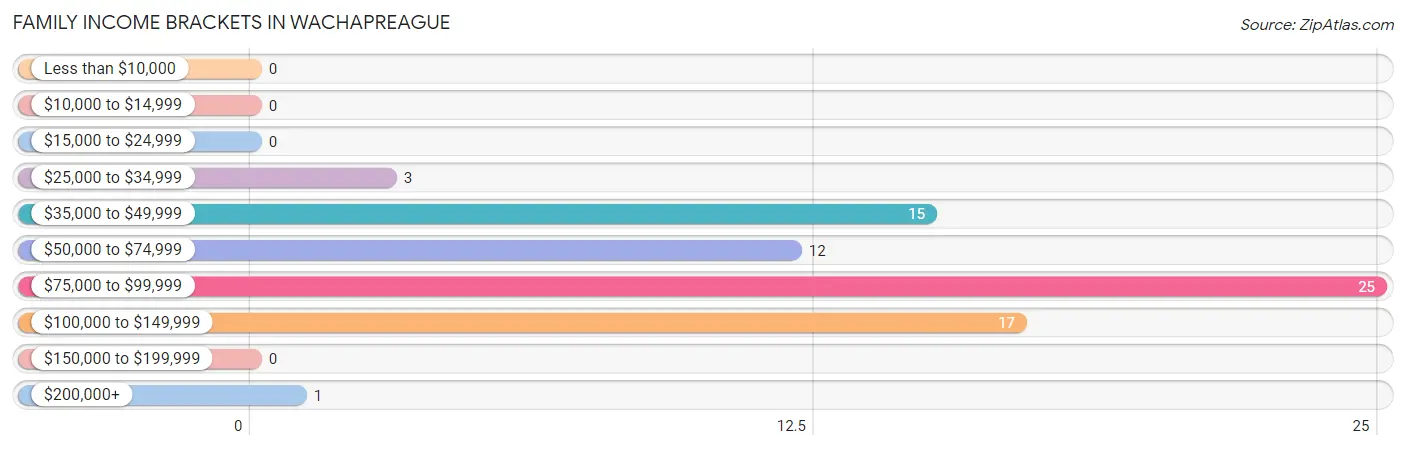
| Income Bracket | # Families | % Families |
| Less than $10,000 | 0 | 0.0% |
| $10,000 to $14,999 | 0 | 0.0% |
| $15,000 to $24,999 | 0 | 0.0% |
| $25,000 to $34,999 | 3 | 4.1% |
| $35,000 to $49,999 | 15 | 20.5% |
| $50,000 to $74,999 | 12 | 16.4% |
| $75,000 to $99,999 | 25 | 34.2% |
| $100,000 to $149,999 | 17 | 23.3% |
| $150,000 to $199,999 | 0 | 0.0% |
| $200,000+ | 1 | 1.4% |
Family Income by Famaliy Size in Wachapreague
4-person families (16 | 21.9%) account for the highest median family income in Wachapreague with $98,542 per family, while 2-person families (50 | 68.5%) have the highest median income of $33,125 per family member.
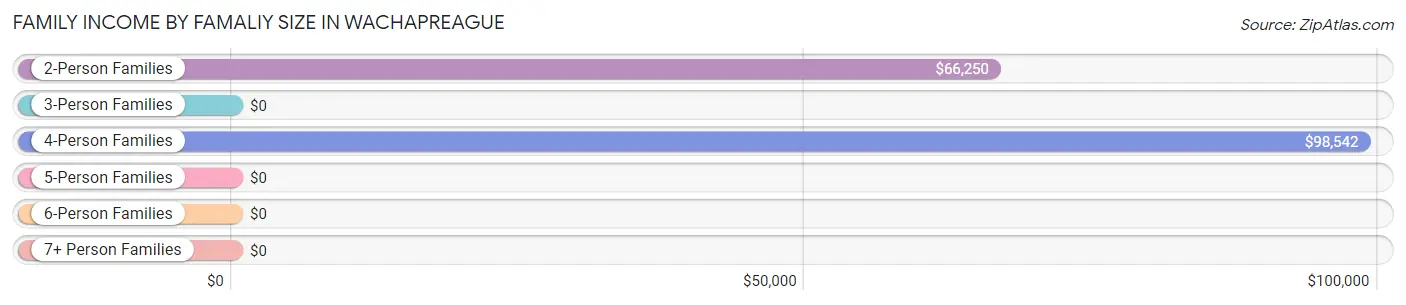
| Income Bracket | # Families | Median Income |
| 2-Person Families | 50 (68.5%) | $66,250 |
| 3-Person Families | 7 (9.6%) | $0 |
| 4-Person Families | 16 (21.9%) | $98,542 |
| 5-Person Families | 0 (0.0%) | $0 |
| 6-Person Families | 0 (0.0%) | $0 |
| 7+ Person Families | 0 (0.0%) | $0 |
| Total | 73 (100.0%) | $91,250 |
Family Income by Number of Earners in Wachapreague
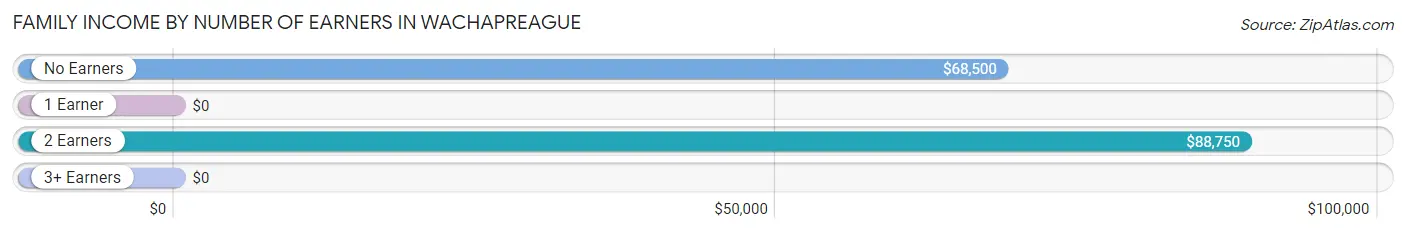
| Number of Earners | # Families | Median Income |
| No Earners | 32 (43.8%) | $68,500 |
| 1 Earner | 19 (26.0%) | $0 |
| 2 Earners | 10 (13.7%) | $88,750 |
| 3+ Earners | 12 (16.4%) | $0 |
| Total | 73 (100.0%) | $91,250 |
Household Income in Wachapreague
Household Income Brackets in Wachapreague
With 31 households falling in the category, the $50,000 to $74,999 income range is the most frequent in Wachapreague, accounting for 22.6% of all households.
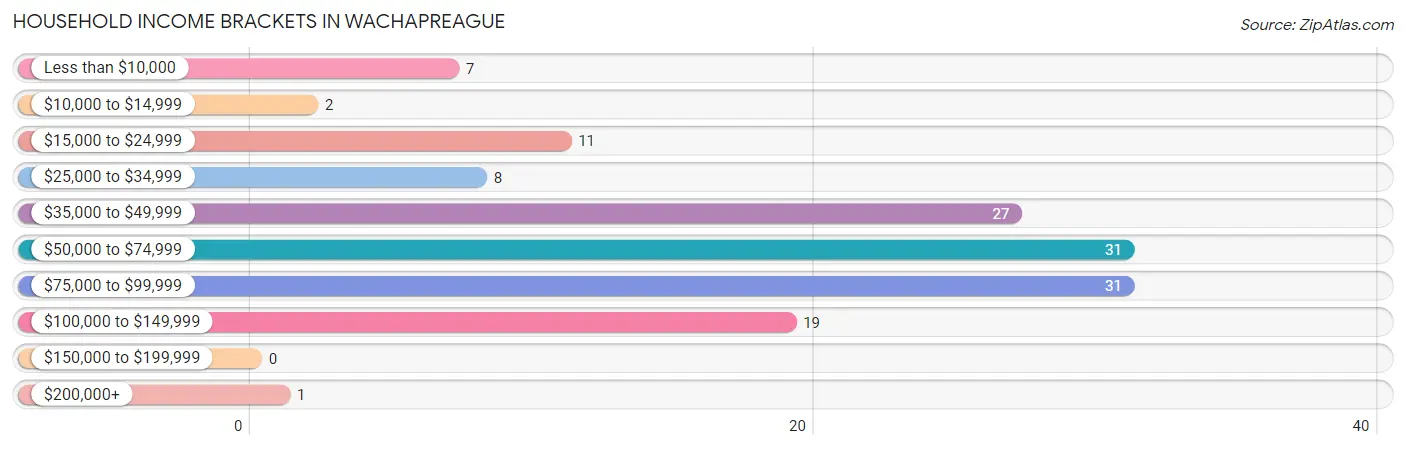
| Income Bracket | # Households | % Households |
| Less than $10,000 | 7 | 5.1% |
| $10,000 to $14,999 | 2 | 1.5% |
| $15,000 to $24,999 | 11 | 8.0% |
| $25,000 to $34,999 | 8 | 5.8% |
| $35,000 to $49,999 | 27 | 19.7% |
| $50,000 to $74,999 | 31 | 22.6% |
| $75,000 to $99,999 | 31 | 22.6% |
| $100,000 to $149,999 | 19 | 13.9% |
| $150,000 to $199,999 | 0 | 0.0% |
| $200,000+ | 1 | 0.7% |
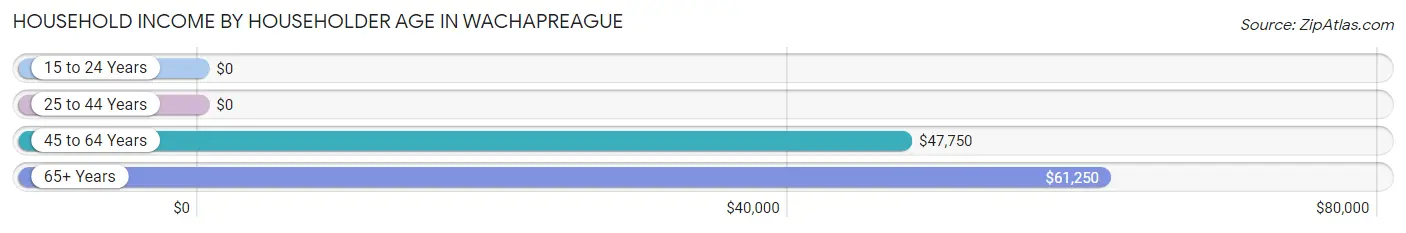
Household Income by Householder Age in Wachapreague
The median household income in Wachapreague is $54,844, with the highest median household income of $61,250 found in the 65+ years age bracket for the primary householder. A total of 88 households (64.2%) fall into this category.
| Income Bracket | # Households | Median Income |
| 15 to 24 Years | 0 (0.0%) | $0 |
| 25 to 44 Years | 20 (14.6%) | $0 |
| 45 to 64 Years | 29 (21.2%) | $47,750 |
| 65+ Years | 88 (64.2%) | $61,250 |
| Total | 137 (100.0%) | $54,844 |
Poverty in Wachapreague
Income Below Poverty by Sex and Age in Wachapreague
With 1.7% poverty level for males and 5.3% for females among the residents of Wachapreague, 45 to 54 year old males and 75 year old and over females are the most vulnerable to poverty, with 2 males (15.4%) and 7 females (28.0%) in their respective age groups living below the poverty level.
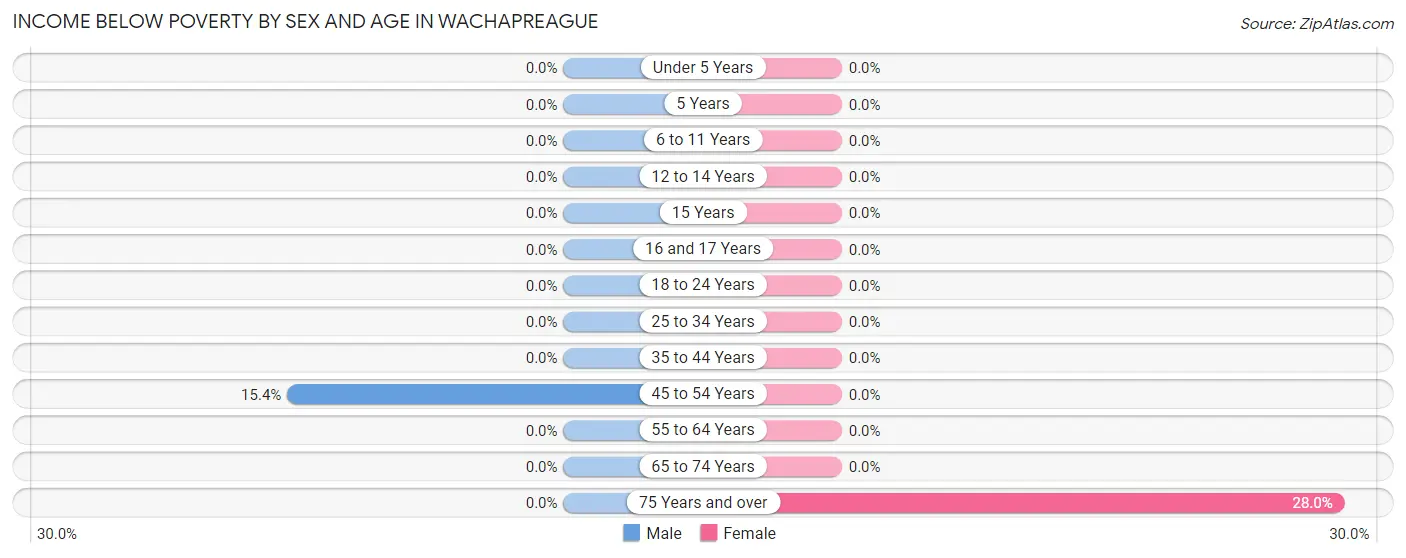
| Age Bracket | Male | Female |
| Under 5 Years | 0 (0.0%) | 0 (0.0%) |
| 5 Years | 0 (0.0%) | 0 (0.0%) |
| 6 to 11 Years | 0 (0.0%) | 0 (0.0%) |
| 12 to 14 Years | 0 (0.0%) | 0 (0.0%) |
| 15 Years | 0 (0.0%) | 0 (0.0%) |
| 16 and 17 Years | 0 (0.0%) | 0 (0.0%) |
| 18 to 24 Years | 0 (0.0%) | 0 (0.0%) |
| 25 to 34 Years | 0 (0.0%) | 0 (0.0%) |
| 35 to 44 Years | 0 (0.0%) | 0 (0.0%) |
| 45 to 54 Years | 2 (15.4%) | 0 (0.0%) |
| 55 to 64 Years | 0 (0.0%) | 0 (0.0%) |
| 65 to 74 Years | 0 (0.0%) | 0 (0.0%) |
| 75 Years and over | 0 (0.0%) | 7 (28.0%) |
| Total | 2 (1.7%) | 7 (5.3%) |
Income Above Poverty by Sex and Age in Wachapreague
According to the poverty statistics in Wachapreague, males aged 16 and 17 years and females aged 6 to 11 years are the age groups that are most secure financially, with 100.0% of males and 100.0% of females in these age groups living above the poverty line.
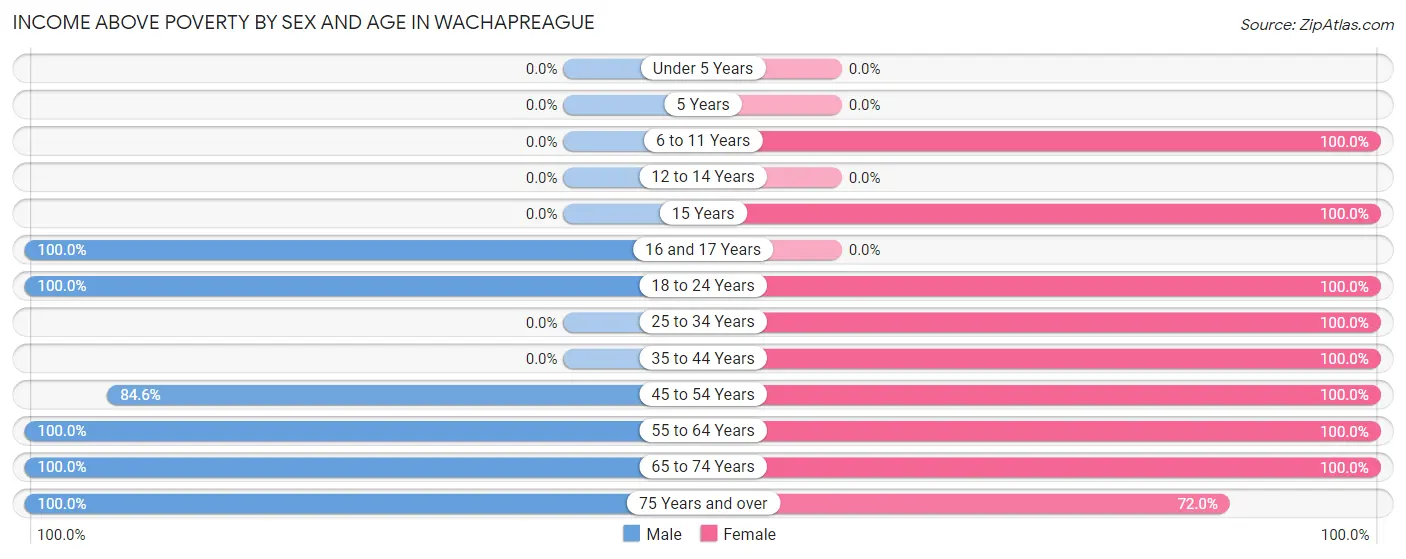
| Age Bracket | Male | Female |
| Under 5 Years | 0 (0.0%) | 0 (0.0%) |
| 5 Years | 0 (0.0%) | 0 (0.0%) |
| 6 to 11 Years | 0 (0.0%) | 1 (100.0%) |
| 12 to 14 Years | 0 (0.0%) | 0 (0.0%) |
| 15 Years | 0 (0.0%) | 8 (100.0%) |
| 16 and 17 Years | 17 (100.0%) | 0 (0.0%) |
| 18 to 24 Years | 10 (100.0%) | 16 (100.0%) |
| 25 to 34 Years | 0 (0.0%) | 11 (100.0%) |
| 35 to 44 Years | 0 (0.0%) | 12 (100.0%) |
| 45 to 54 Years | 11 (84.6%) | 11 (100.0%) |
| 55 to 64 Years | 14 (100.0%) | 5 (100.0%) |
| 65 to 74 Years | 29 (100.0%) | 43 (100.0%) |
| 75 Years and over | 38 (100.0%) | 18 (72.0%) |
| Total | 119 (98.4%) | 125 (94.7%) |
Income Below Poverty Among Married-Couple Families in Wachapreague
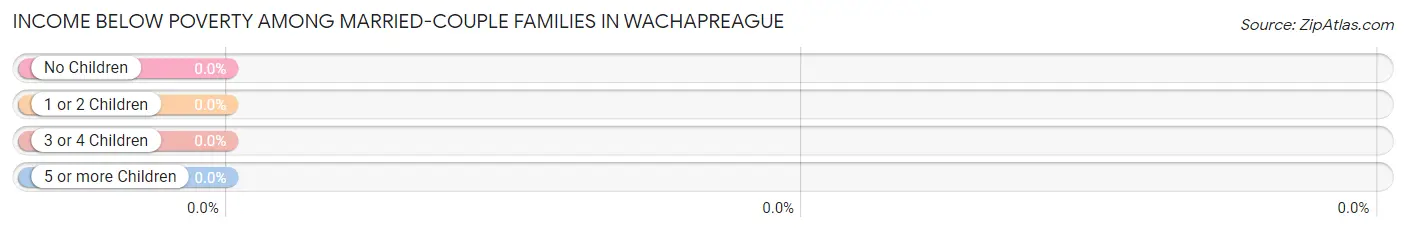
| Children | Above Poverty | Below Poverty |
| No Children | 52 (100.0%) | 0 (0.0%) |
| 1 or 2 Children | 1 (100.0%) | 0 (0.0%) |
| 3 or 4 Children | 0 (0.0%) | 0 (0.0%) |
| 5 or more Children | 0 (0.0%) | 0 (0.0%) |
| Total | 53 (100.0%) | 0 (0.0%) |
Income Below Poverty Among Single-Parent Households in Wachapreague
| Children | Single Father | Single Mother |
| No Children | 0 (0.0%) | 0 (0.0%) |
| 1 or 2 Children | 0 (0.0%) | 0 (0.0%) |
| 3 or 4 Children | 0 (0.0%) | 0 (0.0%) |
| 5 or more Children | 0 (0.0%) | 0 (0.0%) |
| Total | 0 (0.0%) | 0 (0.0%) |
Income Below Poverty Among Married-Couple vs Single-Parent Households in Wachapreague
| Children | Married-Couple Families | Single-Parent Households |
| No Children | 0 (0.0%) | 0 (0.0%) |
| 1 or 2 Children | 0 (0.0%) | 0 (0.0%) |
| 3 or 4 Children | 0 (0.0%) | 0 (0.0%) |
| 5 or more Children | 0 (0.0%) | 0 (0.0%) |
| Total | 0 (0.0%) | 0 (0.0%) |
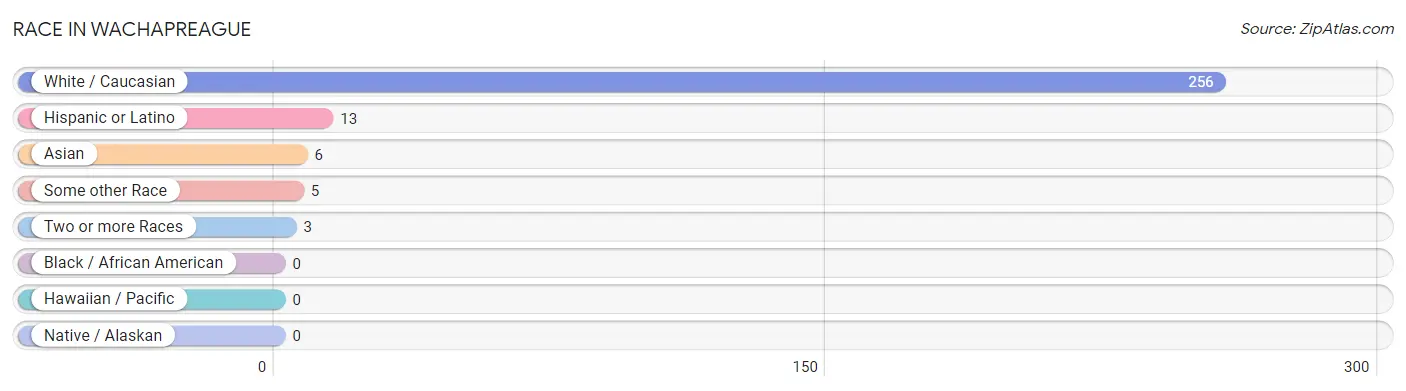
Race in Wachapreague
The most populous races in Wachapreague are White / Caucasian (256 | 94.8%), Hispanic or Latino (13 | 4.8%), and Asian (6 | 2.2%).
| Race | # Population | % Population |
| Asian | 6 | 2.2% |
| Black / African American | 0 | 0.0% |
| Hawaiian / Pacific | 0 | 0.0% |
| Hispanic or Latino | 13 | 4.8% |
| Native / Alaskan | 0 | 0.0% |
| White / Caucasian | 256 | 94.8% |
| Two or more Races | 3 | 1.1% |
| Some other Race | 5 | 1.8% |
| Total | 270 | 100.0% |
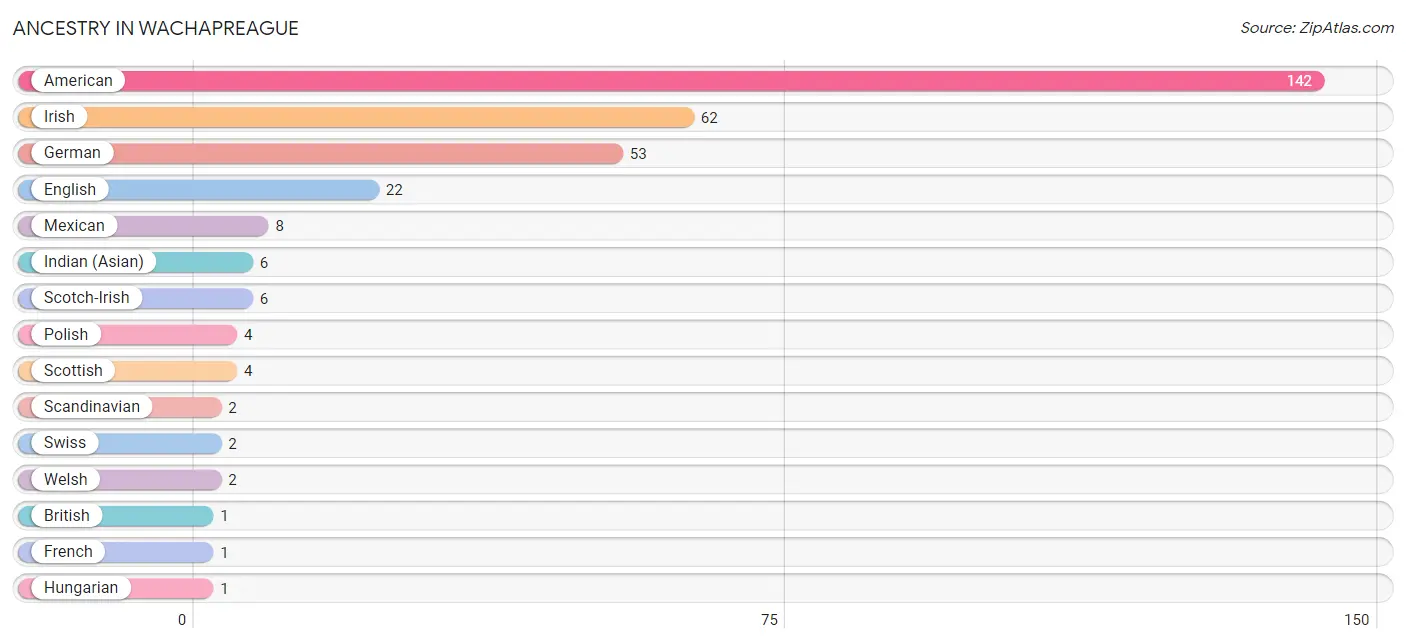
Ancestry in Wachapreague
The most populous ancestries reported in Wachapreague are American (142 | 52.6%), Irish (62 | 23.0%), German (53 | 19.6%), English (22 | 8.2%), and Mexican (8 | 3.0%), together accounting for 106.3% of all Wachapreague residents.
| Ancestry | # Population | % Population |
| American | 142 | 52.6% |
| British | 1 | 0.4% |
| English | 22 | 8.2% |
| French | 1 | 0.4% |
| German | 53 | 19.6% |
| Hungarian | 1 | 0.4% |
| Indian (Asian) | 6 | 2.2% |
| Irish | 62 | 23.0% |
| Italian | 1 | 0.4% |
| Mexican | 8 | 3.0% |
| Polish | 4 | 1.5% |
| Scandinavian | 2 | 0.7% |
| Scotch-Irish | 6 | 2.2% |
| Scottish | 4 | 1.5% |
| Slovak | 1 | 0.4% |
| Swiss | 2 | 0.7% |
| Welsh | 2 | 0.7% | View All 17 Rows |
Immigrants in Wachapreague
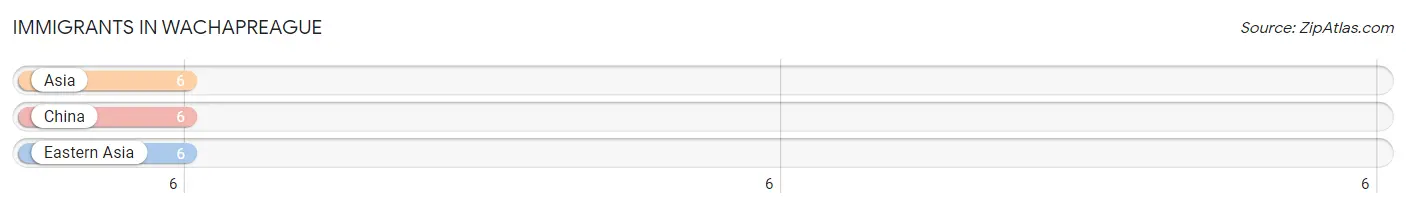
The most numerous immigrant groups reported in Wachapreague came from Asia (6 | 2.2%), China (6 | 2.2%), and Eastern Asia (6 | 2.2%), together accounting for 6.7% of all Wachapreague residents.
| Immigration Origin | # Population | % Population |
| Asia | 6 | 2.2% |
| China | 6 | 2.2% |
| Eastern Asia | 6 | 2.2% | View All 3 Rows |
Sex and Age in Wachapreague
Sex and Age in Wachapreague
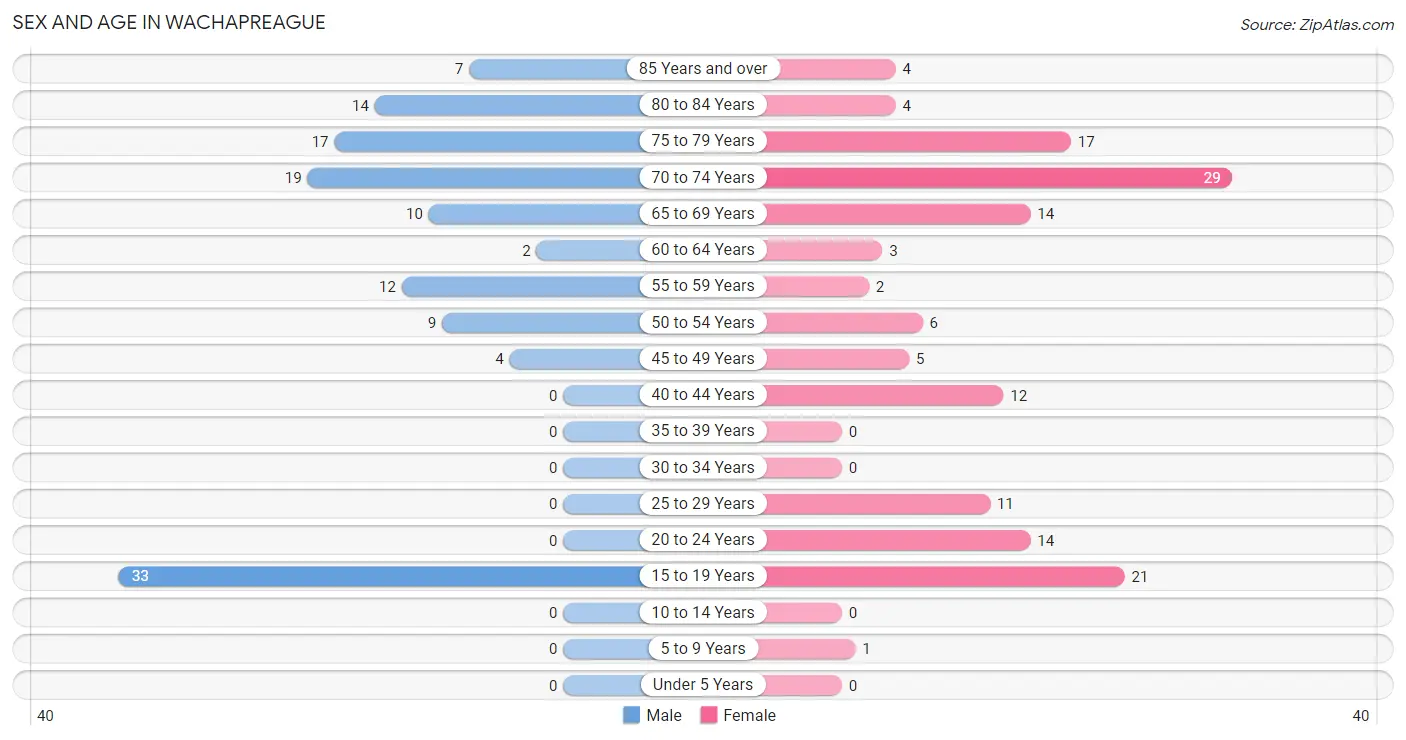
The most populous age groups in Wachapreague are 15 to 19 Years (33 | 26.0%) for men and 70 to 74 Years (29 | 20.3%) for women.
| Age Bracket | Male | Female |
| Under 5 Years | 0 (0.0%) | 0 (0.0%) |
| 5 to 9 Years | 0 (0.0%) | 1 (0.7%) |
| 10 to 14 Years | 0 (0.0%) | 0 (0.0%) |
| 15 to 19 Years | 33 (26.0%) | 21 (14.7%) |
| 20 to 24 Years | 0 (0.0%) | 14 (9.8%) |
| 25 to 29 Years | 0 (0.0%) | 11 (7.7%) |
| 30 to 34 Years | 0 (0.0%) | 0 (0.0%) |
| 35 to 39 Years | 0 (0.0%) | 0 (0.0%) |
| 40 to 44 Years | 0 (0.0%) | 12 (8.4%) |
| 45 to 49 Years | 4 (3.2%) | 5 (3.5%) |
| 50 to 54 Years | 9 (7.1%) | 6 (4.2%) |
| 55 to 59 Years | 12 (9.5%) | 2 (1.4%) |
| 60 to 64 Years | 2 (1.6%) | 3 (2.1%) |
| 65 to 69 Years | 10 (7.9%) | 14 (9.8%) |
| 70 to 74 Years | 19 (15.0%) | 29 (20.3%) |
| 75 to 79 Years | 17 (13.4%) | 17 (11.9%) |
| 80 to 84 Years | 14 (11.0%) | 4 (2.8%) |
| 85 Years and over | 7 (5.5%) | 4 (2.8%) |
| Total | 127 (100.0%) | 143 (100.0%) |
Families and Households in Wachapreague
Median Family Size in Wachapreague
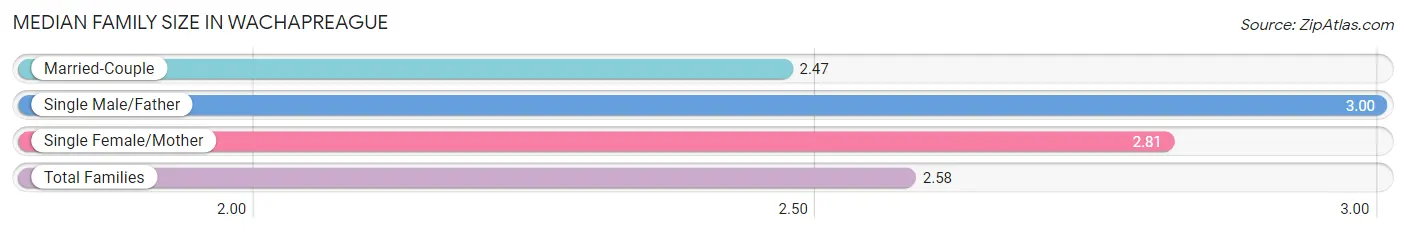
The median family size in Wachapreague is 2.58 persons per family, with single male/father families (4 | 5.5%) accounting for the largest median family size of 3 persons per family. On the other hand, married-couple families (53 | 72.6%) represent the smallest median family size with 2.47 persons per family.
| Family Type | # Families | Family Size |
| Married-Couple | 53 (72.6%) | 2.47 |
| Single Male/Father | 4 (5.5%) | 3.00 |
| Single Female/Mother | 16 (21.9%) | 2.81 |
| Total Families | 73 (100.0%) | 2.58 |
Median Household Size in Wachapreague
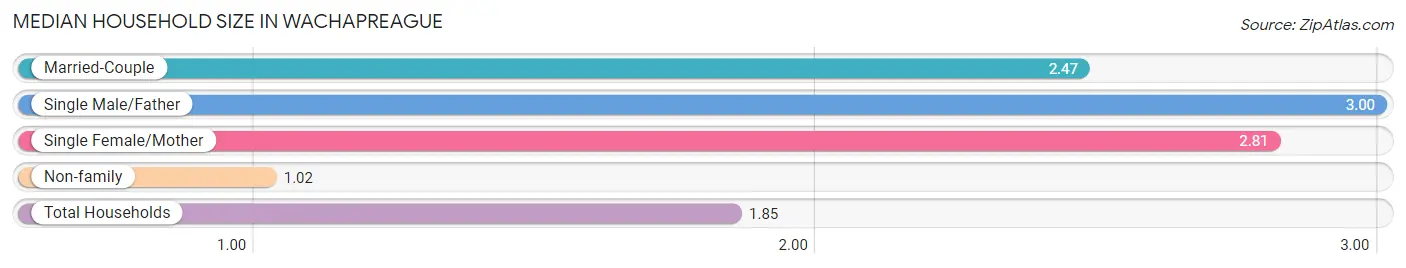
The median household size in Wachapreague is 1.85 persons per household, with single male/father households (4 | 2.9%) accounting for the largest median household size of 3 persons per household. non-family households (64 | 46.7%) represent the smallest median household size with 1.02 persons per household.
| Household Type | # Households | Household Size |
| Married-Couple | 53 (38.7%) | 2.47 |
| Single Male/Father | 4 (2.9%) | 3.00 |
| Single Female/Mother | 16 (11.7%) | 2.81 |
| Non-family | 64 (46.7%) | 1.02 |
| Total Households | 137 (100.0%) | 1.85 |
Household Size by Marriage Status in Wachapreague
Out of a total of 137 households in Wachapreague, 73 (53.3%) are family households, while 64 (46.7%) are nonfamily households. The most numerous type of family households are 2-person households, comprising 50, and the most common type of nonfamily households are 1-person households, comprising 62.
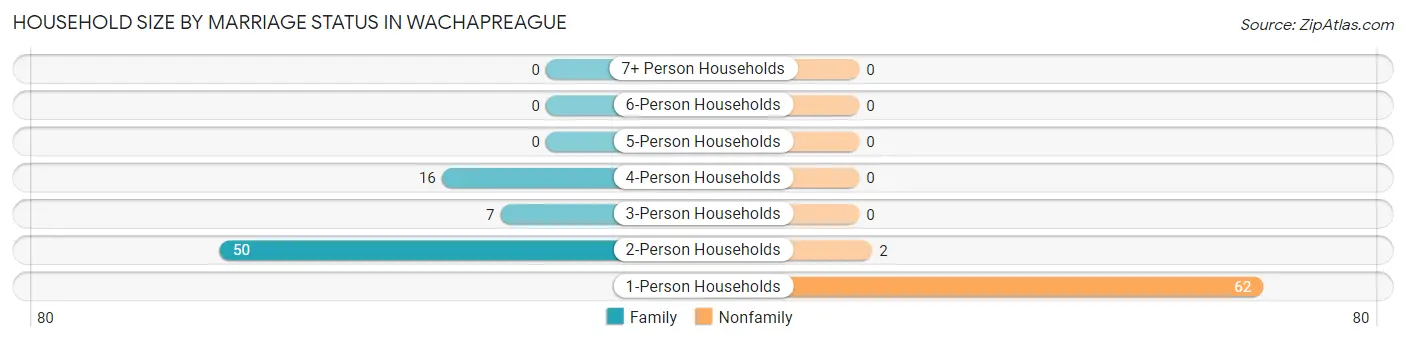
| Household Size | Family Households | Nonfamily Households |
| 1-Person Households | - | 62 (45.3%) |
| 2-Person Households | 50 (36.5%) | 2 (1.5%) |
| 3-Person Households | 7 (5.1%) | 0 (0.0%) |
| 4-Person Households | 16 (11.7%) | 0 (0.0%) |
| 5-Person Households | 0 (0.0%) | 0 (0.0%) |
| 6-Person Households | 0 (0.0%) | 0 (0.0%) |
| 7+ Person Households | 0 (0.0%) | 0 (0.0%) |
| Total | 73 (53.3%) | 64 (46.7%) |
Female Fertility in Wachapreague
Fertility by Age in Wachapreague
| Age Bracket | Women with Births | Births / 1,000 Women |
| 15 to 19 years | 0 (0.0%) | 0.0 |
| 20 to 34 years | 0 (0.0%) | 0.0 |
| 35 to 50 years | 0 (0.0%) | 0.0 |
| Total | 0 (0.0%) | 0.0 |
Fertility by Age by Marriage Status in Wachapreague
| Age Bracket | Married | Unmarried |
| 15 to 19 years | 0 (0.0%) | 0 (0.0%) |
| 20 to 34 years | 0 (0.0%) | 0 (0.0%) |
| 35 to 50 years | 0 (0.0%) | 0 (0.0%) |
| Total | 0 (0.0%) | 0 (0.0%) |
Fertility by Education in Wachapreague
| Educational Attainment | Women with Births | Births / 1,000 Women |
| Less than High School | 0 (0.0%) | 0.0 |
| High School Diploma | 0 (0.0%) | 0.0 |
| College or Associate's Degree | 0 (0.0%) | 0.0 |
| Bachelor's Degree | 0 (0.0%) | 0.0 |
| Graduate Degree | 0 (0.0%) | 0.0 |
| Total | 0 (0.0%) | 0.0 |
Fertility by Education by Marriage Status in Wachapreague
| Educational Attainment | Married | Unmarried |
| Less than High School | 0 (0.0%) | 0 (0.0%) |
| High School Diploma | 0 (0.0%) | 0 (0.0%) |
| College or Associate's Degree | 0 (0.0%) | 0 (0.0%) |
| Bachelor's Degree | 0 (0.0%) | 0 (0.0%) |
| Graduate Degree | 0 (0.0%) | 0 (0.0%) |
| Total | 0 (0.0%) | 0 (0.0%) |
Employment Characteristics in Wachapreague
Employment by Class of Employer in Wachapreague
Among the 88 employed individuals in Wachapreague, private company employees (41 | 46.6%), local government employees (18 | 20.4%), and not-for-profit organizations (17 | 19.3%) make up the most common classes of employment.
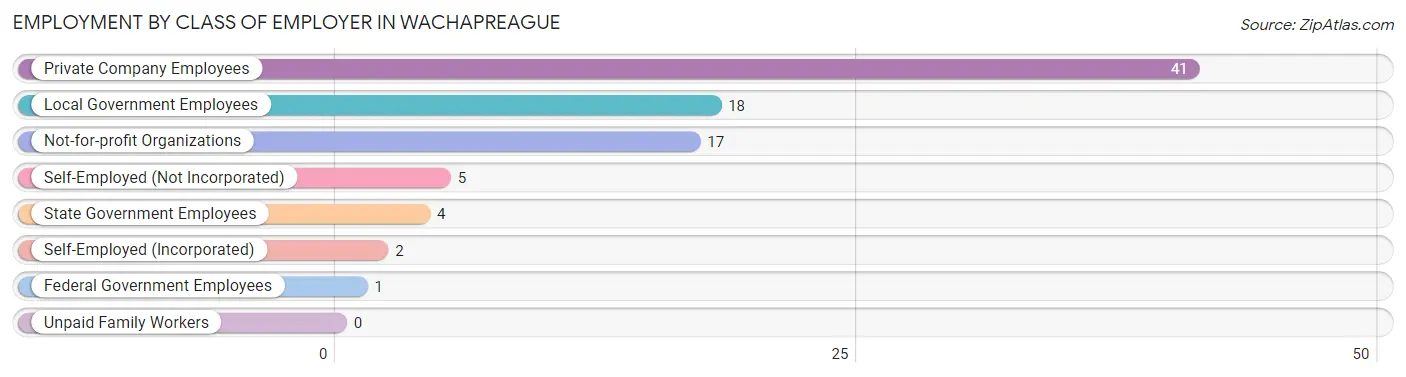
| Employer Class | # Employees | % Employees |
| Private Company Employees | 41 | 46.6% |
| Self-Employed (Incorporated) | 2 | 2.3% |
| Self-Employed (Not Incorporated) | 5 | 5.7% |
| Not-for-profit Organizations | 17 | 19.3% |
| Local Government Employees | 18 | 20.4% |
| State Government Employees | 4 | 4.5% |
| Federal Government Employees | 1 | 1.1% |
| Unpaid Family Workers | 0 | 0.0% |
| Total | 88 | 100.0% |
Employment Status by Age in Wachapreague
According to the labor force statistics for Wachapreague, out of the total population over 16 years of age (261), 38.3% or 100 individuals are in the labor force, with 2.0% or 2 of them unemployed. The age group with the highest labor force participation rate is 20 to 24 years, with 100.0% or 14 individuals in the labor force. Within the labor force, the 45 to 54 years age range has the highest percentage of unemployed individuals, with 8.3% or 2 of them being unemployed.
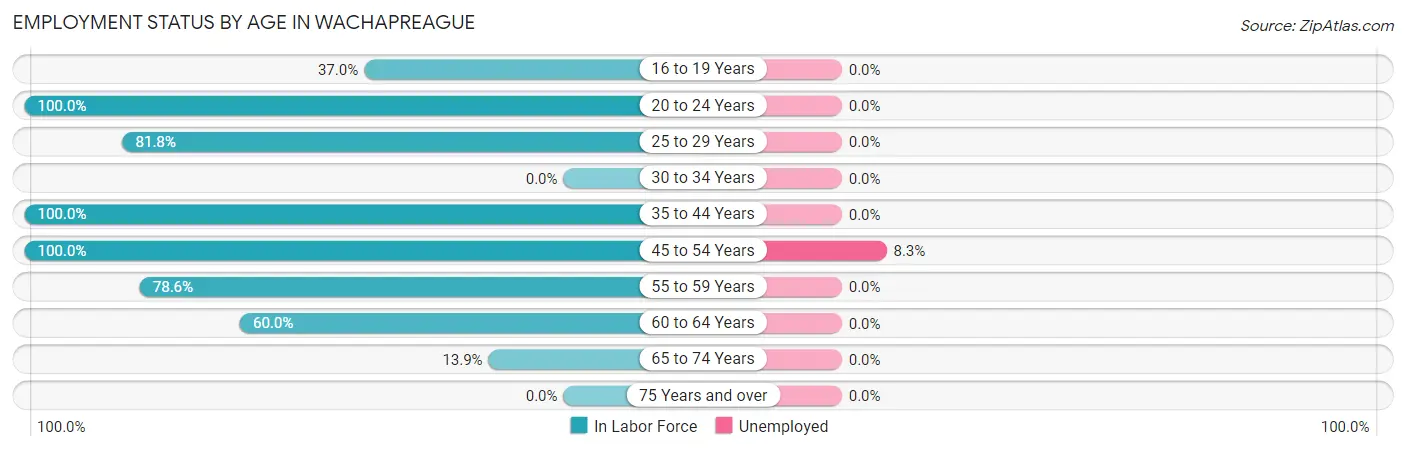
| Age Bracket | In Labor Force | Unemployed |
| 16 to 19 Years | 17 (37.0%) | 0 (0.0%) |
| 20 to 24 Years | 14 (100.0%) | 0 (0.0%) |
| 25 to 29 Years | 9 (81.8%) | 0 (0.0%) |
| 30 to 34 Years | 0 (0.0%) | 0 (0.0%) |
| 35 to 44 Years | 12 (100.0%) | 0 (0.0%) |
| 45 to 54 Years | 24 (100.0%) | 2 (8.3%) |
| 55 to 59 Years | 11 (78.6%) | 0 (0.0%) |
| 60 to 64 Years | 3 (60.0%) | 0 (0.0%) |
| 65 to 74 Years | 10 (13.9%) | 0 (0.0%) |
| 75 Years and over | 0 (0.0%) | 0 (0.0%) |
| Total | 100 (38.3%) | 2 (2.0%) |
Employment Status by Educational Attainment in Wachapreague
According to labor force statistics for Wachapreague, 89.4% of individuals (59) out of the total population between 25 and 64 years of age (66) are in the labor force, with 3.4% or 2 of them being unemployed. The group with the highest labor force participation rate are those with the educational attainment of college / associate degree, with 100.0% or 13 individuals in the labor force. Within the labor force, individuals with high school diploma education have the highest percentage of unemployment, with 10.5% or 2 of them being unemployed.
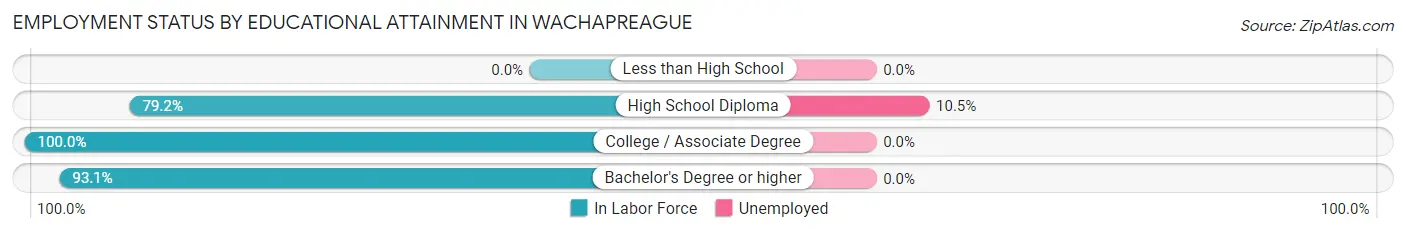
| Educational Attainment | In Labor Force | Unemployed |
| Less than High School | 0 (0.0%) | 0 (0.0%) |
| High School Diploma | 19 (79.2%) | 3 (10.5%) |
| College / Associate Degree | 13 (100.0%) | 0 (0.0%) |
| Bachelor's Degree or higher | 27 (93.1%) | 0 (0.0%) |
| Total | 59 (89.4%) | 2 (3.4%) |
Employment Occupations by Sex in Wachapreague
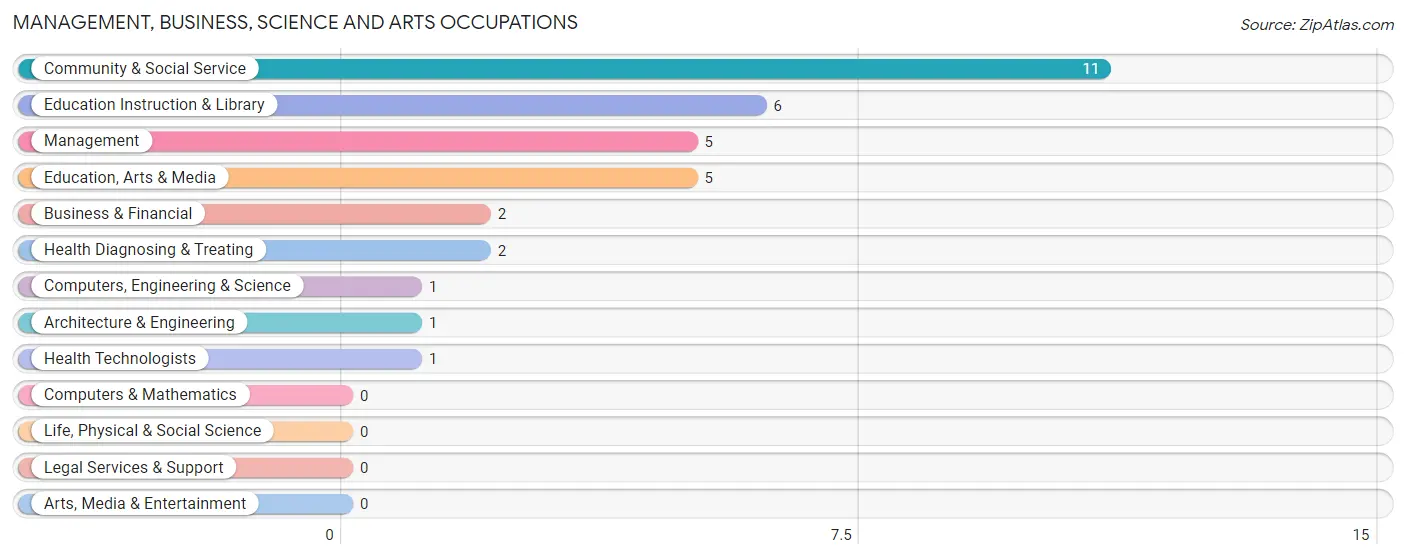
Management, Business, Science and Arts Occupations
The most common Management, Business, Science and Arts occupations in Wachapreague are Community & Social Service (11 | 11.2%), Education Instruction & Library (6 | 6.1%), Management (5 | 5.1%), Education, Arts & Media (5 | 5.1%), and Business & Financial (2 | 2.0%).
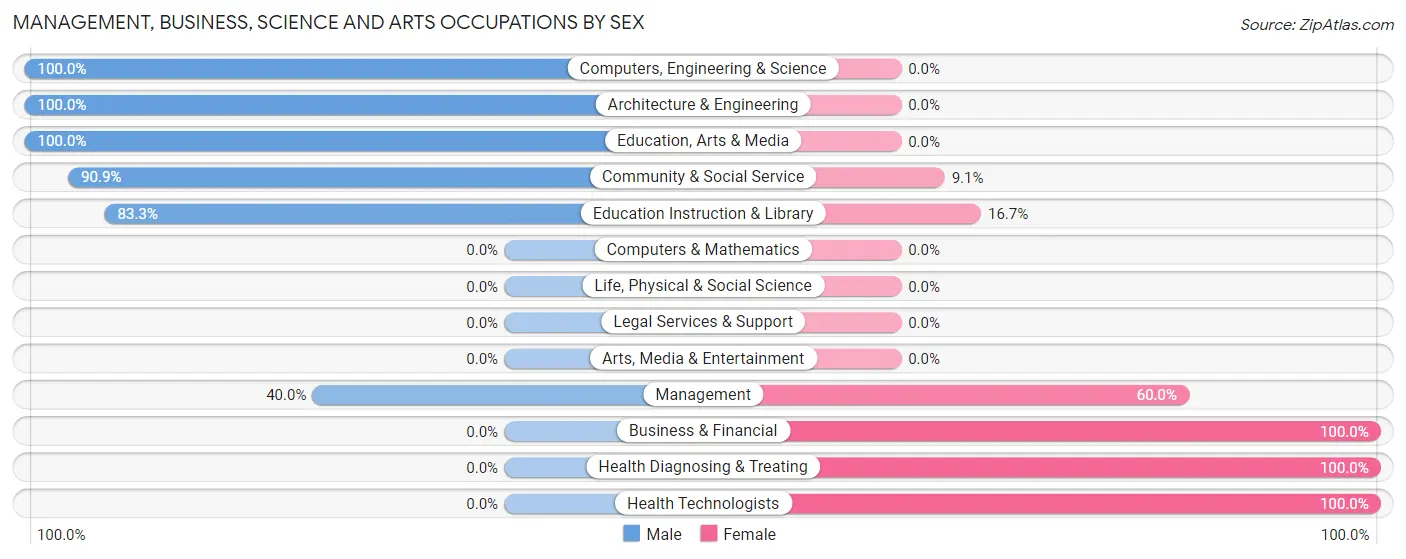
Management, Business, Science and Arts Occupations by Sex
Within the Management, Business, Science and Arts occupations in Wachapreague, the most male-oriented occupations are Computers, Engineering & Science (100.0%), Architecture & Engineering (100.0%), and Education, Arts & Media (100.0%), while the most female-oriented occupations are Business & Financial (100.0%), Health Diagnosing & Treating (100.0%), and Health Technologists (100.0%).
| Occupation | Male | Female |
| Management | 2 (40.0%) | 3 (60.0%) |
| Business & Financial | 0 (0.0%) | 2 (100.0%) |
| Computers, Engineering & Science | 1 (100.0%) | 0 (0.0%) |
| Computers & Mathematics | 0 (0.0%) | 0 (0.0%) |
| Architecture & Engineering | 1 (100.0%) | 0 (0.0%) |
| Life, Physical & Social Science | 0 (0.0%) | 0 (0.0%) |
| Community & Social Service | 10 (90.9%) | 1 (9.1%) |
| Education, Arts & Media | 5 (100.0%) | 0 (0.0%) |
| Legal Services & Support | 0 (0.0%) | 0 (0.0%) |
| Education Instruction & Library | 5 (83.3%) | 1 (16.7%) |
| Arts, Media & Entertainment | 0 (0.0%) | 0 (0.0%) |
| Health Diagnosing & Treating | 0 (0.0%) | 2 (100.0%) |
| Health Technologists | 0 (0.0%) | 1 (100.0%) |
| Total (Category) | 13 (61.9%) | 8 (38.1%) |
| Total (Overall) | 45 (45.9%) | 53 (54.1%) |
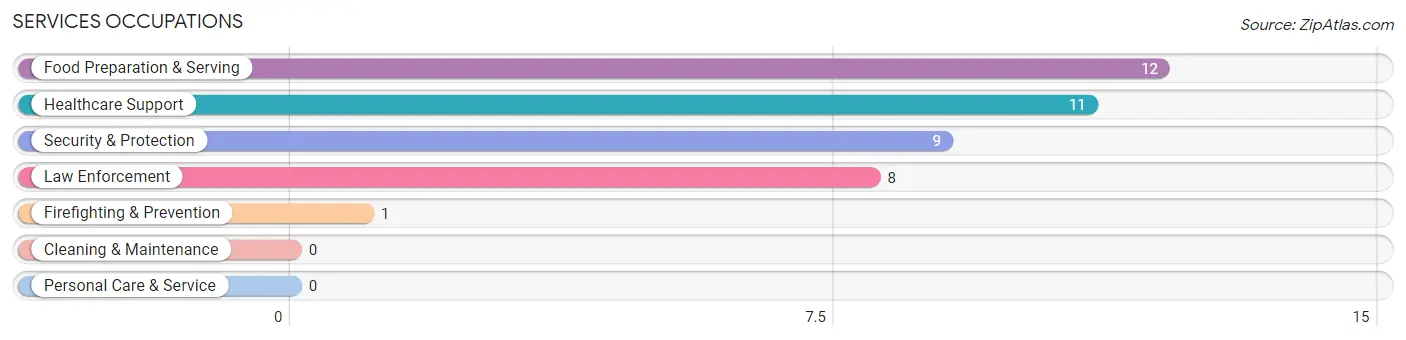
Services Occupations
The most common Services occupations in Wachapreague are Food Preparation & Serving (12 | 12.2%), Healthcare Support (11 | 11.2%), Security & Protection (9 | 9.2%), Law Enforcement (8 | 8.2%), and Firefighting & Prevention (1 | 1.0%).
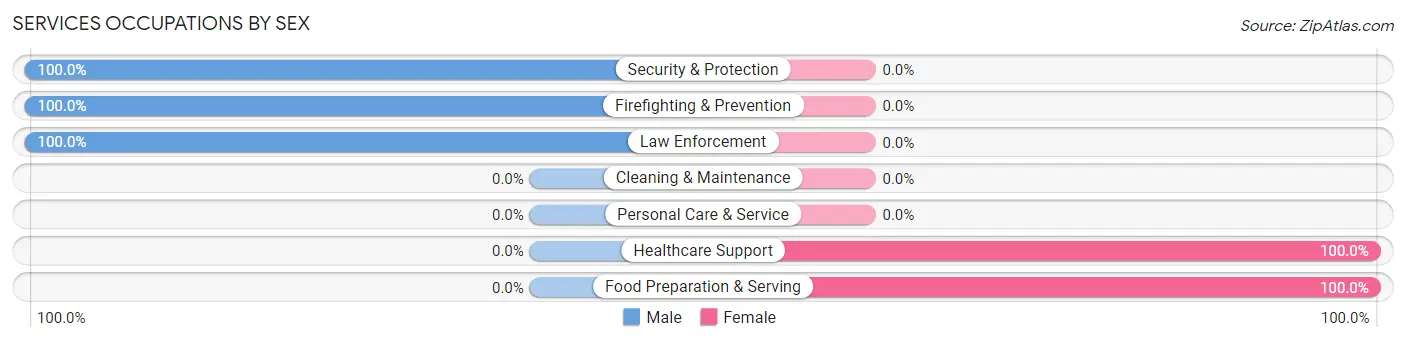
Services Occupations by Sex
Within the Services occupations in Wachapreague, the most male-oriented occupations are Security & Protection (100.0%), Firefighting & Prevention (100.0%), and Law Enforcement (100.0%), while the most female-oriented occupations are Healthcare Support (100.0%), and Food Preparation & Serving (100.0%).
| Occupation | Male | Female |
| Healthcare Support | 0 (0.0%) | 11 (100.0%) |
| Security & Protection | 9 (100.0%) | 0 (0.0%) |
| Firefighting & Prevention | 1 (100.0%) | 0 (0.0%) |
| Law Enforcement | 8 (100.0%) | 0 (0.0%) |
| Food Preparation & Serving | 0 (0.0%) | 12 (100.0%) |
| Cleaning & Maintenance | 0 (0.0%) | 0 (0.0%) |
| Personal Care & Service | 0 (0.0%) | 0 (0.0%) |
| Total (Category) | 9 (28.1%) | 23 (71.9%) |
| Total (Overall) | 45 (45.9%) | 53 (54.1%) |
Sales and Office Occupations
The most common Sales and Office occupations in Wachapreague are Sales & Related (12 | 12.2%), and Office & Administration (12 | 12.2%).
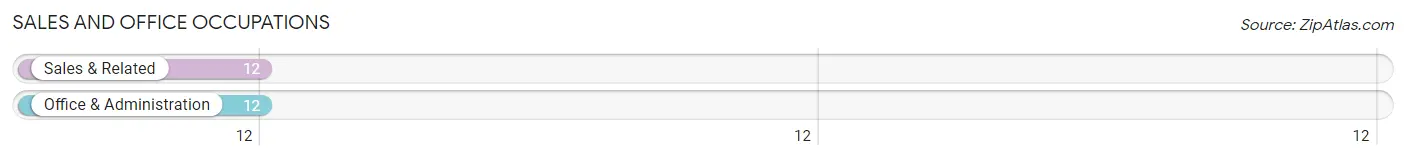
Sales and Office Occupations by Sex
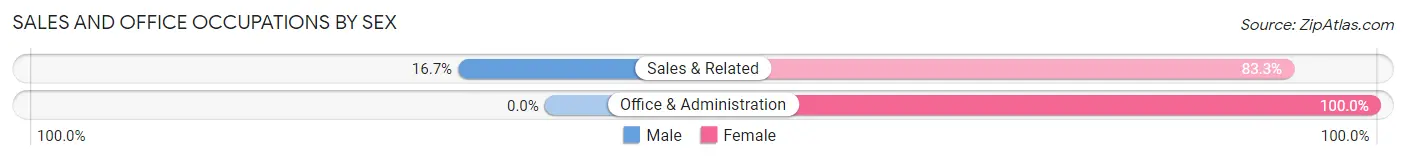
| Occupation | Male | Female |
| Sales & Related | 2 (16.7%) | 10 (83.3%) |
| Office & Administration | 0 (0.0%) | 12 (100.0%) |
| Total (Category) | 2 (8.3%) | 22 (91.7%) |
| Total (Overall) | 45 (45.9%) | 53 (54.1%) |
Natural Resources, Construction and Maintenance Occupations
The most common Natural Resources, Construction and Maintenance occupations in Wachapreague are Farming, Fishing & Forestry (14 | 14.3%), and Installation, Maintenance & Repair (2 | 2.0%).
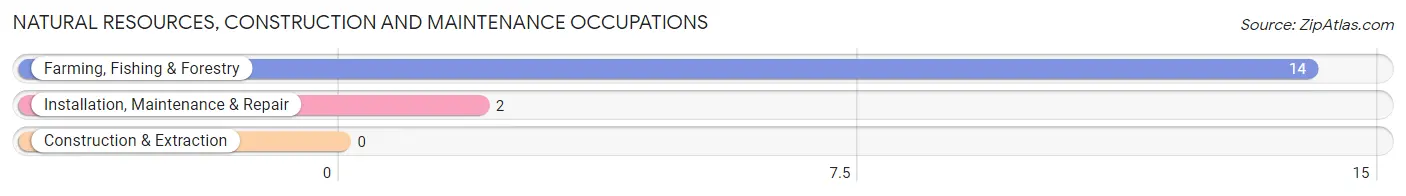
Natural Resources, Construction and Maintenance Occupations by Sex
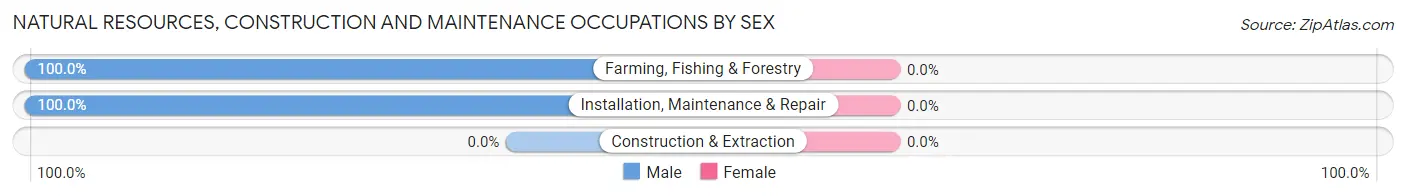
| Occupation | Male | Female |
| Farming, Fishing & Forestry | 14 (100.0%) | 0 (0.0%) |
| Construction & Extraction | 0 (0.0%) | 0 (0.0%) |
| Installation, Maintenance & Repair | 2 (100.0%) | 0 (0.0%) |
| Total (Category) | 16 (100.0%) | 0 (0.0%) |
| Total (Overall) | 45 (45.9%) | 53 (54.1%) |
Production, Transportation and Moving Occupations
The most common Production, Transportation and Moving occupations in Wachapreague are , and Transportation (5 | 5.1%).
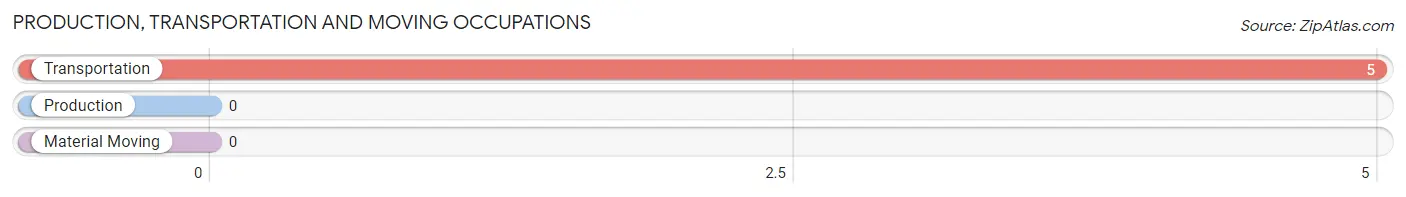
Production, Transportation and Moving Occupations by Sex
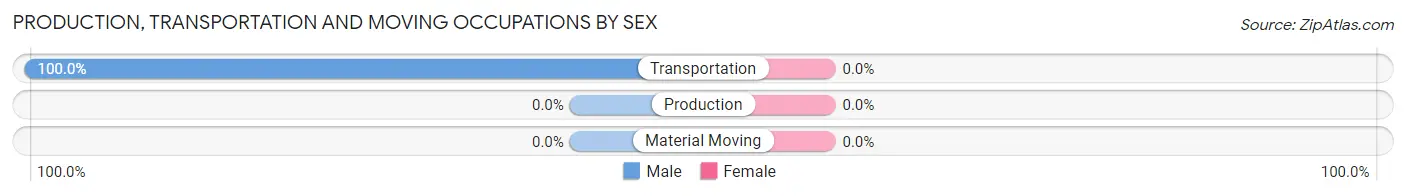
| Occupation | Male | Female |
| Production | 0 (0.0%) | 0 (0.0%) |
| Transportation | 5 (100.0%) | 0 (0.0%) |
| Material Moving | 0 (0.0%) | 0 (0.0%) |
| Total (Category) | 5 (100.0%) | 0 (0.0%) |
| Total (Overall) | 45 (45.9%) | 53 (54.1%) |
Employment Industries by Sex in Wachapreague
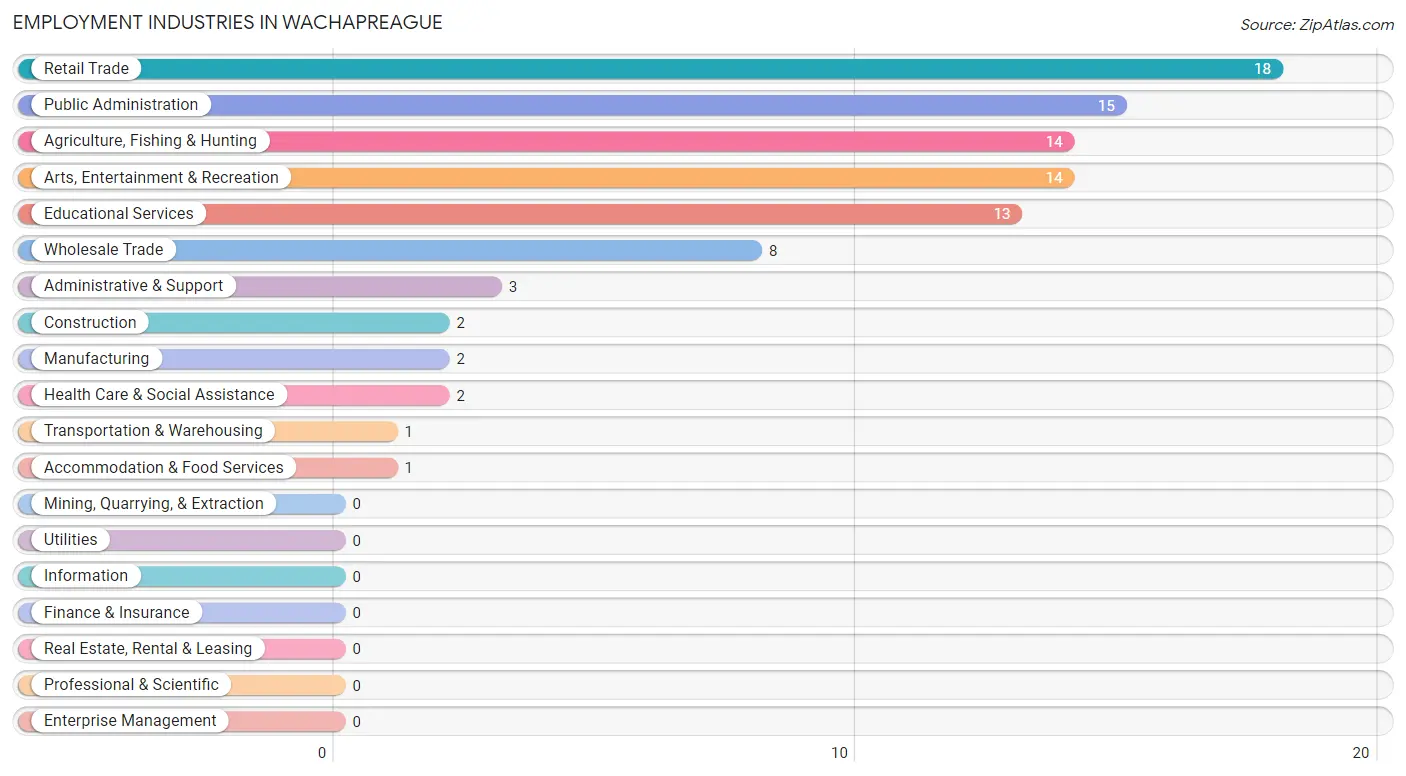
Employment Industries in Wachapreague
The major employment industries in Wachapreague include Retail Trade (18 | 18.4%), Public Administration (15 | 15.3%), Agriculture, Fishing & Hunting (14 | 14.3%), Arts, Entertainment & Recreation (14 | 14.3%), and Educational Services (13 | 13.3%).
Employment Industries by Sex in Wachapreague
The Wachapreague industries that see more men than women are Agriculture, Fishing & Hunting (100.0%), Manufacturing (100.0%), and Transportation & Warehousing (100.0%), whereas the industries that tend to have a higher number of women are Wholesale Trade (100.0%), Health Care & Social Assistance (100.0%), and Arts, Entertainment & Recreation (100.0%).
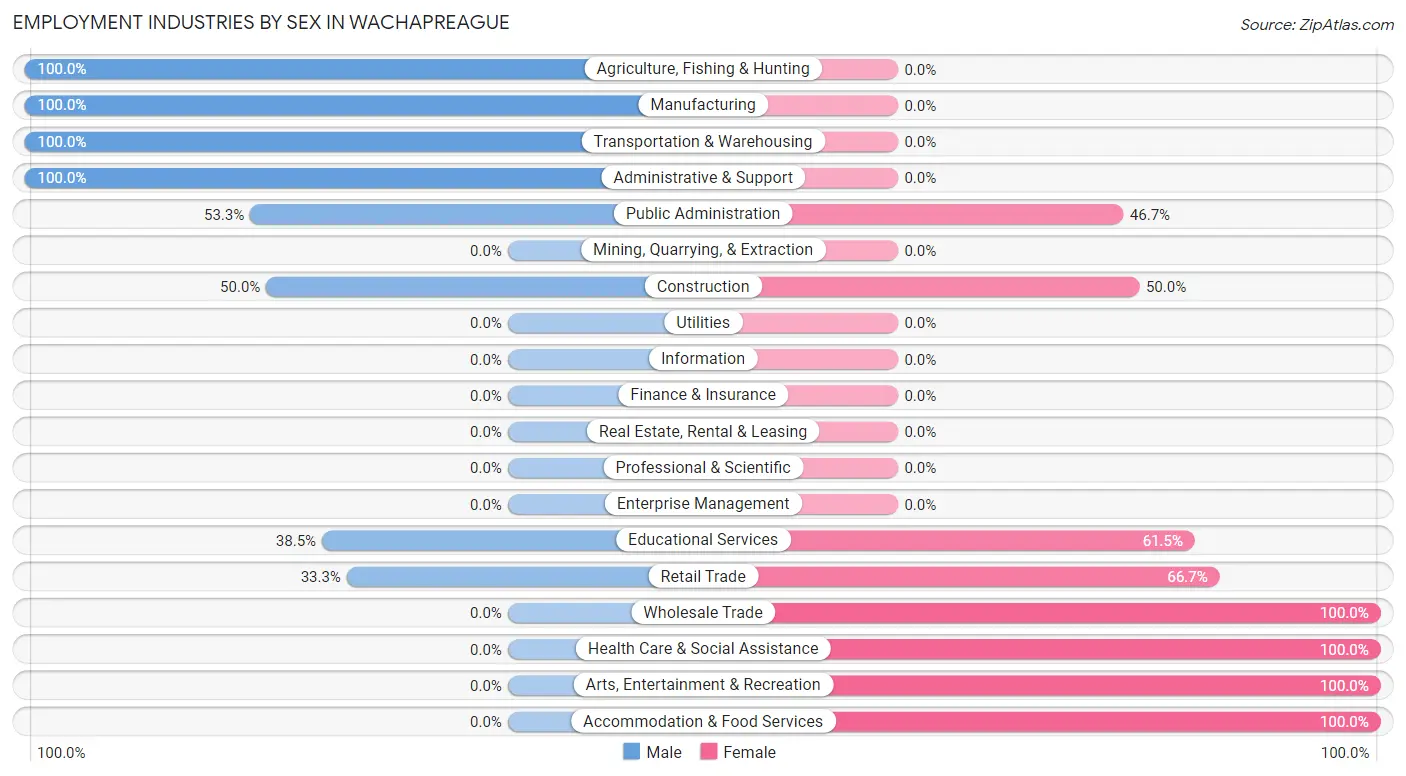
| Industry | Male | Female |
| Agriculture, Fishing & Hunting | 14 (100.0%) | 0 (0.0%) |
| Mining, Quarrying, & Extraction | 0 (0.0%) | 0 (0.0%) |
| Construction | 1 (50.0%) | 1 (50.0%) |
| Manufacturing | 2 (100.0%) | 0 (0.0%) |
| Wholesale Trade | 0 (0.0%) | 8 (100.0%) |
| Retail Trade | 6 (33.3%) | 12 (66.7%) |
| Transportation & Warehousing | 1 (100.0%) | 0 (0.0%) |
| Utilities | 0 (0.0%) | 0 (0.0%) |
| Information | 0 (0.0%) | 0 (0.0%) |
| Finance & Insurance | 0 (0.0%) | 0 (0.0%) |
| Real Estate, Rental & Leasing | 0 (0.0%) | 0 (0.0%) |
| Professional & Scientific | 0 (0.0%) | 0 (0.0%) |
| Enterprise Management | 0 (0.0%) | 0 (0.0%) |
| Administrative & Support | 3 (100.0%) | 0 (0.0%) |
| Educational Services | 5 (38.5%) | 8 (61.5%) |
| Health Care & Social Assistance | 0 (0.0%) | 2 (100.0%) |
| Arts, Entertainment & Recreation | 0 (0.0%) | 14 (100.0%) |
| Accommodation & Food Services | 0 (0.0%) | 1 (100.0%) |
| Public Administration | 8 (53.3%) | 7 (46.7%) |
| Total | 45 (45.9%) | 53 (54.1%) |
Education in Wachapreague
School Enrollment in Wachapreague
The most common levels of schooling among the 41 students in Wachapreague are college / undergraduate (23 | 56.1%), high school (17 | 41.5%), and elementary school (1 | 2.4%).
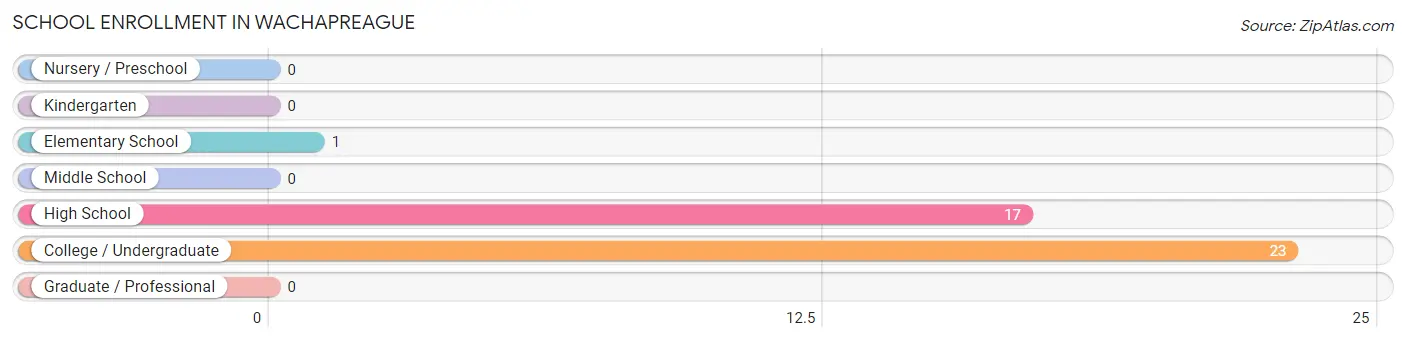
| School Level | # Students | % Students |
| Nursery / Preschool | 0 | 0.0% |
| Kindergarten | 0 | 0.0% |
| Elementary School | 1 | 2.4% |
| Middle School | 0 | 0.0% |
| High School | 17 | 41.5% |
| College / Undergraduate | 23 | 56.1% |
| Graduate / Professional | 0 | 0.0% |
| Total | 41 | 100.0% |
School Enrollment by Age by Funding Source in Wachapreague
Out of a total of 41 students who are enrolled in schools in Wachapreague, 11 (26.8%) attend a private institution, while the remaining 30 (73.2%) are enrolled in public schools. The age group of 20 to 24 year olds has the highest likelihood of being enrolled in private schools, with 5 (100.0% in the age bracket) enrolled. Conversely, the age group of 5 to 9 year old has the lowest likelihood of being enrolled in a private school, with 1 (100.0% in the age bracket) attending a public institution.
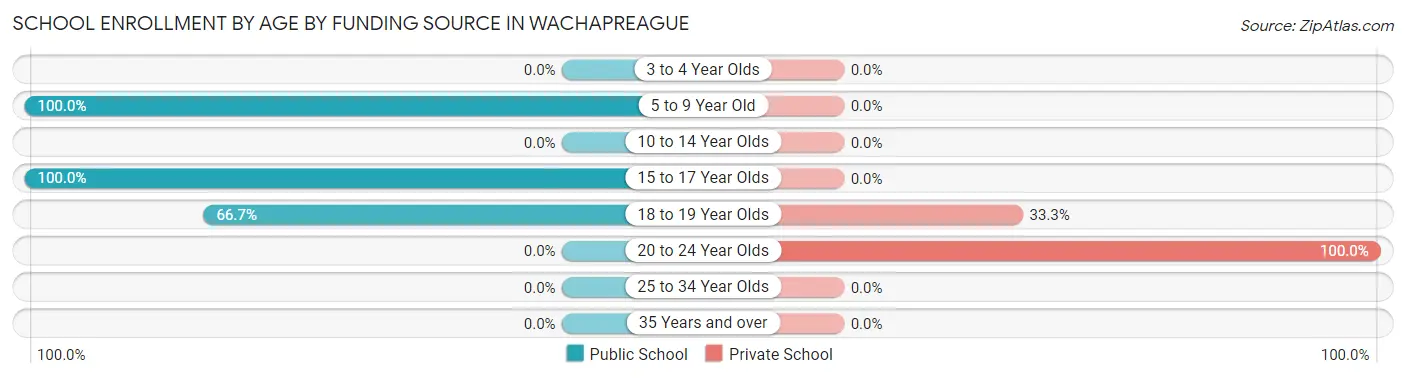
| Age Bracket | Public School | Private School |
| 3 to 4 Year Olds | 0 (0.0%) | 0 (0.0%) |
| 5 to 9 Year Old | 1 (100.0%) | 0 (0.0%) |
| 10 to 14 Year Olds | 0 (0.0%) | 0 (0.0%) |
| 15 to 17 Year Olds | 17 (100.0%) | 0 (0.0%) |
| 18 to 19 Year Olds | 12 (66.7%) | 6 (33.3%) |
| 20 to 24 Year Olds | 0 (0.0%) | 5 (100.0%) |
| 25 to 34 Year Olds | 0 (0.0%) | 0 (0.0%) |
| 35 Years and over | 0 (0.0%) | 0 (0.0%) |
| Total | 30 (73.2%) | 11 (26.8%) |
Educational Attainment by Field of Study in Wachapreague
Liberal arts & history (14 | 21.5%), science & technology (10 | 15.4%), business (7 | 10.8%), education (7 | 10.8%), and social sciences (6 | 9.2%) are the most common fields of study among 65 individuals in Wachapreague who have obtained a bachelor's degree or higher.
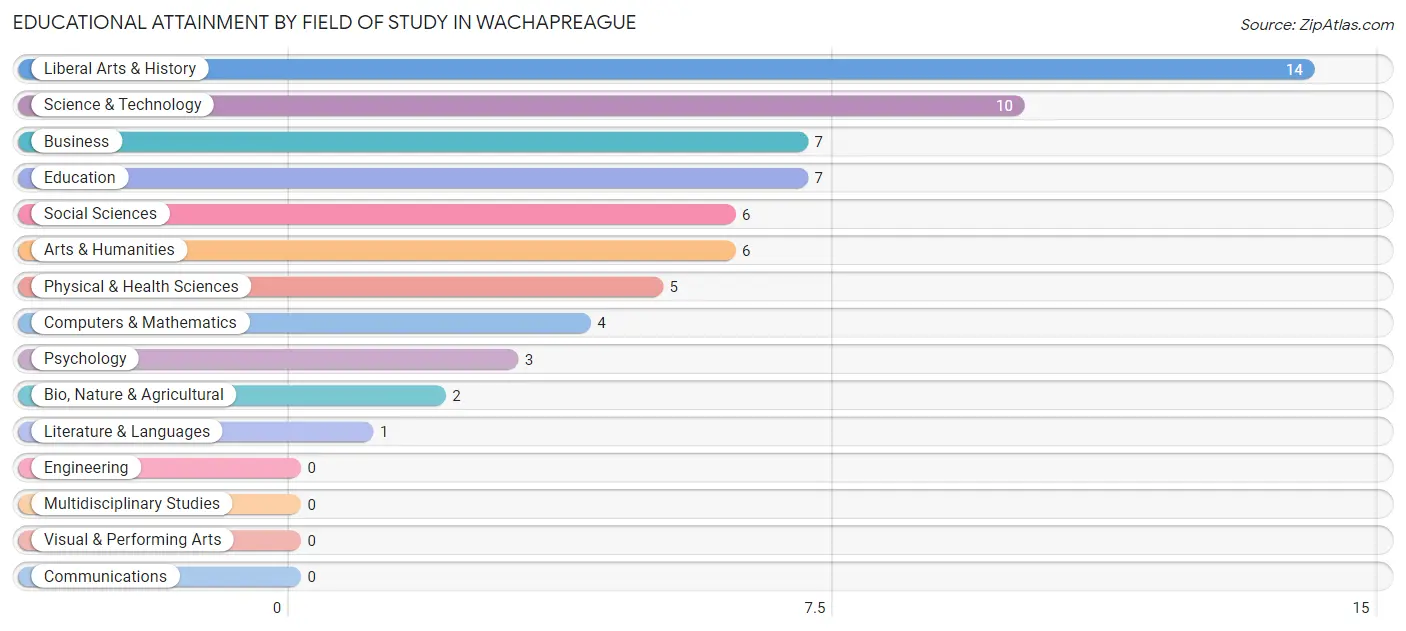
| Field of Study | # Graduates | % Graduates |
| Computers & Mathematics | 4 | 6.1% |
| Bio, Nature & Agricultural | 2 | 3.1% |
| Physical & Health Sciences | 5 | 7.7% |
| Psychology | 3 | 4.6% |
| Social Sciences | 6 | 9.2% |
| Engineering | 0 | 0.0% |
| Multidisciplinary Studies | 0 | 0.0% |
| Science & Technology | 10 | 15.4% |
| Business | 7 | 10.8% |
| Education | 7 | 10.8% |
| Literature & Languages | 1 | 1.5% |
| Liberal Arts & History | 14 | 21.5% |
| Visual & Performing Arts | 0 | 0.0% |
| Communications | 0 | 0.0% |
| Arts & Humanities | 6 | 9.2% |
| Total | 65 | 100.0% |
Transportation & Commute in Wachapreague
Vehicle Availability by Sex in Wachapreague
The most prevalent vehicle ownership categories in Wachapreague are males with 1 vehicle (27, accounting for 60.0%) and females with 1 vehicle (29, making up 71.1%).
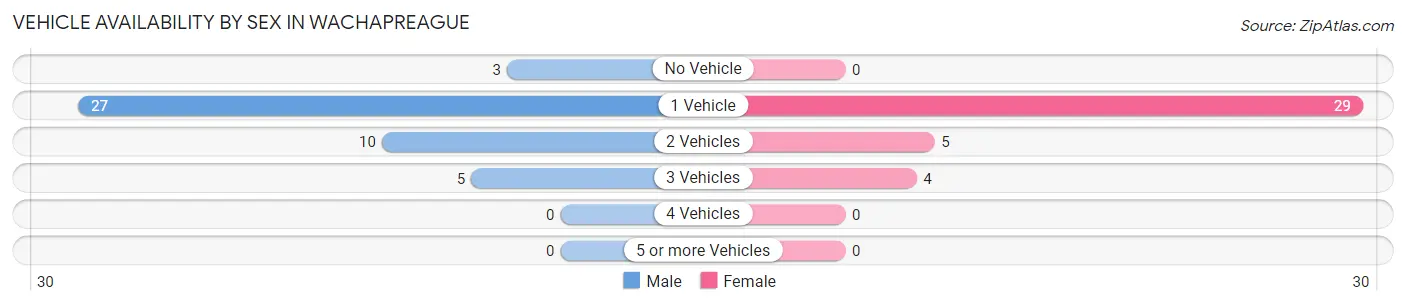
| Vehicles Available | Male | Female |
| No Vehicle | 3 (6.7%) | 0 (0.0%) |
| 1 Vehicle | 27 (60.0%) | 29 (76.3%) |
| 2 Vehicles | 10 (22.2%) | 5 (13.2%) |
| 3 Vehicles | 5 (11.1%) | 4 (10.5%) |
| 4 Vehicles | 0 (0.0%) | 0 (0.0%) |
| 5 or more Vehicles | 0 (0.0%) | 0 (0.0%) |
| Total | 45 (100.0%) | 38 (100.0%) |
Commute Time in Wachapreague
The most frequently occuring commute durations in Wachapreague are 10 to 14 minutes (32 commuters, 38.6%), 5 to 9 minutes (12 commuters, 14.5%), and 40 to 44 minutes (11 commuters, 13.3%).
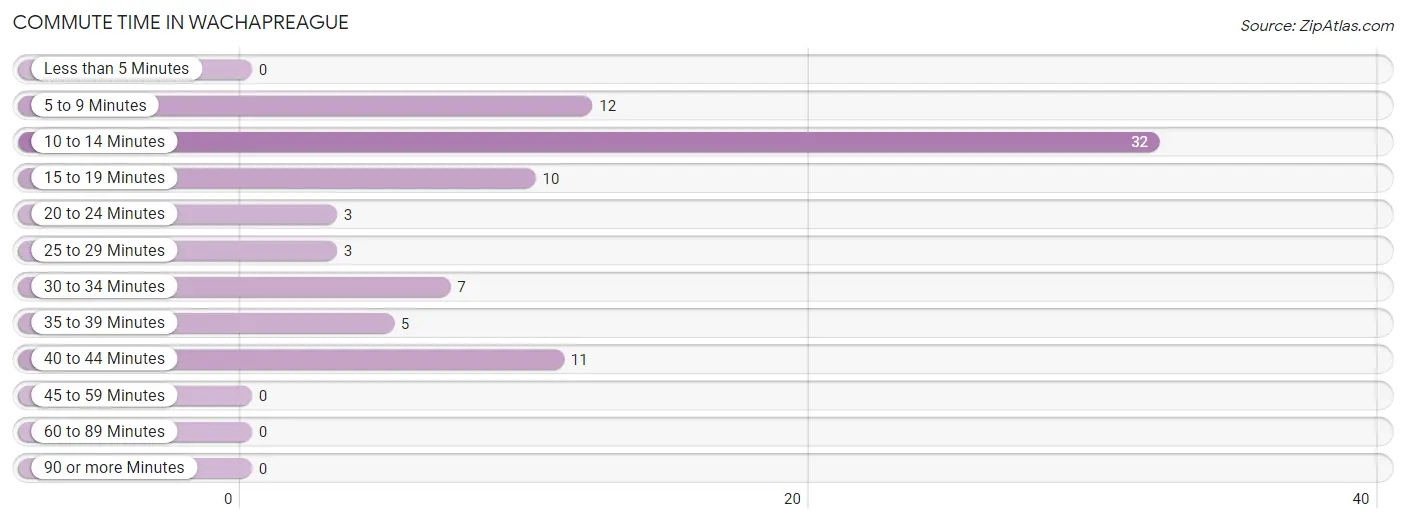
| Commute Time | # Commuters | % Commuters |
| Less than 5 Minutes | 0 | 0.0% |
| 5 to 9 Minutes | 12 | 14.5% |
| 10 to 14 Minutes | 32 | 38.6% |
| 15 to 19 Minutes | 10 | 12.0% |
| 20 to 24 Minutes | 3 | 3.6% |
| 25 to 29 Minutes | 3 | 3.6% |
| 30 to 34 Minutes | 7 | 8.4% |
| 35 to 39 Minutes | 5 | 6.0% |
| 40 to 44 Minutes | 11 | 13.3% |
| 45 to 59 Minutes | 0 | 0.0% |
| 60 to 89 Minutes | 0 | 0.0% |
| 90 or more Minutes | 0 | 0.0% |
Commute Time by Sex in Wachapreague
The most common commute times in Wachapreague are 10 to 14 minutes (13 commuters, 28.9%) for males and 10 to 14 minutes (19 commuters, 50.0%) for females.
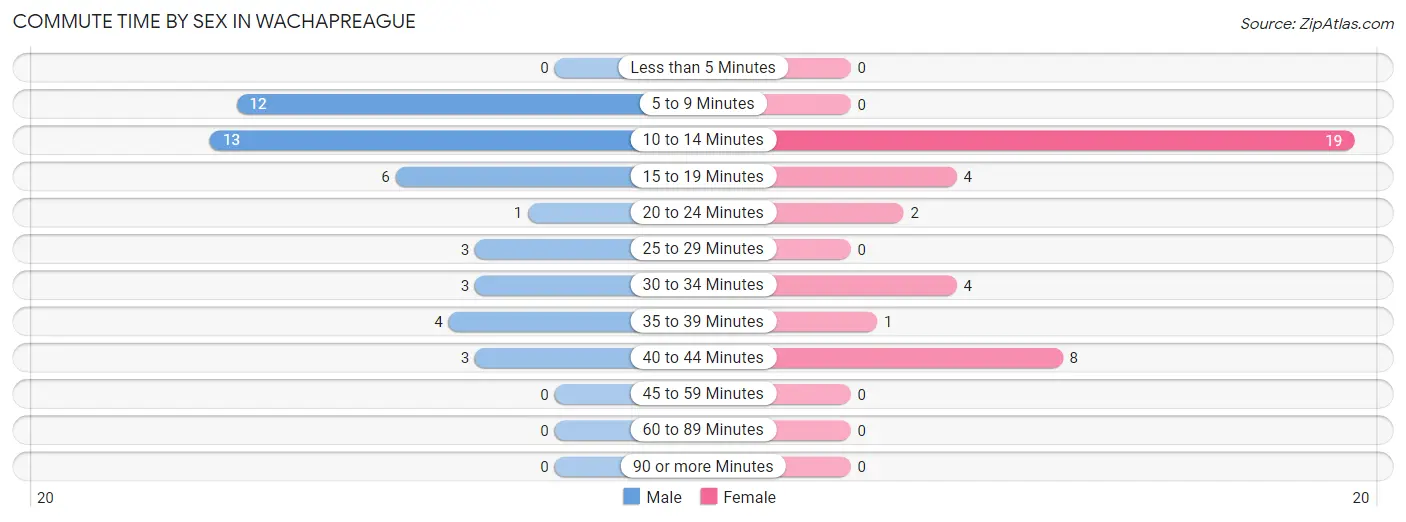
| Commute Time | Male | Female |
| Less than 5 Minutes | 0 (0.0%) | 0 (0.0%) |
| 5 to 9 Minutes | 12 (26.7%) | 0 (0.0%) |
| 10 to 14 Minutes | 13 (28.9%) | 19 (50.0%) |
| 15 to 19 Minutes | 6 (13.3%) | 4 (10.5%) |
| 20 to 24 Minutes | 1 (2.2%) | 2 (5.3%) |
| 25 to 29 Minutes | 3 (6.7%) | 0 (0.0%) |
| 30 to 34 Minutes | 3 (6.7%) | 4 (10.5%) |
| 35 to 39 Minutes | 4 (8.9%) | 1 (2.6%) |
| 40 to 44 Minutes | 3 (6.7%) | 8 (21.0%) |
| 45 to 59 Minutes | 0 (0.0%) | 0 (0.0%) |
| 60 to 89 Minutes | 0 (0.0%) | 0 (0.0%) |
| 90 or more Minutes | 0 (0.0%) | 0 (0.0%) |
Time of Departure to Work by Sex in Wachapreague
The most frequent times of departure to work in Wachapreague are 6:30 AM to 6:59 AM (13, 28.9%) for males and 9:00 AM to 9:59 AM (12, 31.6%) for females.
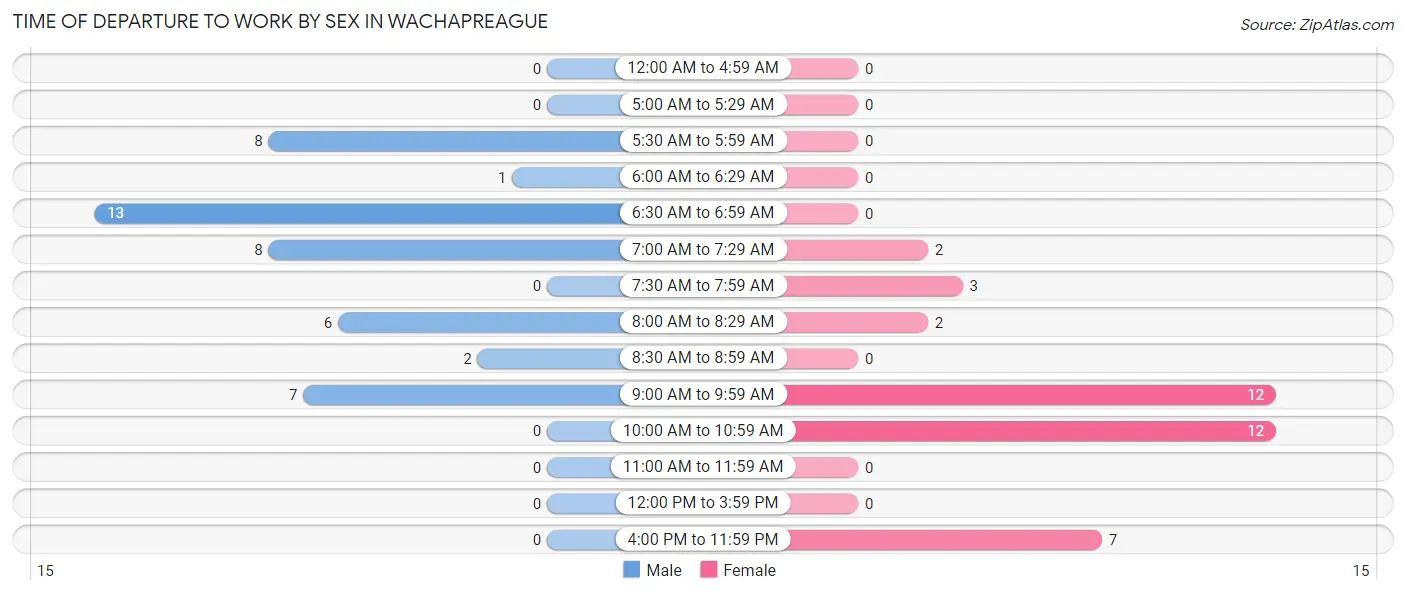
| Time of Departure | Male | Female |
| 12:00 AM to 4:59 AM | 0 (0.0%) | 0 (0.0%) |
| 5:00 AM to 5:29 AM | 0 (0.0%) | 0 (0.0%) |
| 5:30 AM to 5:59 AM | 8 (17.8%) | 0 (0.0%) |
| 6:00 AM to 6:29 AM | 1 (2.2%) | 0 (0.0%) |
| 6:30 AM to 6:59 AM | 13 (28.9%) | 0 (0.0%) |
| 7:00 AM to 7:29 AM | 8 (17.8%) | 2 (5.3%) |
| 7:30 AM to 7:59 AM | 0 (0.0%) | 3 (7.9%) |
| 8:00 AM to 8:29 AM | 6 (13.3%) | 2 (5.3%) |
| 8:30 AM to 8:59 AM | 2 (4.4%) | 0 (0.0%) |
| 9:00 AM to 9:59 AM | 7 (15.6%) | 12 (31.6%) |
| 10:00 AM to 10:59 AM | 0 (0.0%) | 12 (31.6%) |
| 11:00 AM to 11:59 AM | 0 (0.0%) | 0 (0.0%) |
| 12:00 PM to 3:59 PM | 0 (0.0%) | 0 (0.0%) |
| 4:00 PM to 11:59 PM | 0 (0.0%) | 7 (18.4%) |
| Total | 45 (100.0%) | 38 (100.0%) |
Housing Occupancy in Wachapreague
Occupancy by Ownership in Wachapreague
Of the total 137 dwellings in Wachapreague, owner-occupied units account for 111 (81.0%), while renter-occupied units make up 26 (19.0%).
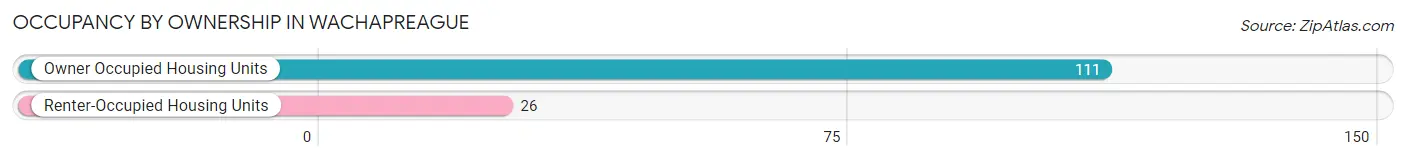
| Occupancy | # Housing Units | % Housing Units |
| Owner Occupied Housing Units | 111 | 81.0% |
| Renter-Occupied Housing Units | 26 | 19.0% |
| Total Occupied Housing Units | 137 | 100.0% |
Occupancy by Household Size in Wachapreague
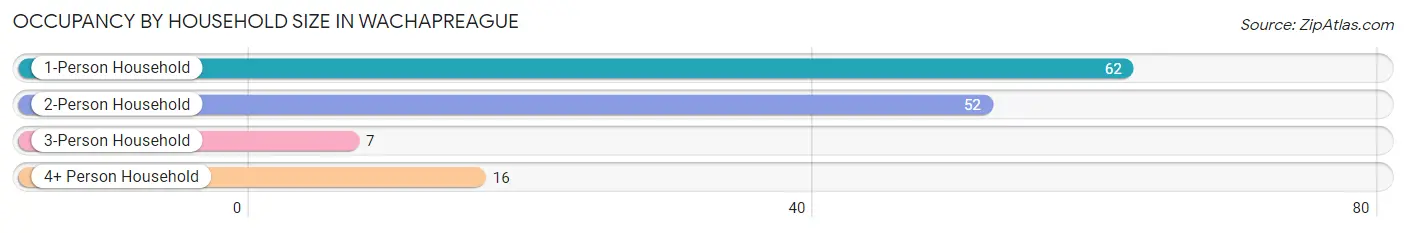
| Household Size | # Housing Units | % Housing Units |
| 1-Person Household | 62 | 45.3% |
| 2-Person Household | 52 | 38.0% |
| 3-Person Household | 7 | 5.1% |
| 4+ Person Household | 16 | 11.7% |
| Total Housing Units | 137 | 100.0% |
Occupancy by Ownership by Household Size in Wachapreague
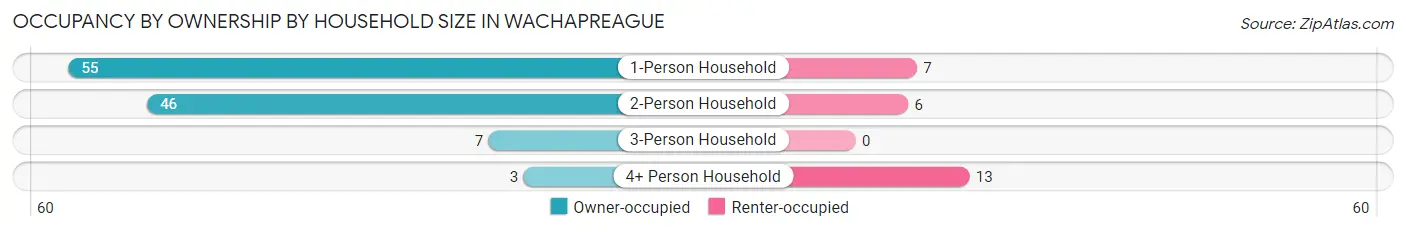
| Household Size | Owner-occupied | Renter-occupied |
| 1-Person Household | 55 (88.7%) | 7 (11.3%) |
| 2-Person Household | 46 (88.5%) | 6 (11.5%) |
| 3-Person Household | 7 (100.0%) | 0 (0.0%) |
| 4+ Person Household | 3 (18.8%) | 13 (81.2%) |
| Total Housing Units | 111 (81.0%) | 26 (19.0%) |
Occupancy by Educational Attainment in Wachapreague
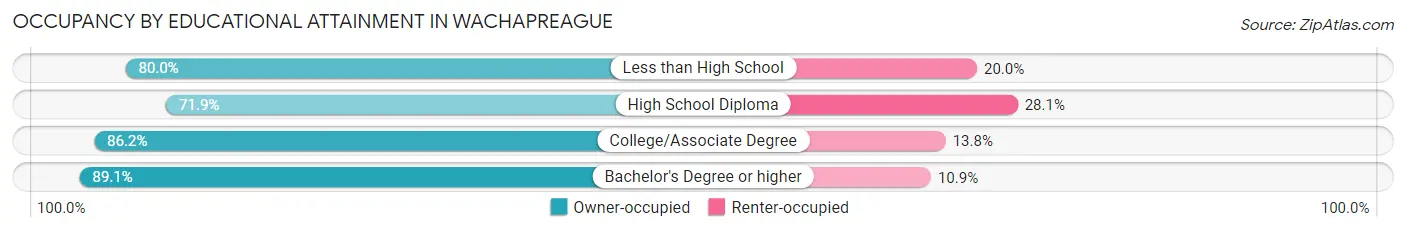
| Household Size | Owner-occupied | Renter-occupied |
| Less than High School | 4 (80.0%) | 1 (20.0%) |
| High School Diploma | 41 (71.9%) | 16 (28.1%) |
| College/Associate Degree | 25 (86.2%) | 4 (13.8%) |
| Bachelor's Degree or higher | 41 (89.1%) | 5 (10.9%) |
Occupancy by Age of Householder in Wachapreague
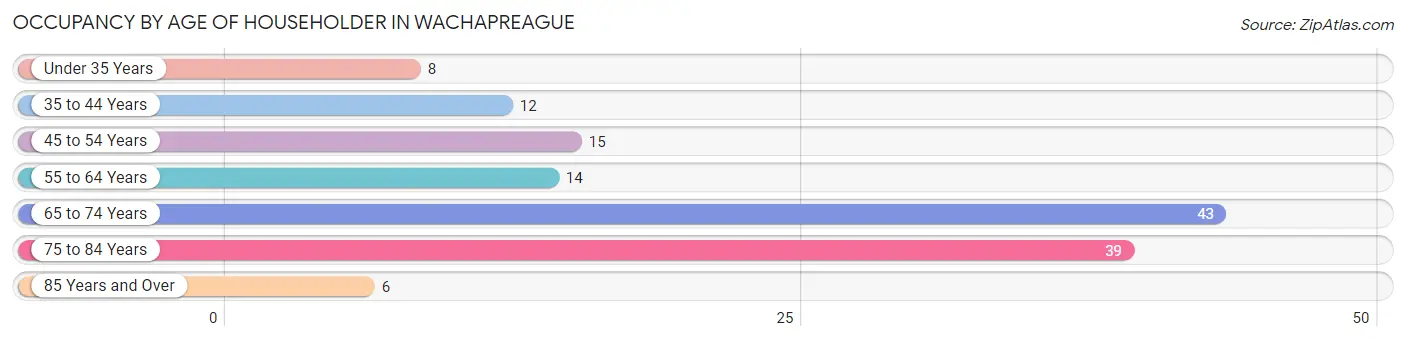
| Age Bracket | # Households | % Households |
| Under 35 Years | 8 | 5.8% |
| 35 to 44 Years | 12 | 8.8% |
| 45 to 54 Years | 15 | 11.0% |
| 55 to 64 Years | 14 | 10.2% |
| 65 to 74 Years | 43 | 31.4% |
| 75 to 84 Years | 39 | 28.5% |
| 85 Years and Over | 6 | 4.4% |
| Total | 137 | 100.0% |
Housing Finances in Wachapreague
Median Income by Occupancy in Wachapreague
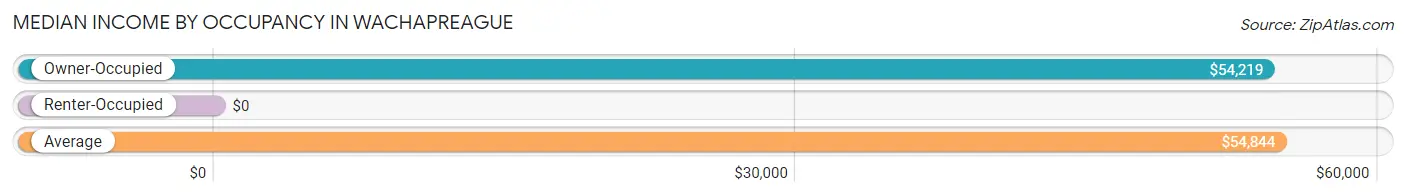
| Occupancy Type | # Households | Median Income |
| Owner-Occupied | 111 (81.0%) | $54,219 |
| Renter-Occupied | 26 (19.0%) | $0 |
| Average | 137 (100.0%) | $54,844 |
Occupancy by Householder Income Bracket in Wachapreague
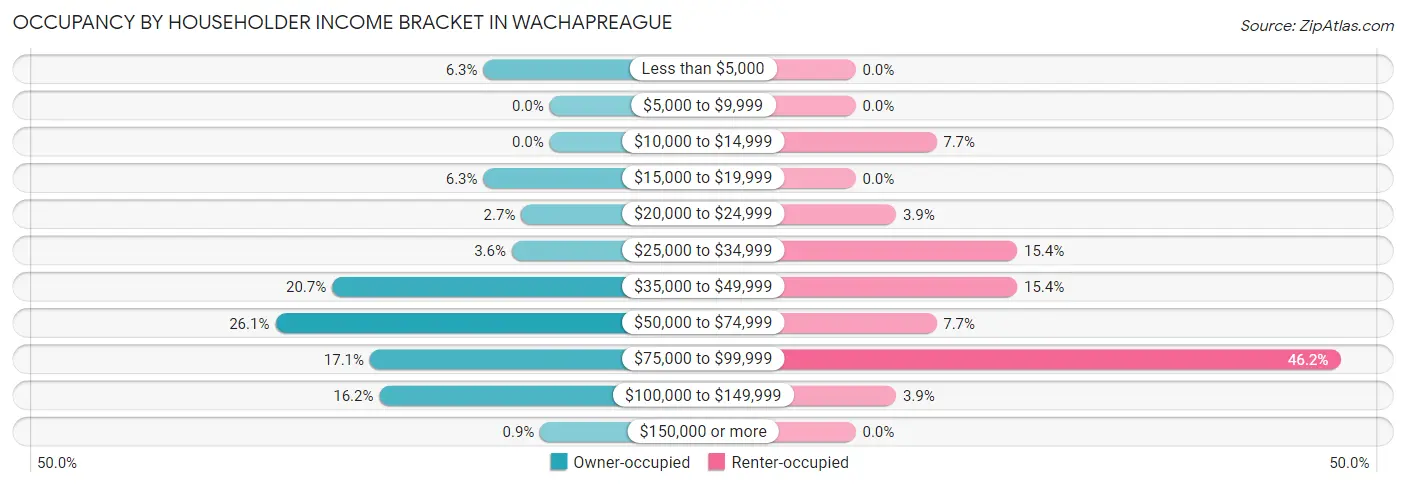
| Income Bracket | Owner-occupied | Renter-occupied |
| Less than $5,000 | 7 (6.3%) | 0 (0.0%) |
| $5,000 to $9,999 | 0 (0.0%) | 0 (0.0%) |
| $10,000 to $14,999 | 0 (0.0%) | 2 (7.7%) |
| $15,000 to $19,999 | 7 (6.3%) | 0 (0.0%) |
| $20,000 to $24,999 | 3 (2.7%) | 1 (3.8%) |
| $25,000 to $34,999 | 4 (3.6%) | 4 (15.4%) |
| $35,000 to $49,999 | 23 (20.7%) | 4 (15.4%) |
| $50,000 to $74,999 | 29 (26.1%) | 2 (7.7%) |
| $75,000 to $99,999 | 19 (17.1%) | 12 (46.2%) |
| $100,000 to $149,999 | 18 (16.2%) | 1 (3.8%) |
| $150,000 or more | 1 (0.9%) | 0 (0.0%) |
| Total | 111 (100.0%) | 26 (100.0%) |
Monthly Housing Cost Tiers in Wachapreague
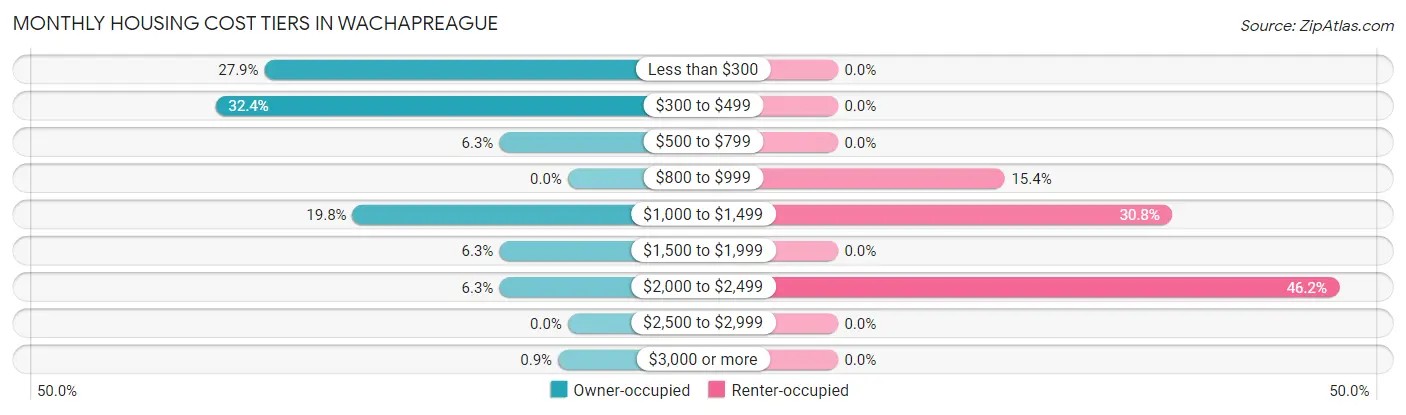
| Monthly Cost | Owner-occupied | Renter-occupied |
| Less than $300 | 31 (27.9%) | 0 (0.0%) |
| $300 to $499 | 36 (32.4%) | 0 (0.0%) |
| $500 to $799 | 7 (6.3%) | 0 (0.0%) |
| $800 to $999 | 0 (0.0%) | 4 (15.4%) |
| $1,000 to $1,499 | 22 (19.8%) | 8 (30.8%) |
| $1,500 to $1,999 | 7 (6.3%) | 0 (0.0%) |
| $2,000 to $2,499 | 7 (6.3%) | 12 (46.2%) |
| $2,500 to $2,999 | 0 (0.0%) | 0 (0.0%) |
| $3,000 or more | 1 (0.9%) | 0 (0.0%) |
| Total | 111 (100.0%) | 26 (100.0%) |
Physical Housing Characteristics in Wachapreague
Housing Structures in Wachapreague
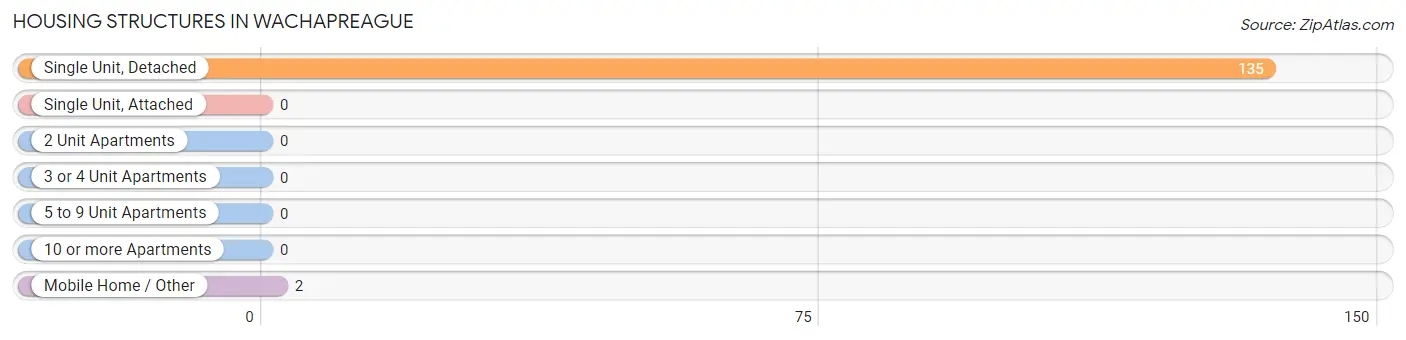
| Structure Type | # Housing Units | % Housing Units |
| Single Unit, Detached | 135 | 98.5% |
| Single Unit, Attached | 0 | 0.0% |
| 2 Unit Apartments | 0 | 0.0% |
| 3 or 4 Unit Apartments | 0 | 0.0% |
| 5 to 9 Unit Apartments | 0 | 0.0% |
| 10 or more Apartments | 0 | 0.0% |
| Mobile Home / Other | 2 | 1.5% |
| Total | 137 | 100.0% |
Housing Structures by Occupancy in Wachapreague
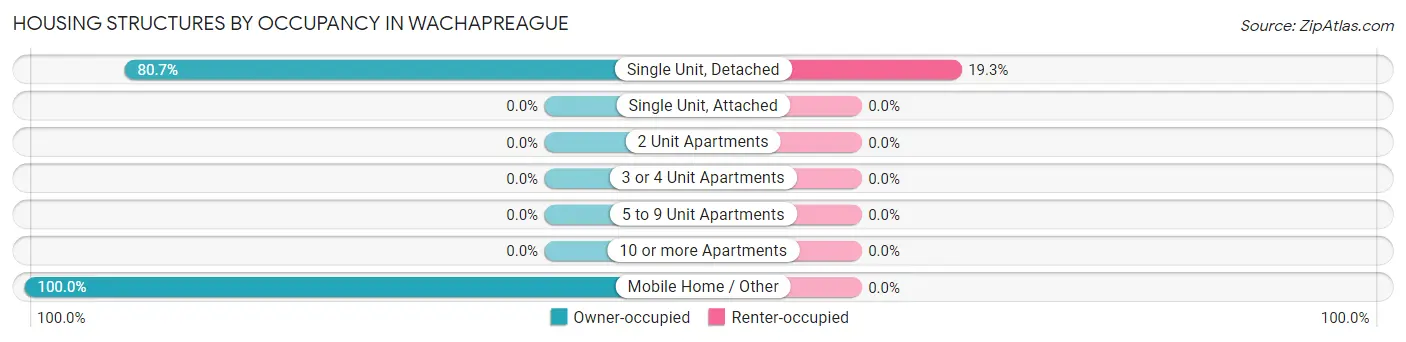
| Structure Type | Owner-occupied | Renter-occupied |
| Single Unit, Detached | 109 (80.7%) | 26 (19.3%) |
| Single Unit, Attached | 0 (0.0%) | 0 (0.0%) |
| 2 Unit Apartments | 0 (0.0%) | 0 (0.0%) |
| 3 or 4 Unit Apartments | 0 (0.0%) | 0 (0.0%) |
| 5 to 9 Unit Apartments | 0 (0.0%) | 0 (0.0%) |
| 10 or more Apartments | 0 (0.0%) | 0 (0.0%) |
| Mobile Home / Other | 2 (100.0%) | 0 (0.0%) |
| Total | 111 (81.0%) | 26 (19.0%) |
Housing Structures by Number of Rooms in Wachapreague
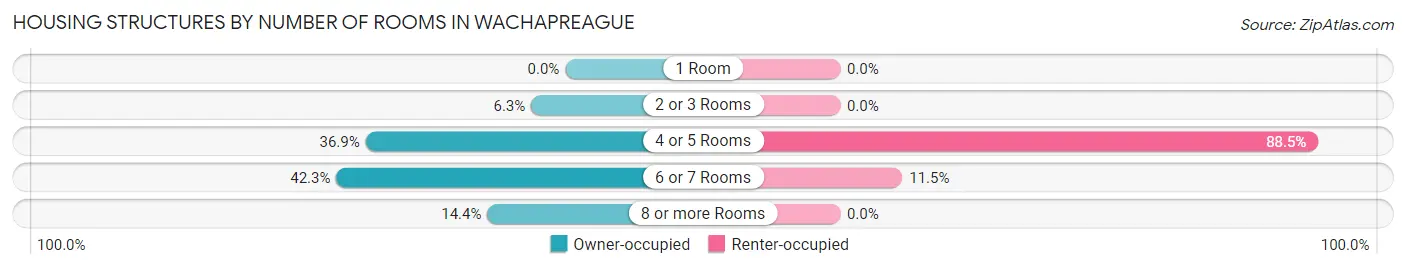
| Number of Rooms | Owner-occupied | Renter-occupied |
| 1 Room | 0 (0.0%) | 0 (0.0%) |
| 2 or 3 Rooms | 7 (6.3%) | 0 (0.0%) |
| 4 or 5 Rooms | 41 (36.9%) | 23 (88.5%) |
| 6 or 7 Rooms | 47 (42.3%) | 3 (11.5%) |
| 8 or more Rooms | 16 (14.4%) | 0 (0.0%) |
| Total | 111 (100.0%) | 26 (100.0%) |
Housing Structure by Heating Type in Wachapreague
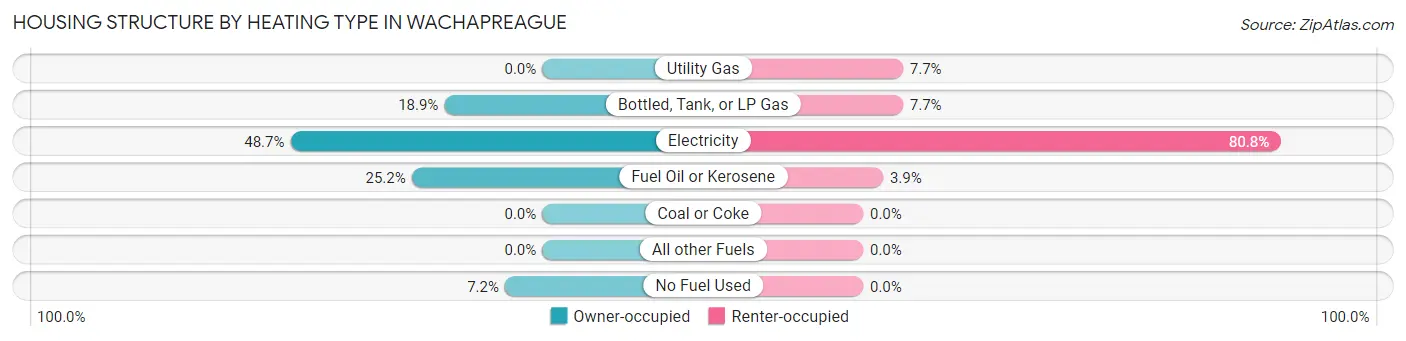
| Heating Type | Owner-occupied | Renter-occupied |
| Utility Gas | 0 (0.0%) | 2 (7.7%) |
| Bottled, Tank, or LP Gas | 21 (18.9%) | 2 (7.7%) |
| Electricity | 54 (48.6%) | 21 (80.8%) |
| Fuel Oil or Kerosene | 28 (25.2%) | 1 (3.8%) |
| Coal or Coke | 0 (0.0%) | 0 (0.0%) |
| All other Fuels | 0 (0.0%) | 0 (0.0%) |
| No Fuel Used | 8 (7.2%) | 0 (0.0%) |
| Total | 111 (100.0%) | 26 (100.0%) |
Household Vehicle Usage in Wachapreague
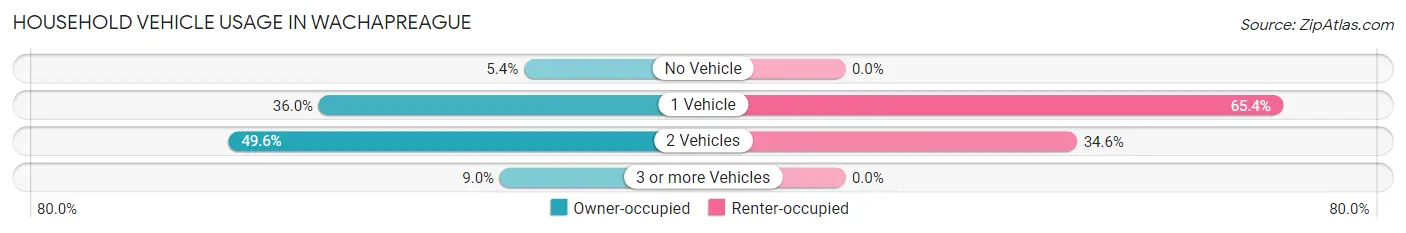
| Vehicles per Household | Owner-occupied | Renter-occupied |
| No Vehicle | 6 (5.4%) | 0 (0.0%) |
| 1 Vehicle | 40 (36.0%) | 17 (65.4%) |
| 2 Vehicles | 55 (49.5%) | 9 (34.6%) |
| 3 or more Vehicles | 10 (9.0%) | 0 (0.0%) |
| Total | 111 (100.0%) | 26 (100.0%) |
Real Estate & Mortgages in Wachapreague
Real Estate and Mortgage Overview in Wachapreague
| Characteristic | Without Mortgage | With Mortgage |
| Housing Units | 74 | 37 |
| Median Property Value | $187,500 | $222,600 |
| Median Household Income | $52,083 | $1 |
| Monthly Housing Costs | $338 | $1 |
| Real Estate Taxes | $703 | $0 |
Property Value by Mortgage Status in Wachapreague
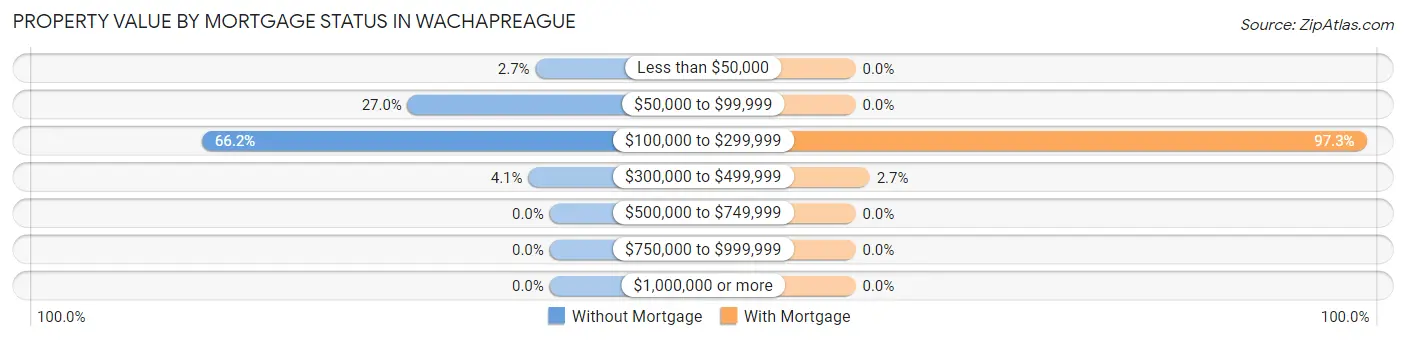
| Property Value | Without Mortgage | With Mortgage |
| Less than $50,000 | 2 (2.7%) | 0 (0.0%) |
| $50,000 to $99,999 | 20 (27.0%) | 0 (0.0%) |
| $100,000 to $299,999 | 49 (66.2%) | 36 (97.3%) |
| $300,000 to $499,999 | 3 (4.1%) | 1 (2.7%) |
| $500,000 to $749,999 | 0 (0.0%) | 0 (0.0%) |
| $750,000 to $999,999 | 0 (0.0%) | 0 (0.0%) |
| $1,000,000 or more | 0 (0.0%) | 0 (0.0%) |
| Total | 74 (100.0%) | 37 (100.0%) |
Household Income by Mortgage Status in Wachapreague
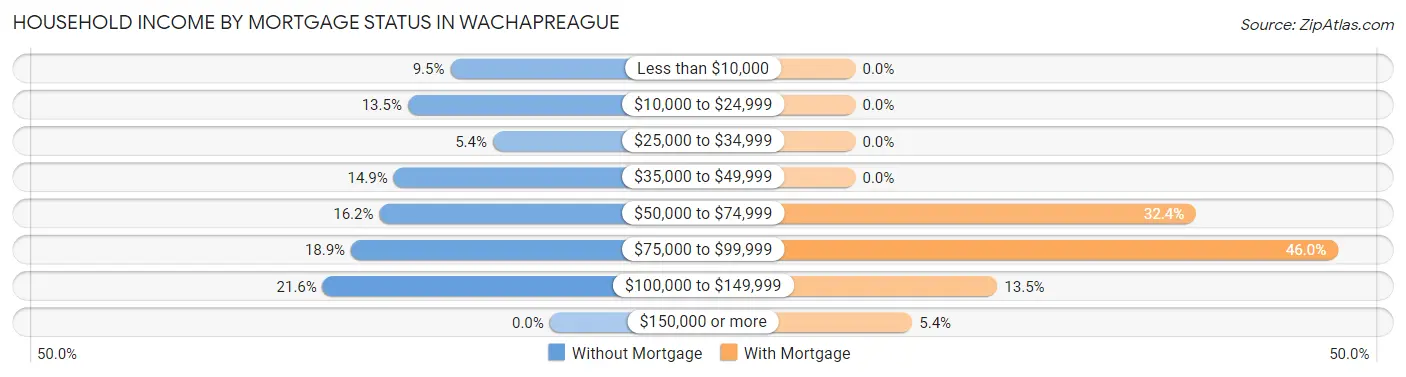
| Household Income | Without Mortgage | With Mortgage |
| Less than $10,000 | 7 (9.5%) | 0 (0.0%) |
| $10,000 to $24,999 | 10 (13.5%) | 0 (0.0%) |
| $25,000 to $34,999 | 4 (5.4%) | 0 (0.0%) |
| $35,000 to $49,999 | 11 (14.9%) | 0 (0.0%) |
| $50,000 to $74,999 | 12 (16.2%) | 12 (32.4%) |
| $75,000 to $99,999 | 14 (18.9%) | 17 (46.0%) |
| $100,000 to $149,999 | 16 (21.6%) | 5 (13.5%) |
| $150,000 or more | 0 (0.0%) | 2 (5.4%) |
| Total | 74 (100.0%) | 37 (100.0%) |
Property Value to Household Income Ratio in Wachapreague
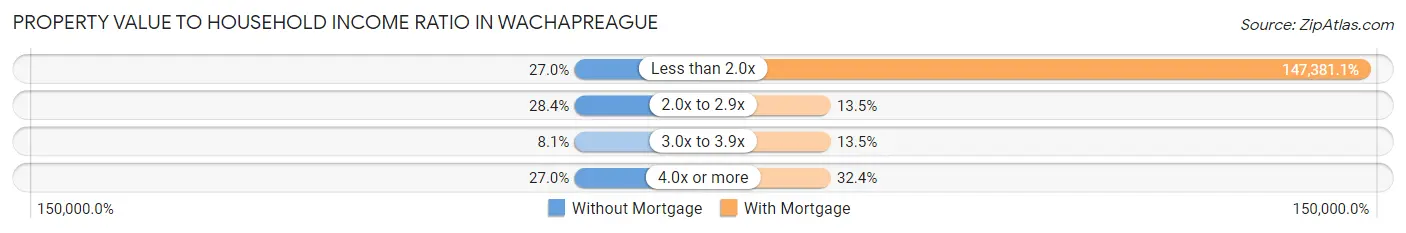
| Value-to-Income Ratio | Without Mortgage | With Mortgage |
| Less than 2.0x | 20 (27.0%) | 54,531 (147,381.1%) |
| 2.0x to 2.9x | 21 (28.4%) | 5 (13.5%) |
| 3.0x to 3.9x | 6 (8.1%) | 5 (13.5%) |
| 4.0x or more | 20 (27.0%) | 12 (32.4%) |
| Total | 74 (100.0%) | 37 (100.0%) |
Real Estate Taxes by Mortgage Status in Wachapreague
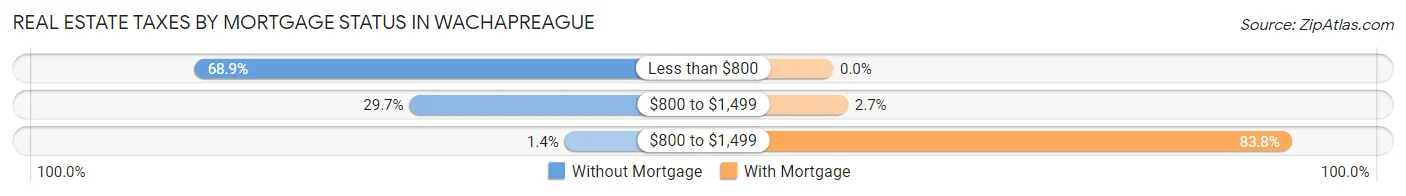
| Property Taxes | Without Mortgage | With Mortgage |
| Less than $800 | 51 (68.9%) | 0 (0.0%) |
| $800 to $1,499 | 22 (29.7%) | 1 (2.7%) |
| $800 to $1,499 | 1 (1.3%) | 31 (83.8%) |
| Total | 74 (100.0%) | 37 (100.0%) |
Health & Disability in Wachapreague
Health Insurance Coverage by Age in Wachapreague
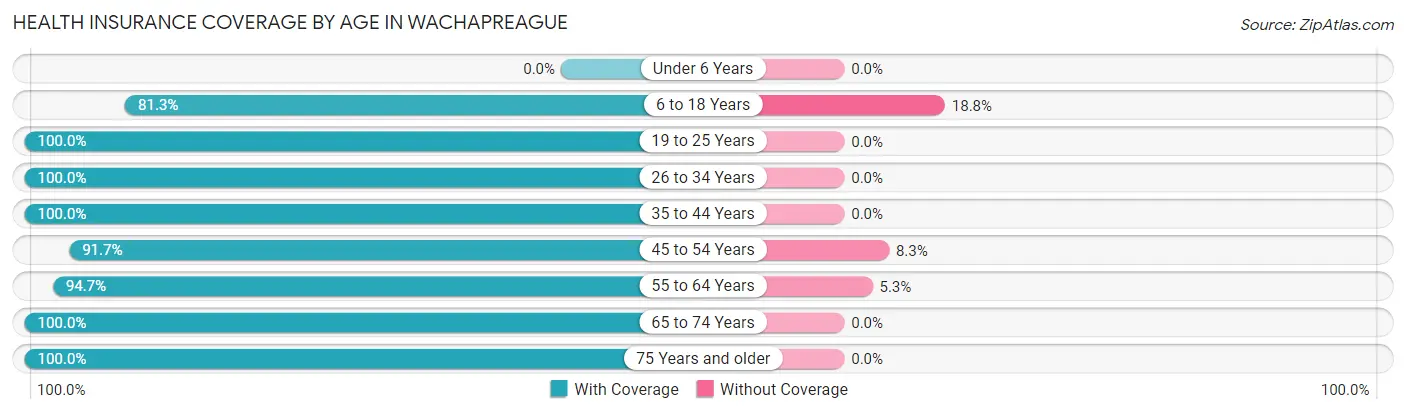
| Age Bracket | With Coverage | Without Coverage |
| Under 6 Years | 0 (0.0%) | 0 (0.0%) |
| 6 to 18 Years | 26 (81.2%) | 6 (18.8%) |
| 19 to 25 Years | 37 (100.0%) | 0 (0.0%) |
| 26 to 34 Years | 11 (100.0%) | 0 (0.0%) |
| 35 to 44 Years | 12 (100.0%) | 0 (0.0%) |
| 45 to 54 Years | 22 (91.7%) | 2 (8.3%) |
| 55 to 64 Years | 18 (94.7%) | 1 (5.3%) |
| 65 to 74 Years | 72 (100.0%) | 0 (0.0%) |
| 75 Years and older | 63 (100.0%) | 0 (0.0%) |
| Total | 261 (96.7%) | 9 (3.3%) |
Health Insurance Coverage by Citizenship Status in Wachapreague
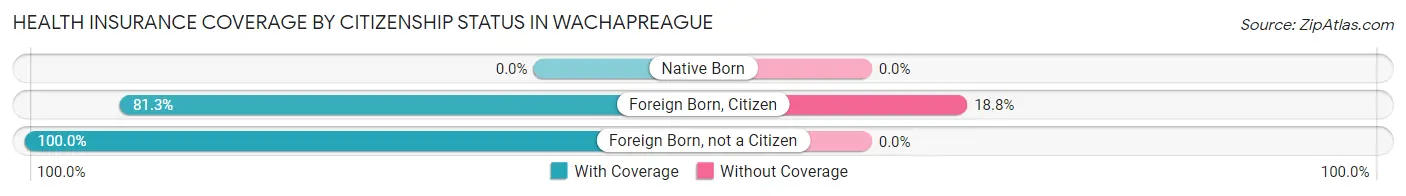
| Citizenship Status | With Coverage | Without Coverage |
| Native Born | 0 (0.0%) | 0 (0.0%) |
| Foreign Born, Citizen | 26 (81.2%) | 6 (18.8%) |
| Foreign Born, not a Citizen | 37 (100.0%) | 0 (0.0%) |
Health Insurance Coverage by Household Income in Wachapreague
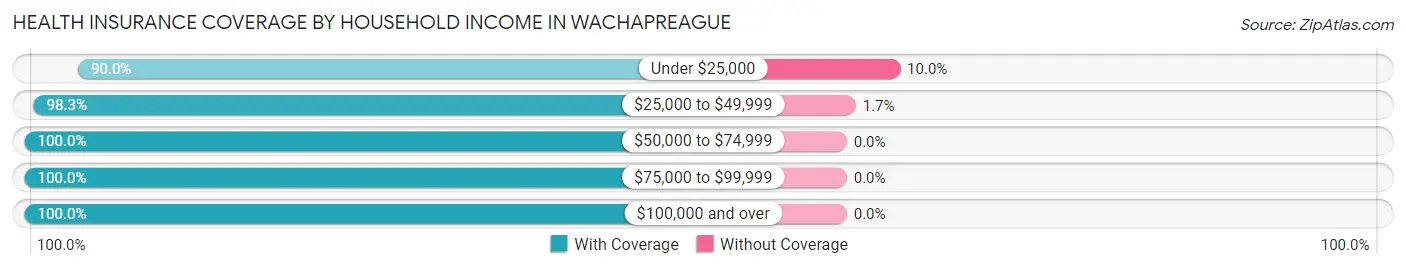
| Household Income | With Coverage | Without Coverage |
| Under $25,000 | 18 (90.0%) | 2 (10.0%) |
| $25,000 to $49,999 | 58 (98.3%) | 1 (1.7%) |
| $50,000 to $74,999 | 46 (100.0%) | 0 (0.0%) |
| $75,000 to $99,999 | 74 (100.0%) | 0 (0.0%) |
| $100,000 and over | 54 (100.0%) | 0 (0.0%) |
Public vs Private Health Insurance Coverage by Age in Wachapreague
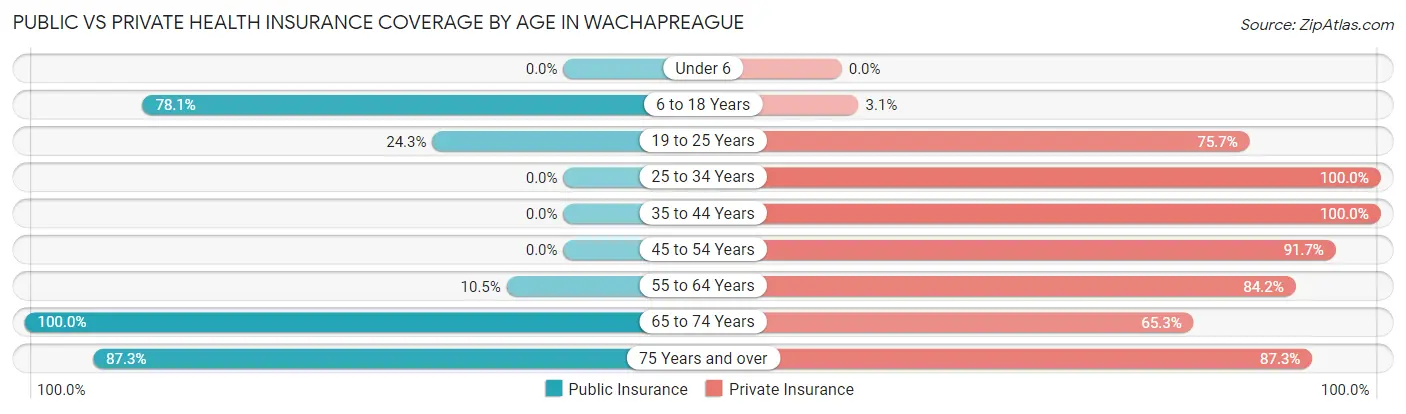
| Age Bracket | Public Insurance | Private Insurance |
| Under 6 | 0 (0.0%) | 0 (0.0%) |
| 6 to 18 Years | 25 (78.1%) | 1 (3.1%) |
| 19 to 25 Years | 9 (24.3%) | 28 (75.7%) |
| 25 to 34 Years | 0 (0.0%) | 11 (100.0%) |
| 35 to 44 Years | 0 (0.0%) | 12 (100.0%) |
| 45 to 54 Years | 0 (0.0%) | 22 (91.7%) |
| 55 to 64 Years | 2 (10.5%) | 16 (84.2%) |
| 65 to 74 Years | 72 (100.0%) | 47 (65.3%) |
| 75 Years and over | 55 (87.3%) | 55 (87.3%) |
| Total | 163 (60.4%) | 192 (71.1%) |
Disability Status by Sex by Age in Wachapreague
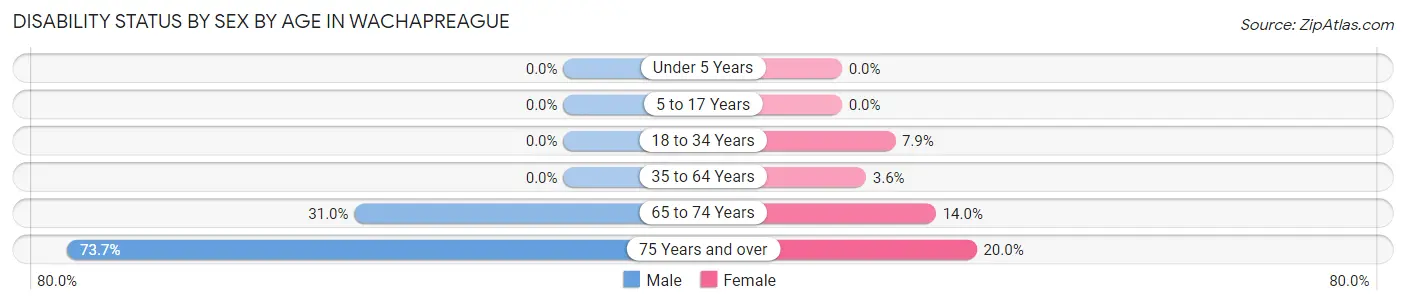
| Age Bracket | Male | Female |
| Under 5 Years | 0 (0.0%) | 0 (0.0%) |
| 5 to 17 Years | 0 (0.0%) | 0 (0.0%) |
| 18 to 34 Years | 0 (0.0%) | 3 (7.9%) |
| 35 to 64 Years | 0 (0.0%) | 1 (3.6%) |
| 65 to 74 Years | 9 (31.0%) | 6 (14.0%) |
| 75 Years and over | 28 (73.7%) | 5 (20.0%) |
Disability Class by Sex by Age in Wachapreague
Disability Class: Hearing Difficulty
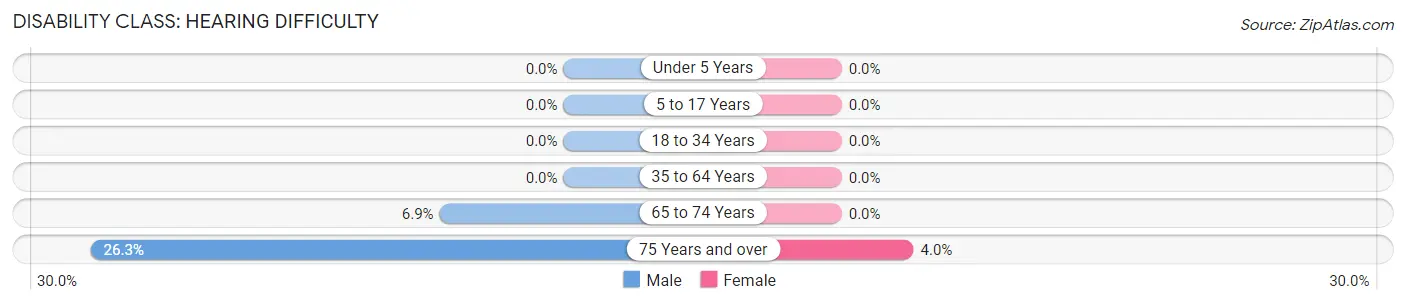
| Age Bracket | Male | Female |
| Under 5 Years | 0 (0.0%) | 0 (0.0%) |
| 5 to 17 Years | 0 (0.0%) | 0 (0.0%) |
| 18 to 34 Years | 0 (0.0%) | 0 (0.0%) |
| 35 to 64 Years | 0 (0.0%) | 0 (0.0%) |
| 65 to 74 Years | 2 (6.9%) | 0 (0.0%) |
| 75 Years and over | 10 (26.3%) | 1 (4.0%) |
Disability Class: Vision Difficulty
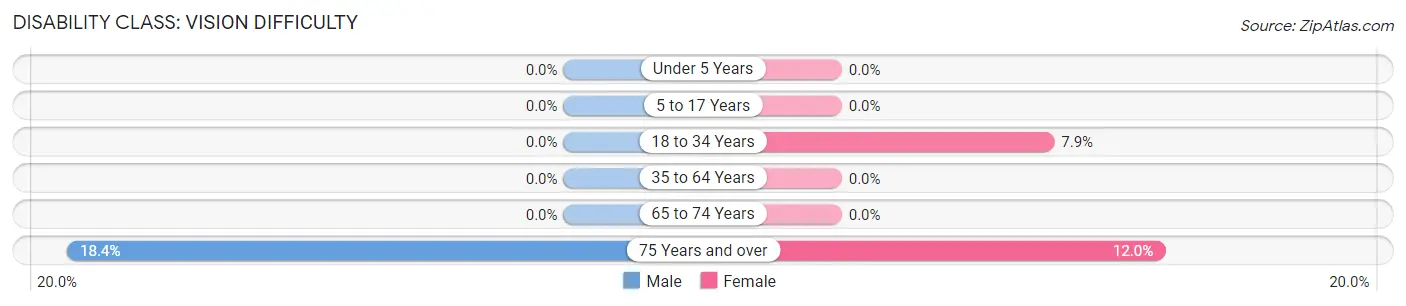
| Age Bracket | Male | Female |
| Under 5 Years | 0 (0.0%) | 0 (0.0%) |
| 5 to 17 Years | 0 (0.0%) | 0 (0.0%) |
| 18 to 34 Years | 0 (0.0%) | 3 (7.9%) |
| 35 to 64 Years | 0 (0.0%) | 0 (0.0%) |
| 65 to 74 Years | 0 (0.0%) | 0 (0.0%) |
| 75 Years and over | 7 (18.4%) | 3 (12.0%) |
Disability Class: Cognitive Difficulty
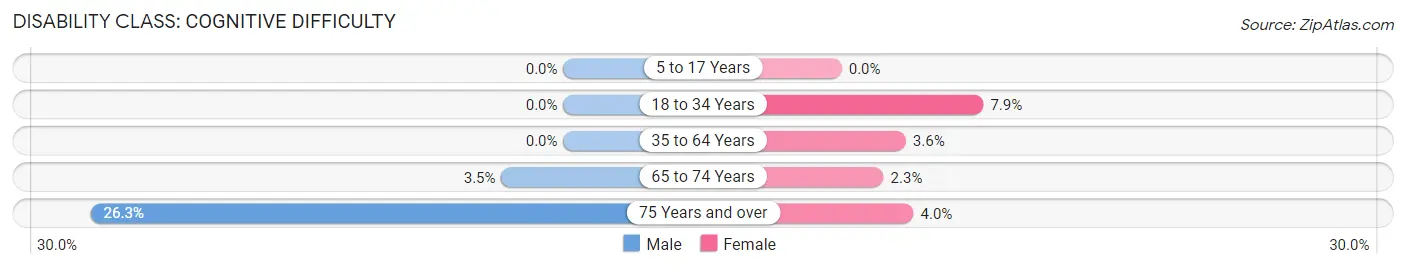
| Age Bracket | Male | Female |
| 5 to 17 Years | 0 (0.0%) | 0 (0.0%) |
| 18 to 34 Years | 0 (0.0%) | 3 (7.9%) |
| 35 to 64 Years | 0 (0.0%) | 1 (3.6%) |
| 65 to 74 Years | 1 (3.5%) | 1 (2.3%) |
| 75 Years and over | 10 (26.3%) | 1 (4.0%) |
Disability Class: Ambulatory Difficulty
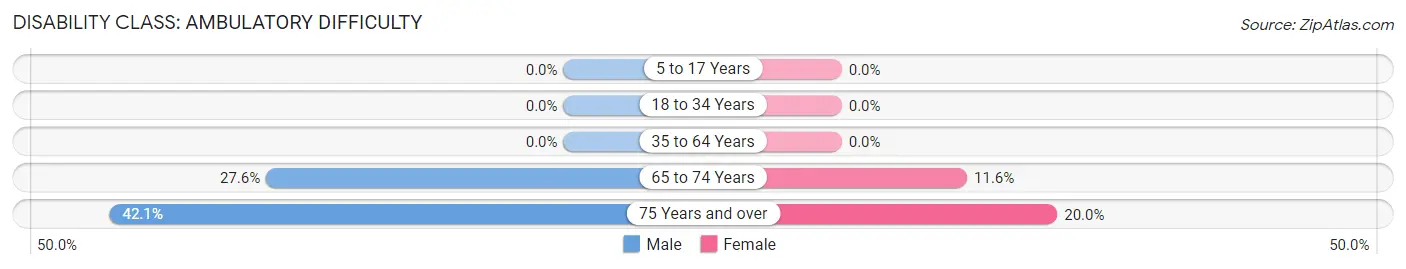
| Age Bracket | Male | Female |
| 5 to 17 Years | 0 (0.0%) | 0 (0.0%) |
| 18 to 34 Years | 0 (0.0%) | 0 (0.0%) |
| 35 to 64 Years | 0 (0.0%) | 0 (0.0%) |
| 65 to 74 Years | 8 (27.6%) | 5 (11.6%) |
| 75 Years and over | 16 (42.1%) | 5 (20.0%) |
Disability Class: Self-Care Difficulty
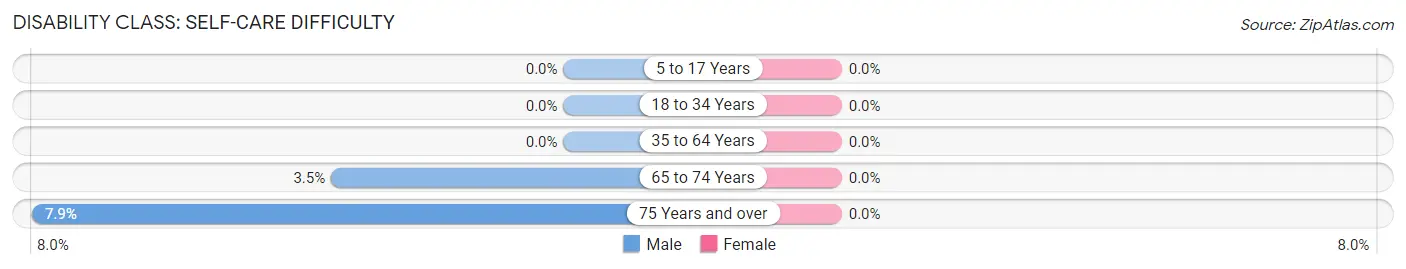
| Age Bracket | Male | Female |
| 5 to 17 Years | 0 (0.0%) | 0 (0.0%) |
| 18 to 34 Years | 0 (0.0%) | 0 (0.0%) |
| 35 to 64 Years | 0 (0.0%) | 0 (0.0%) |
| 65 to 74 Years | 1 (3.5%) | 0 (0.0%) |
| 75 Years and over | 3 (7.9%) | 0 (0.0%) |
Technology Access in Wachapreague
Computing Device Access in Wachapreague
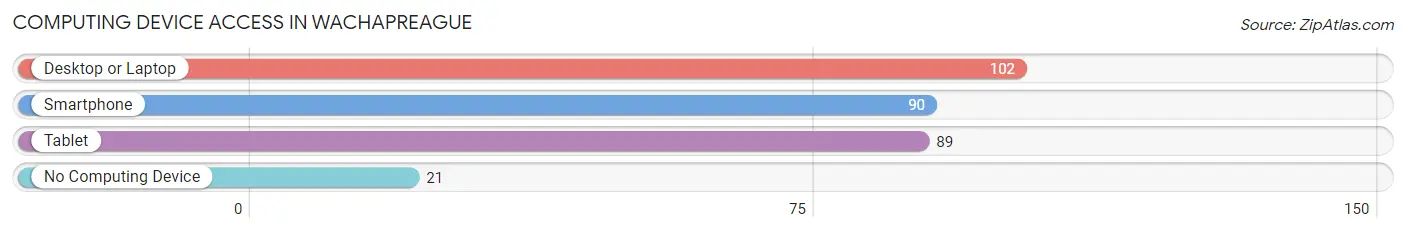
| Device Type | # Households | % Households |
| Desktop or Laptop | 102 | 74.5% |
| Smartphone | 90 | 65.7% |
| Tablet | 89 | 65.0% |
| No Computing Device | 21 | 15.3% |
| Total | 137 | 100.0% |
Internet Access in Wachapreague
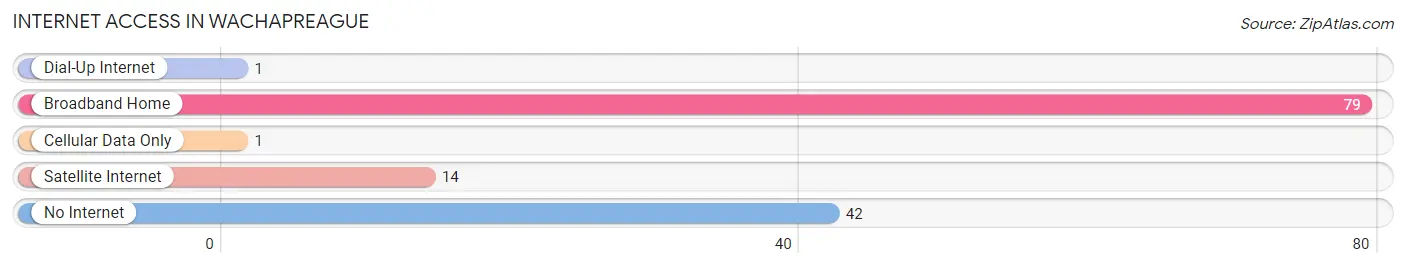
| Internet Type | # Households | % Households |
| Dial-Up Internet | 1 | 0.7% |
| Broadband Home | 79 | 57.7% |
| Cellular Data Only | 1 | 0.7% |
| Satellite Internet | 14 | 10.2% |
| No Internet | 42 | 30.7% |
| Total | 137 | 100.0% |
Wachapreague Summary
Wachapreague is a small town located on the Eastern Shore of Virginia in Accomack County. It is situated on the Atlantic Coast, approximately 30 miles south of the Chesapeake Bay Bridge-Tunnel. The town has a population of approximately 500 people and is known for its fishing and seafood industry.
History
The town of Wachapreague was founded in 1663 by English settlers. The town was named after the Wachapreague Indians, who were the original inhabitants of the area. The town was originally a fishing and trading post, and it was also a major port for the shipping of tobacco and other goods. In the late 1700s, the town was a major center for the slave trade.
In the early 1800s, Wachapreague became a popular destination for tourists. The town was known for its beautiful beaches and its seafood industry. In the late 1800s, the town was a major center for the oyster industry. The town was also home to several shipbuilding companies, which produced wooden sailing vessels.
In the early 1900s, Wachapreague was a popular destination for sport fishing. The town was also home to several seafood processing plants. In the late 1900s, the town was a popular destination for recreational boaters.
Geography
Wachapreague is located on the Eastern Shore of Virginia, approximately 30 miles south of the Chesapeake Bay Bridge-Tunnel. The town is situated on the Atlantic Coast, and it is bordered by the Atlantic Ocean to the east and the Chesapeake Bay to the west. The town is located on a peninsula, and it is surrounded by several small islands.
The town is located in a temperate climate, and it experiences mild winters and hot, humid summers. The average annual temperature is around 60 degrees Fahrenheit. The town receives an average of 45 inches of precipitation per year.
Economy
The economy of Wachapreague is largely based on the fishing and seafood industry. The town is home to several seafood processing plants, and it is also a popular destination for recreational boaters. The town is also home to several boatbuilding companies, which produce wooden sailing vessels.
The town is also home to several small businesses, including restaurants, shops, and other services. The town is also home to several bed and breakfast establishments.
Demographics
As of the 2010 census, the population of Wachapreague was 498 people. The town has a population density of approximately 5.3 people per square mile. The median age of the population is 44.7 years, and the median household income is $37,500.
The town is predominantly white, with approximately 95% of the population identifying as white. The town is also home to a small African American population, with approximately 4% of the population identifying as African American. The town is also home to a small Hispanic population, with approximately 1% of the population identifying as Hispanic.
Common Questions
What is Per Capita Income in Wachapreague?
Per Capita income in Wachapreague is $33,759.
What is the Median Family Income in Wachapreague?
Median Family Income in Wachapreague is $91,250.
What is the Median Household income in Wachapreague?
Median Household Income in Wachapreague is $54,844.
What is Income or Wage Gap in Wachapreague?
Income or Wage Gap in Wachapreague is 40.7%.
Women in Wachapreague earn 59.3 cents for every dollar earned by a man.
What is Inequality or Gini Index in Wachapreague?
Inequality or Gini Index in Wachapreague is 0.34.
What is the Total Population of Wachapreague?
Total Population of Wachapreague is 270.
What is the Total Male Population of Wachapreague?
Total Male Population of Wachapreague is 127.
What is the Total Female Population of Wachapreague?
Total Female Population of Wachapreague is 143.
What is the Ratio of Males per 100 Females in Wachapreague?
There are 88.81 Males per 100 Females in Wachapreague.
What is the Ratio of Females per 100 Males in Wachapreague?
There are 112.60 Females per 100 Males in Wachapreague.
What is the Median Population Age in Wachapreague?
Median Population Age in Wachapreague is 65.5 Years.
What is the Average Family Size in Wachapreague
Average Family Size in Wachapreague is 2.6 People.
What is the Average Household Size in Wachapreague
Average Household Size in Wachapreague is 1.9 People.
How Large is the Labor Force in Wachapreague?
There are 100 People in the Labor Forcein in Wachapreague.
What is the Percentage of People in the Labor Force in Wachapreague?
38.3% of People are in the Labor Force in Wachapreague.
What is the Unemployment Rate in Wachapreague?
Unemployment Rate in Wachapreague is 2.0%.