Victoria, VA Map & Demographics
Victoria Map
Victoria Overview
$20,342
PER CAPITA INCOME
$50,132
AVG FAMILY INCOME
$35,806
AVG HOUSEHOLD INCOME
15.0%
WAGE / INCOME GAP [ % ]
85.0¢/ $1
WAGE / INCOME GAP [ $ ]
0.43
INEQUALITY / GINI INDEX
1,946
TOTAL POPULATION
867
MALE POPULATION
1,079
FEMALE POPULATION
80.35
MALES / 100 FEMALES
124.45
FEMALES / 100 MALES
39.9
MEDIAN AGE
3.3
AVG FAMILY SIZE
2.4
AVG HOUSEHOLD SIZE
667
LABOR FORCE [ PEOPLE ]
46.7%
PERCENT IN LABOR FORCE
4.8%
UNEMPLOYMENT RATE
Victoria Zip Codes
Victoria Area Codes
Income in Victoria
Income Overview in Victoria
Per Capita Income in Victoria is $20,342, while median incomes of families and households are $50,132 and $35,806 respectively.
| Characteristic | Number | Measure |
| Per Capita Income | 1,946 | $20,342 |
| Median Family Income | 480 | $50,132 |
| Mean Family Income | 480 | $59,442 |
| Median Household Income | 810 | $35,806 |
| Mean Household Income | 810 | $46,832 |
| Income Deficit | 480 | $0 |
| Wage / Income Gap (%) | 1,946 | 15.01% |
| Wage / Income Gap ($) | 1,946 | 84.99¢ per $1 |
| Gini / Inequality Index | 1,946 | 0.43 |
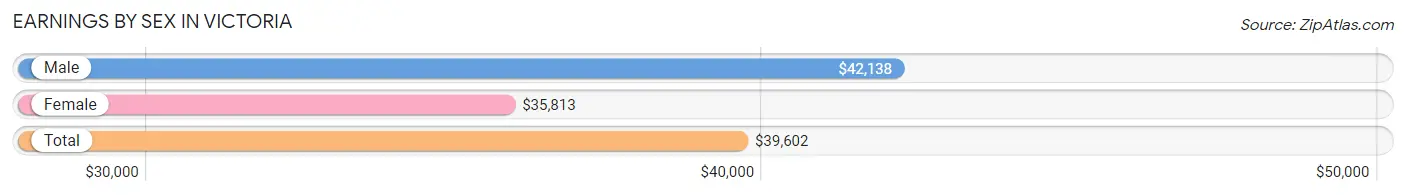
Earnings by Sex in Victoria
Average Earnings in Victoria are $39,602, $42,138 for men and $35,813 for women, a difference of 15.0%.
| Sex | Number | Average Earnings |
| Male | 347 (50.7%) | $42,138 |
| Female | 337 (49.3%) | $35,813 |
| Total | 684 (100.0%) | $39,602 |
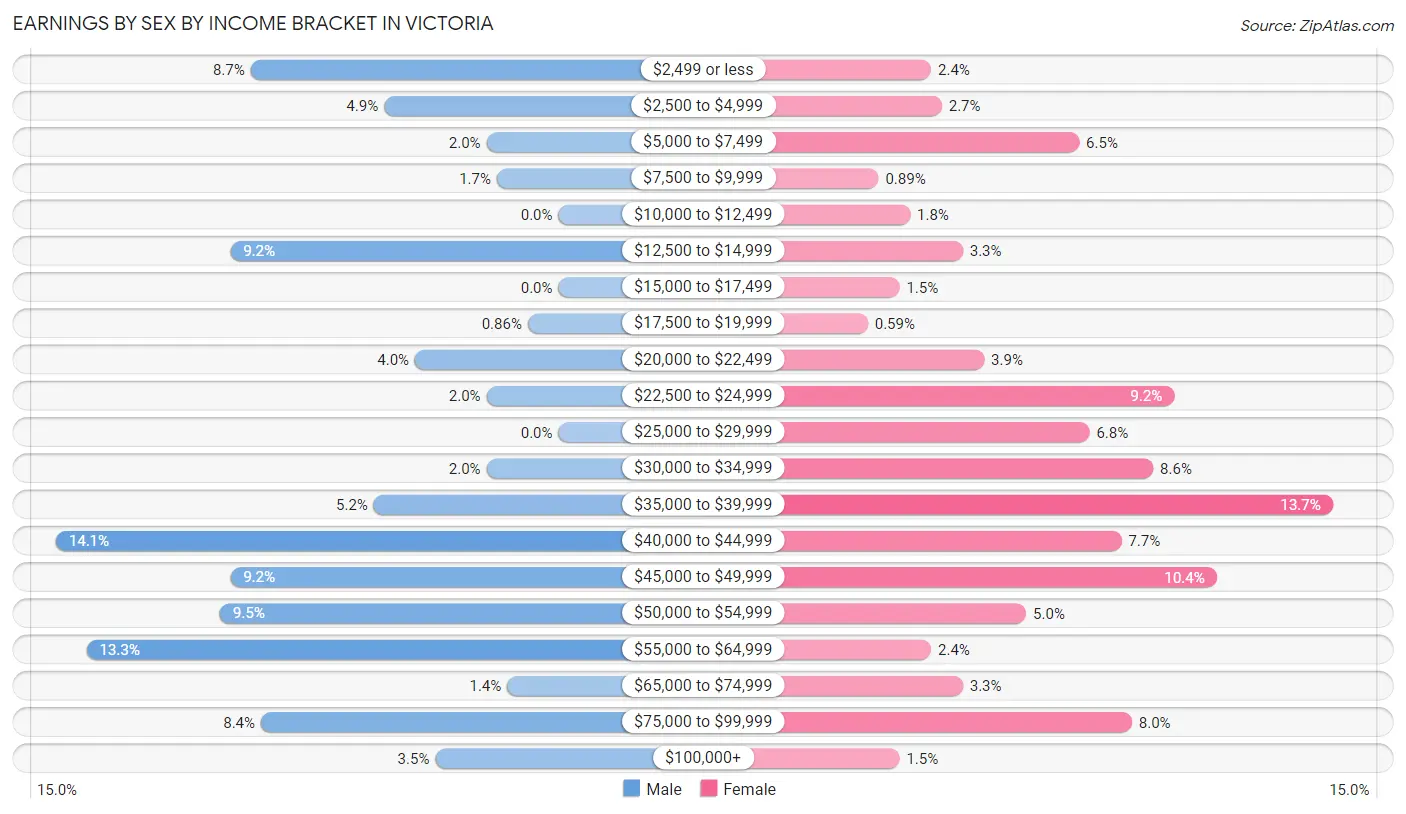
Earnings by Sex by Income Bracket in Victoria
The most common earnings brackets in Victoria are $40,000 to $44,999 for men (49 | 14.1%) and $35,000 to $39,999 for women (46 | 13.7%).
| Income | Male | Female |
| $2,499 or less | 30 (8.6%) | 8 (2.4%) |
| $2,500 to $4,999 | 17 (4.9%) | 9 (2.7%) |
| $5,000 to $7,499 | 7 (2.0%) | 22 (6.5%) |
| $7,500 to $9,999 | 6 (1.7%) | 3 (0.9%) |
| $10,000 to $12,499 | 0 (0.0%) | 6 (1.8%) |
| $12,500 to $14,999 | 32 (9.2%) | 11 (3.3%) |
| $15,000 to $17,499 | 0 (0.0%) | 5 (1.5%) |
| $17,500 to $19,999 | 3 (0.9%) | 2 (0.6%) |
| $20,000 to $22,499 | 14 (4.0%) | 13 (3.9%) |
| $22,500 to $24,999 | 7 (2.0%) | 31 (9.2%) |
| $25,000 to $29,999 | 0 (0.0%) | 23 (6.8%) |
| $30,000 to $34,999 | 7 (2.0%) | 29 (8.6%) |
| $35,000 to $39,999 | 18 (5.2%) | 46 (13.7%) |
| $40,000 to $44,999 | 49 (14.1%) | 26 (7.7%) |
| $45,000 to $49,999 | 32 (9.2%) | 35 (10.4%) |
| $50,000 to $54,999 | 33 (9.5%) | 17 (5.0%) |
| $55,000 to $64,999 | 46 (13.3%) | 8 (2.4%) |
| $65,000 to $74,999 | 5 (1.4%) | 11 (3.3%) |
| $75,000 to $99,999 | 29 (8.4%) | 27 (8.0%) |
| $100,000+ | 12 (3.5%) | 5 (1.5%) |
| Total | 347 (100.0%) | 337 (100.0%) |
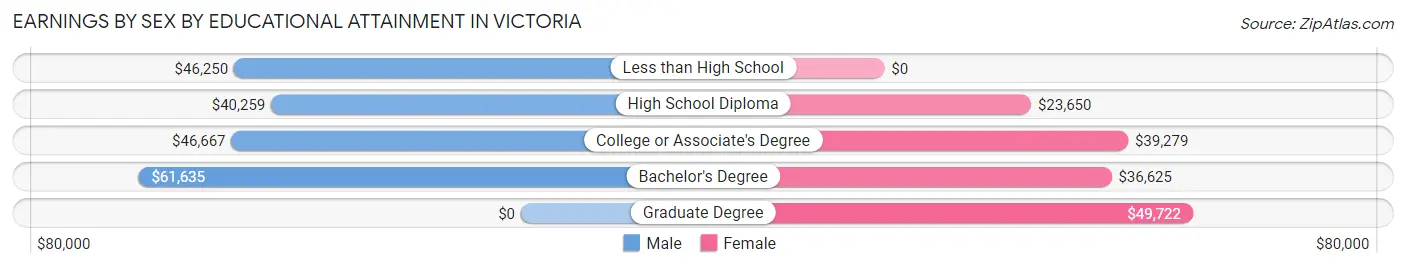
Earnings by Sex by Educational Attainment in Victoria
Average earnings in Victoria are $44,545 for men and $36,688 for women, a difference of 17.6%. Men with an educational attainment of bachelor's degree enjoy the highest average annual earnings of $61,635, while those with high school diploma education earn the least with $40,259. Women with an educational attainment of graduate degree earn the most with the average annual earnings of $49,722, while those with high school diploma education have the smallest earnings of $23,650.
| Educational Attainment | Male Income | Female Income |
| Less than High School | $46,250 | $0 |
| High School Diploma | $40,259 | $23,650 |
| College or Associate's Degree | $46,667 | $39,279 |
| Bachelor's Degree | $61,635 | $36,625 |
| Graduate Degree | - | - |
| Total | $44,545 | $36,688 |
Family Income in Victoria
Family Income Brackets in Victoria
According to the Victoria family income data, there are 89 families falling into the $100,000 to $149,999 income range, which is the most common income bracket and makes up 18.5% of all families.
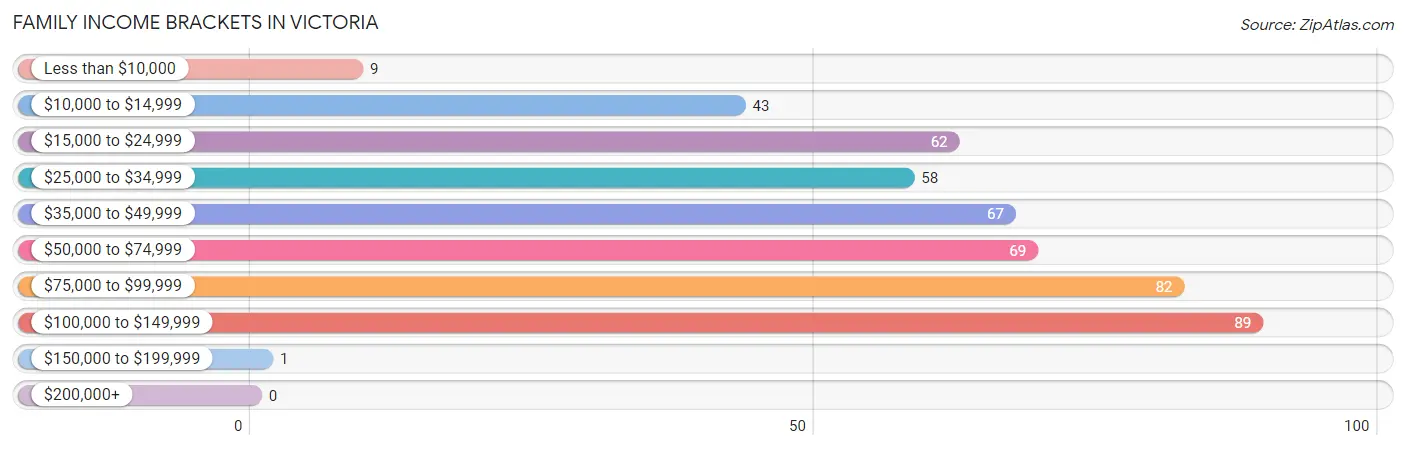
| Income Bracket | # Families | % Families |
| Less than $10,000 | 9 | 1.9% |
| $10,000 to $14,999 | 43 | 9.0% |
| $15,000 to $24,999 | 62 | 12.9% |
| $25,000 to $34,999 | 58 | 12.1% |
| $35,000 to $49,999 | 67 | 14.0% |
| $50,000 to $74,999 | 69 | 14.4% |
| $75,000 to $99,999 | 82 | 17.1% |
| $100,000 to $149,999 | 89 | 18.5% |
| $150,000 to $199,999 | 1 | 0.2% |
| $200,000+ | 0 | 0.0% |
Family Income by Famaliy Size in Victoria
6-person families (30 | 6.2%) account for the highest median family income in Victoria with $99,000 per family, while 2-person families (232 | 48.3%) have the highest median income of $23,077 per family member.
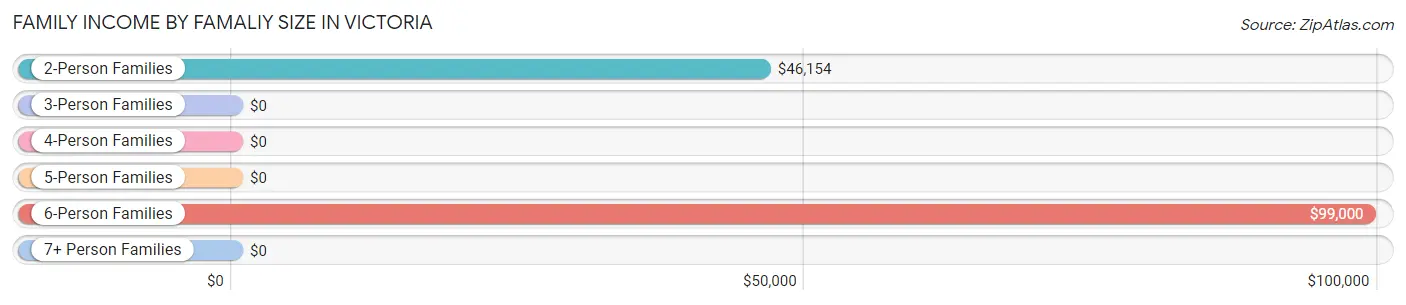
| Income Bracket | # Families | Median Income |
| 2-Person Families | 232 (48.3%) | $46,154 |
| 3-Person Families | 121 (25.2%) | $0 |
| 4-Person Families | 73 (15.2%) | $0 |
| 5-Person Families | 18 (3.7%) | $0 |
| 6-Person Families | 30 (6.2%) | $99,000 |
| 7+ Person Families | 6 (1.3%) | $0 |
| Total | 480 (100.0%) | $50,132 |
Family Income by Number of Earners in Victoria
The median family income in Victoria is $50,132, with families comprising 3+ earners (22) having the highest median family income of $121,250, while families with no earners (128) have the lowest median family income of $30,543, accounting for 4.6% and 26.7% of families, respectively.
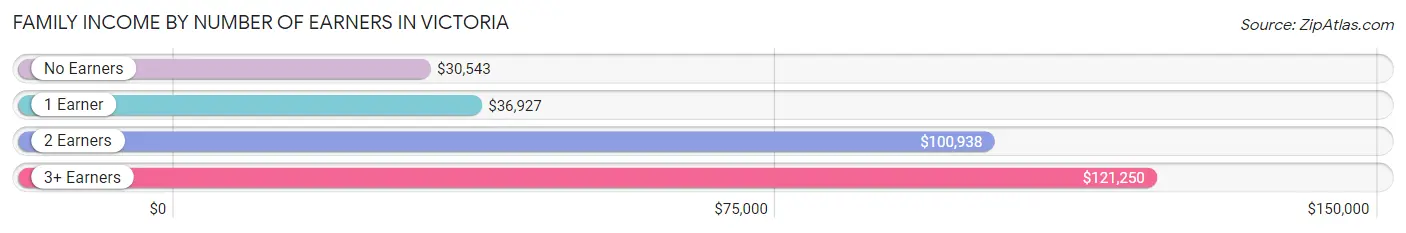
| Number of Earners | # Families | Median Income |
| No Earners | 128 (26.7%) | $30,543 |
| 1 Earner | 217 (45.2%) | $36,927 |
| 2 Earners | 113 (23.5%) | $100,938 |
| 3+ Earners | 22 (4.6%) | $121,250 |
| Total | 480 (100.0%) | $50,132 |
Household Income in Victoria
Household Income Brackets in Victoria
With 130 households falling in the category, the $10,000 to $14,999 income range is the most frequent in Victoria, accounting for 16.1% of all households.
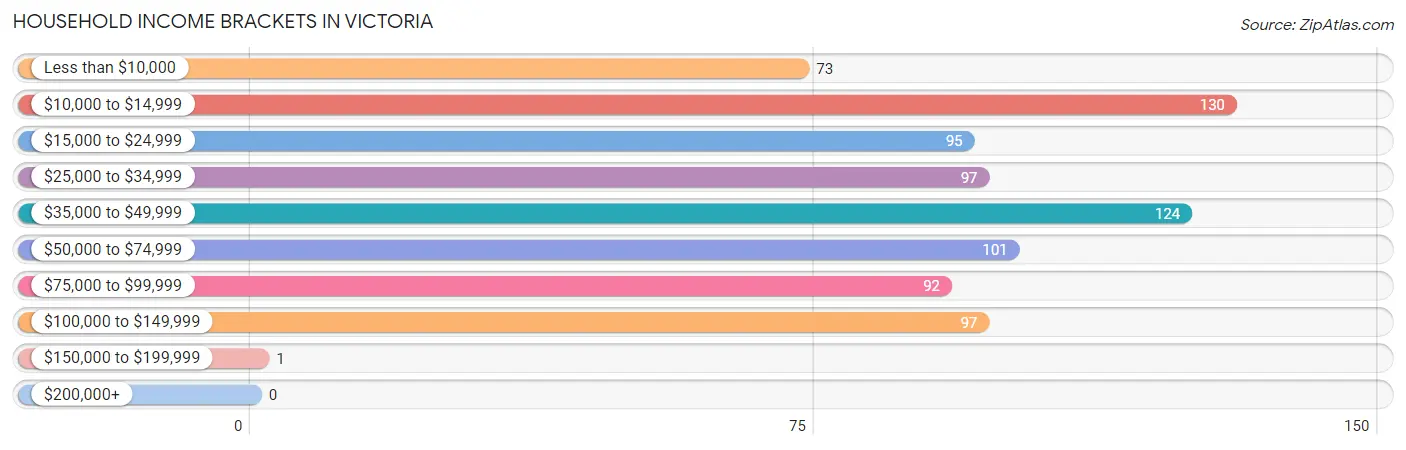
| Income Bracket | # Households | % Households |
| Less than $10,000 | 73 | 9.0% |
| $10,000 to $14,999 | 130 | 16.0% |
| $15,000 to $24,999 | 95 | 11.7% |
| $25,000 to $34,999 | 97 | 12.0% |
| $35,000 to $49,999 | 124 | 15.3% |
| $50,000 to $74,999 | 101 | 12.5% |
| $75,000 to $99,999 | 92 | 11.4% |
| $100,000 to $149,999 | 97 | 12.0% |
| $150,000 to $199,999 | 1 | 0.1% |
| $200,000+ | 0 | 0.0% |
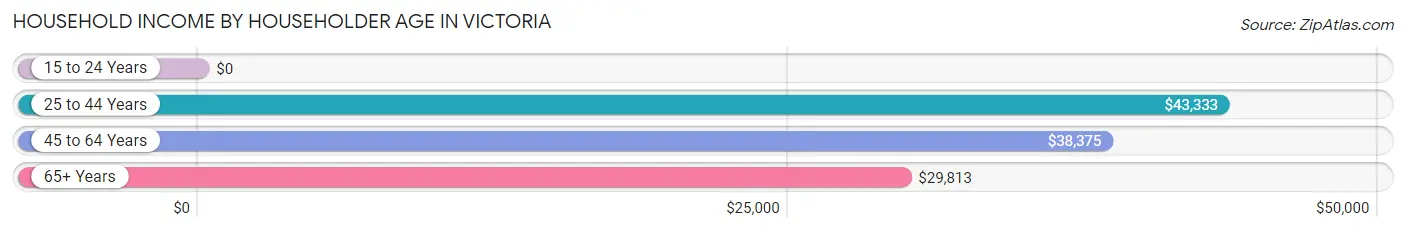
Household Income by Householder Age in Victoria
The median household income in Victoria is $35,806, with the highest median household income of $43,333 found in the 25 to 44 years age bracket for the primary householder. A total of 266 households (32.8%) fall into this category.
| Income Bracket | # Households | Median Income |
| 15 to 24 Years | 0 (0.0%) | $0 |
| 25 to 44 Years | 266 (32.8%) | $43,333 |
| 45 to 64 Years | 261 (32.2%) | $38,375 |
| 65+ Years | 283 (34.9%) | $29,813 |
| Total | 810 (100.0%) | $35,806 |
Poverty in Victoria
Income Below Poverty by Sex and Age in Victoria
With 22.4% poverty level for males and 22.0% for females among the residents of Victoria, under 5 year old males and 16 and 17 year old females are the most vulnerable to poverty, with 29 males (67.4%) and 6 females (66.7%) in their respective age groups living below the poverty level.
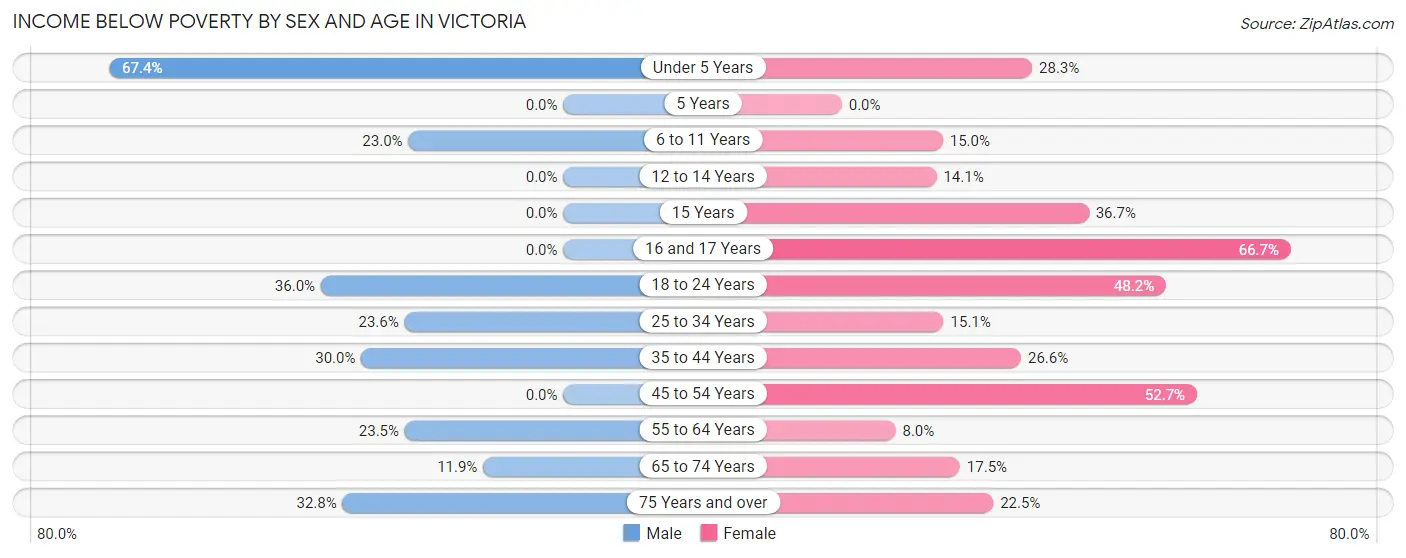
| Age Bracket | Male | Female |
| Under 5 Years | 29 (67.4%) | 39 (28.3%) |
| 5 Years | 0 (0.0%) | 0 (0.0%) |
| 6 to 11 Years | 26 (23.0%) | 12 (15.0%) |
| 12 to 14 Years | 0 (0.0%) | 9 (14.1%) |
| 15 Years | 0 (0.0%) | 11 (36.7%) |
| 16 and 17 Years | 0 (0.0%) | 6 (66.7%) |
| 18 to 24 Years | 18 (36.0%) | 13 (48.1%) |
| 25 to 34 Years | 25 (23.6%) | 13 (15.1%) |
| 35 to 44 Years | 33 (30.0%) | 41 (26.6%) |
| 45 to 54 Years | 0 (0.0%) | 29 (52.7%) |
| 55 to 64 Years | 28 (23.5%) | 15 (8.0%) |
| 65 to 74 Years | 15 (11.9%) | 20 (17.5%) |
| 75 Years and over | 20 (32.8%) | 29 (22.5%) |
| Total | 194 (22.4%) | 237 (22.0%) |
Income Above Poverty by Sex and Age in Victoria
According to the poverty statistics in Victoria, males aged 12 to 14 years and females aged 5 years are the age groups that are most secure financially, with 100.0% of males and 100.0% of females in these age groups living above the poverty line.
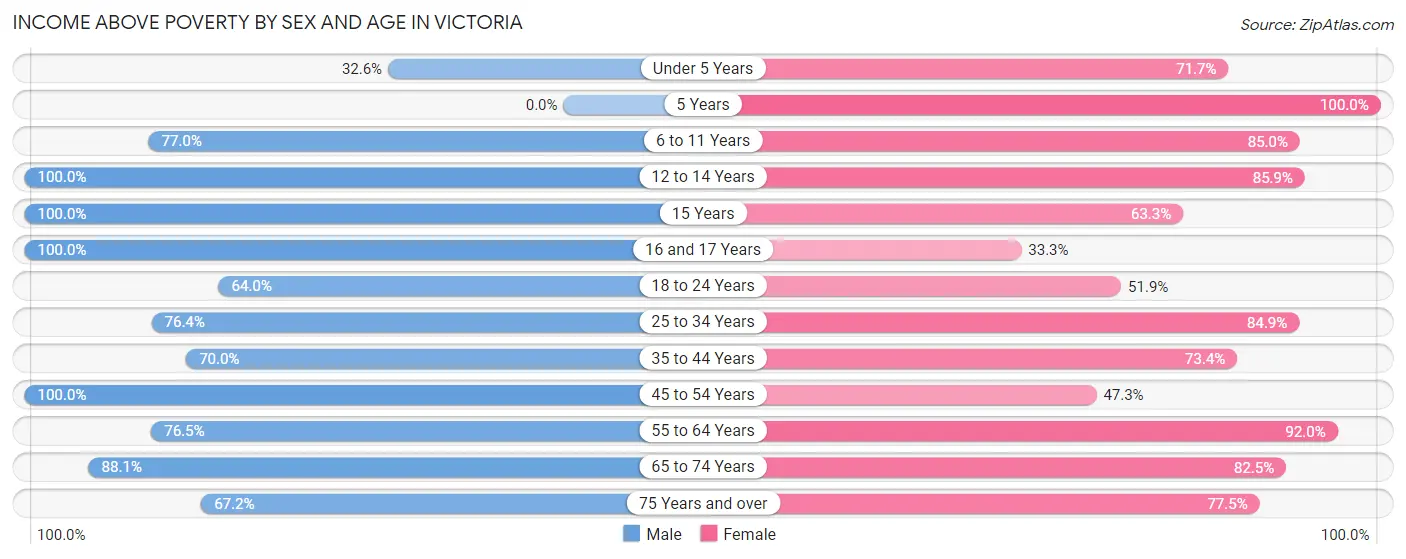
| Age Bracket | Male | Female |
| Under 5 Years | 14 (32.6%) | 99 (71.7%) |
| 5 Years | 0 (0.0%) | 5 (100.0%) |
| 6 to 11 Years | 87 (77.0%) | 68 (85.0%) |
| 12 to 14 Years | 31 (100.0%) | 55 (85.9%) |
| 15 Years | 14 (100.0%) | 19 (63.3%) |
| 16 and 17 Years | 18 (100.0%) | 3 (33.3%) |
| 18 to 24 Years | 32 (64.0%) | 14 (51.8%) |
| 25 to 34 Years | 81 (76.4%) | 73 (84.9%) |
| 35 to 44 Years | 77 (70.0%) | 113 (73.4%) |
| 45 to 54 Years | 76 (100.0%) | 26 (47.3%) |
| 55 to 64 Years | 91 (76.5%) | 173 (92.0%) |
| 65 to 74 Years | 111 (88.1%) | 94 (82.5%) |
| 75 Years and over | 41 (67.2%) | 100 (77.5%) |
| Total | 673 (77.6%) | 842 (78.0%) |
Income Below Poverty Among Married-Couple Families in Victoria
The poverty statistics for married-couple families in Victoria show that 4.3% or 12 of the total 281 families live below the poverty line. Families with 1 or 2 children have the highest poverty rate of 8.3%, comprising of 9 families. On the other hand, families with 3 or 4 children have the lowest poverty rate of 0.0%, which includes 0 families.
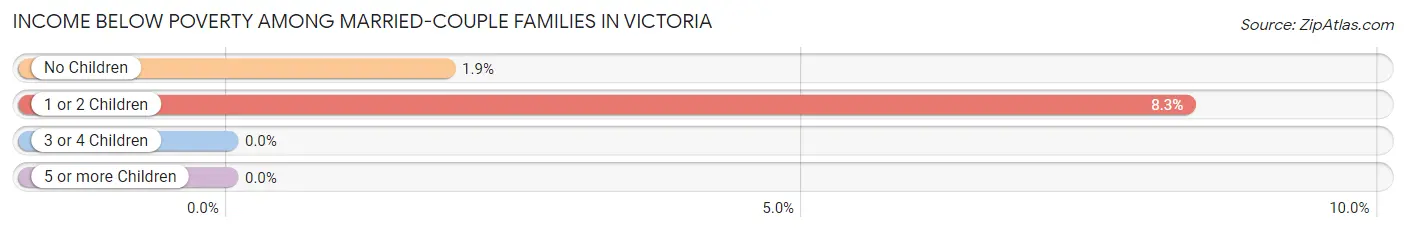
| Children | Above Poverty | Below Poverty |
| No Children | 156 (98.1%) | 3 (1.9%) |
| 1 or 2 Children | 99 (91.7%) | 9 (8.3%) |
| 3 or 4 Children | 14 (100.0%) | 0 (0.0%) |
| 5 or more Children | 0 (0.0%) | 0 (0.0%) |
| Total | 269 (95.7%) | 12 (4.3%) |
Income Below Poverty Among Single-Parent Households in Victoria
According to the poverty data in Victoria, 34.2% or 13 single-father households and 32.3% or 52 single-mother households are living below the poverty line. Among single-father households, those with 1 or 2 children have the highest poverty rate, with 13 households (59.1%) experiencing poverty. Likewise, among single-mother households, those with 1 or 2 children have the highest poverty rate, with 48 households (67.6%) falling below the poverty line.
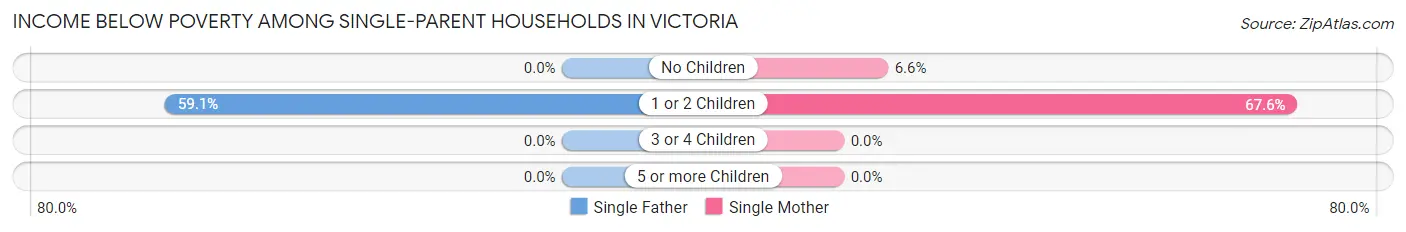
| Children | Single Father | Single Mother |
| No Children | 0 (0.0%) | 4 (6.6%) |
| 1 or 2 Children | 13 (59.1%) | 48 (67.6%) |
| 3 or 4 Children | 0 (0.0%) | 0 (0.0%) |
| 5 or more Children | 0 (0.0%) | 0 (0.0%) |
| Total | 13 (34.2%) | 52 (32.3%) |
Income Below Poverty Among Married-Couple vs Single-Parent Households in Victoria
The poverty data for Victoria shows that 12 of the married-couple family households (4.3%) and 65 of the single-parent households (32.7%) are living below the poverty level. Within the married-couple family households, those with 1 or 2 children have the highest poverty rate, with 9 households (8.3%) falling below the poverty line. Among the single-parent households, those with 1 or 2 children have the highest poverty rate, with 61 household (65.6%) living below poverty.
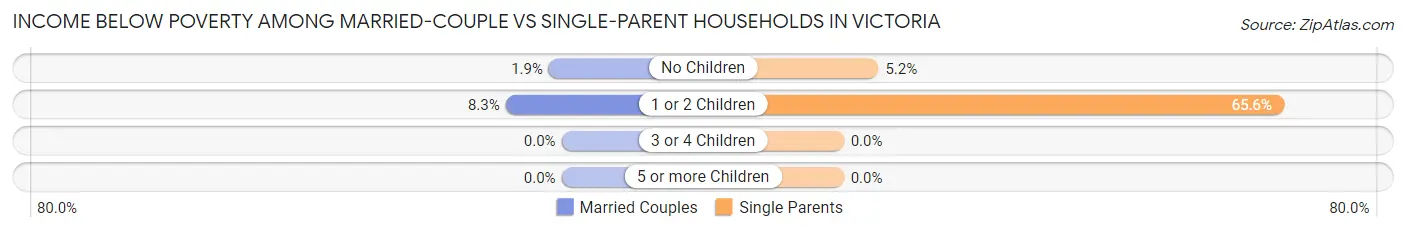
| Children | Married-Couple Families | Single-Parent Households |
| No Children | 3 (1.9%) | 4 (5.2%) |
| 1 or 2 Children | 9 (8.3%) | 61 (65.6%) |
| 3 or 4 Children | 0 (0.0%) | 0 (0.0%) |
| 5 or more Children | 0 (0.0%) | 0 (0.0%) |
| Total | 12 (4.3%) | 65 (32.7%) |
Race in Victoria
The most populous races in Victoria are White / Caucasian (1,227 | 63.0%), Black / African American (607 | 31.2%), and Two or more Races (104 | 5.3%).
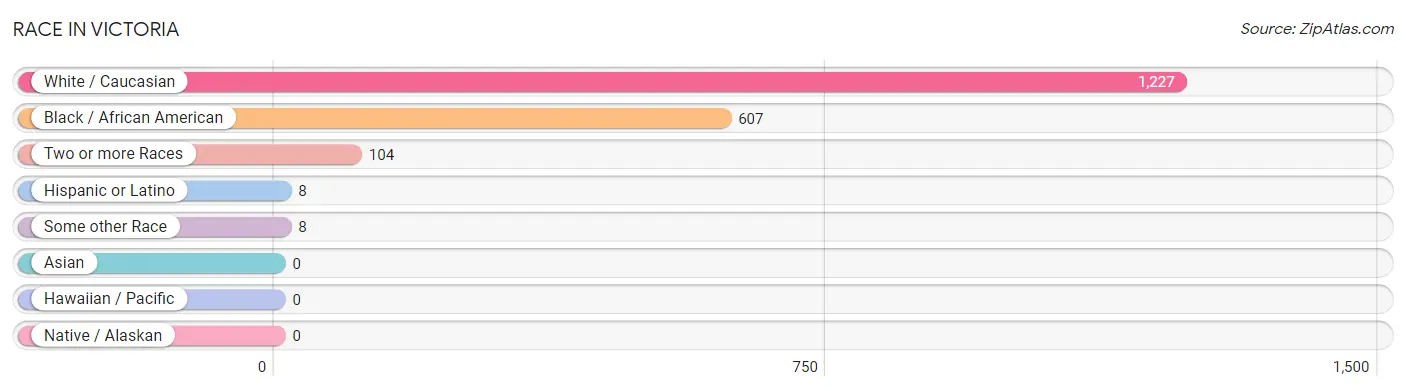
| Race | # Population | % Population |
| Asian | 0 | 0.0% |
| Black / African American | 607 | 31.2% |
| Hawaiian / Pacific | 0 | 0.0% |
| Hispanic or Latino | 8 | 0.4% |
| Native / Alaskan | 0 | 0.0% |
| White / Caucasian | 1,227 | 63.0% |
| Two or more Races | 104 | 5.3% |
| Some other Race | 8 | 0.4% |
| Total | 1,946 | 100.0% |
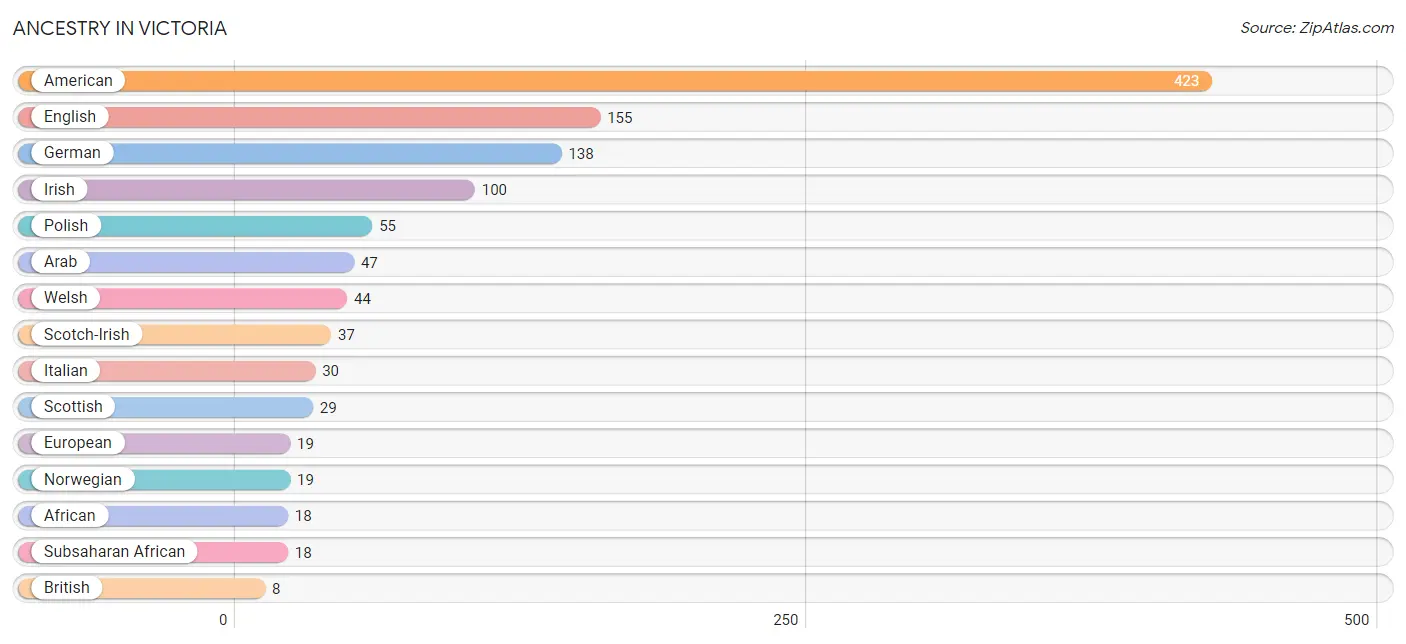
Ancestry in Victoria
The most populous ancestries reported in Victoria are American (423 | 21.7%), English (155 | 8.0%), German (138 | 7.1%), Irish (100 | 5.1%), and Polish (55 | 2.8%), together accounting for 44.8% of all Victoria residents.
| Ancestry | # Population | % Population |
| African | 18 | 0.9% |
| Albanian | 6 | 0.3% |
| American | 423 | 21.7% |
| Arab | 47 | 2.4% |
| British | 8 | 0.4% |
| Central American | 8 | 0.4% |
| English | 155 | 8.0% |
| European | 19 | 1.0% |
| French | 7 | 0.4% |
| German | 138 | 7.1% |
| Irish | 100 | 5.1% |
| Italian | 30 | 1.5% |
| Northern European | 8 | 0.4% |
| Norwegian | 19 | 1.0% |
| Polish | 55 | 2.8% |
| Romanian | 2 | 0.1% |
| Salvadoran | 8 | 0.4% |
| Scotch-Irish | 37 | 1.9% |
| Scottish | 29 | 1.5% |
| Subsaharan African | 18 | 0.9% |
| Swedish | 4 | 0.2% |
| Welsh | 44 | 2.3% | View All 22 Rows |
Immigrants in Victoria
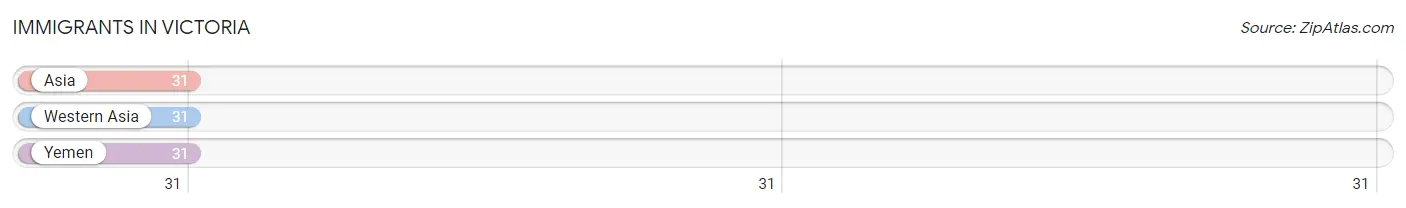
The most numerous immigrant groups reported in Victoria came from Asia (31 | 1.6%), Western Asia (31 | 1.6%), and Yemen (31 | 1.6%), together accounting for 4.8% of all Victoria residents.
| Immigration Origin | # Population | % Population |
| Asia | 31 | 1.6% |
| Western Asia | 31 | 1.6% |
| Yemen | 31 | 1.6% | View All 3 Rows |
Sex and Age in Victoria
Sex and Age in Victoria
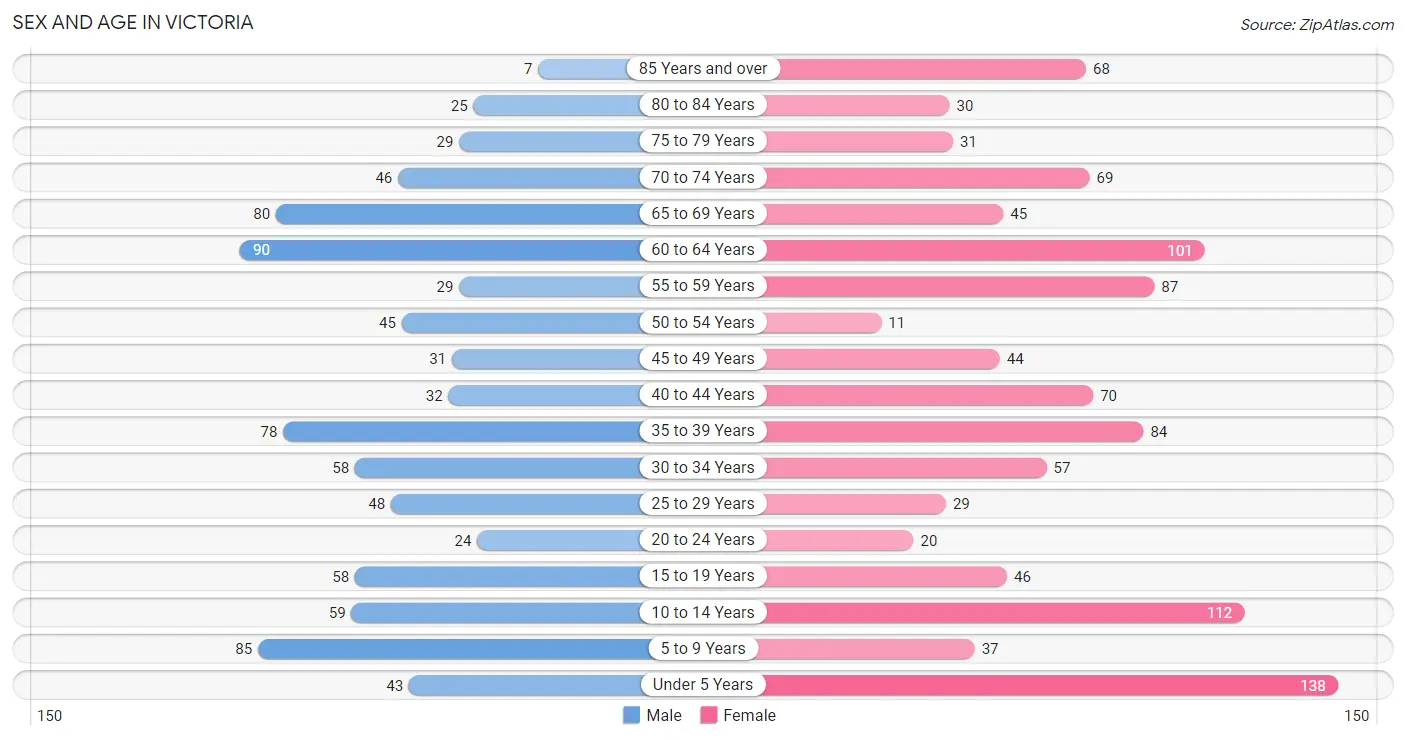
The most populous age groups in Victoria are 60 to 64 Years (90 | 10.4%) for men and Under 5 Years (138 | 12.8%) for women.
| Age Bracket | Male | Female |
| Under 5 Years | 43 (5.0%) | 138 (12.8%) |
| 5 to 9 Years | 85 (9.8%) | 37 (3.4%) |
| 10 to 14 Years | 59 (6.8%) | 112 (10.4%) |
| 15 to 19 Years | 58 (6.7%) | 46 (4.3%) |
| 20 to 24 Years | 24 (2.8%) | 20 (1.8%) |
| 25 to 29 Years | 48 (5.5%) | 29 (2.7%) |
| 30 to 34 Years | 58 (6.7%) | 57 (5.3%) |
| 35 to 39 Years | 78 (9.0%) | 84 (7.8%) |
| 40 to 44 Years | 32 (3.7%) | 70 (6.5%) |
| 45 to 49 Years | 31 (3.6%) | 44 (4.1%) |
| 50 to 54 Years | 45 (5.2%) | 11 (1.0%) |
| 55 to 59 Years | 29 (3.3%) | 87 (8.1%) |
| 60 to 64 Years | 90 (10.4%) | 101 (9.4%) |
| 65 to 69 Years | 80 (9.2%) | 45 (4.2%) |
| 70 to 74 Years | 46 (5.3%) | 69 (6.4%) |
| 75 to 79 Years | 29 (3.3%) | 31 (2.9%) |
| 80 to 84 Years | 25 (2.9%) | 30 (2.8%) |
| 85 Years and over | 7 (0.8%) | 68 (6.3%) |
| Total | 867 (100.0%) | 1,079 (100.0%) |
Families and Households in Victoria
Median Family Size in Victoria
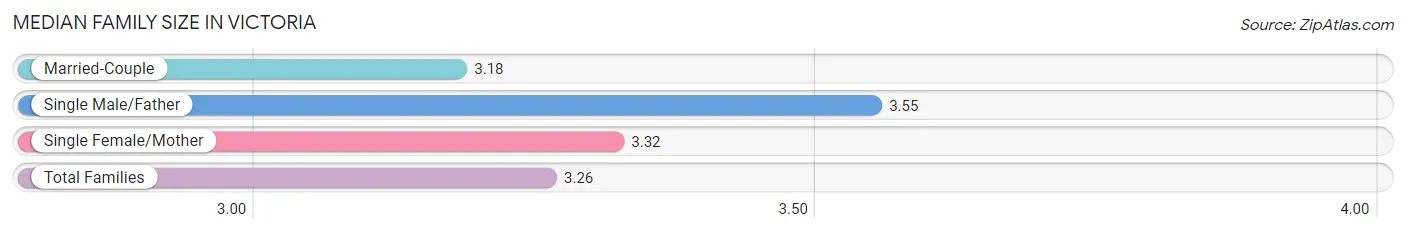
The median family size in Victoria is 3.26 persons per family, with single male/father families (38 | 7.9%) accounting for the largest median family size of 3.55 persons per family. On the other hand, married-couple families (281 | 58.5%) represent the smallest median family size with 3.18 persons per family.
| Family Type | # Families | Family Size |
| Married-Couple | 281 (58.5%) | 3.18 |
| Single Male/Father | 38 (7.9%) | 3.55 |
| Single Female/Mother | 161 (33.5%) | 3.32 |
| Total Families | 480 (100.0%) | 3.26 |
Median Household Size in Victoria
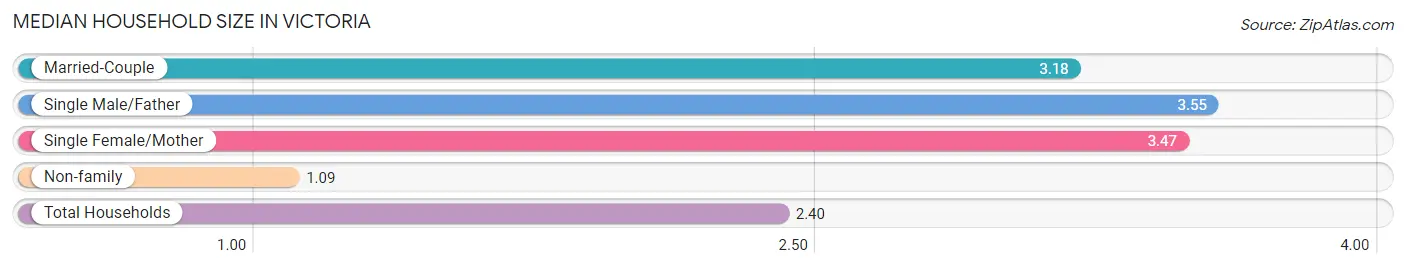
The median household size in Victoria is 2.40 persons per household, with single male/father households (38 | 4.7%) accounting for the largest median household size of 3.55 persons per household. non-family households (330 | 40.7%) represent the smallest median household size with 1.09 persons per household.
| Household Type | # Households | Household Size |
| Married-Couple | 281 (34.7%) | 3.18 |
| Single Male/Father | 38 (4.7%) | 3.55 |
| Single Female/Mother | 161 (19.9%) | 3.47 |
| Non-family | 330 (40.7%) | 1.09 |
| Total Households | 810 (100.0%) | 2.40 |
Household Size by Marriage Status in Victoria
Out of a total of 810 households in Victoria, 480 (59.3%) are family households, while 330 (40.7%) are nonfamily households. The most numerous type of family households are 2-person households, comprising 232, and the most common type of nonfamily households are 1-person households, comprising 311.
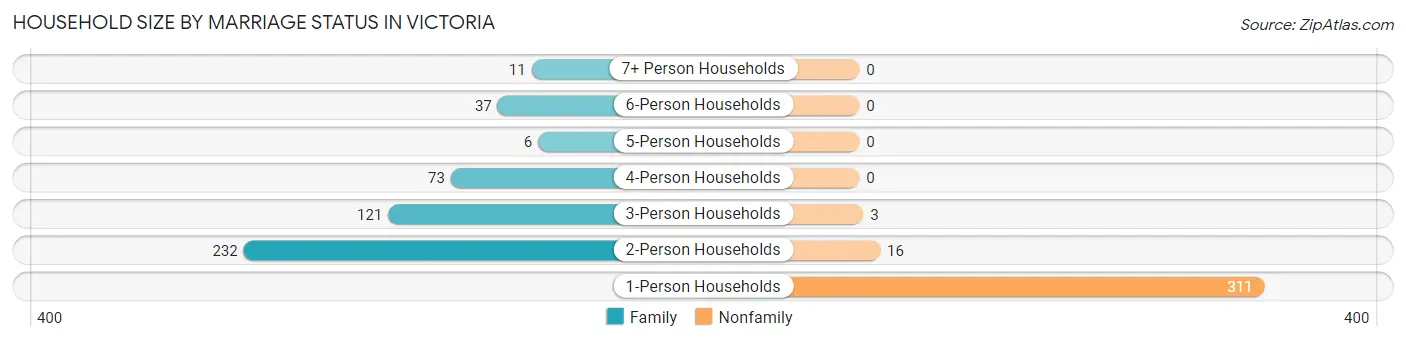
| Household Size | Family Households | Nonfamily Households |
| 1-Person Households | - | 311 (38.4%) |
| 2-Person Households | 232 (28.6%) | 16 (2.0%) |
| 3-Person Households | 121 (14.9%) | 3 (0.4%) |
| 4-Person Households | 73 (9.0%) | 0 (0.0%) |
| 5-Person Households | 6 (0.7%) | 0 (0.0%) |
| 6-Person Households | 37 (4.6%) | 0 (0.0%) |
| 7+ Person Households | 11 (1.4%) | 0 (0.0%) |
| Total | 480 (59.3%) | 330 (40.7%) |
Female Fertility in Victoria
Fertility by Age in Victoria
Average fertility rate in Victoria is 106.0 births per 1,000 women. Women in the age bracket of 20 to 34 years have the highest fertility rate with 349.0 births per 1,000 women. Women in the age bracket of 20 to 34 years acount for 100.0% of all women with births.
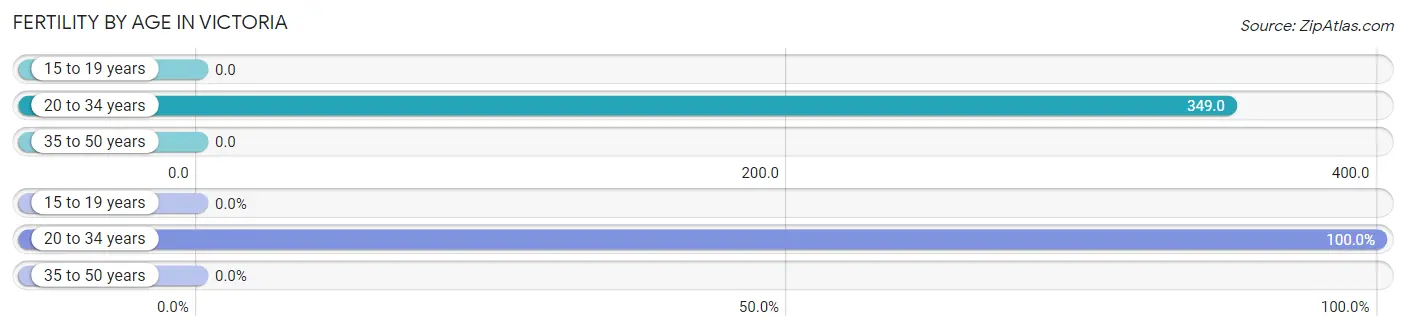
| Age Bracket | Women with Births | Births / 1,000 Women |
| 15 to 19 years | 0 (0.0%) | 0.0 |
| 20 to 34 years | 37 (100.0%) | 349.0 |
| 35 to 50 years | 0 (0.0%) | 0.0 |
| Total | 37 (100.0%) | 106.0 |
Fertility by Age by Marriage Status in Victoria
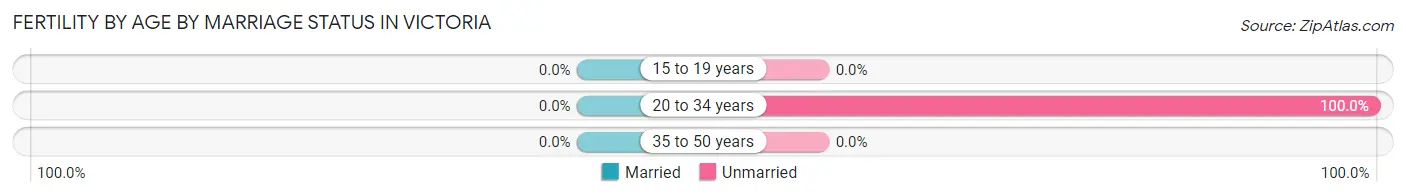
| Age Bracket | Married | Unmarried |
| 15 to 19 years | 0 (0.0%) | 0 (0.0%) |
| 20 to 34 years | 0 (0.0%) | 37 (100.0%) |
| 35 to 50 years | 0 (0.0%) | 0 (0.0%) |
| Total | 0 (0.0%) | 37 (100.0%) |
Fertility by Education in Victoria
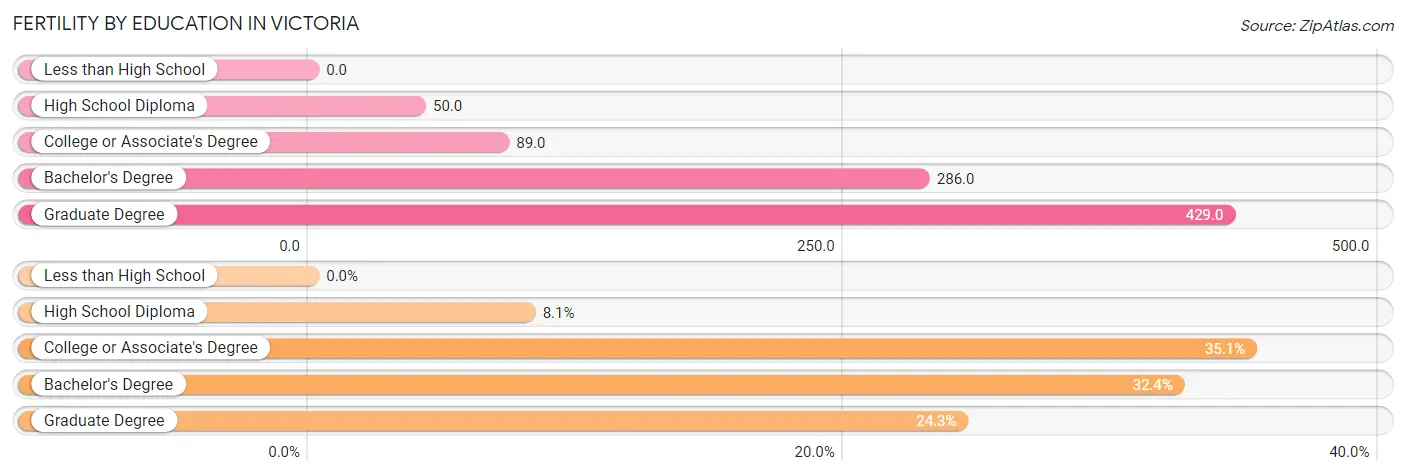
| Educational Attainment | Women with Births | Births / 1,000 Women |
| Less than High School | 0 (0.0%) | 0.0 |
| High School Diploma | 3 (8.1%) | 50.0 |
| College or Associate's Degree | 13 (35.1%) | 89.0 |
| Bachelor's Degree | 12 (32.4%) | 286.0 |
| Graduate Degree | 9 (24.3%) | 429.0 |
| Total | 37 (100.0%) | 106.0 |
Fertility by Education by Marriage Status in Victoria
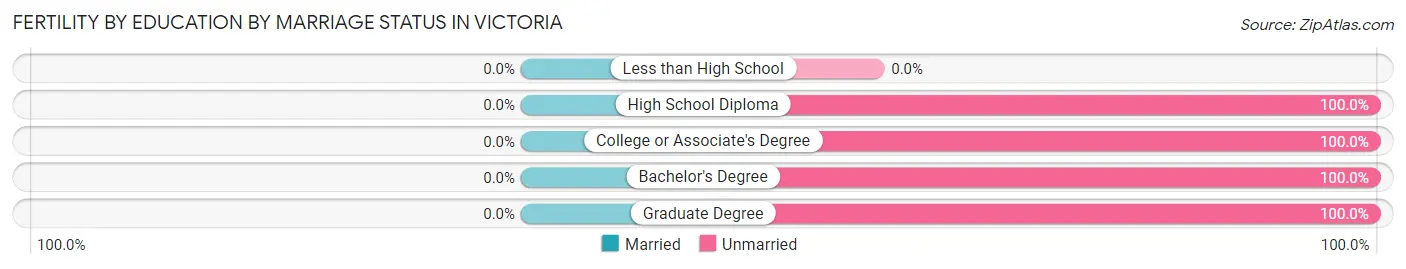
| Educational Attainment | Married | Unmarried |
| Less than High School | 0 (0.0%) | 0 (0.0%) |
| High School Diploma | 0 (0.0%) | 3 (100.0%) |
| College or Associate's Degree | 0 (0.0%) | 13 (100.0%) |
| Bachelor's Degree | 0 (0.0%) | 12 (100.0%) |
| Graduate Degree | 0 (0.0%) | 9 (100.0%) |
| Total | 0 (0.0%) | 37 (100.0%) |
Employment Characteristics in Victoria
Employment by Class of Employer in Victoria
Among the 632 employed individuals in Victoria, private company employees (401 | 63.4%), local government employees (119 | 18.8%), and state government employees (72 | 11.4%) make up the most common classes of employment.
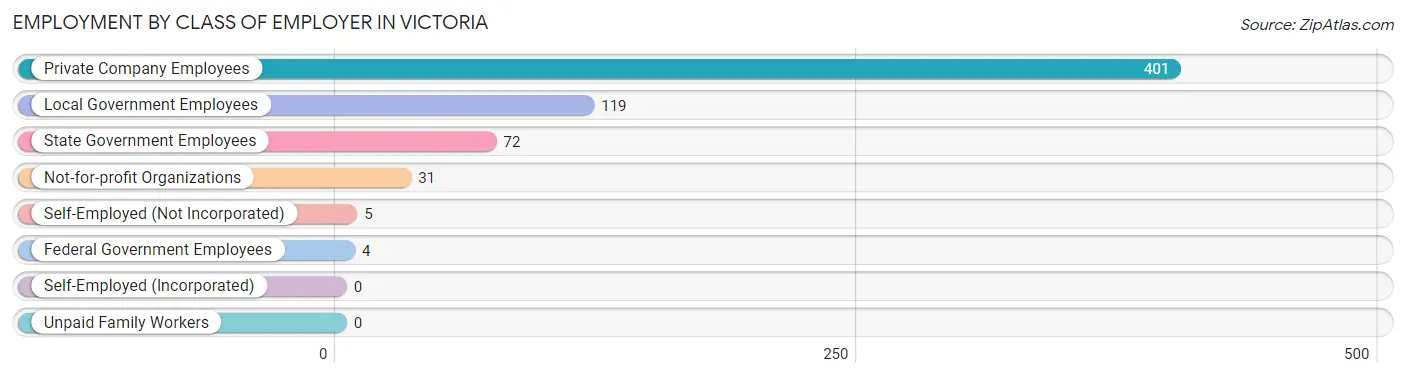
| Employer Class | # Employees | % Employees |
| Private Company Employees | 401 | 63.4% |
| Self-Employed (Incorporated) | 0 | 0.0% |
| Self-Employed (Not Incorporated) | 5 | 0.8% |
| Not-for-profit Organizations | 31 | 4.9% |
| Local Government Employees | 119 | 18.8% |
| State Government Employees | 72 | 11.4% |
| Federal Government Employees | 4 | 0.6% |
| Unpaid Family Workers | 0 | 0.0% |
| Total | 632 | 100.0% |
Employment Status by Age in Victoria
According to the labor force statistics for Victoria, out of the total population over 16 years of age (1,428), 46.7% or 667 individuals are in the labor force, with 4.8% or 32 of them unemployed. The age group with the highest labor force participation rate is 25 to 29 years, with 87.0% or 67 individuals in the labor force. Within the labor force, the 30 to 34 years age range has the highest percentage of unemployed individuals, with 15.9% or 14 of them being unemployed.
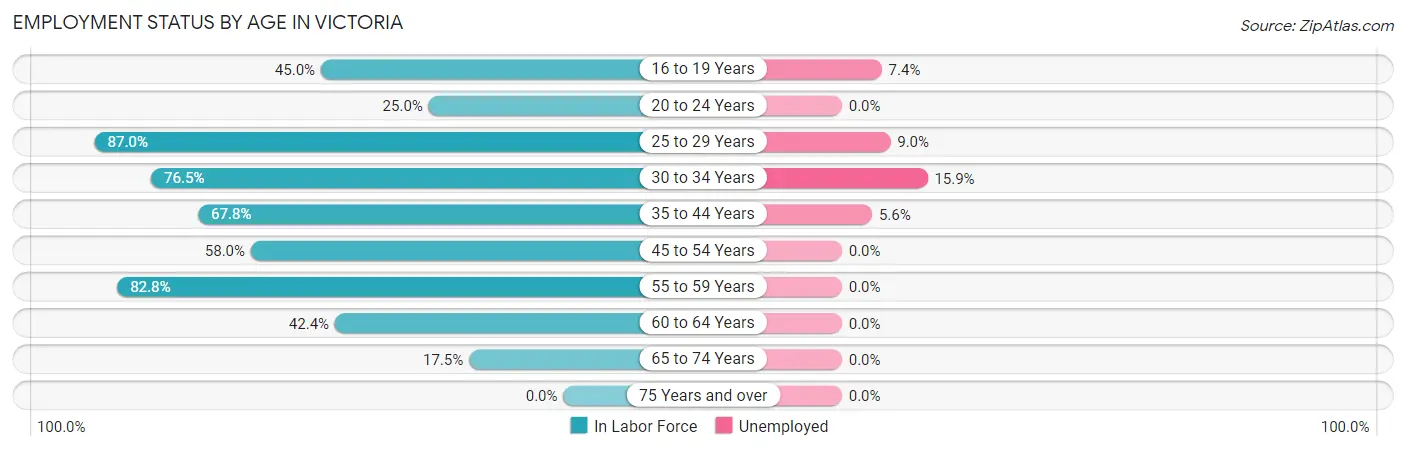
| Age Bracket | In Labor Force | Unemployed |
| 16 to 19 Years | 27 (45.0%) | 2 (7.4%) |
| 20 to 24 Years | 11 (25.0%) | 0 (0.0%) |
| 25 to 29 Years | 67 (87.0%) | 6 (9.0%) |
| 30 to 34 Years | 88 (76.5%) | 14 (15.9%) |
| 35 to 44 Years | 179 (67.8%) | 10 (5.6%) |
| 45 to 54 Years | 76 (58.0%) | 0 (0.0%) |
| 55 to 59 Years | 96 (82.8%) | 0 (0.0%) |
| 60 to 64 Years | 81 (42.4%) | 0 (0.0%) |
| 65 to 74 Years | 42 (17.5%) | 0 (0.0%) |
| 75 Years and over | 0 (0.0%) | 0 (0.0%) |
| Total | 667 (46.7%) | 32 (4.8%) |
Employment Status by Educational Attainment in Victoria
According to labor force statistics for Victoria, 65.7% of individuals (587) out of the total population between 25 and 64 years of age (894) are in the labor force, with 5.1% or 30 of them being unemployed. The group with the highest labor force participation rate are those with the educational attainment of bachelor's degree or higher, with 86.8% or 112 individuals in the labor force. Within the labor force, individuals with high school diploma education have the highest percentage of unemployment, with 12.6% or 23 of them being unemployed.
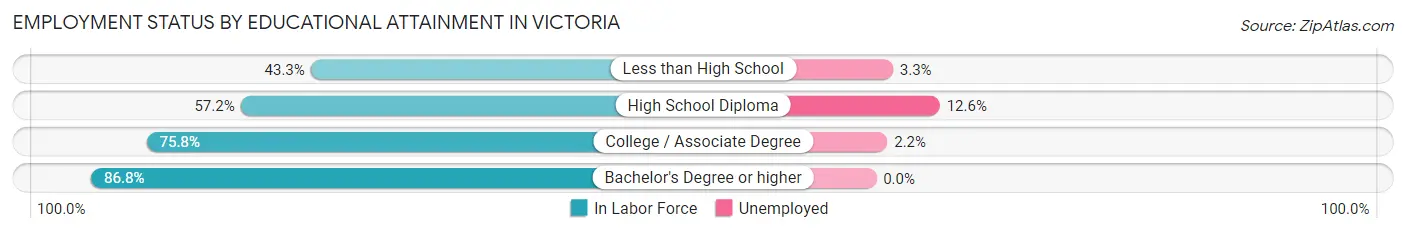
| Educational Attainment | In Labor Force | Unemployed |
| Less than High School | 61 (43.3%) | 5 (3.3%) |
| High School Diploma | 182 (57.2%) | 40 (12.6%) |
| College / Associate Degree | 232 (75.8%) | 7 (2.2%) |
| Bachelor's Degree or higher | 112 (86.8%) | 0 (0.0%) |
| Total | 587 (65.7%) | 46 (5.1%) |
Employment Occupations by Sex in Victoria
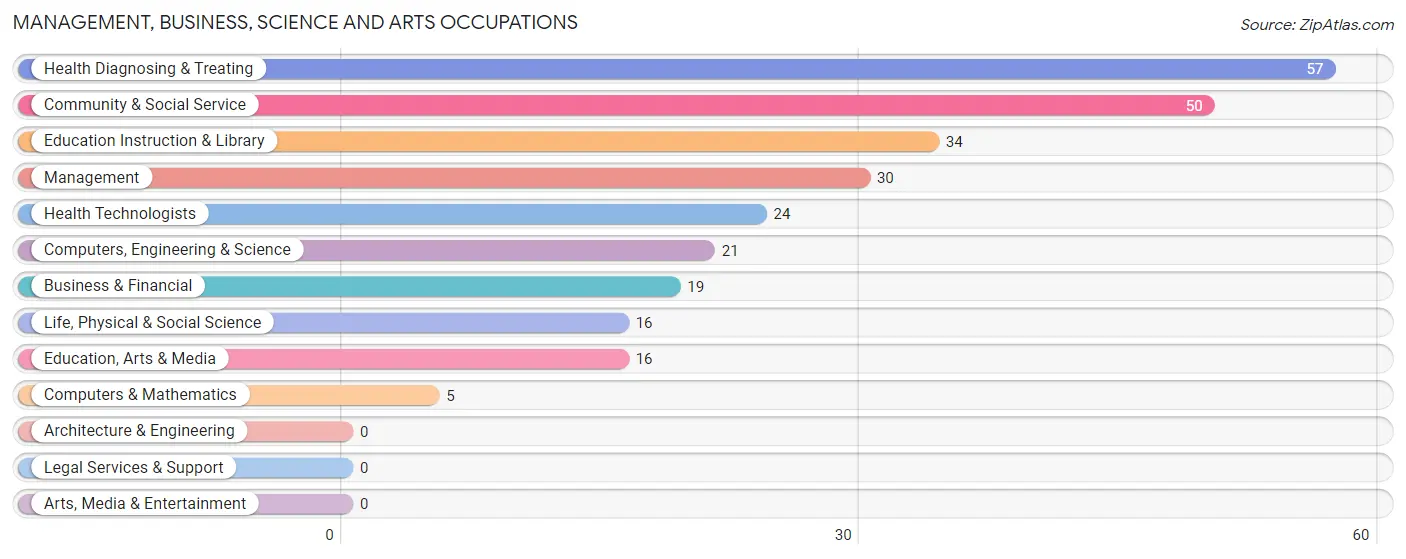
Management, Business, Science and Arts Occupations
The most common Management, Business, Science and Arts occupations in Victoria are Health Diagnosing & Treating (57 | 9.0%), Community & Social Service (50 | 7.9%), Education Instruction & Library (34 | 5.3%), Management (30 | 4.7%), and Health Technologists (24 | 3.8%).
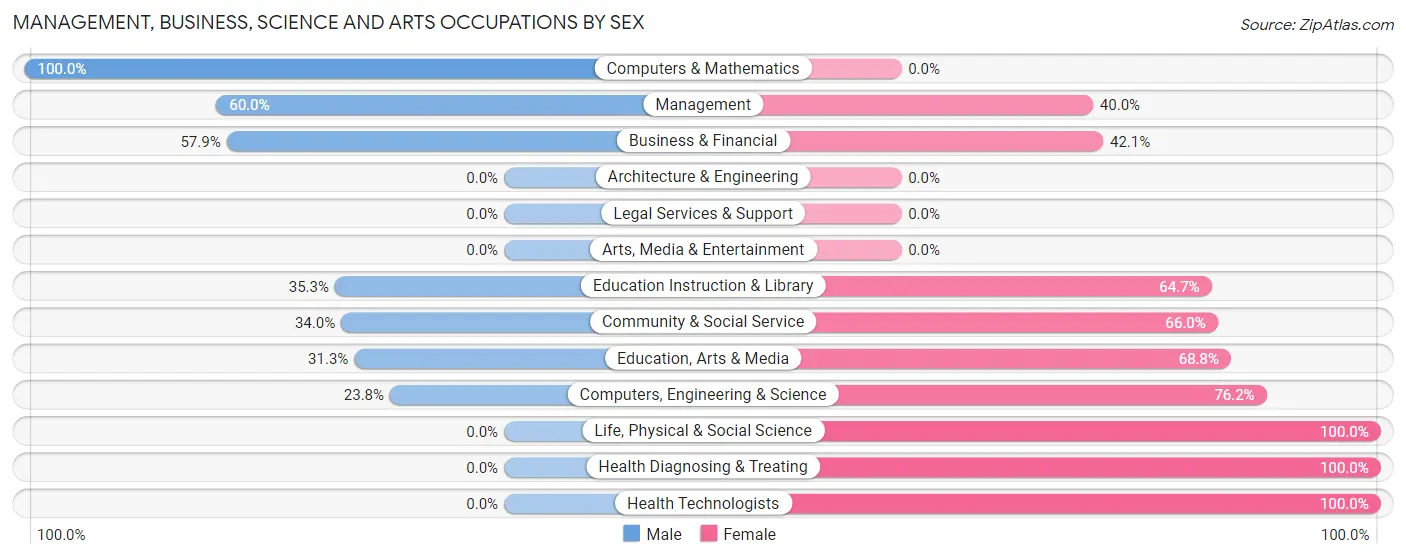
Management, Business, Science and Arts Occupations by Sex
Within the Management, Business, Science and Arts occupations in Victoria, the most male-oriented occupations are Computers & Mathematics (100.0%), Management (60.0%), and Business & Financial (57.9%), while the most female-oriented occupations are Life, Physical & Social Science (100.0%), Health Diagnosing & Treating (100.0%), and Health Technologists (100.0%).
| Occupation | Male | Female |
| Management | 18 (60.0%) | 12 (40.0%) |
| Business & Financial | 11 (57.9%) | 8 (42.1%) |
| Computers, Engineering & Science | 5 (23.8%) | 16 (76.2%) |
| Computers & Mathematics | 5 (100.0%) | 0 (0.0%) |
| Architecture & Engineering | 0 (0.0%) | 0 (0.0%) |
| Life, Physical & Social Science | 0 (0.0%) | 16 (100.0%) |
| Community & Social Service | 17 (34.0%) | 33 (66.0%) |
| Education, Arts & Media | 5 (31.2%) | 11 (68.8%) |
| Legal Services & Support | 0 (0.0%) | 0 (0.0%) |
| Education Instruction & Library | 12 (35.3%) | 22 (64.7%) |
| Arts, Media & Entertainment | 0 (0.0%) | 0 (0.0%) |
| Health Diagnosing & Treating | 0 (0.0%) | 57 (100.0%) |
| Health Technologists | 0 (0.0%) | 24 (100.0%) |
| Total (Category) | 51 (28.8%) | 126 (71.2%) |
| Total (Overall) | 322 (50.7%) | 313 (49.3%) |
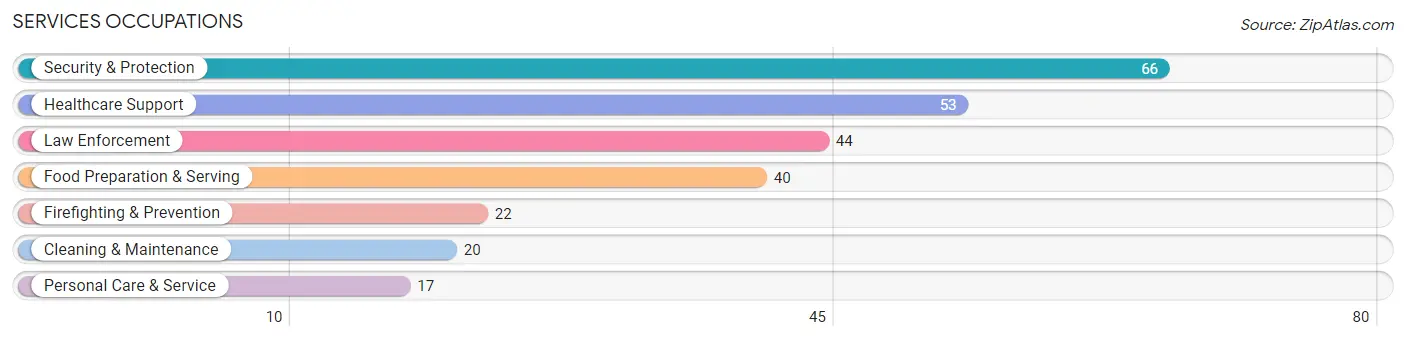
Services Occupations
The most common Services occupations in Victoria are Security & Protection (66 | 10.4%), Healthcare Support (53 | 8.4%), Law Enforcement (44 | 6.9%), Food Preparation & Serving (40 | 6.3%), and Firefighting & Prevention (22 | 3.5%).
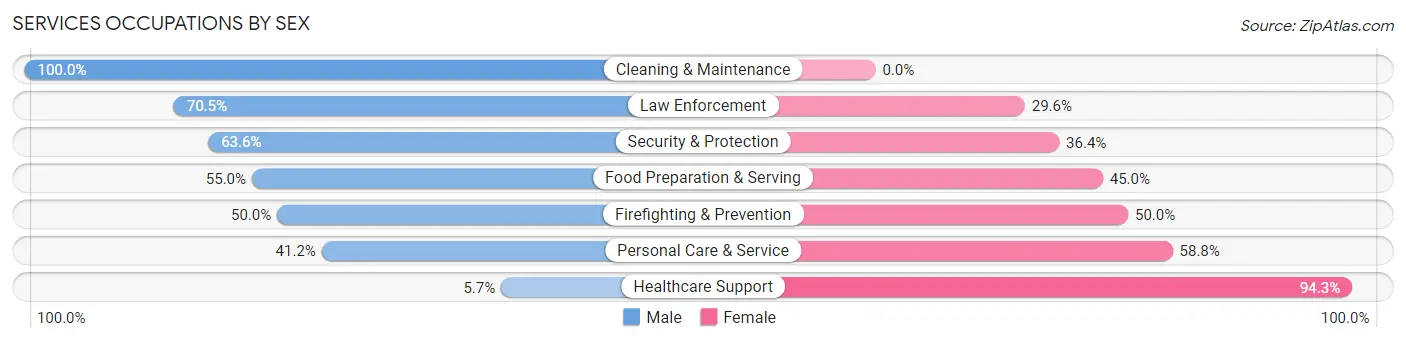
Services Occupations by Sex
Within the Services occupations in Victoria, the most male-oriented occupations are Cleaning & Maintenance (100.0%), Law Enforcement (70.5%), and Security & Protection (63.6%), while the most female-oriented occupations are Healthcare Support (94.3%), Personal Care & Service (58.8%), and Firefighting & Prevention (50.0%).
| Occupation | Male | Female |
| Healthcare Support | 3 (5.7%) | 50 (94.3%) |
| Security & Protection | 42 (63.6%) | 24 (36.4%) |
| Firefighting & Prevention | 11 (50.0%) | 11 (50.0%) |
| Law Enforcement | 31 (70.5%) | 13 (29.5%) |
| Food Preparation & Serving | 22 (55.0%) | 18 (45.0%) |
| Cleaning & Maintenance | 20 (100.0%) | 0 (0.0%) |
| Personal Care & Service | 7 (41.2%) | 10 (58.8%) |
| Total (Category) | 94 (48.0%) | 102 (52.0%) |
| Total (Overall) | 322 (50.7%) | 313 (49.3%) |
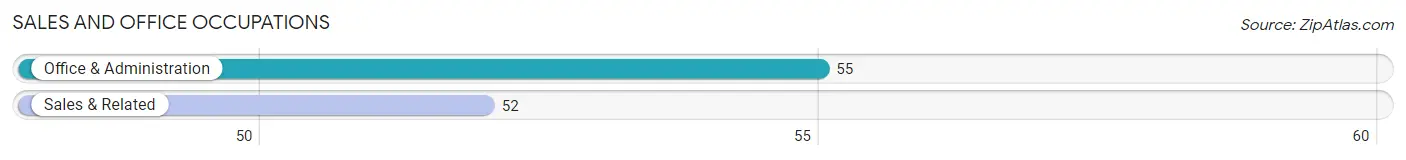
Sales and Office Occupations
The most common Sales and Office occupations in Victoria are Office & Administration (55 | 8.7%), and Sales & Related (52 | 8.2%).
Sales and Office Occupations by Sex
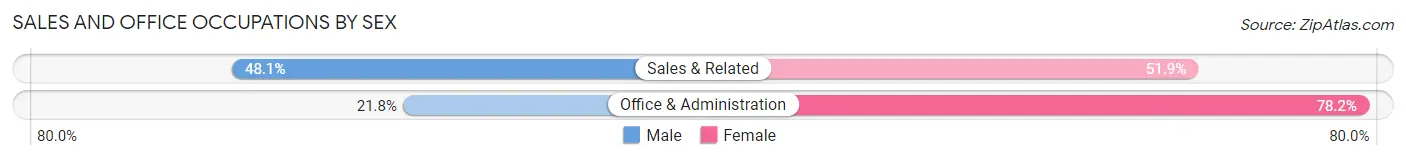
| Occupation | Male | Female |
| Sales & Related | 25 (48.1%) | 27 (51.9%) |
| Office & Administration | 12 (21.8%) | 43 (78.2%) |
| Total (Category) | 37 (34.6%) | 70 (65.4%) |
| Total (Overall) | 322 (50.7%) | 313 (49.3%) |
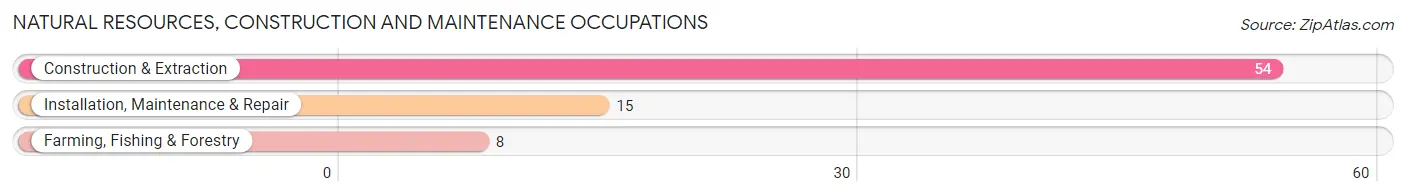
Natural Resources, Construction and Maintenance Occupations
The most common Natural Resources, Construction and Maintenance occupations in Victoria are Construction & Extraction (54 | 8.5%), Installation, Maintenance & Repair (15 | 2.4%), and Farming, Fishing & Forestry (8 | 1.3%).
Natural Resources, Construction and Maintenance Occupations by Sex
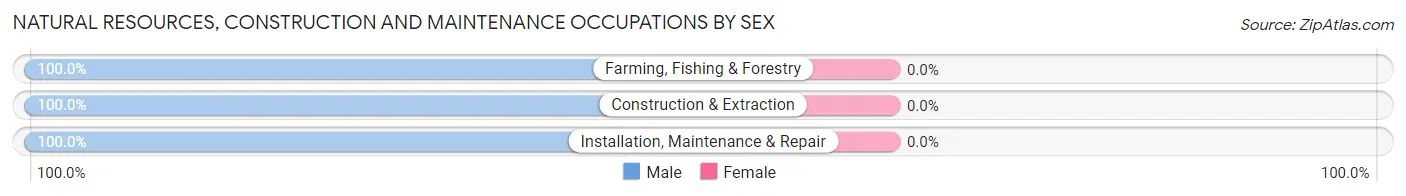
| Occupation | Male | Female |
| Farming, Fishing & Forestry | 8 (100.0%) | 0 (0.0%) |
| Construction & Extraction | 54 (100.0%) | 0 (0.0%) |
| Installation, Maintenance & Repair | 15 (100.0%) | 0 (0.0%) |
| Total (Category) | 77 (100.0%) | 0 (0.0%) |
| Total (Overall) | 322 (50.7%) | 313 (49.3%) |
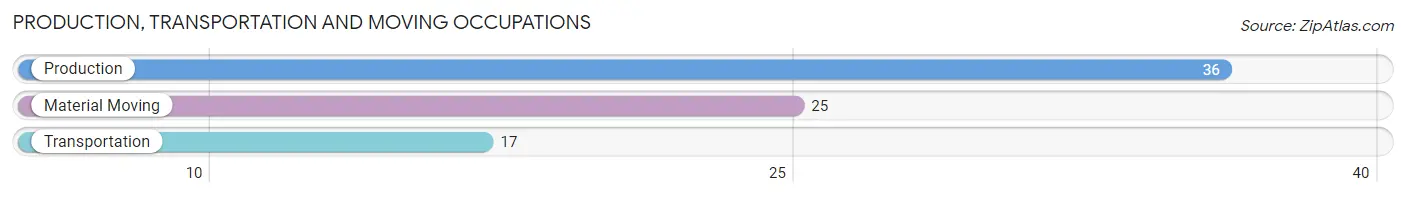
Production, Transportation and Moving Occupations
The most common Production, Transportation and Moving occupations in Victoria are Production (36 | 5.7%), Material Moving (25 | 3.9%), and Transportation (17 | 2.7%).
Production, Transportation and Moving Occupations by Sex
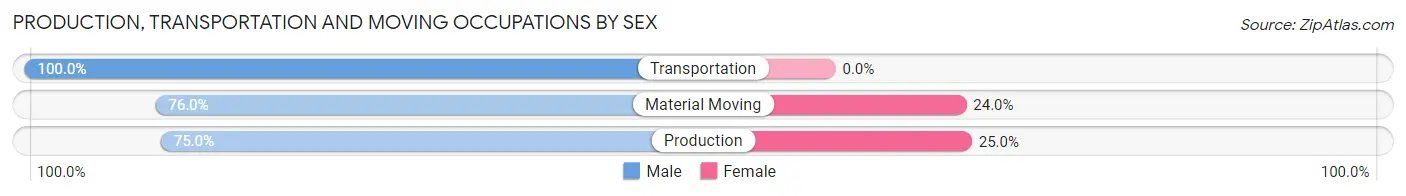
| Occupation | Male | Female |
| Production | 27 (75.0%) | 9 (25.0%) |
| Transportation | 17 (100.0%) | 0 (0.0%) |
| Material Moving | 19 (76.0%) | 6 (24.0%) |
| Total (Category) | 63 (80.8%) | 15 (19.2%) |
| Total (Overall) | 322 (50.7%) | 313 (49.3%) |
Employment Industries by Sex in Victoria
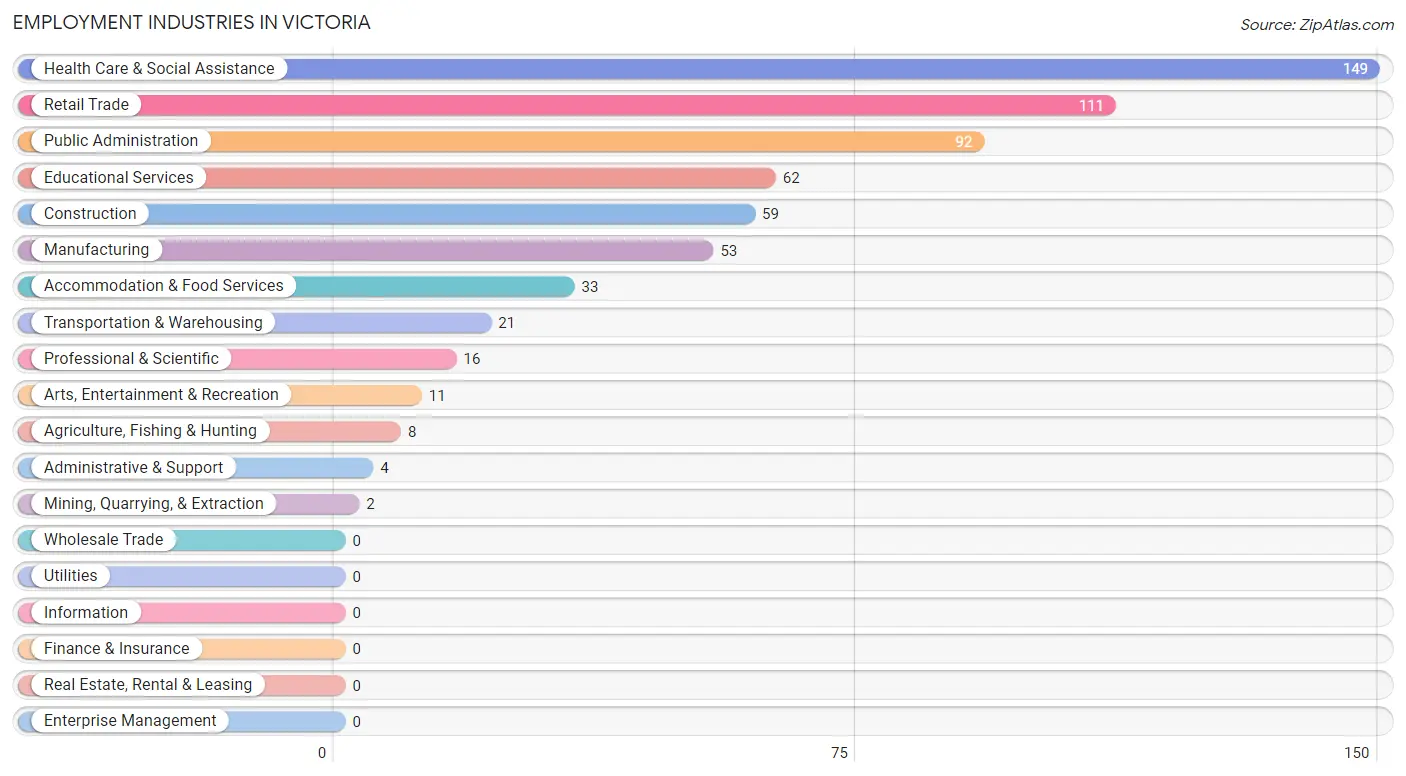
Employment Industries in Victoria
The major employment industries in Victoria include Health Care & Social Assistance (149 | 23.5%), Retail Trade (111 | 17.5%), Public Administration (92 | 14.5%), Educational Services (62 | 9.8%), and Construction (59 | 9.3%).
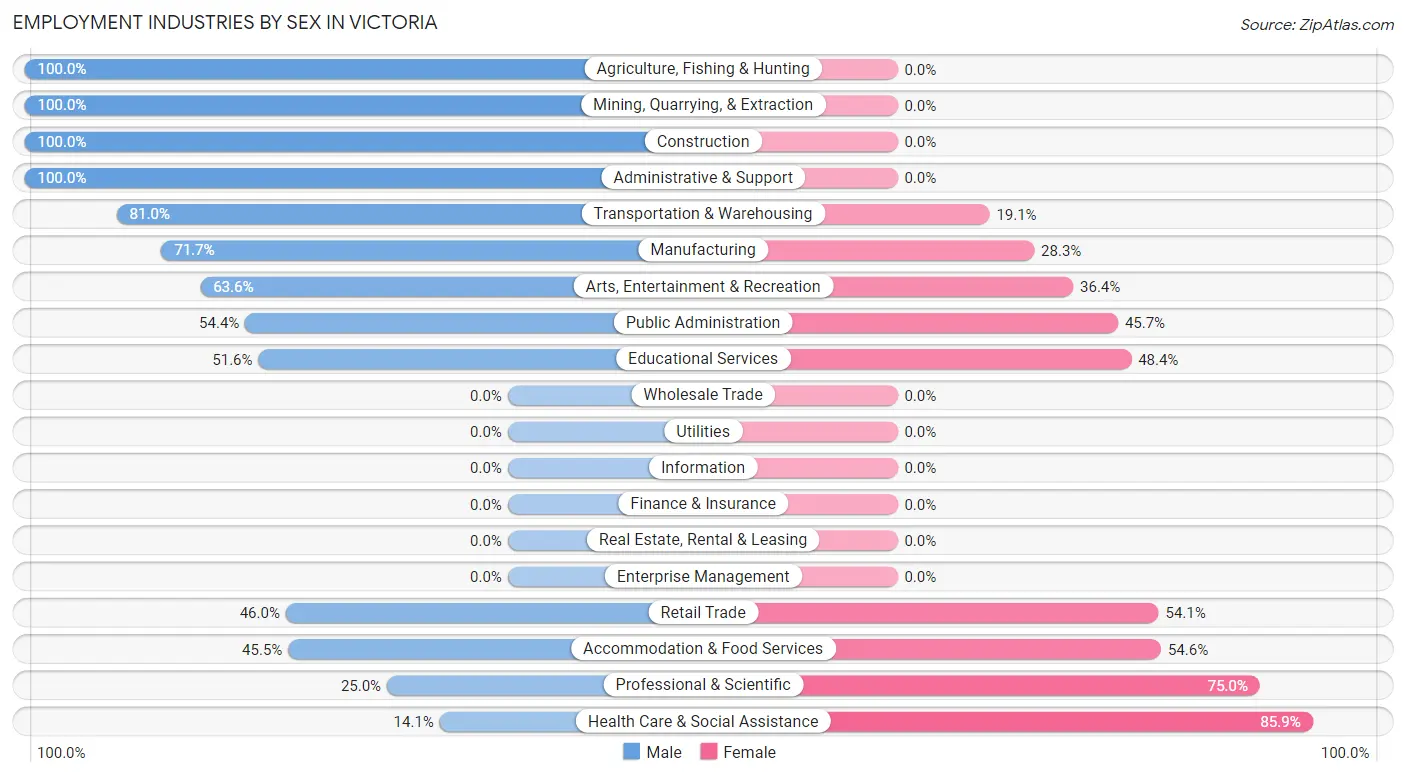
Employment Industries by Sex in Victoria
The Victoria industries that see more men than women are Agriculture, Fishing & Hunting (100.0%), Mining, Quarrying, & Extraction (100.0%), and Construction (100.0%), whereas the industries that tend to have a higher number of women are Health Care & Social Assistance (85.9%), Professional & Scientific (75.0%), and Accommodation & Food Services (54.5%).
| Industry | Male | Female |
| Agriculture, Fishing & Hunting | 8 (100.0%) | 0 (0.0%) |
| Mining, Quarrying, & Extraction | 2 (100.0%) | 0 (0.0%) |
| Construction | 59 (100.0%) | 0 (0.0%) |
| Manufacturing | 38 (71.7%) | 15 (28.3%) |
| Wholesale Trade | 0 (0.0%) | 0 (0.0%) |
| Retail Trade | 51 (46.0%) | 60 (54.0%) |
| Transportation & Warehousing | 17 (80.9%) | 4 (19.1%) |
| Utilities | 0 (0.0%) | 0 (0.0%) |
| Information | 0 (0.0%) | 0 (0.0%) |
| Finance & Insurance | 0 (0.0%) | 0 (0.0%) |
| Real Estate, Rental & Leasing | 0 (0.0%) | 0 (0.0%) |
| Professional & Scientific | 4 (25.0%) | 12 (75.0%) |
| Enterprise Management | 0 (0.0%) | 0 (0.0%) |
| Administrative & Support | 4 (100.0%) | 0 (0.0%) |
| Educational Services | 32 (51.6%) | 30 (48.4%) |
| Health Care & Social Assistance | 21 (14.1%) | 128 (85.9%) |
| Arts, Entertainment & Recreation | 7 (63.6%) | 4 (36.4%) |
| Accommodation & Food Services | 15 (45.5%) | 18 (54.5%) |
| Public Administration | 50 (54.3%) | 42 (45.7%) |
| Total | 322 (50.7%) | 313 (49.3%) |
Education in Victoria
School Enrollment in Victoria
The most common levels of schooling among the 434 students in Victoria are high school (140 | 32.3%), elementary school (124 | 28.6%), and middle school (91 | 21.0%).
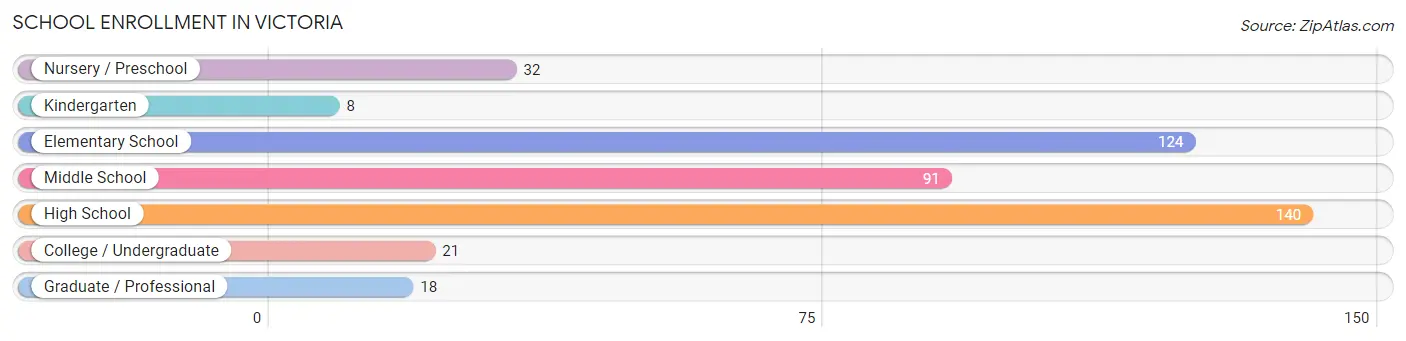
| School Level | # Students | % Students |
| Nursery / Preschool | 32 | 7.4% |
| Kindergarten | 8 | 1.8% |
| Elementary School | 124 | 28.6% |
| Middle School | 91 | 21.0% |
| High School | 140 | 32.3% |
| College / Undergraduate | 21 | 4.8% |
| Graduate / Professional | 18 | 4.2% |
| Total | 434 | 100.0% |
School Enrollment by Age by Funding Source in Victoria
Out of a total of 434 students who are enrolled in schools in Victoria, 50 (11.5%) attend a private institution, while the remaining 384 (88.5%) are enrolled in public schools. The age group of 3 to 4 year olds has the highest likelihood of being enrolled in private schools, with 16 (59.3% in the age bracket) enrolled. Conversely, the age group of 10 to 14 year olds has the lowest likelihood of being enrolled in a private school, with 161 (100.0% in the age bracket) attending a public institution.
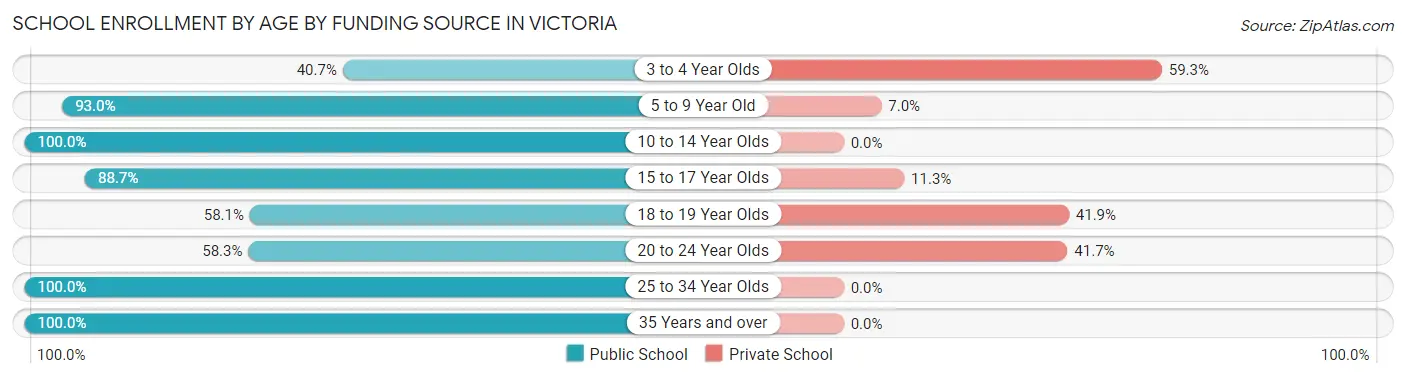
| Age Bracket | Public School | Private School |
| 3 to 4 Year Olds | 11 (40.7%) | 16 (59.3%) |
| 5 to 9 Year Old | 106 (93.0%) | 8 (7.0%) |
| 10 to 14 Year Olds | 161 (100.0%) | 0 (0.0%) |
| 15 to 17 Year Olds | 63 (88.7%) | 8 (11.3%) |
| 18 to 19 Year Olds | 18 (58.1%) | 13 (41.9%) |
| 20 to 24 Year Olds | 7 (58.3%) | 5 (41.7%) |
| 25 to 34 Year Olds | 13 (100.0%) | 0 (0.0%) |
| 35 Years and over | 5 (100.0%) | 0 (0.0%) |
| Total | 384 (88.5%) | 50 (11.5%) |
Educational Attainment by Field of Study in Victoria
Business (46 | 21.6%), social sciences (34 | 16.0%), arts & humanities (27 | 12.7%), psychology (24 | 11.3%), and education (23 | 10.8%) are the most common fields of study among 213 individuals in Victoria who have obtained a bachelor's degree or higher.
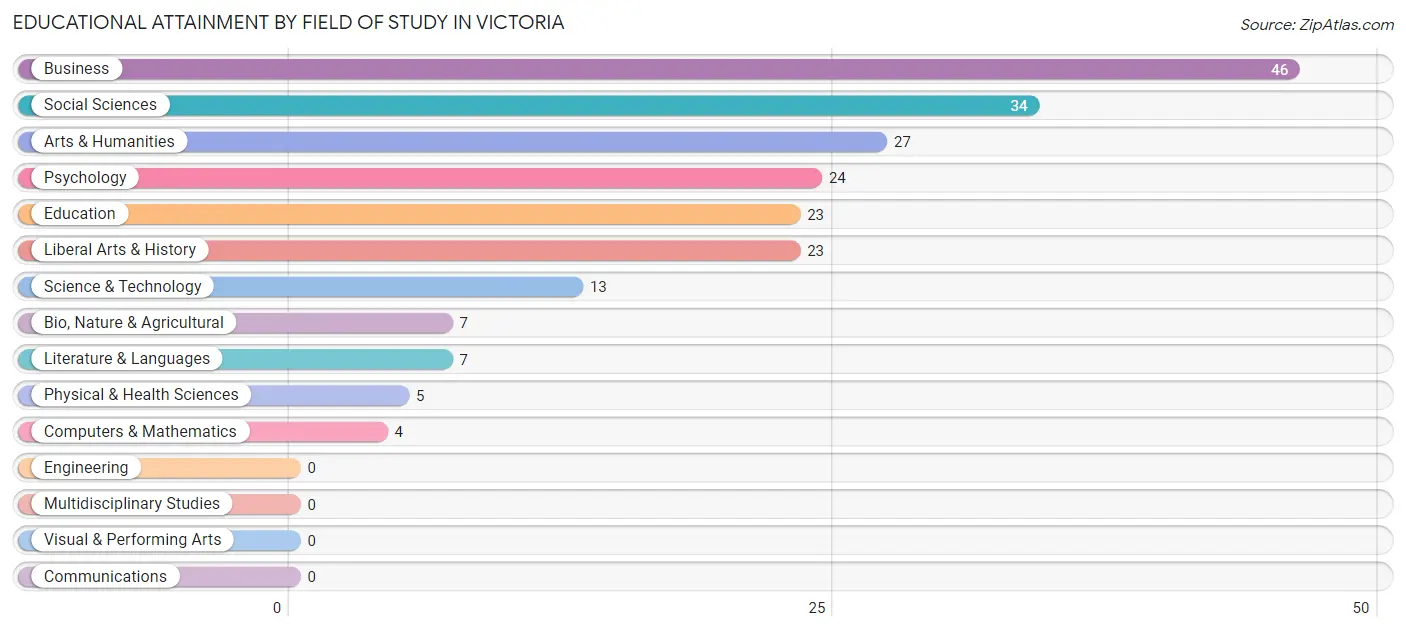
| Field of Study | # Graduates | % Graduates |
| Computers & Mathematics | 4 | 1.9% |
| Bio, Nature & Agricultural | 7 | 3.3% |
| Physical & Health Sciences | 5 | 2.4% |
| Psychology | 24 | 11.3% |
| Social Sciences | 34 | 16.0% |
| Engineering | 0 | 0.0% |
| Multidisciplinary Studies | 0 | 0.0% |
| Science & Technology | 13 | 6.1% |
| Business | 46 | 21.6% |
| Education | 23 | 10.8% |
| Literature & Languages | 7 | 3.3% |
| Liberal Arts & History | 23 | 10.8% |
| Visual & Performing Arts | 0 | 0.0% |
| Communications | 0 | 0.0% |
| Arts & Humanities | 27 | 12.7% |
| Total | 213 | 100.0% |
Transportation & Commute in Victoria
Vehicle Availability by Sex in Victoria
The most prevalent vehicle ownership categories in Victoria are males with 2 vehicles (105, accounting for 32.6%) and females with 2 vehicles (113, making up 33.9%).
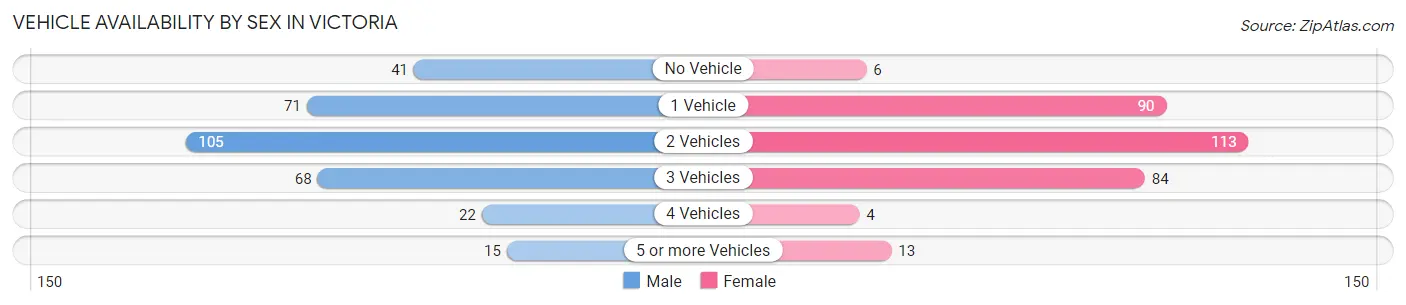
| Vehicles Available | Male | Female |
| No Vehicle | 41 (12.7%) | 6 (1.9%) |
| 1 Vehicle | 71 (22.1%) | 90 (29.0%) |
| 2 Vehicles | 105 (32.6%) | 113 (36.4%) |
| 3 Vehicles | 68 (21.1%) | 84 (27.1%) |
| 4 Vehicles | 22 (6.8%) | 4 (1.3%) |
| 5 or more Vehicles | 15 (4.7%) | 13 (4.2%) |
| Total | 322 (100.0%) | 310 (100.0%) |
Commute Time in Victoria
The most frequently occuring commute durations in Victoria are 5 to 9 minutes (89 commuters, 14.5%), 60 to 89 minutes (79 commuters, 12.9%), and 30 to 34 minutes (67 commuters, 11.0%).
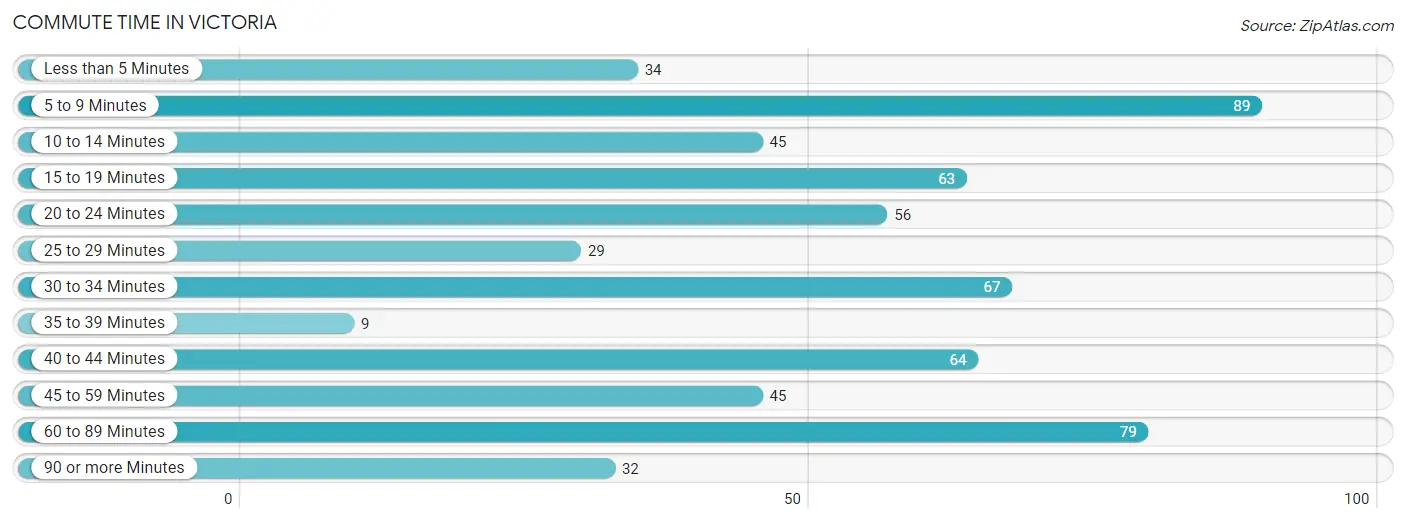
| Commute Time | # Commuters | % Commuters |
| Less than 5 Minutes | 34 | 5.6% |
| 5 to 9 Minutes | 89 | 14.5% |
| 10 to 14 Minutes | 45 | 7.3% |
| 15 to 19 Minutes | 63 | 10.3% |
| 20 to 24 Minutes | 56 | 9.1% |
| 25 to 29 Minutes | 29 | 4.7% |
| 30 to 34 Minutes | 67 | 11.0% |
| 35 to 39 Minutes | 9 | 1.5% |
| 40 to 44 Minutes | 64 | 10.5% |
| 45 to 59 Minutes | 45 | 7.3% |
| 60 to 89 Minutes | 79 | 12.9% |
| 90 or more Minutes | 32 | 5.2% |
Commute Time by Sex in Victoria
The most common commute times in Victoria are 60 to 89 minutes (55 commuters, 17.7%) for males and 5 to 9 minutes (60 commuters, 19.9%) for females.
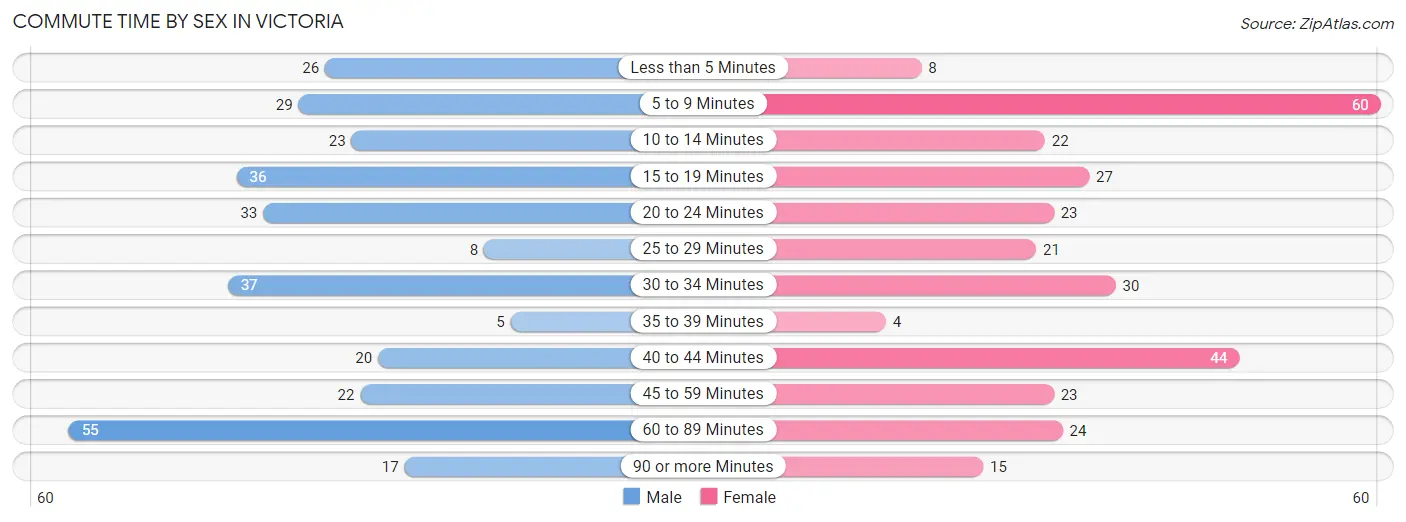
| Commute Time | Male | Female |
| Less than 5 Minutes | 26 (8.4%) | 8 (2.7%) |
| 5 to 9 Minutes | 29 (9.3%) | 60 (19.9%) |
| 10 to 14 Minutes | 23 (7.4%) | 22 (7.3%) |
| 15 to 19 Minutes | 36 (11.6%) | 27 (9.0%) |
| 20 to 24 Minutes | 33 (10.6%) | 23 (7.6%) |
| 25 to 29 Minutes | 8 (2.6%) | 21 (7.0%) |
| 30 to 34 Minutes | 37 (11.9%) | 30 (10.0%) |
| 35 to 39 Minutes | 5 (1.6%) | 4 (1.3%) |
| 40 to 44 Minutes | 20 (6.4%) | 44 (14.6%) |
| 45 to 59 Minutes | 22 (7.1%) | 23 (7.6%) |
| 60 to 89 Minutes | 55 (17.7%) | 24 (8.0%) |
| 90 or more Minutes | 17 (5.5%) | 15 (5.0%) |
Time of Departure to Work by Sex in Victoria
The most frequent times of departure to work in Victoria are 12:00 AM to 4:59 AM (78, 25.1%) for males and 7:00 AM to 7:29 AM (78, 25.9%) for females.
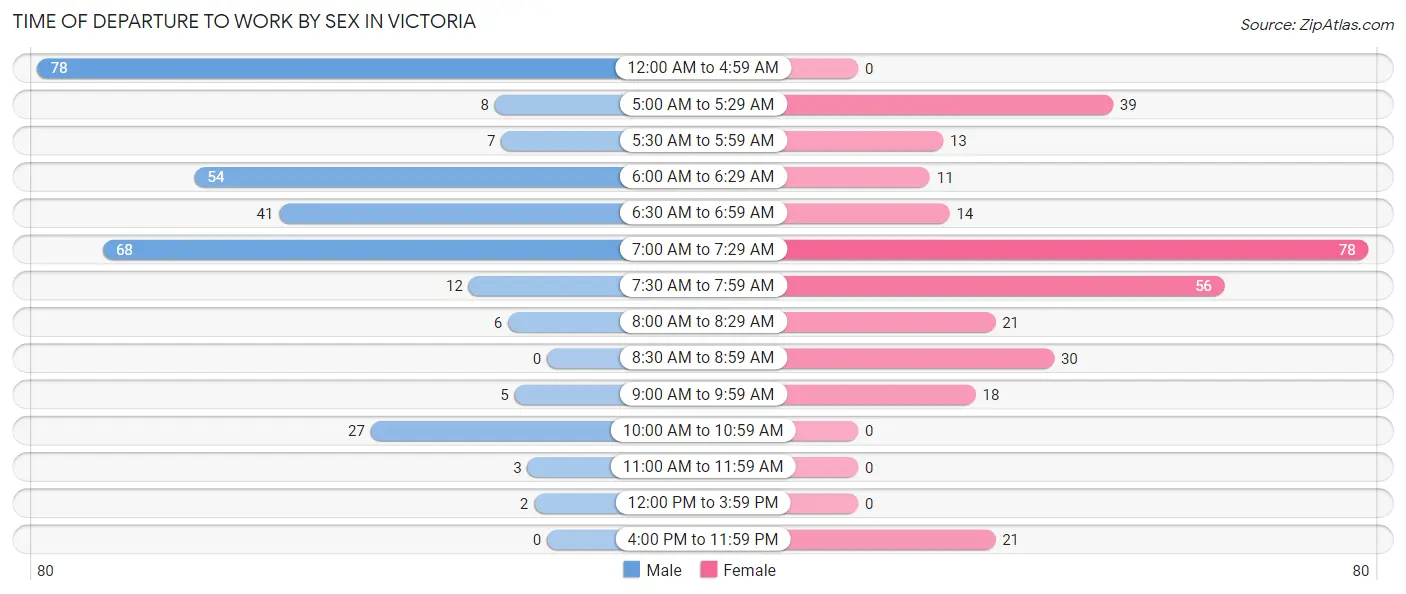
| Time of Departure | Male | Female |
| 12:00 AM to 4:59 AM | 78 (25.1%) | 0 (0.0%) |
| 5:00 AM to 5:29 AM | 8 (2.6%) | 39 (13.0%) |
| 5:30 AM to 5:59 AM | 7 (2.2%) | 13 (4.3%) |
| 6:00 AM to 6:29 AM | 54 (17.4%) | 11 (3.6%) |
| 6:30 AM to 6:59 AM | 41 (13.2%) | 14 (4.6%) |
| 7:00 AM to 7:29 AM | 68 (21.9%) | 78 (25.9%) |
| 7:30 AM to 7:59 AM | 12 (3.9%) | 56 (18.6%) |
| 8:00 AM to 8:29 AM | 6 (1.9%) | 21 (7.0%) |
| 8:30 AM to 8:59 AM | 0 (0.0%) | 30 (10.0%) |
| 9:00 AM to 9:59 AM | 5 (1.6%) | 18 (6.0%) |
| 10:00 AM to 10:59 AM | 27 (8.7%) | 0 (0.0%) |
| 11:00 AM to 11:59 AM | 3 (1.0%) | 0 (0.0%) |
| 12:00 PM to 3:59 PM | 2 (0.6%) | 0 (0.0%) |
| 4:00 PM to 11:59 PM | 0 (0.0%) | 21 (7.0%) |
| Total | 311 (100.0%) | 301 (100.0%) |
Housing Occupancy in Victoria
Occupancy by Ownership in Victoria
Of the total 810 dwellings in Victoria, owner-occupied units account for 490 (60.5%), while renter-occupied units make up 320 (39.5%).

| Occupancy | # Housing Units | % Housing Units |
| Owner Occupied Housing Units | 490 | 60.5% |
| Renter-Occupied Housing Units | 320 | 39.5% |
| Total Occupied Housing Units | 810 | 100.0% |
Occupancy by Household Size in Victoria
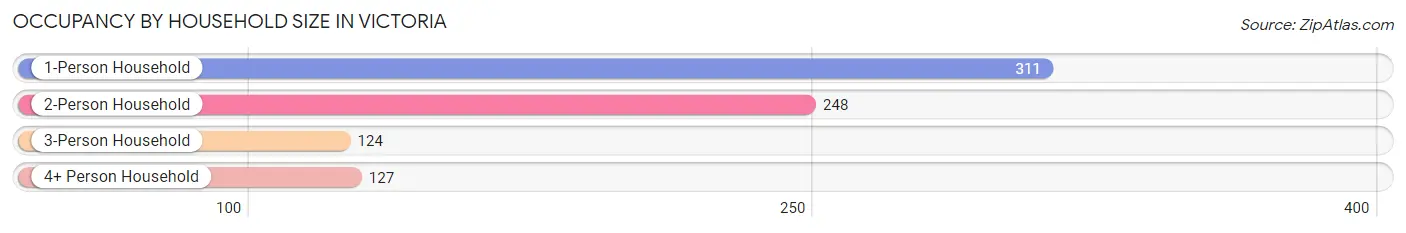
| Household Size | # Housing Units | % Housing Units |
| 1-Person Household | 311 | 38.4% |
| 2-Person Household | 248 | 30.6% |
| 3-Person Household | 124 | 15.3% |
| 4+ Person Household | 127 | 15.7% |
| Total Housing Units | 810 | 100.0% |
Occupancy by Ownership by Household Size in Victoria
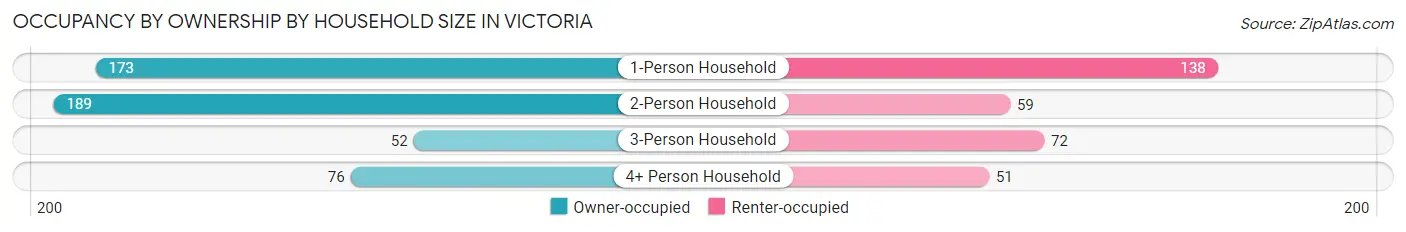
| Household Size | Owner-occupied | Renter-occupied |
| 1-Person Household | 173 (55.6%) | 138 (44.4%) |
| 2-Person Household | 189 (76.2%) | 59 (23.8%) |
| 3-Person Household | 52 (41.9%) | 72 (58.1%) |
| 4+ Person Household | 76 (59.8%) | 51 (40.2%) |
| Total Housing Units | 490 (60.5%) | 320 (39.5%) |
Occupancy by Educational Attainment in Victoria
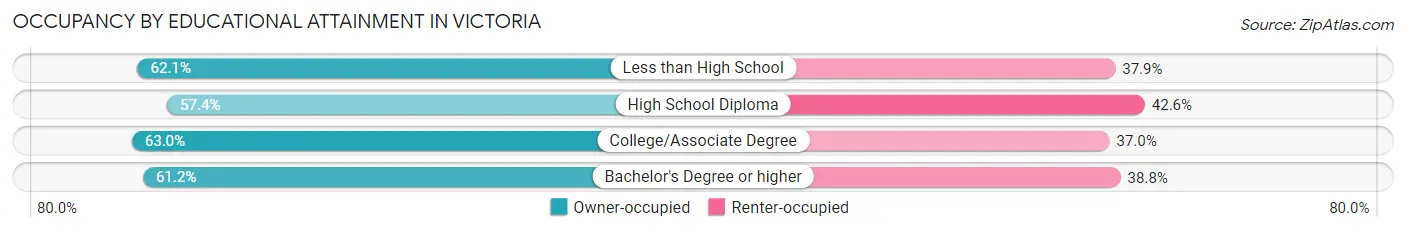
| Household Size | Owner-occupied | Renter-occupied |
| Less than High School | 90 (62.1%) | 55 (37.9%) |
| High School Diploma | 175 (57.4%) | 130 (42.6%) |
| College/Associate Degree | 165 (63.0%) | 97 (37.0%) |
| Bachelor's Degree or higher | 60 (61.2%) | 38 (38.8%) |
Occupancy by Age of Householder in Victoria
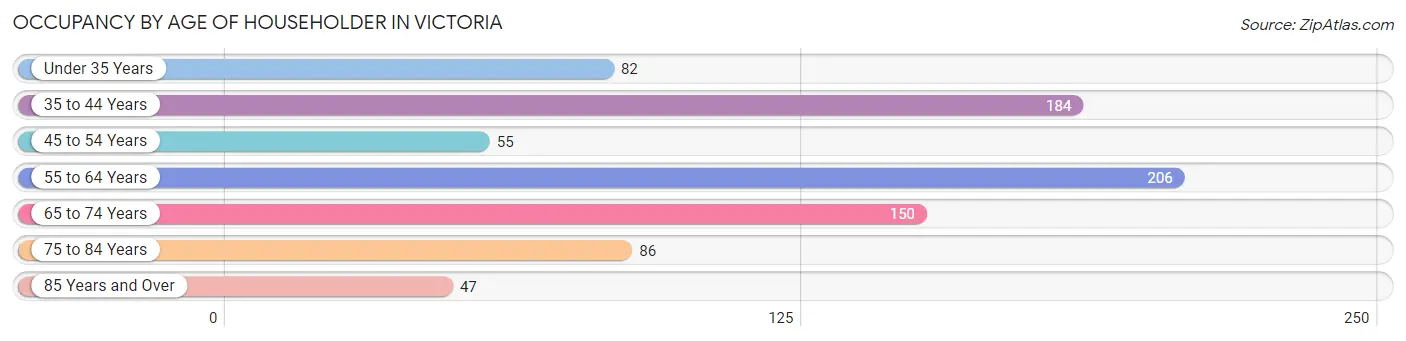
| Age Bracket | # Households | % Households |
| Under 35 Years | 82 | 10.1% |
| 35 to 44 Years | 184 | 22.7% |
| 45 to 54 Years | 55 | 6.8% |
| 55 to 64 Years | 206 | 25.4% |
| 65 to 74 Years | 150 | 18.5% |
| 75 to 84 Years | 86 | 10.6% |
| 85 Years and Over | 47 | 5.8% |
| Total | 810 | 100.0% |
Housing Finances in Victoria
Median Income by Occupancy in Victoria
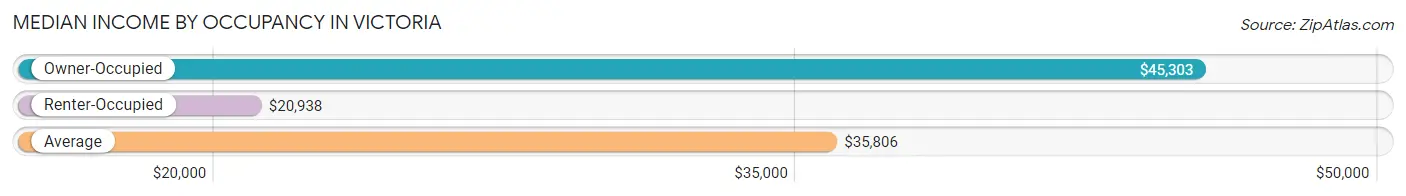
| Occupancy Type | # Households | Median Income |
| Owner-Occupied | 490 (60.5%) | $45,303 |
| Renter-Occupied | 320 (39.5%) | $20,938 |
| Average | 810 (100.0%) | $35,806 |
Occupancy by Householder Income Bracket in Victoria
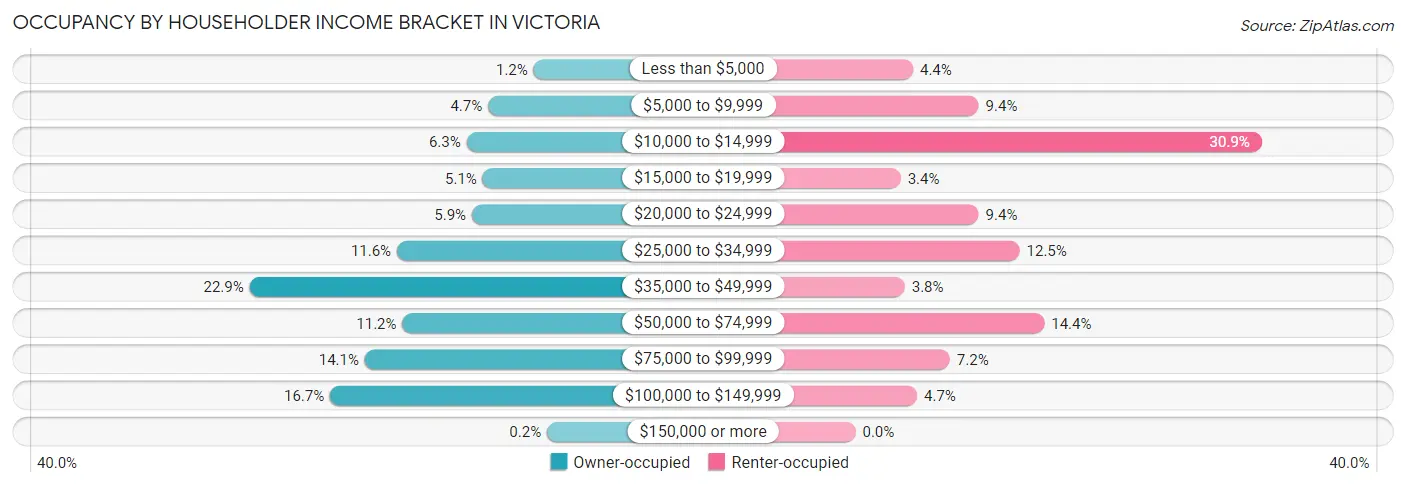
| Income Bracket | Owner-occupied | Renter-occupied |
| Less than $5,000 | 6 (1.2%) | 14 (4.4%) |
| $5,000 to $9,999 | 23 (4.7%) | 30 (9.4%) |
| $10,000 to $14,999 | 31 (6.3%) | 99 (30.9%) |
| $15,000 to $19,999 | 25 (5.1%) | 11 (3.4%) |
| $20,000 to $24,999 | 29 (5.9%) | 30 (9.4%) |
| $25,000 to $34,999 | 57 (11.6%) | 40 (12.5%) |
| $35,000 to $49,999 | 112 (22.9%) | 12 (3.7%) |
| $50,000 to $74,999 | 55 (11.2%) | 46 (14.4%) |
| $75,000 to $99,999 | 69 (14.1%) | 23 (7.2%) |
| $100,000 to $149,999 | 82 (16.7%) | 15 (4.7%) |
| $150,000 or more | 1 (0.2%) | 0 (0.0%) |
| Total | 490 (100.0%) | 320 (100.0%) |
Monthly Housing Cost Tiers in Victoria
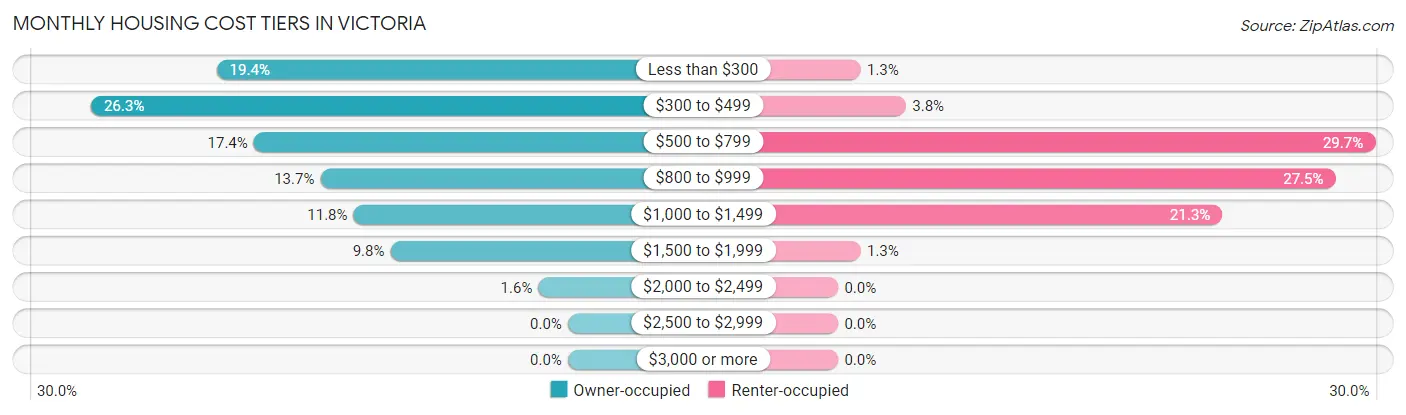
| Monthly Cost | Owner-occupied | Renter-occupied |
| Less than $300 | 95 (19.4%) | 4 (1.3%) |
| $300 to $499 | 129 (26.3%) | 12 (3.7%) |
| $500 to $799 | 85 (17.3%) | 95 (29.7%) |
| $800 to $999 | 67 (13.7%) | 88 (27.5%) |
| $1,000 to $1,499 | 58 (11.8%) | 68 (21.2%) |
| $1,500 to $1,999 | 48 (9.8%) | 4 (1.3%) |
| $2,000 to $2,499 | 8 (1.6%) | 0 (0.0%) |
| $2,500 to $2,999 | 0 (0.0%) | 0 (0.0%) |
| $3,000 or more | 0 (0.0%) | 0 (0.0%) |
| Total | 490 (100.0%) | 320 (100.0%) |
Physical Housing Characteristics in Victoria
Housing Structures in Victoria
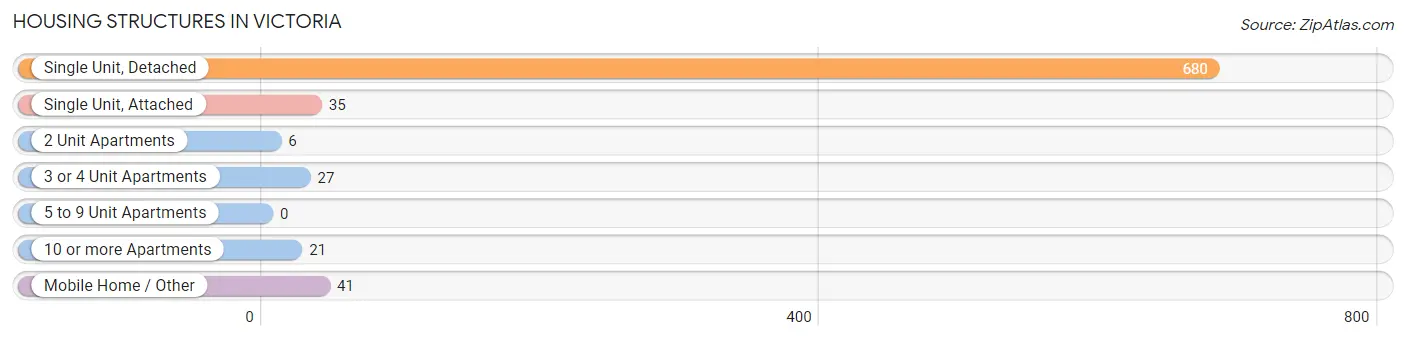
| Structure Type | # Housing Units | % Housing Units |
| Single Unit, Detached | 680 | 84.0% |
| Single Unit, Attached | 35 | 4.3% |
| 2 Unit Apartments | 6 | 0.7% |
| 3 or 4 Unit Apartments | 27 | 3.3% |
| 5 to 9 Unit Apartments | 0 | 0.0% |
| 10 or more Apartments | 21 | 2.6% |
| Mobile Home / Other | 41 | 5.1% |
| Total | 810 | 100.0% |
Housing Structures by Occupancy in Victoria
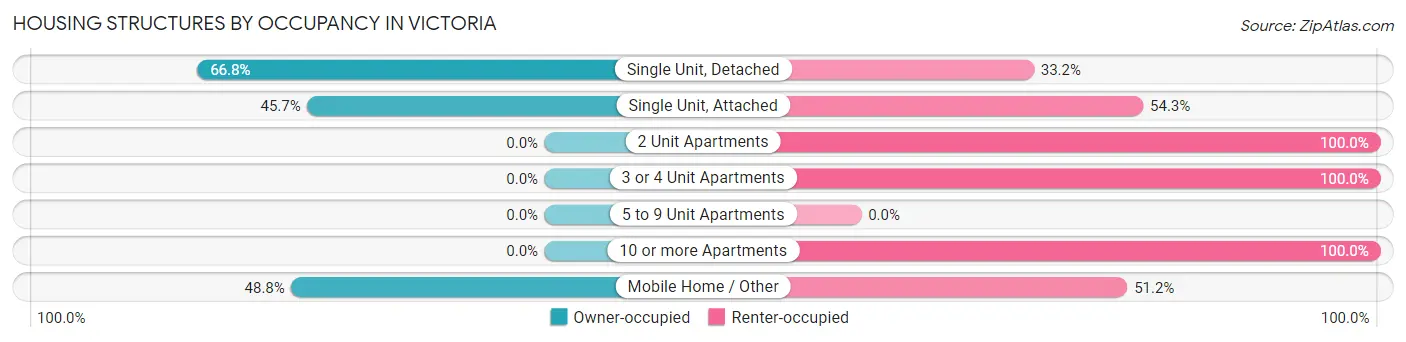
| Structure Type | Owner-occupied | Renter-occupied |
| Single Unit, Detached | 454 (66.8%) | 226 (33.2%) |
| Single Unit, Attached | 16 (45.7%) | 19 (54.3%) |
| 2 Unit Apartments | 0 (0.0%) | 6 (100.0%) |
| 3 or 4 Unit Apartments | 0 (0.0%) | 27 (100.0%) |
| 5 to 9 Unit Apartments | 0 (0.0%) | 0 (0.0%) |
| 10 or more Apartments | 0 (0.0%) | 21 (100.0%) |
| Mobile Home / Other | 20 (48.8%) | 21 (51.2%) |
| Total | 490 (60.5%) | 320 (39.5%) |
Housing Structures by Number of Rooms in Victoria
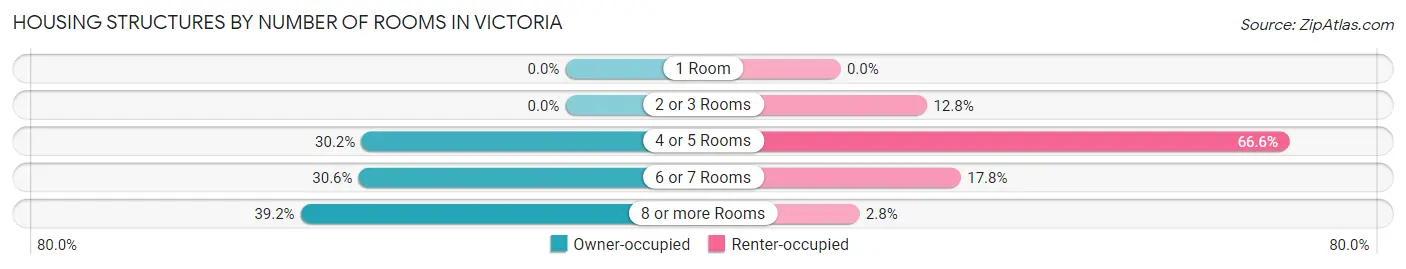
| Number of Rooms | Owner-occupied | Renter-occupied |
| 1 Room | 0 (0.0%) | 0 (0.0%) |
| 2 or 3 Rooms | 0 (0.0%) | 41 (12.8%) |
| 4 or 5 Rooms | 148 (30.2%) | 213 (66.6%) |
| 6 or 7 Rooms | 150 (30.6%) | 57 (17.8%) |
| 8 or more Rooms | 192 (39.2%) | 9 (2.8%) |
| Total | 490 (100.0%) | 320 (100.0%) |
Housing Structure by Heating Type in Victoria
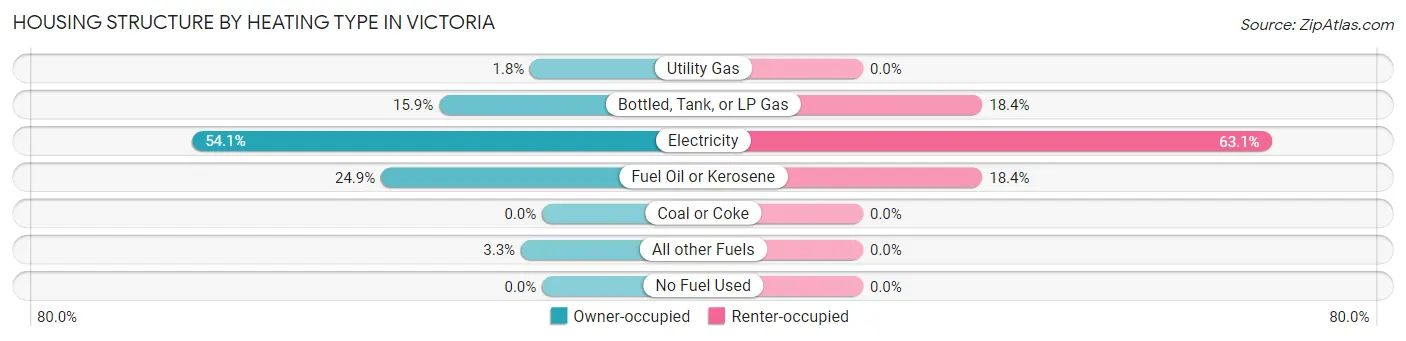
| Heating Type | Owner-occupied | Renter-occupied |
| Utility Gas | 9 (1.8%) | 0 (0.0%) |
| Bottled, Tank, or LP Gas | 78 (15.9%) | 59 (18.4%) |
| Electricity | 265 (54.1%) | 202 (63.1%) |
| Fuel Oil or Kerosene | 122 (24.9%) | 59 (18.4%) |
| Coal or Coke | 0 (0.0%) | 0 (0.0%) |
| All other Fuels | 16 (3.3%) | 0 (0.0%) |
| No Fuel Used | 0 (0.0%) | 0 (0.0%) |
| Total | 490 (100.0%) | 320 (100.0%) |
Household Vehicle Usage in Victoria
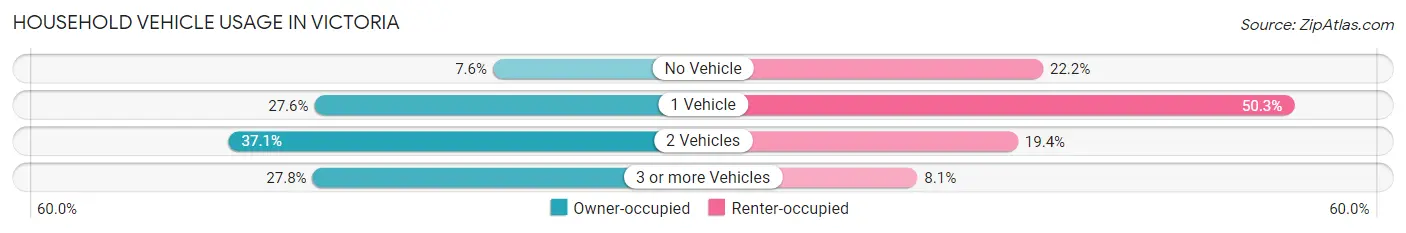
| Vehicles per Household | Owner-occupied | Renter-occupied |
| No Vehicle | 37 (7.5%) | 71 (22.2%) |
| 1 Vehicle | 135 (27.6%) | 161 (50.3%) |
| 2 Vehicles | 182 (37.1%) | 62 (19.4%) |
| 3 or more Vehicles | 136 (27.8%) | 26 (8.1%) |
| Total | 490 (100.0%) | 320 (100.0%) |
Real Estate & Mortgages in Victoria
Real Estate and Mortgage Overview in Victoria
| Characteristic | Without Mortgage | With Mortgage |
| Housing Units | 289 | 201 |
| Median Property Value | $113,800 | $147,000 |
| Median Household Income | $38,375 | $0 |
| Monthly Housing Costs | $380 | $0 |
| Real Estate Taxes | $444 | $0 |
Property Value by Mortgage Status in Victoria
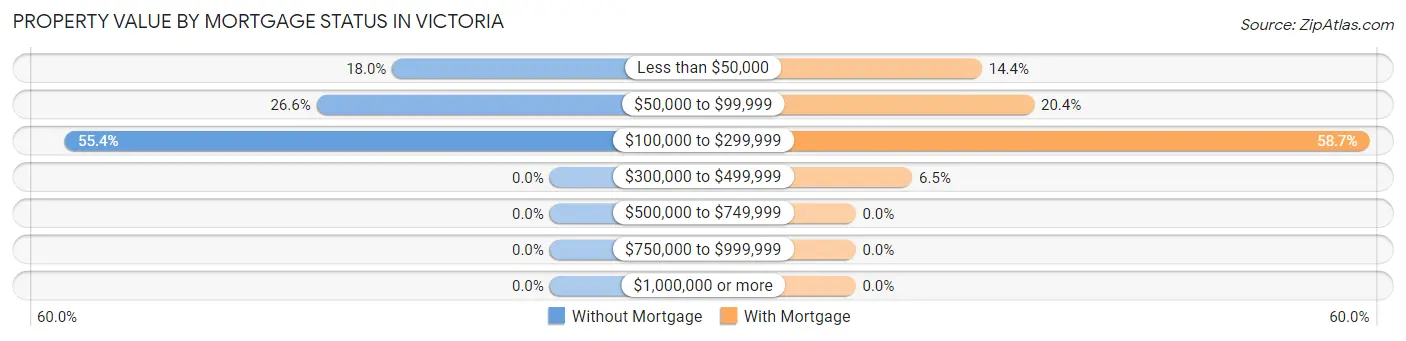
| Property Value | Without Mortgage | With Mortgage |
| Less than $50,000 | 52 (18.0%) | 29 (14.4%) |
| $50,000 to $99,999 | 77 (26.6%) | 41 (20.4%) |
| $100,000 to $299,999 | 160 (55.4%) | 118 (58.7%) |
| $300,000 to $499,999 | 0 (0.0%) | 13 (6.5%) |
| $500,000 to $749,999 | 0 (0.0%) | 0 (0.0%) |
| $750,000 to $999,999 | 0 (0.0%) | 0 (0.0%) |
| $1,000,000 or more | 0 (0.0%) | 0 (0.0%) |
| Total | 289 (100.0%) | 201 (100.0%) |
Household Income by Mortgage Status in Victoria
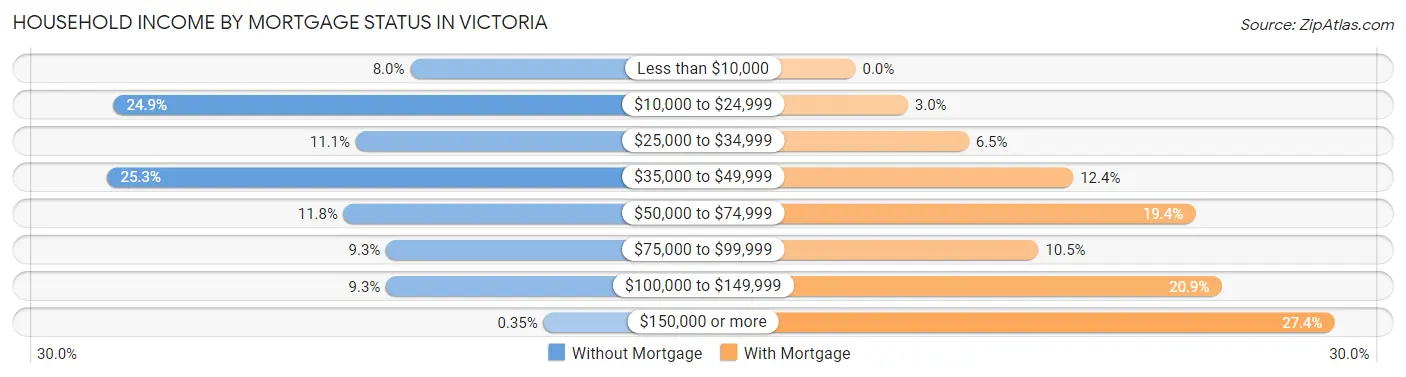
| Household Income | Without Mortgage | With Mortgage |
| Less than $10,000 | 23 (8.0%) | 0 (0.0%) |
| $10,000 to $24,999 | 72 (24.9%) | 6 (3.0%) |
| $25,000 to $34,999 | 32 (11.1%) | 13 (6.5%) |
| $35,000 to $49,999 | 73 (25.3%) | 25 (12.4%) |
| $50,000 to $74,999 | 34 (11.8%) | 39 (19.4%) |
| $75,000 to $99,999 | 27 (9.3%) | 21 (10.4%) |
| $100,000 to $149,999 | 27 (9.3%) | 42 (20.9%) |
| $150,000 or more | 1 (0.4%) | 55 (27.4%) |
| Total | 289 (100.0%) | 201 (100.0%) |
Property Value to Household Income Ratio in Victoria
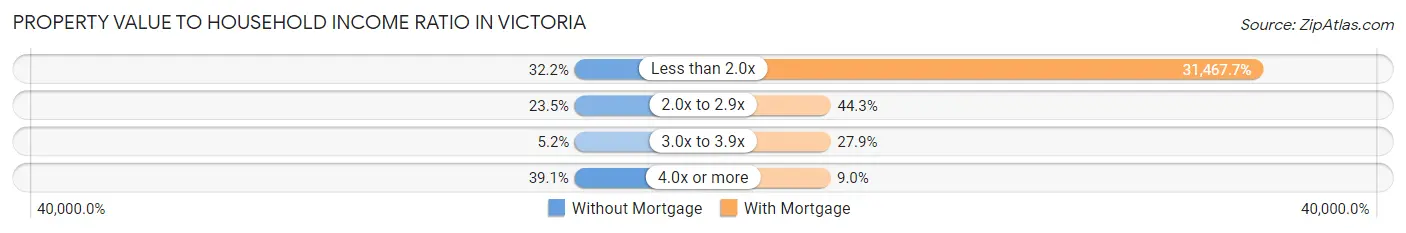
| Value-to-Income Ratio | Without Mortgage | With Mortgage |
| Less than 2.0x | 93 (32.2%) | 63,250 (31,467.7%) |
| 2.0x to 2.9x | 68 (23.5%) | 89 (44.3%) |
| 3.0x to 3.9x | 15 (5.2%) | 56 (27.9%) |
| 4.0x or more | 113 (39.1%) | 18 (9.0%) |
| Total | 289 (100.0%) | 201 (100.0%) |
Real Estate Taxes by Mortgage Status in Victoria
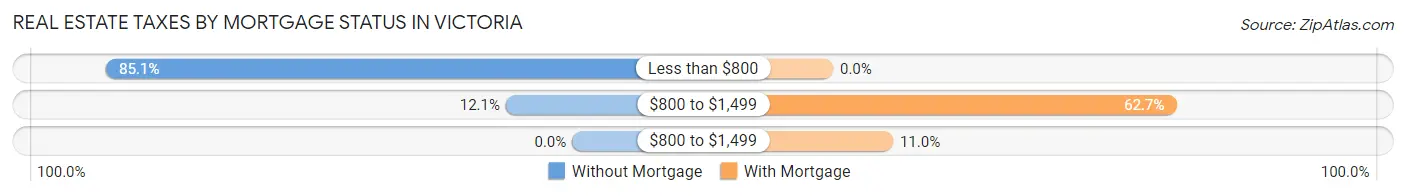
| Property Taxes | Without Mortgage | With Mortgage |
| Less than $800 | 246 (85.1%) | 0 (0.0%) |
| $800 to $1,499 | 35 (12.1%) | 126 (62.7%) |
| $800 to $1,499 | 0 (0.0%) | 22 (11.0%) |
| Total | 289 (100.0%) | 201 (100.0%) |
Health & Disability in Victoria
Health Insurance Coverage by Age in Victoria
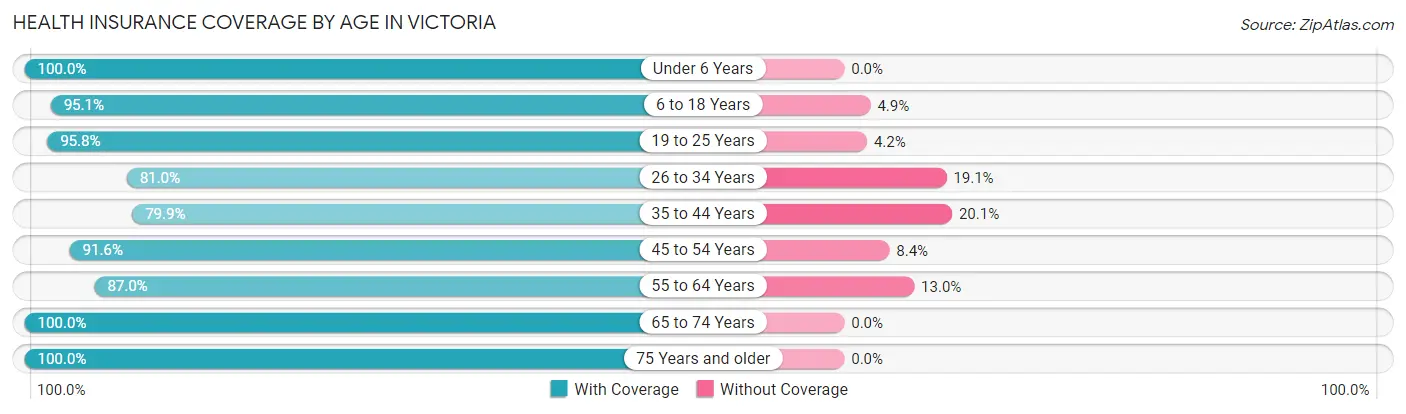
| Age Bracket | With Coverage | Without Coverage |
| Under 6 Years | 186 (100.0%) | 0 (0.0%) |
| 6 to 18 Years | 370 (95.1%) | 19 (4.9%) |
| 19 to 25 Years | 68 (95.8%) | 3 (4.2%) |
| 26 to 34 Years | 136 (80.9%) | 32 (19.1%) |
| 35 to 44 Years | 211 (79.9%) | 53 (20.1%) |
| 45 to 54 Years | 120 (91.6%) | 11 (8.4%) |
| 55 to 64 Years | 267 (87.0%) | 40 (13.0%) |
| 65 to 74 Years | 240 (100.0%) | 0 (0.0%) |
| 75 Years and older | 190 (100.0%) | 0 (0.0%) |
| Total | 1,788 (91.9%) | 158 (8.1%) |
Health Insurance Coverage by Citizenship Status in Victoria
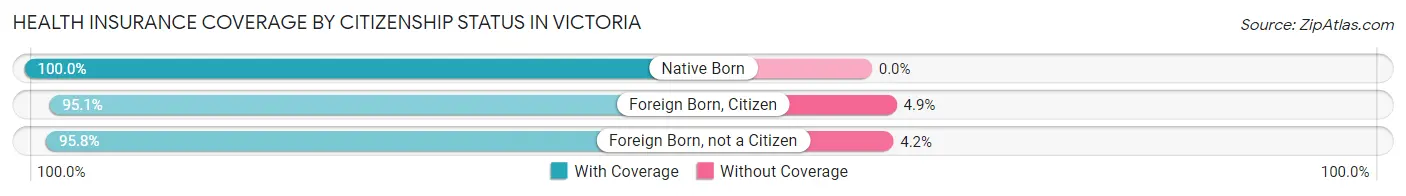
| Citizenship Status | With Coverage | Without Coverage |
| Native Born | 186 (100.0%) | 0 (0.0%) |
| Foreign Born, Citizen | 370 (95.1%) | 19 (4.9%) |
| Foreign Born, not a Citizen | 68 (95.8%) | 3 (4.2%) |
Health Insurance Coverage by Household Income in Victoria
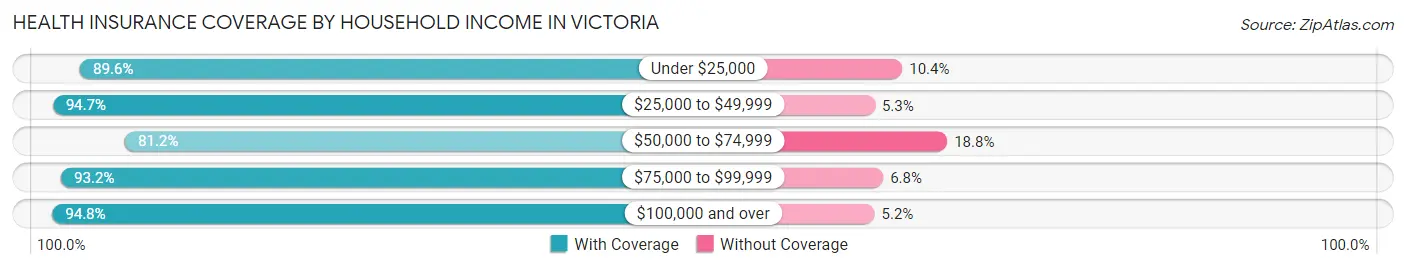
| Household Income | With Coverage | Without Coverage |
| Under $25,000 | 491 (89.6%) | 57 (10.4%) |
| $25,000 to $49,999 | 431 (94.7%) | 24 (5.3%) |
| $50,000 to $74,999 | 138 (81.2%) | 32 (18.8%) |
| $75,000 to $99,999 | 273 (93.2%) | 20 (6.8%) |
| $100,000 and over | 455 (94.8%) | 25 (5.2%) |
Public vs Private Health Insurance Coverage by Age in Victoria
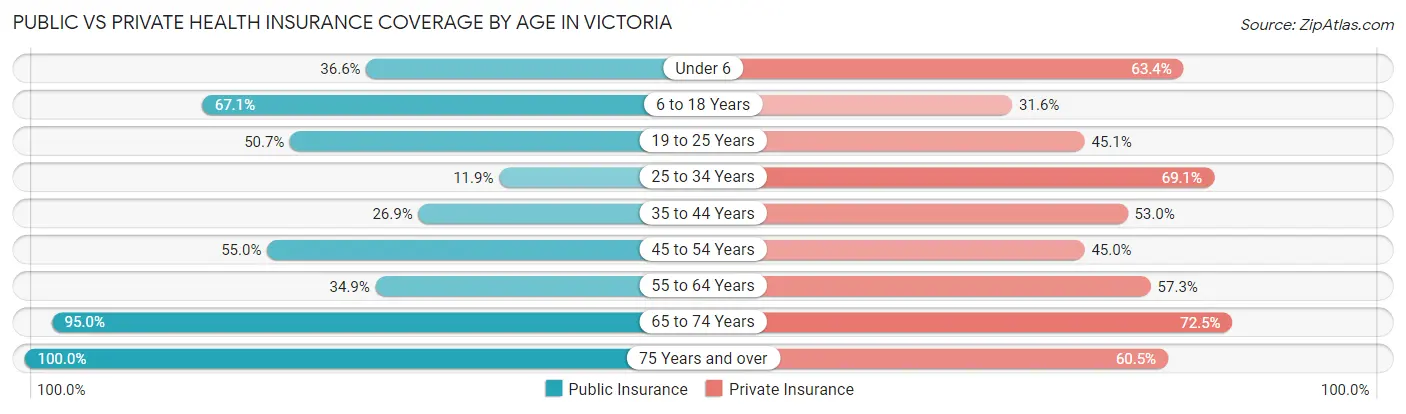
| Age Bracket | Public Insurance | Private Insurance |
| Under 6 | 68 (36.6%) | 118 (63.4%) |
| 6 to 18 Years | 261 (67.1%) | 123 (31.6%) |
| 19 to 25 Years | 36 (50.7%) | 32 (45.1%) |
| 25 to 34 Years | 20 (11.9%) | 116 (69.1%) |
| 35 to 44 Years | 71 (26.9%) | 140 (53.0%) |
| 45 to 54 Years | 72 (55.0%) | 59 (45.0%) |
| 55 to 64 Years | 107 (34.8%) | 176 (57.3%) |
| 65 to 74 Years | 228 (95.0%) | 174 (72.5%) |
| 75 Years and over | 190 (100.0%) | 115 (60.5%) |
| Total | 1,053 (54.1%) | 1,053 (54.1%) |
Disability Status by Sex by Age in Victoria
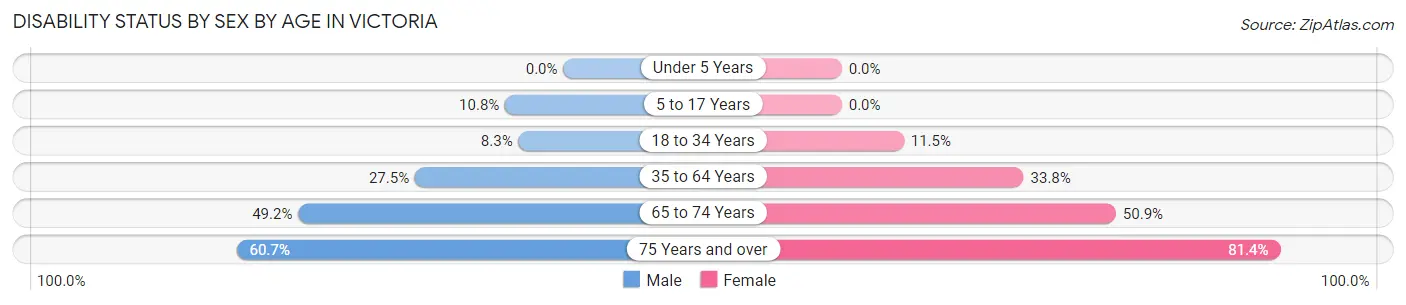
| Age Bracket | Male | Female |
| Under 5 Years | 0 (0.0%) | 0 (0.0%) |
| 5 to 17 Years | 19 (10.8%) | 0 (0.0%) |
| 18 to 34 Years | 13 (8.3%) | 13 (11.5%) |
| 35 to 64 Years | 84 (27.5%) | 134 (33.8%) |
| 65 to 74 Years | 62 (49.2%) | 58 (50.9%) |
| 75 Years and over | 37 (60.7%) | 105 (81.4%) |
Disability Class by Sex by Age in Victoria
Disability Class: Hearing Difficulty
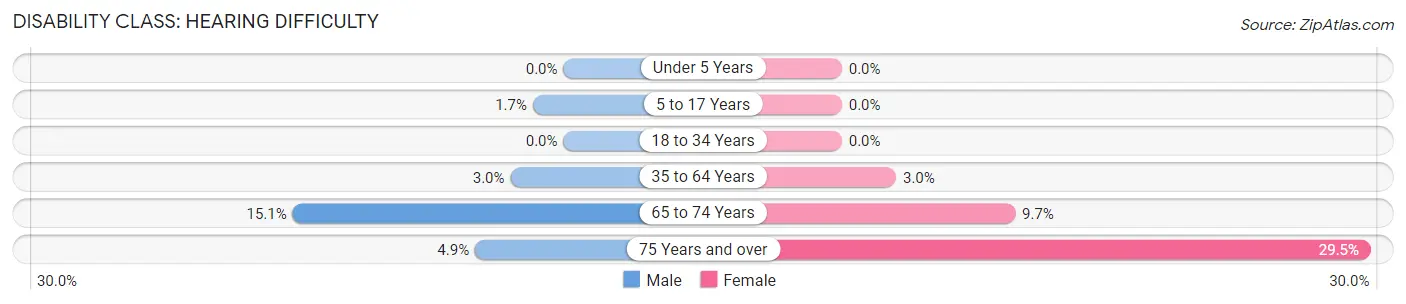
| Age Bracket | Male | Female |
| Under 5 Years | 0 (0.0%) | 0 (0.0%) |
| 5 to 17 Years | 3 (1.7%) | 0 (0.0%) |
| 18 to 34 Years | 0 (0.0%) | 0 (0.0%) |
| 35 to 64 Years | 9 (2.9%) | 12 (3.0%) |
| 65 to 74 Years | 19 (15.1%) | 11 (9.7%) |
| 75 Years and over | 3 (4.9%) | 38 (29.5%) |
Disability Class: Vision Difficulty
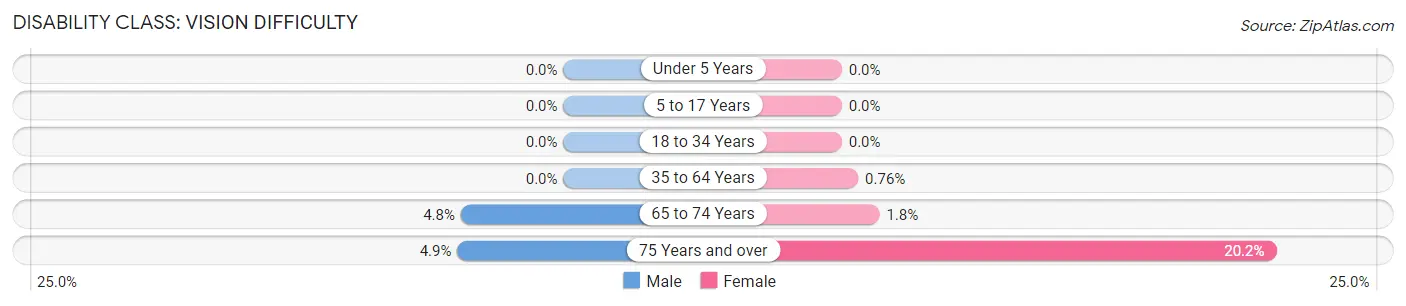
| Age Bracket | Male | Female |
| Under 5 Years | 0 (0.0%) | 0 (0.0%) |
| 5 to 17 Years | 0 (0.0%) | 0 (0.0%) |
| 18 to 34 Years | 0 (0.0%) | 0 (0.0%) |
| 35 to 64 Years | 0 (0.0%) | 3 (0.8%) |
| 65 to 74 Years | 6 (4.8%) | 2 (1.8%) |
| 75 Years and over | 3 (4.9%) | 26 (20.2%) |
Disability Class: Cognitive Difficulty
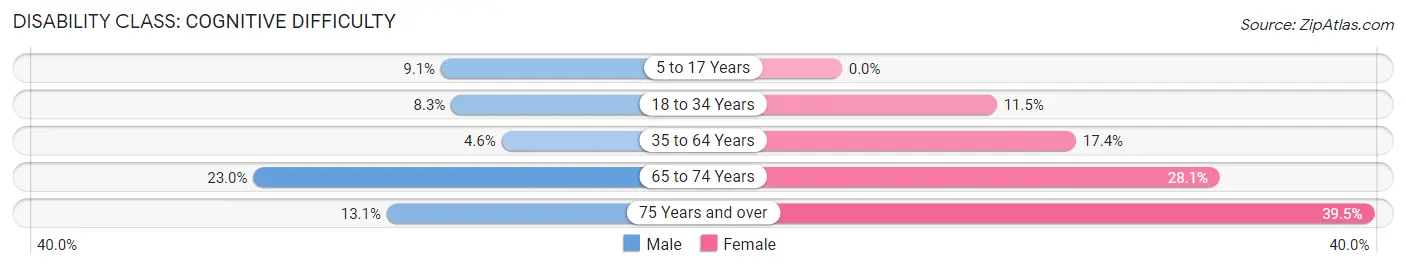
| Age Bracket | Male | Female |
| 5 to 17 Years | 16 (9.1%) | 0 (0.0%) |
| 18 to 34 Years | 13 (8.3%) | 13 (11.5%) |
| 35 to 64 Years | 14 (4.6%) | 69 (17.4%) |
| 65 to 74 Years | 29 (23.0%) | 32 (28.1%) |
| 75 Years and over | 8 (13.1%) | 51 (39.5%) |
Disability Class: Ambulatory Difficulty
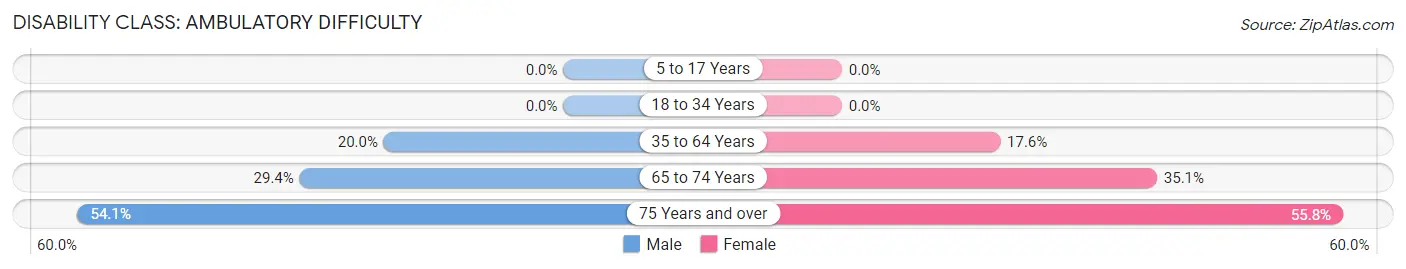
| Age Bracket | Male | Female |
| 5 to 17 Years | 0 (0.0%) | 0 (0.0%) |
| 18 to 34 Years | 0 (0.0%) | 0 (0.0%) |
| 35 to 64 Years | 61 (20.0%) | 70 (17.6%) |
| 65 to 74 Years | 37 (29.4%) | 40 (35.1%) |
| 75 Years and over | 33 (54.1%) | 72 (55.8%) |
Disability Class: Self-Care Difficulty
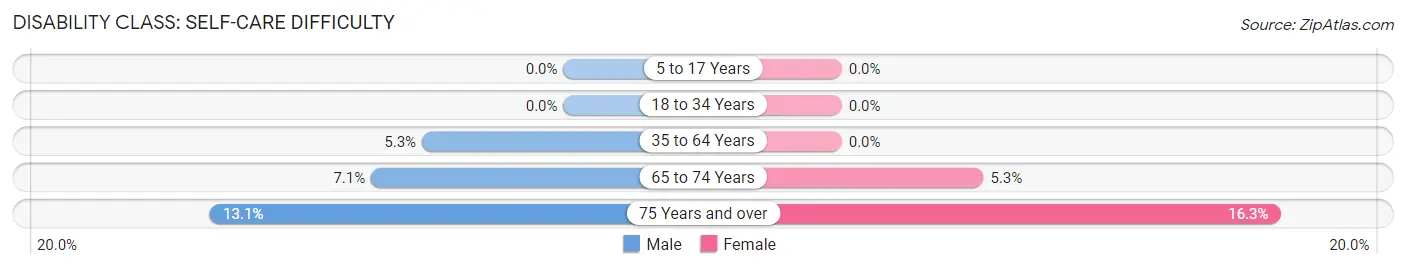
| Age Bracket | Male | Female |
| 5 to 17 Years | 0 (0.0%) | 0 (0.0%) |
| 18 to 34 Years | 0 (0.0%) | 0 (0.0%) |
| 35 to 64 Years | 16 (5.2%) | 0 (0.0%) |
| 65 to 74 Years | 9 (7.1%) | 6 (5.3%) |
| 75 Years and over | 8 (13.1%) | 21 (16.3%) |
Technology Access in Victoria
Computing Device Access in Victoria
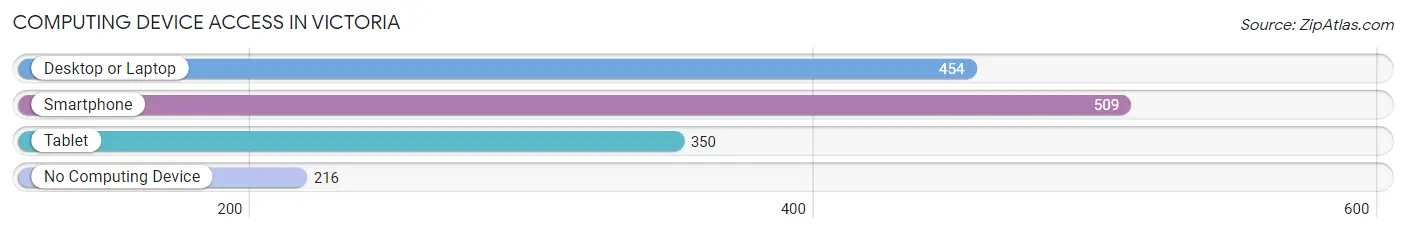
| Device Type | # Households | % Households |
| Desktop or Laptop | 454 | 56.0% |
| Smartphone | 509 | 62.8% |
| Tablet | 350 | 43.2% |
| No Computing Device | 216 | 26.7% |
| Total | 810 | 100.0% |
Internet Access in Victoria
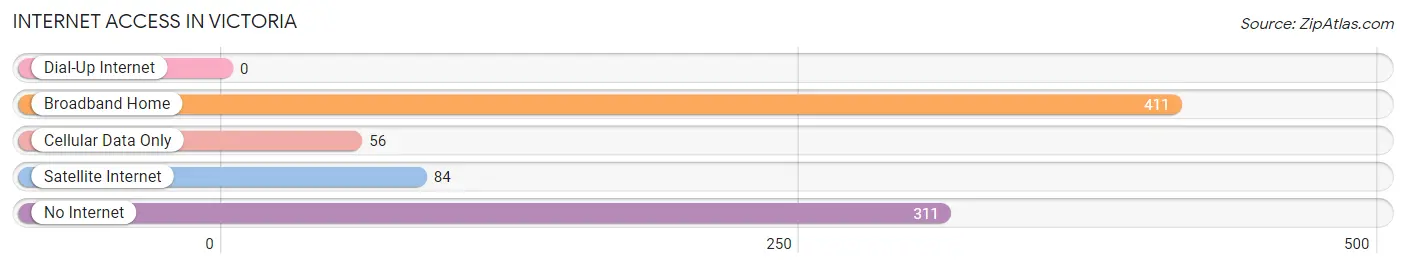
| Internet Type | # Households | % Households |
| Dial-Up Internet | 0 | 0.0% |
| Broadband Home | 411 | 50.7% |
| Cellular Data Only | 56 | 6.9% |
| Satellite Internet | 84 | 10.4% |
| No Internet | 311 | 38.4% |
| Total | 810 | 100.0% |
Victoria Summary
Victoria is a small town located in Lunenburg County, Virginia. It is situated on the banks of the Meherrin River, approximately 30 miles south of the state capital of Richmond. The town has a population of approximately 1,000 people and is part of the larger Southside Virginia region.
Geography
Victoria is located in the southeastern part of Virginia, in Lunenburg County. It is situated on the banks of the Meherrin River, approximately 30 miles south of the state capital of Richmond. The town is surrounded by rolling hills and farmland, and is located in the Piedmont region of the state. The climate in Victoria is humid subtropical, with hot, humid summers and mild winters.
Economy
Victoria’s economy is largely based on agriculture and forestry. The town is home to several farms, as well as a sawmill and a lumber company. The town also has a small retail sector, with several stores and restaurants. In addition, Victoria is home to a number of small businesses, including a printing company, a machine shop, and a welding shop.
Demographics
As of the 2010 census, the population of Victoria was 1,000 people. The racial makeup of the town was 94.2% White, 3.2% African American, 0.7% Native American, 0.2% Asian, and 1.7% from other races. The median household income in Victoria was $30,000, and the median age was 41.
History
Victoria was founded in 1790 by a group of settlers from Lunenburg County. The town was named after Queen Victoria of England, who had recently ascended to the throne. The town quickly grew, and by the mid-1800s, it was a thriving agricultural and commercial center. In the late 1800s, the town was connected to the rest of the state by the Southside Railroad, which ran through Victoria.
In the early 1900s, Victoria experienced a period of decline, as the railroad was replaced by automobiles and trucks. The town’s economy shifted to focus on agriculture and forestry, and the population began to decline. In the late 20th century, Victoria began to experience a resurgence, as new businesses and industries moved into the area. Today, Victoria is a small but vibrant town, with a strong sense of community and a commitment to preserving its history and culture.
Common Questions
What is Per Capita Income in Victoria?
Per Capita income in Victoria is $20,342.
What is the Median Family Income in Victoria?
Median Family Income in Victoria is $50,132.
What is the Median Household income in Victoria?
Median Household Income in Victoria is $35,806.
What is Income or Wage Gap in Victoria?
Income or Wage Gap in Victoria is 15.0%.
Women in Victoria earn 85.0 cents for every dollar earned by a man.
What is Inequality or Gini Index in Victoria?
Inequality or Gini Index in Victoria is 0.43.
What is the Total Population of Victoria?
Total Population of Victoria is 1,946.
What is the Total Male Population of Victoria?
Total Male Population of Victoria is 867.
What is the Total Female Population of Victoria?
Total Female Population of Victoria is 1,079.
What is the Ratio of Males per 100 Females in Victoria?
There are 80.35 Males per 100 Females in Victoria.
What is the Ratio of Females per 100 Males in Victoria?
There are 124.45 Females per 100 Males in Victoria.
What is the Median Population Age in Victoria?
Median Population Age in Victoria is 39.9 Years.
What is the Average Family Size in Victoria
Average Family Size in Victoria is 3.3 People.
What is the Average Household Size in Victoria
Average Household Size in Victoria is 2.4 People.
How Large is the Labor Force in Victoria?
There are 667 People in the Labor Forcein in Victoria.
What is the Percentage of People in the Labor Force in Victoria?
46.7% of People are in the Labor Force in Victoria.
What is the Unemployment Rate in Victoria?
Unemployment Rate in Victoria is 4.8%.