Urbanna, VA Map & Demographics
Urbanna Map
Urbanna Overview
$38,704
PER CAPITA INCOME
$58,523
AVG FAMILY INCOME
$51,607
AVG HOUSEHOLD INCOME
42.2%
WAGE / INCOME GAP [ % ]
57.8¢/ $1
WAGE / INCOME GAP [ $ ]
0.40
INEQUALITY / GINI INDEX
437
TOTAL POPULATION
252
MALE POPULATION
185
FEMALE POPULATION
136.22
MALES / 100 FEMALES
73.41
FEMALES / 100 MALES
64.3
MEDIAN AGE
2.8
AVG FAMILY SIZE
2.0
AVG HOUSEHOLD SIZE
208
LABOR FORCE [ PEOPLE ]
56.7%
PERCENT IN LABOR FORCE
Urbanna Zip Codes
Urbanna Area Codes
Income in Urbanna
Income Overview in Urbanna
Per Capita Income in Urbanna is $38,704, while median incomes of families and households are $58,523 and $51,607 respectively.
| Characteristic | Number | Measure |
| Per Capita Income | 437 | $38,704 |
| Median Family Income | 113 | $58,523 |
| Mean Family Income | 113 | $78,368 |
| Median Household Income | 209 | $51,607 |
| Mean Household Income | 209 | $76,869 |
| Income Deficit | 113 | $0 |
| Wage / Income Gap (%) | 437 | 42.22% |
| Wage / Income Gap ($) | 437 | 57.78¢ per $1 |
| Gini / Inequality Index | 437 | 0.40 |
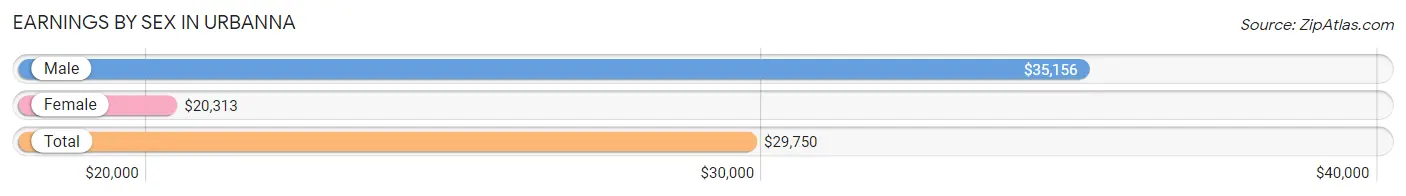
Earnings by Sex in Urbanna
Average Earnings in Urbanna are $29,750, $35,156 for men and $20,313 for women, a difference of 42.2%.
| Sex | Number | Average Earnings |
| Male | 129 (62.0%) | $35,156 |
| Female | 79 (38.0%) | $20,313 |
| Total | 208 (100.0%) | $29,750 |
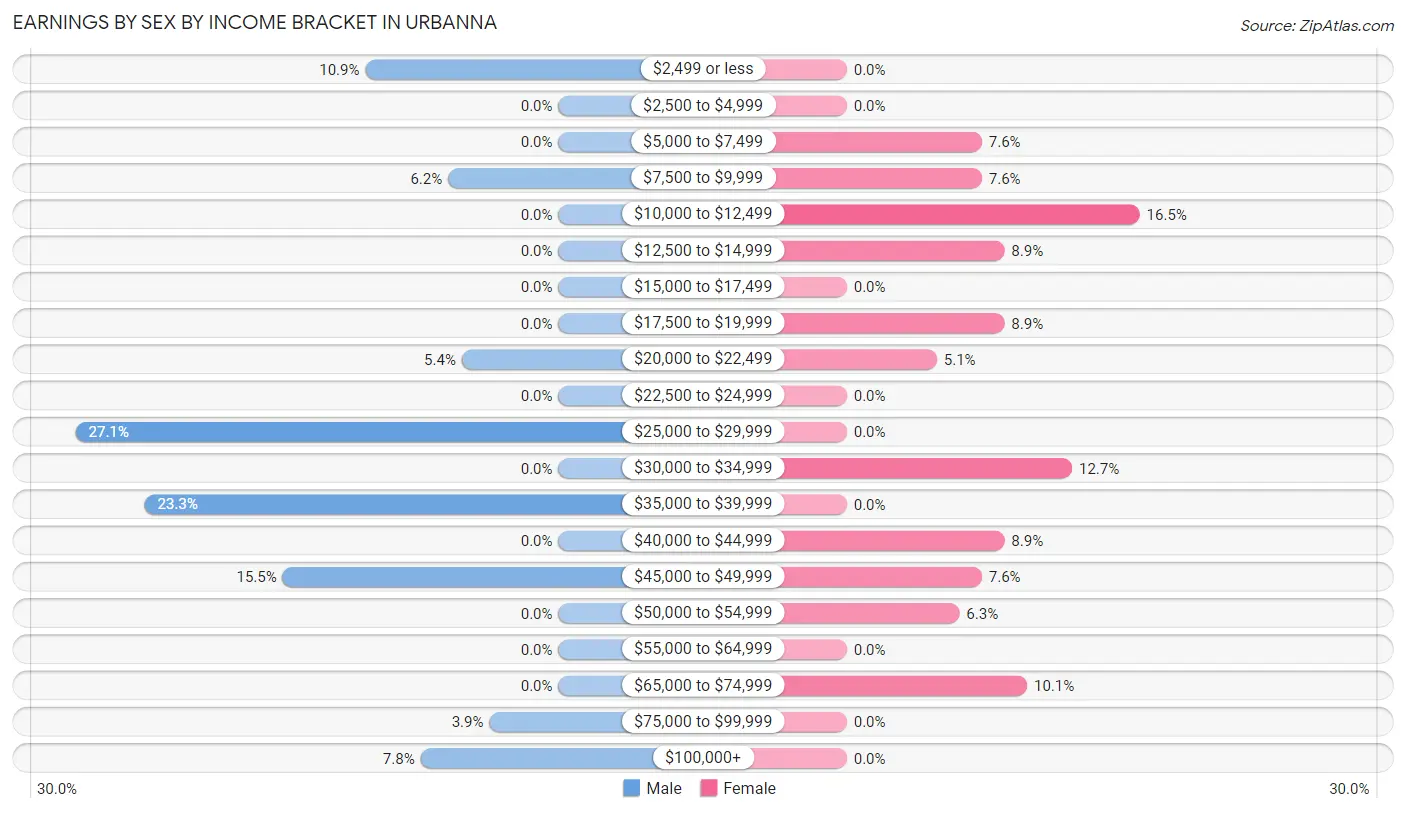
Earnings by Sex by Income Bracket in Urbanna
The most common earnings brackets in Urbanna are $25,000 to $29,999 for men (35 | 27.1%) and $10,000 to $12,499 for women (13 | 16.5%).
| Income | Male | Female |
| $2,499 or less | 14 (10.8%) | 0 (0.0%) |
| $2,500 to $4,999 | 0 (0.0%) | 0 (0.0%) |
| $5,000 to $7,499 | 0 (0.0%) | 6 (7.6%) |
| $7,500 to $9,999 | 8 (6.2%) | 6 (7.6%) |
| $10,000 to $12,499 | 0 (0.0%) | 13 (16.5%) |
| $12,500 to $14,999 | 0 (0.0%) | 7 (8.9%) |
| $15,000 to $17,499 | 0 (0.0%) | 0 (0.0%) |
| $17,500 to $19,999 | 0 (0.0%) | 7 (8.9%) |
| $20,000 to $22,499 | 7 (5.4%) | 4 (5.1%) |
| $22,500 to $24,999 | 0 (0.0%) | 0 (0.0%) |
| $25,000 to $29,999 | 35 (27.1%) | 0 (0.0%) |
| $30,000 to $34,999 | 0 (0.0%) | 10 (12.7%) |
| $35,000 to $39,999 | 30 (23.3%) | 0 (0.0%) |
| $40,000 to $44,999 | 0 (0.0%) | 7 (8.9%) |
| $45,000 to $49,999 | 20 (15.5%) | 6 (7.6%) |
| $50,000 to $54,999 | 0 (0.0%) | 5 (6.3%) |
| $55,000 to $64,999 | 0 (0.0%) | 0 (0.0%) |
| $65,000 to $74,999 | 0 (0.0%) | 8 (10.1%) |
| $75,000 to $99,999 | 5 (3.9%) | 0 (0.0%) |
| $100,000+ | 10 (7.7%) | 0 (0.0%) |
| Total | 129 (100.0%) | 79 (100.0%) |
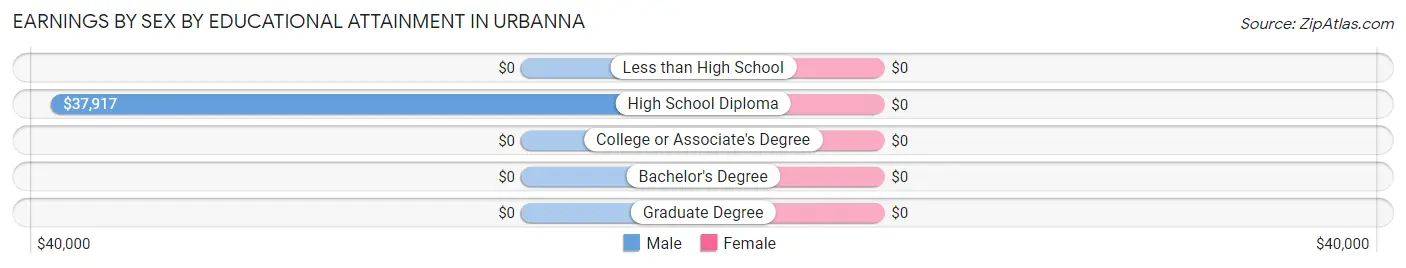
Earnings by Sex by Educational Attainment in Urbanna
| Educational Attainment | Male Income | Female Income |
| Less than High School | - | - |
| High School Diploma | $37,917 | $0 |
| College or Associate's Degree | - | - |
| Bachelor's Degree | - | - |
| Graduate Degree | - | - |
| Total | $35,156 | $20,313 |
Family Income in Urbanna
Family Income Brackets in Urbanna
According to the Urbanna family income data, there are 29 families falling into the $50,000 to $74,999 income range, which is the most common income bracket and makes up 25.7% of all families.
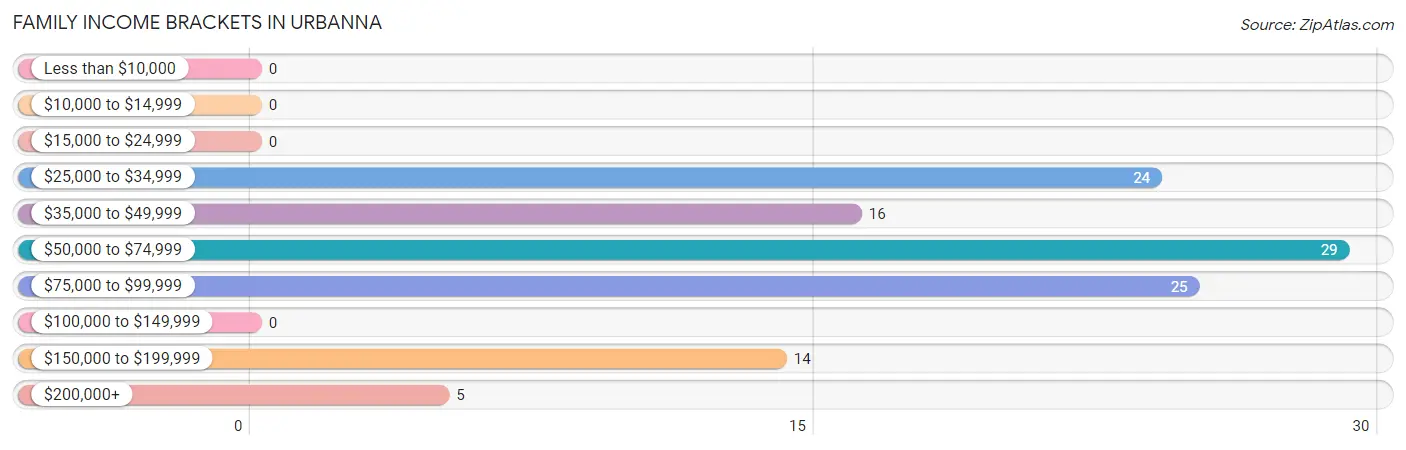
| Income Bracket | # Families | % Families |
| Less than $10,000 | 0 | 0.0% |
| $10,000 to $14,999 | 0 | 0.0% |
| $15,000 to $24,999 | 0 | 0.0% |
| $25,000 to $34,999 | 24 | 21.2% |
| $35,000 to $49,999 | 16 | 14.2% |
| $50,000 to $74,999 | 29 | 25.7% |
| $75,000 to $99,999 | 25 | 22.1% |
| $100,000 to $149,999 | 0 | 0.0% |
| $150,000 to $199,999 | 14 | 12.4% |
| $200,000+ | 5 | 4.4% |
Family Income by Famaliy Size in Urbanna
2-person families (94 | 83.2%) account for the highest median family income in Urbanna with $57,955 per family, while 2-person families (94 | 83.2%) have the highest median income of $28,978 per family member.

| Income Bracket | # Families | Median Income |
| 2-Person Families | 94 (83.2%) | $57,955 |
| 3-Person Families | 19 (16.8%) | $0 |
| 4-Person Families | 0 (0.0%) | $0 |
| 5-Person Families | 0 (0.0%) | $0 |
| 6-Person Families | 0 (0.0%) | $0 |
| 7+ Person Families | 0 (0.0%) | $0 |
| Total | 113 (100.0%) | $58,523 |
Family Income by Number of Earners in Urbanna
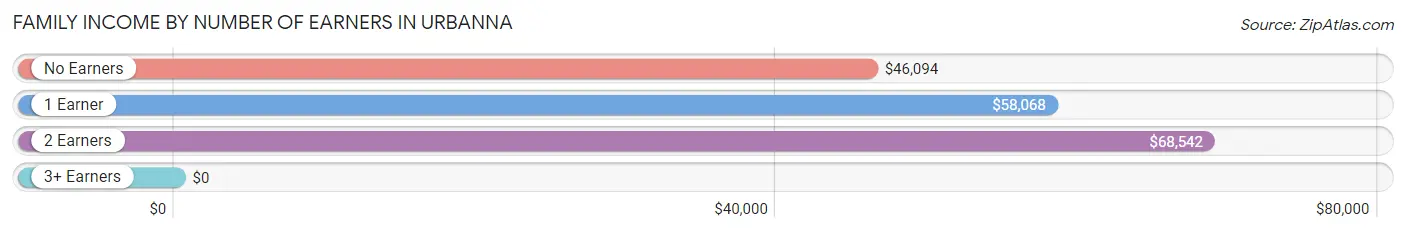
| Number of Earners | # Families | Median Income |
| No Earners | 35 (31.0%) | $46,094 |
| 1 Earner | 55 (48.7%) | $58,068 |
| 2 Earners | 15 (13.3%) | $68,542 |
| 3+ Earners | 8 (7.1%) | $0 |
| Total | 113 (100.0%) | $58,523 |
Household Income in Urbanna
Household Income Brackets in Urbanna
With 57 households falling in the category, the $25,000 to $34,999 income range is the most frequent in Urbanna, accounting for 27.3% of all households.
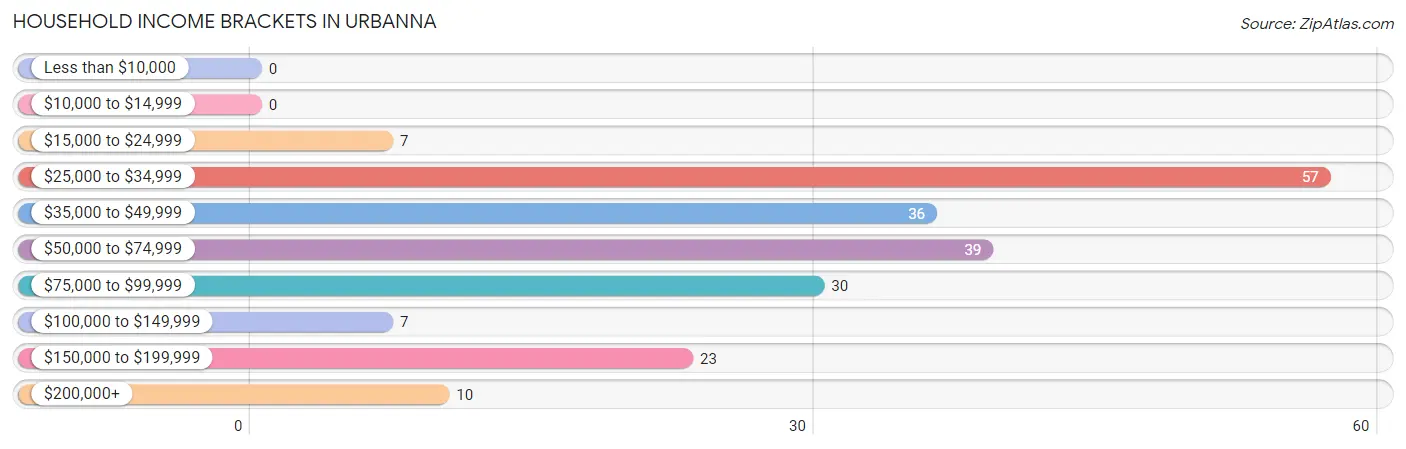
| Income Bracket | # Households | % Households |
| Less than $10,000 | 0 | 0.0% |
| $10,000 to $14,999 | 0 | 0.0% |
| $15,000 to $24,999 | 7 | 3.3% |
| $25,000 to $34,999 | 57 | 27.3% |
| $35,000 to $49,999 | 36 | 17.2% |
| $50,000 to $74,999 | 39 | 18.7% |
| $75,000 to $99,999 | 30 | 14.4% |
| $100,000 to $149,999 | 7 | 3.3% |
| $150,000 to $199,999 | 23 | 11.0% |
| $200,000+ | 10 | 4.8% |
Household Income by Householder Age in Urbanna
The median household income in Urbanna is $51,607, with the highest median household income of $59,375 found in the 45 to 64 years age bracket for the primary householder. A total of 55 households (26.3%) fall into this category.
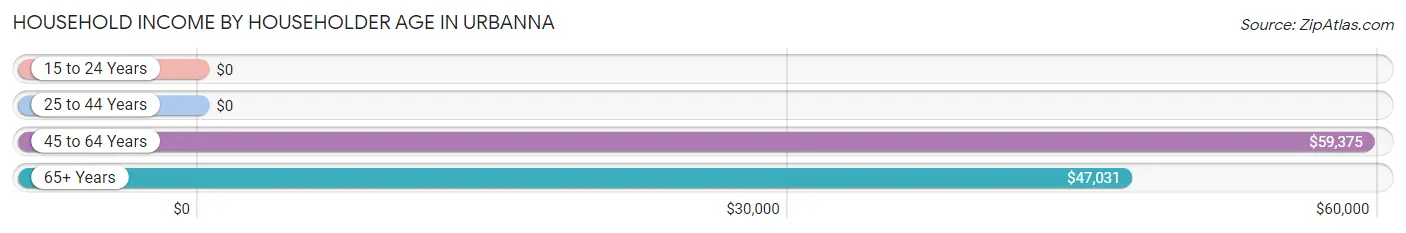
| Income Bracket | # Households | Median Income |
| 15 to 24 Years | 0 (0.0%) | $0 |
| 25 to 44 Years | 29 (13.9%) | $0 |
| 45 to 64 Years | 55 (26.3%) | $59,375 |
| 65+ Years | 125 (59.8%) | $47,031 |
| Total | 209 (100.0%) | $51,607 |
Poverty in Urbanna
Income Below Poverty by Sex and Age in Urbanna
With 3.2% poverty level for males and 8.6% for females among the residents of Urbanna, 45 to 54 year old males and 35 to 44 year old females are the most vulnerable to poverty, with 8 males (100.0%) and 6 females (31.6%) in their respective age groups living below the poverty level.
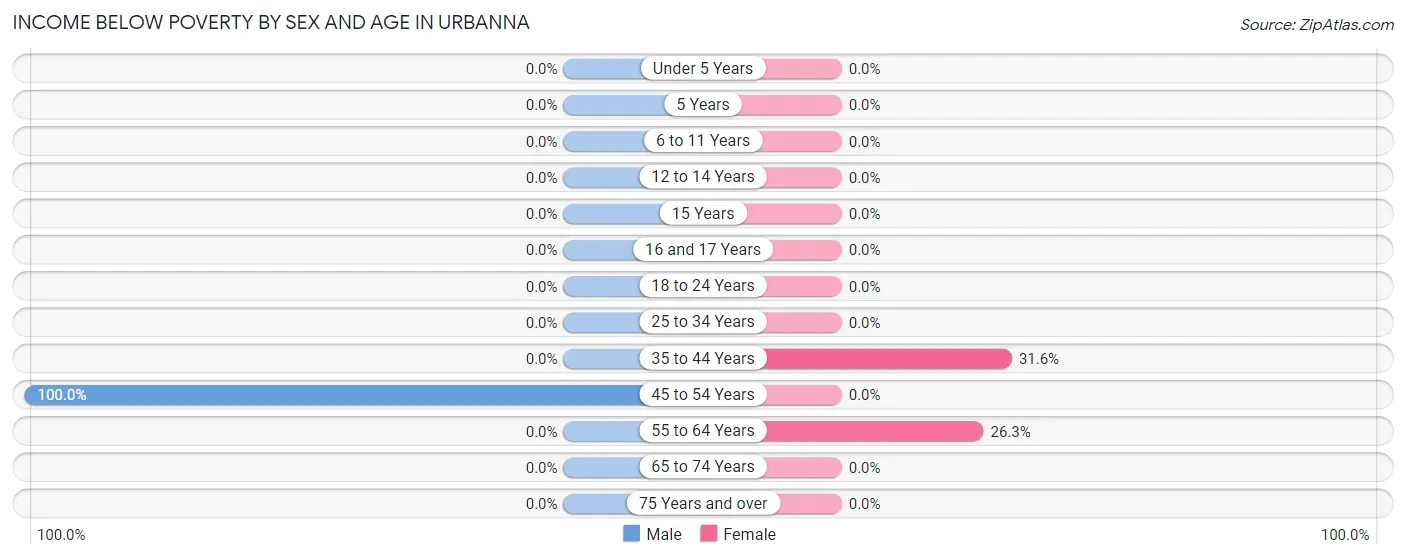
| Age Bracket | Male | Female |
| Under 5 Years | 0 (0.0%) | 0 (0.0%) |
| 5 Years | 0 (0.0%) | 0 (0.0%) |
| 6 to 11 Years | 0 (0.0%) | 0 (0.0%) |
| 12 to 14 Years | 0 (0.0%) | 0 (0.0%) |
| 15 Years | 0 (0.0%) | 0 (0.0%) |
| 16 and 17 Years | 0 (0.0%) | 0 (0.0%) |
| 18 to 24 Years | 0 (0.0%) | 0 (0.0%) |
| 25 to 34 Years | 0 (0.0%) | 0 (0.0%) |
| 35 to 44 Years | 0 (0.0%) | 6 (31.6%) |
| 45 to 54 Years | 8 (100.0%) | 0 (0.0%) |
| 55 to 64 Years | 0 (0.0%) | 10 (26.3%) |
| 65 to 74 Years | 0 (0.0%) | 0 (0.0%) |
| 75 Years and over | 0 (0.0%) | 0 (0.0%) |
| Total | 8 (3.2%) | 16 (8.6%) |
Income Above Poverty by Sex and Age in Urbanna
According to the poverty statistics in Urbanna, males aged 6 to 11 years and females aged 6 to 11 years are the age groups that are most secure financially, with 100.0% of males and 100.0% of females in these age groups living above the poverty line.
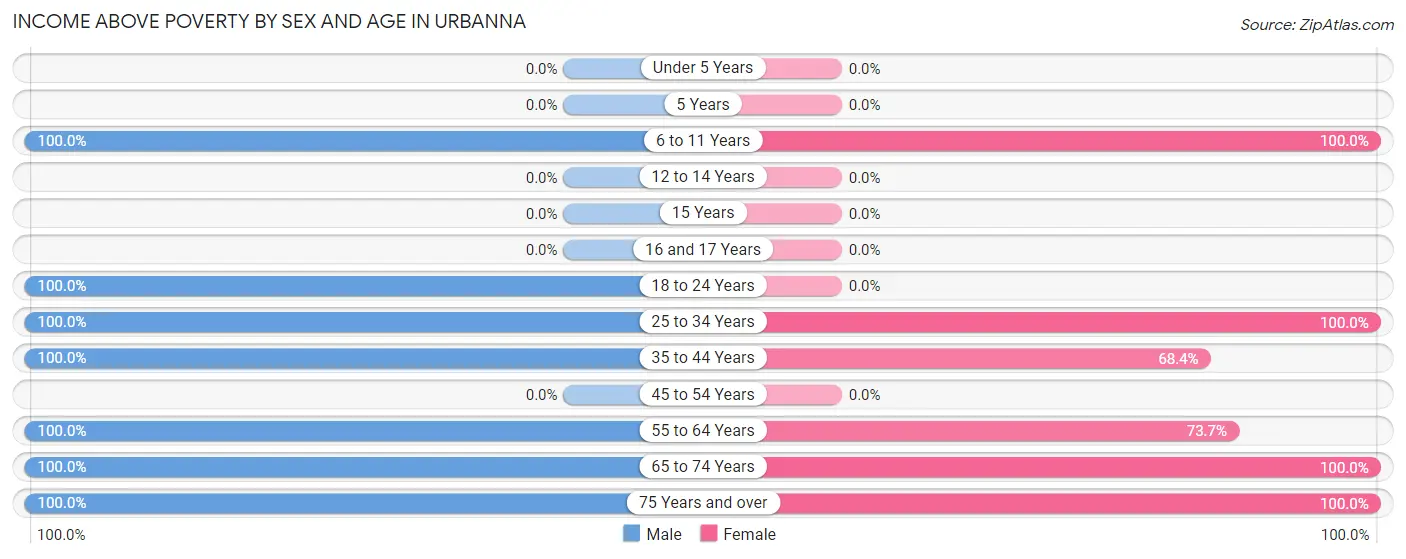
| Age Bracket | Male | Female |
| Under 5 Years | 0 (0.0%) | 0 (0.0%) |
| 5 Years | 0 (0.0%) | 0 (0.0%) |
| 6 to 11 Years | 60 (100.0%) | 10 (100.0%) |
| 12 to 14 Years | 0 (0.0%) | 0 (0.0%) |
| 15 Years | 0 (0.0%) | 0 (0.0%) |
| 16 and 17 Years | 0 (0.0%) | 0 (0.0%) |
| 18 to 24 Years | 40 (100.0%) | 0 (0.0%) |
| 25 to 34 Years | 6 (100.0%) | 10 (100.0%) |
| 35 to 44 Years | 17 (100.0%) | 13 (68.4%) |
| 45 to 54 Years | 0 (0.0%) | 0 (0.0%) |
| 55 to 64 Years | 40 (100.0%) | 28 (73.7%) |
| 65 to 74 Years | 43 (100.0%) | 74 (100.0%) |
| 75 Years and over | 38 (100.0%) | 34 (100.0%) |
| Total | 244 (96.8%) | 169 (91.3%) |
Income Below Poverty Among Married-Couple Families in Urbanna
| Children | Above Poverty | Below Poverty |
| No Children | 84 (100.0%) | 0 (0.0%) |
| 1 or 2 Children | 4 (100.0%) | 0 (0.0%) |
| 3 or 4 Children | 0 (0.0%) | 0 (0.0%) |
| 5 or more Children | 0 (0.0%) | 0 (0.0%) |
| Total | 88 (100.0%) | 0 (0.0%) |
Income Below Poverty Among Single-Parent Households in Urbanna
| Children | Single Father | Single Mother |
| No Children | 0 (0.0%) | 0 (0.0%) |
| 1 or 2 Children | 0 (0.0%) | 0 (0.0%) |
| 3 or 4 Children | 0 (0.0%) | 0 (0.0%) |
| 5 or more Children | 0 (0.0%) | 0 (0.0%) |
| Total | 0 (0.0%) | 0 (0.0%) |
Income Below Poverty Among Married-Couple vs Single-Parent Households in Urbanna
| Children | Married-Couple Families | Single-Parent Households |
| No Children | 0 (0.0%) | 0 (0.0%) |
| 1 or 2 Children | 0 (0.0%) | 0 (0.0%) |
| 3 or 4 Children | 0 (0.0%) | 0 (0.0%) |
| 5 or more Children | 0 (0.0%) | 0 (0.0%) |
| Total | 0 (0.0%) | 0 (0.0%) |
Race in Urbanna
The most populous races in Urbanna are White / Caucasian (367 | 84.0%), and Black / African American (70 | 16.0%).
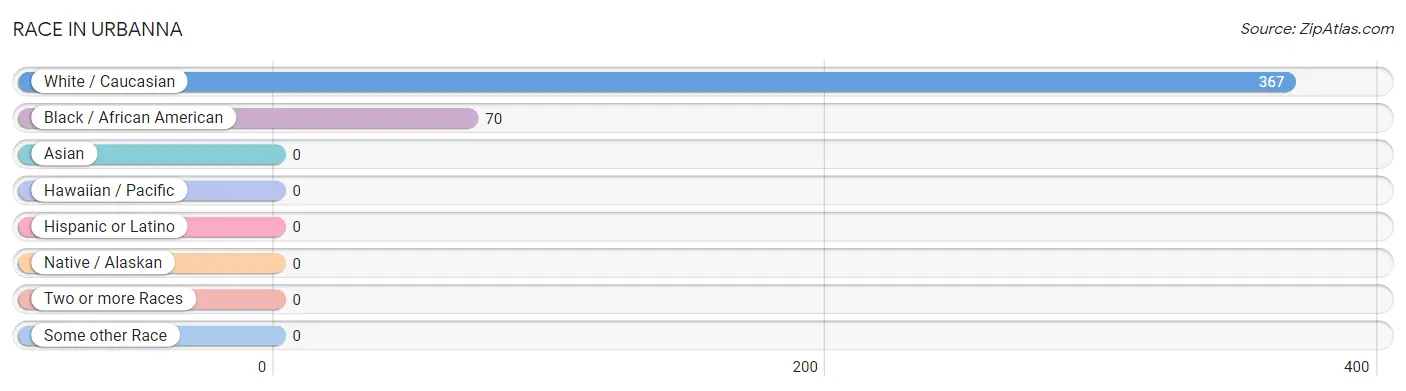
| Race | # Population | % Population |
| Asian | 0 | 0.0% |
| Black / African American | 70 | 16.0% |
| Hawaiian / Pacific | 0 | 0.0% |
| Hispanic or Latino | 0 | 0.0% |
| Native / Alaskan | 0 | 0.0% |
| White / Caucasian | 367 | 84.0% |
| Two or more Races | 0 | 0.0% |
| Some other Race | 0 | 0.0% |
| Total | 437 | 100.0% |
Ancestry in Urbanna
The most populous ancestries reported in Urbanna are American (240 | 54.9%), German (22 | 5.0%), English (21 | 4.8%), European (14 | 3.2%), and Irish (13 | 3.0%), together accounting for 70.9% of all Urbanna residents.
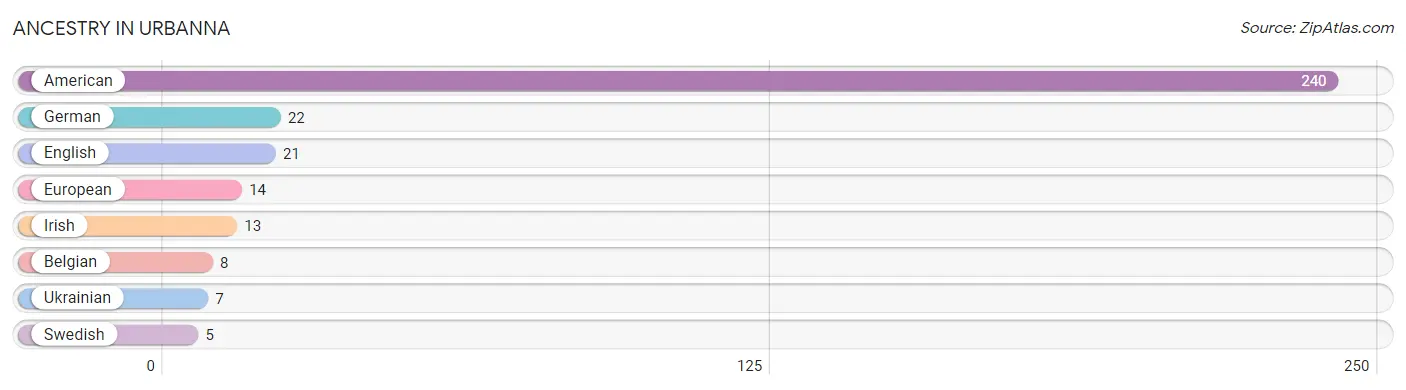
| Ancestry | # Population | % Population |
| American | 240 | 54.9% |
| Belgian | 8 | 1.8% |
| English | 21 | 4.8% |
| European | 14 | 3.2% |
| German | 22 | 5.0% |
| Irish | 13 | 3.0% |
| Swedish | 5 | 1.1% |
| Ukrainian | 7 | 1.6% | View All 8 Rows |
Immigrants in Urbanna
The most numerous immigrant groups reported in Urbanna came from Europe (15 | 3.4%), Belgium (8 | 1.8%), Western Europe (8 | 1.8%), Eastern Europe (7 | 1.6%), and Ukraine (7 | 1.6%), together accounting for 10.3% of all Urbanna residents.
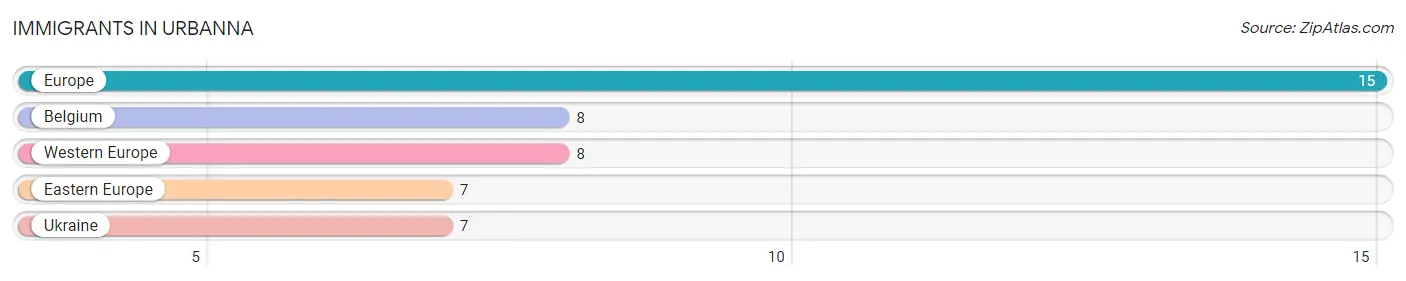
| Immigration Origin | # Population | % Population |
| Belgium | 8 | 1.8% |
| Eastern Europe | 7 | 1.6% |
| Europe | 15 | 3.4% |
| Ukraine | 7 | 1.6% |
| Western Europe | 8 | 1.8% | View All 5 Rows |
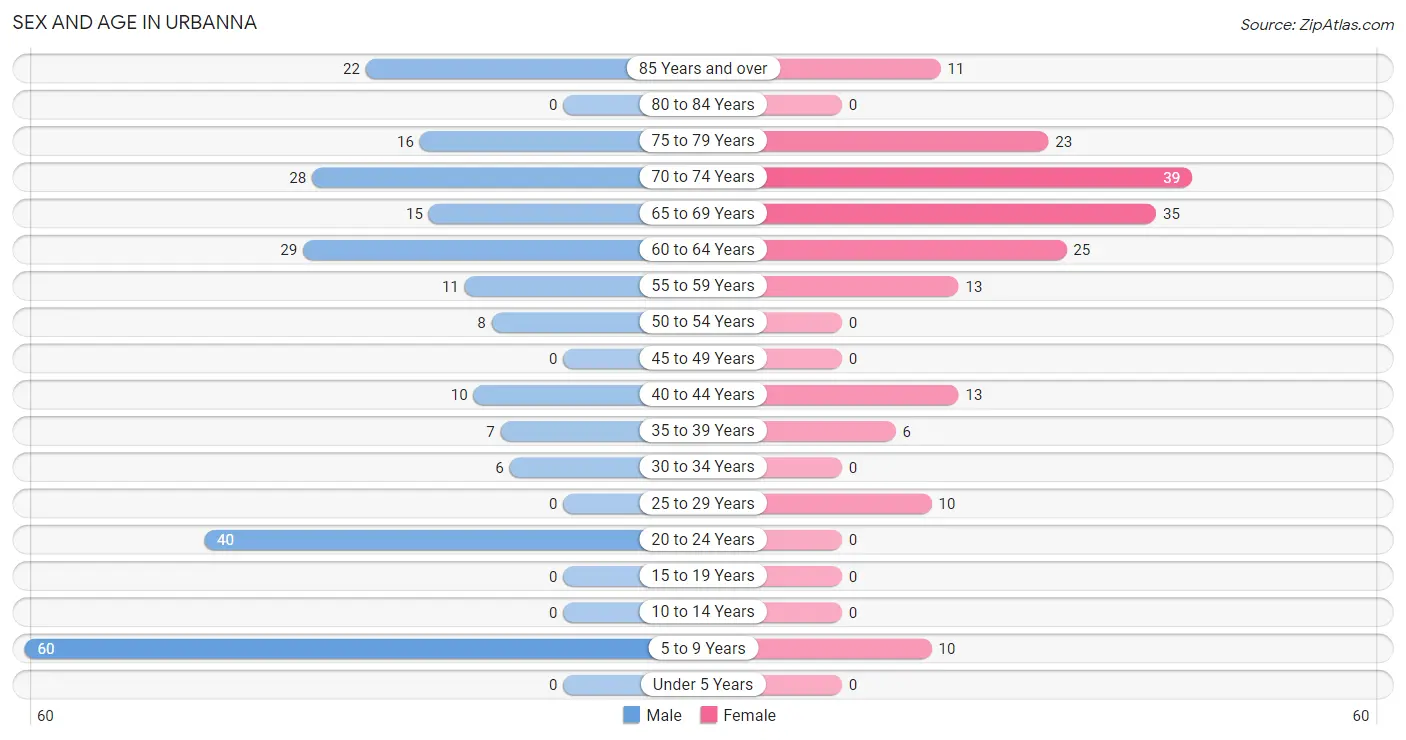
Sex and Age in Urbanna
Sex and Age in Urbanna
The most populous age groups in Urbanna are 5 to 9 Years (60 | 23.8%) for men and 70 to 74 Years (39 | 21.1%) for women.
| Age Bracket | Male | Female |
| Under 5 Years | 0 (0.0%) | 0 (0.0%) |
| 5 to 9 Years | 60 (23.8%) | 10 (5.4%) |
| 10 to 14 Years | 0 (0.0%) | 0 (0.0%) |
| 15 to 19 Years | 0 (0.0%) | 0 (0.0%) |
| 20 to 24 Years | 40 (15.9%) | 0 (0.0%) |
| 25 to 29 Years | 0 (0.0%) | 10 (5.4%) |
| 30 to 34 Years | 6 (2.4%) | 0 (0.0%) |
| 35 to 39 Years | 7 (2.8%) | 6 (3.2%) |
| 40 to 44 Years | 10 (4.0%) | 13 (7.0%) |
| 45 to 49 Years | 0 (0.0%) | 0 (0.0%) |
| 50 to 54 Years | 8 (3.2%) | 0 (0.0%) |
| 55 to 59 Years | 11 (4.4%) | 13 (7.0%) |
| 60 to 64 Years | 29 (11.5%) | 25 (13.5%) |
| 65 to 69 Years | 15 (5.9%) | 35 (18.9%) |
| 70 to 74 Years | 28 (11.1%) | 39 (21.1%) |
| 75 to 79 Years | 16 (6.4%) | 23 (12.4%) |
| 80 to 84 Years | 0 (0.0%) | 0 (0.0%) |
| 85 Years and over | 22 (8.7%) | 11 (5.9%) |
| Total | 252 (100.0%) | 185 (100.0%) |
Families and Households in Urbanna
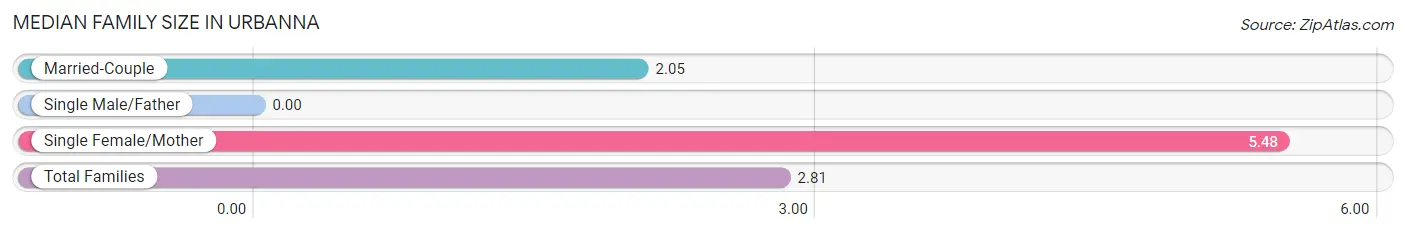
Median Family Size in Urbanna
| Family Type | # Families | Family Size |
| Married-Couple | 88 (77.9%) | 2.05 |
| Single Male/Father | 0 (0.0%) | - |
| Single Female/Mother | 25 (22.1%) | 5.48 |
| Total Families | 113 (100.0%) | 2.81 |
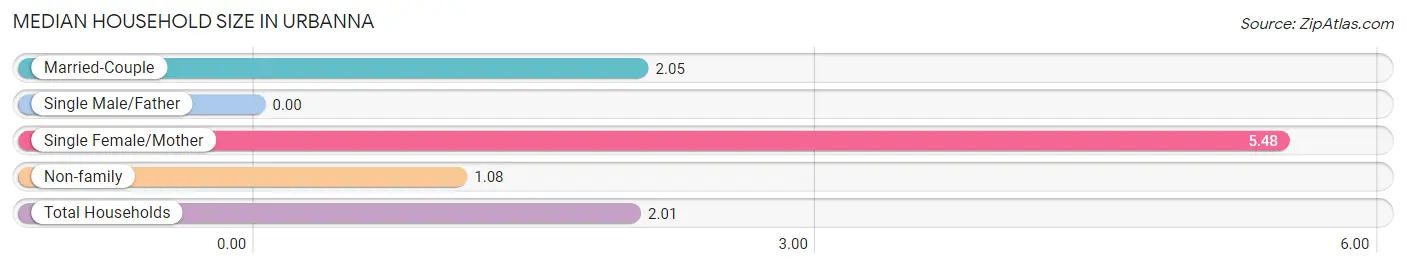
Median Household Size in Urbanna
| Household Type | # Households | Household Size |
| Married-Couple | 88 (42.1%) | 2.05 |
| Single Male/Father | 0 (0.0%) | - |
| Single Female/Mother | 25 (12.0%) | 5.48 |
| Non-family | 96 (45.9%) | 1.08 |
| Total Households | 209 (100.0%) | 2.01 |
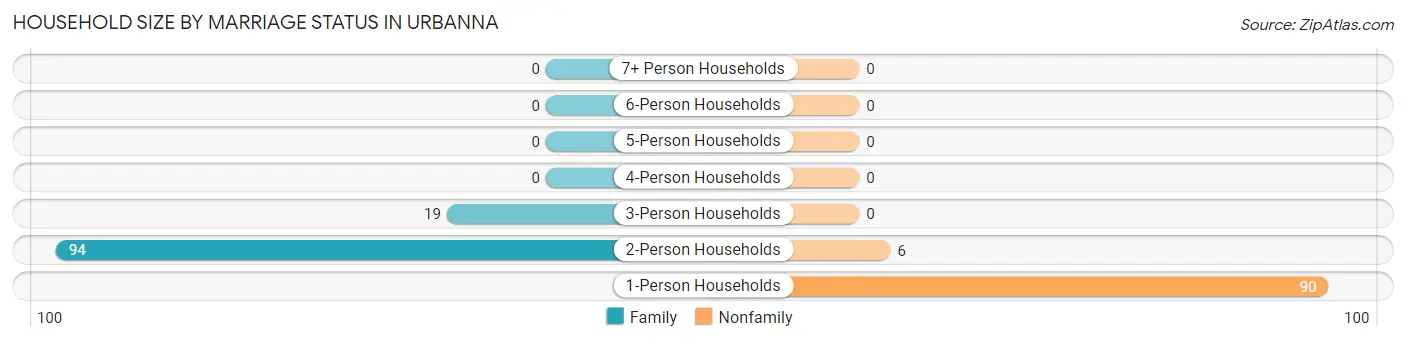
Household Size by Marriage Status in Urbanna
Out of a total of 209 households in Urbanna, 113 (54.1%) are family households, while 96 (45.9%) are nonfamily households. The most numerous type of family households are 2-person households, comprising 94, and the most common type of nonfamily households are 1-person households, comprising 90.
| Household Size | Family Households | Nonfamily Households |
| 1-Person Households | - | 90 (43.1%) |
| 2-Person Households | 94 (45.0%) | 6 (2.9%) |
| 3-Person Households | 19 (9.1%) | 0 (0.0%) |
| 4-Person Households | 0 (0.0%) | 0 (0.0%) |
| 5-Person Households | 0 (0.0%) | 0 (0.0%) |
| 6-Person Households | 0 (0.0%) | 0 (0.0%) |
| 7+ Person Households | 0 (0.0%) | 0 (0.0%) |
| Total | 113 (54.1%) | 96 (45.9%) |
Female Fertility in Urbanna
Fertility by Age in Urbanna
| Age Bracket | Women with Births | Births / 1,000 Women |
| 15 to 19 years | 0 (0.0%) | 0.0 |
| 20 to 34 years | 0 (0.0%) | 0.0 |
| 35 to 50 years | 0 (0.0%) | 0.0 |
| Total | 0 (0.0%) | 0.0 |
Fertility by Age by Marriage Status in Urbanna
| Age Bracket | Married | Unmarried |
| 15 to 19 years | 0 (0.0%) | 0 (0.0%) |
| 20 to 34 years | 0 (0.0%) | 0 (0.0%) |
| 35 to 50 years | 0 (0.0%) | 0 (0.0%) |
| Total | 0 (0.0%) | 0 (0.0%) |
Fertility by Education in Urbanna
| Educational Attainment | Women with Births | Births / 1,000 Women |
| Less than High School | 0 (0.0%) | 0.0 |
| High School Diploma | 0 (0.0%) | 0.0 |
| College or Associate's Degree | 0 (0.0%) | 0.0 |
| Bachelor's Degree | 0 (0.0%) | 0.0 |
| Graduate Degree | 0 (0.0%) | 0.0 |
| Total | 0 (0.0%) | 0.0 |
Fertility by Education by Marriage Status in Urbanna
| Educational Attainment | Married | Unmarried |
| Less than High School | 0 (0.0%) | 0 (0.0%) |
| High School Diploma | 0 (0.0%) | 0 (0.0%) |
| College or Associate's Degree | 0 (0.0%) | 0 (0.0%) |
| Bachelor's Degree | 0 (0.0%) | 0 (0.0%) |
| Graduate Degree | 0 (0.0%) | 0 (0.0%) |
| Total | 0 (0.0%) | 0 (0.0%) |
Employment Characteristics in Urbanna
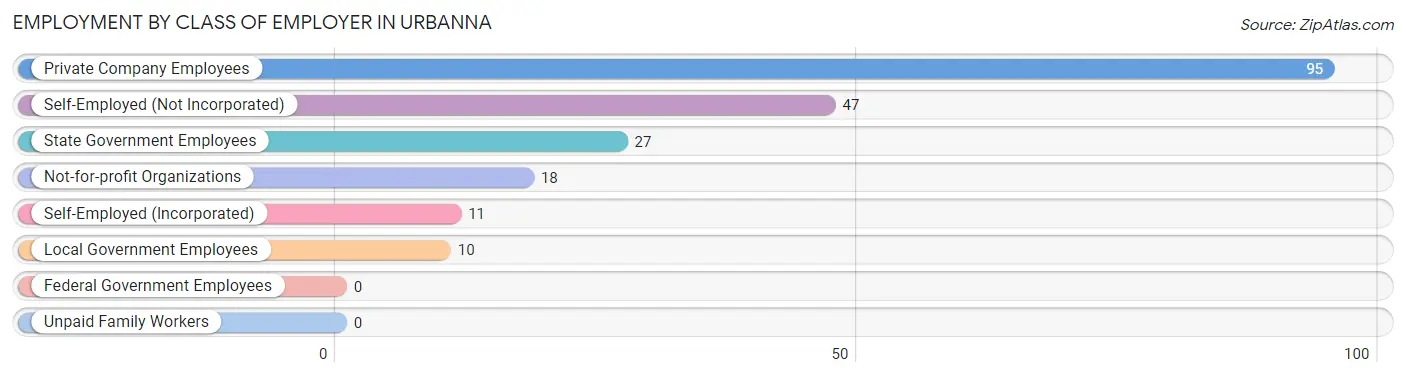
Employment by Class of Employer in Urbanna
Among the 208 employed individuals in Urbanna, private company employees (95 | 45.7%), self-employed (not incorporated) (47 | 22.6%), and state government employees (27 | 13.0%) make up the most common classes of employment.
| Employer Class | # Employees | % Employees |
| Private Company Employees | 95 | 45.7% |
| Self-Employed (Incorporated) | 11 | 5.3% |
| Self-Employed (Not Incorporated) | 47 | 22.6% |
| Not-for-profit Organizations | 18 | 8.6% |
| Local Government Employees | 10 | 4.8% |
| State Government Employees | 27 | 13.0% |
| Federal Government Employees | 0 | 0.0% |
| Unpaid Family Workers | 0 | 0.0% |
| Total | 208 | 100.0% |
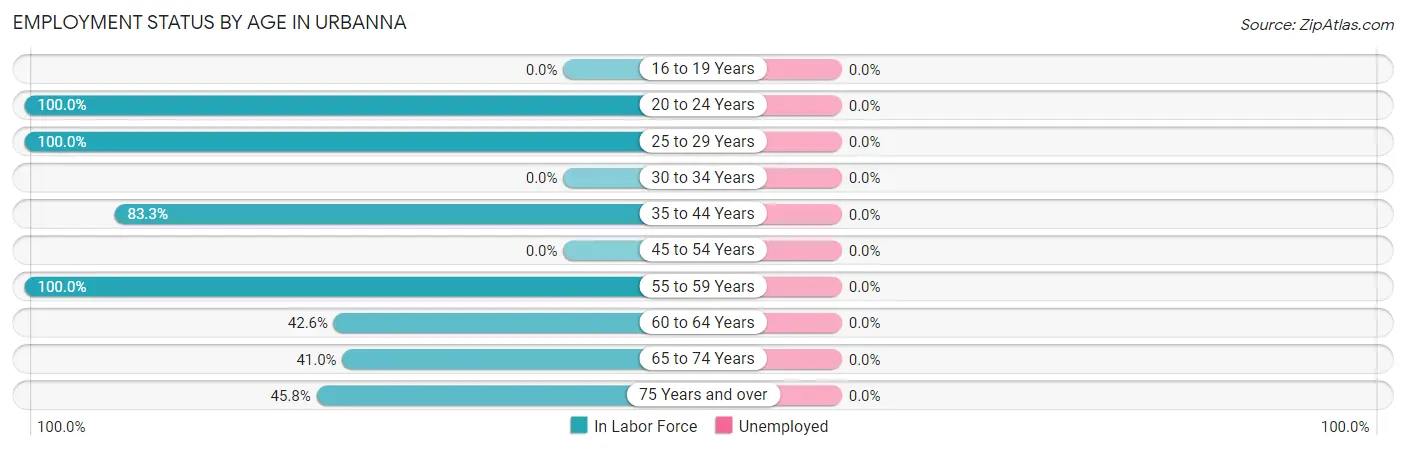
Employment Status by Age in Urbanna
| Age Bracket | In Labor Force | Unemployed |
| 16 to 19 Years | 0 (0.0%) | 0 (0.0%) |
| 20 to 24 Years | 40 (100.0%) | 0 (0.0%) |
| 25 to 29 Years | 10 (100.0%) | 0 (0.0%) |
| 30 to 34 Years | 0 (0.0%) | 0 (0.0%) |
| 35 to 44 Years | 30 (83.3%) | 0 (0.0%) |
| 45 to 54 Years | 0 (0.0%) | 0 (0.0%) |
| 55 to 59 Years | 24 (100.0%) | 0 (0.0%) |
| 60 to 64 Years | 23 (42.6%) | 0 (0.0%) |
| 65 to 74 Years | 48 (41.0%) | 0 (0.0%) |
| 75 Years and over | 33 (45.8%) | 0 (0.0%) |
| Total | 208 (56.7%) | 0 (0.0%) |
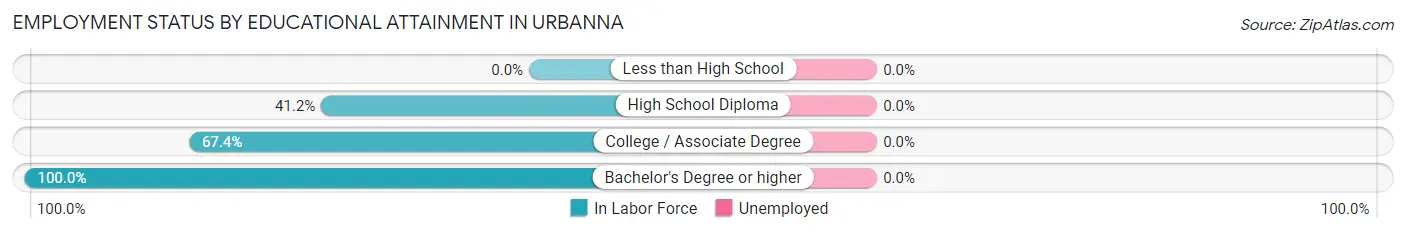
Employment Status by Educational Attainment in Urbanna
| Educational Attainment | In Labor Force | Unemployed |
| Less than High School | 0 (0.0%) | 0 (0.0%) |
| High School Diploma | 21 (41.2%) | 0 (0.0%) |
| College / Associate Degree | 31 (67.4%) | 0 (0.0%) |
| Bachelor's Degree or higher | 35 (100.0%) | 0 (0.0%) |
| Total | 87 (63.0%) | 0 (0.0%) |
Employment Occupations by Sex in Urbanna
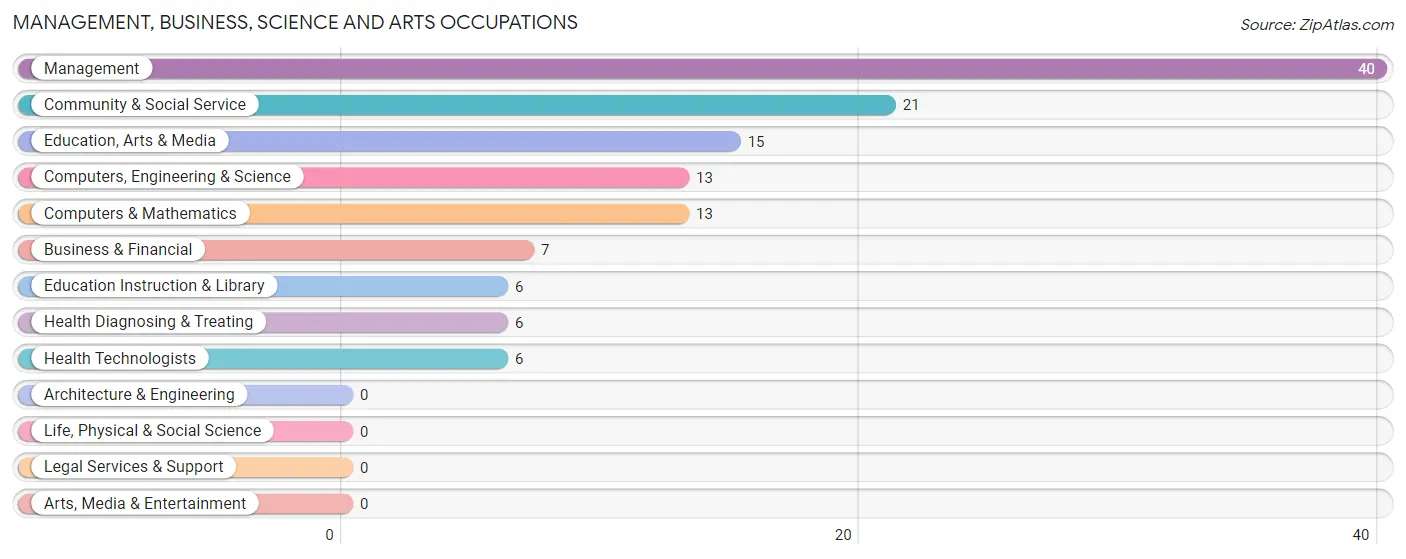
Management, Business, Science and Arts Occupations
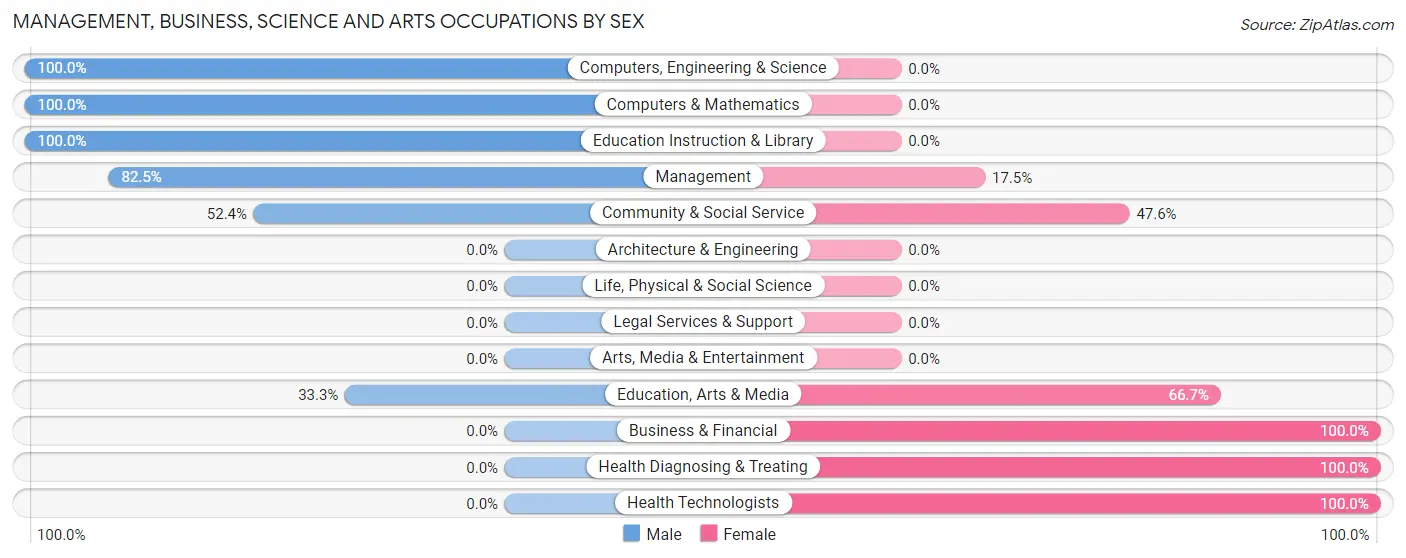
The most common Management, Business, Science and Arts occupations in Urbanna are Management (40 | 19.2%), Community & Social Service (21 | 10.1%), Education, Arts & Media (15 | 7.2%), Computers, Engineering & Science (13 | 6.2%), and Computers & Mathematics (13 | 6.2%).
Management, Business, Science and Arts Occupations by Sex
Within the Management, Business, Science and Arts occupations in Urbanna, the most male-oriented occupations are Computers, Engineering & Science (100.0%), Computers & Mathematics (100.0%), and Education Instruction & Library (100.0%), while the most female-oriented occupations are Business & Financial (100.0%), Health Diagnosing & Treating (100.0%), and Health Technologists (100.0%).
| Occupation | Male | Female |
| Management | 33 (82.5%) | 7 (17.5%) |
| Business & Financial | 0 (0.0%) | 7 (100.0%) |
| Computers, Engineering & Science | 13 (100.0%) | 0 (0.0%) |
| Computers & Mathematics | 13 (100.0%) | 0 (0.0%) |
| Architecture & Engineering | 0 (0.0%) | 0 (0.0%) |
| Life, Physical & Social Science | 0 (0.0%) | 0 (0.0%) |
| Community & Social Service | 11 (52.4%) | 10 (47.6%) |
| Education, Arts & Media | 5 (33.3%) | 10 (66.7%) |
| Legal Services & Support | 0 (0.0%) | 0 (0.0%) |
| Education Instruction & Library | 6 (100.0%) | 0 (0.0%) |
| Arts, Media & Entertainment | 0 (0.0%) | 0 (0.0%) |
| Health Diagnosing & Treating | 0 (0.0%) | 6 (100.0%) |
| Health Technologists | 0 (0.0%) | 6 (100.0%) |
| Total (Category) | 57 (65.5%) | 30 (34.5%) |
| Total (Overall) | 129 (62.0%) | 79 (38.0%) |
Services Occupations
The most common Services occupations in Urbanna are Security & Protection (20 | 9.6%), Law Enforcement (20 | 9.6%), Food Preparation & Serving (19 | 9.1%), and Cleaning & Maintenance (4 | 1.9%).
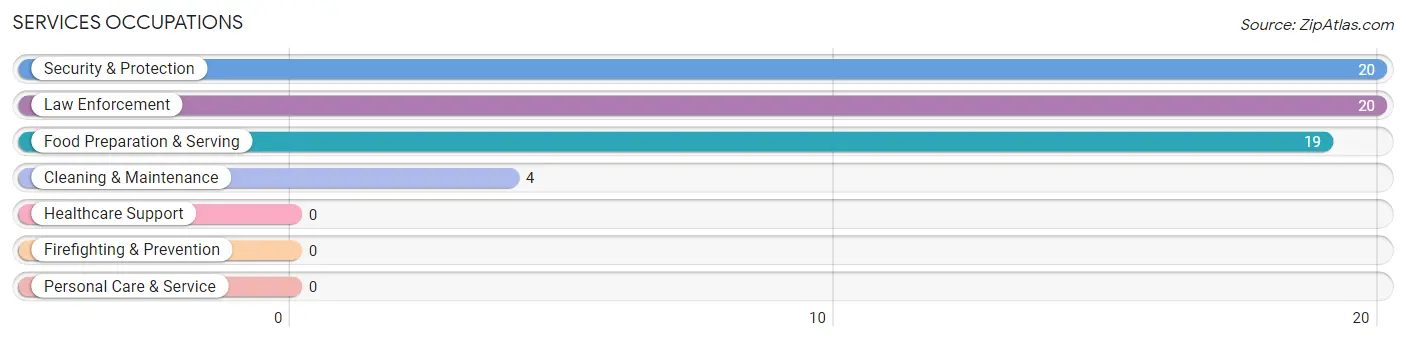
Services Occupations by Sex
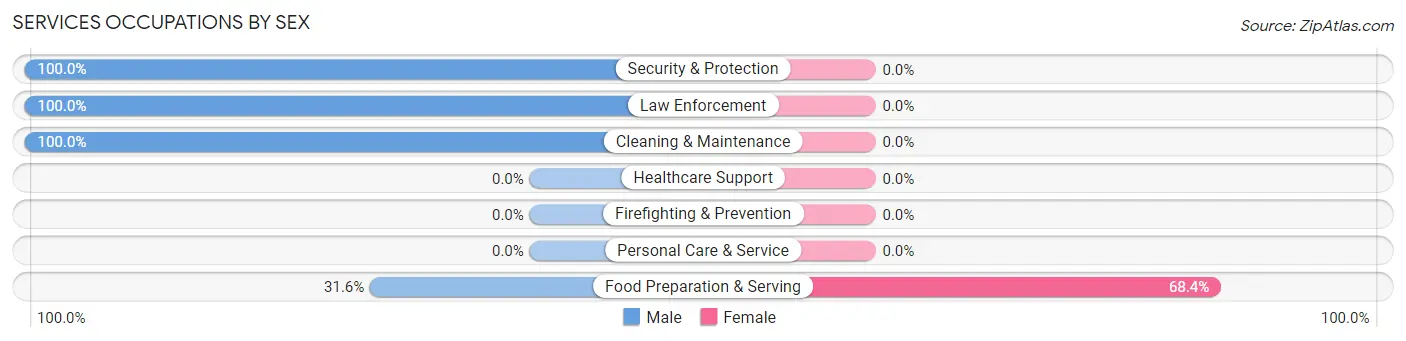
| Occupation | Male | Female |
| Healthcare Support | 0 (0.0%) | 0 (0.0%) |
| Security & Protection | 20 (100.0%) | 0 (0.0%) |
| Firefighting & Prevention | 0 (0.0%) | 0 (0.0%) |
| Law Enforcement | 20 (100.0%) | 0 (0.0%) |
| Food Preparation & Serving | 6 (31.6%) | 13 (68.4%) |
| Cleaning & Maintenance | 4 (100.0%) | 0 (0.0%) |
| Personal Care & Service | 0 (0.0%) | 0 (0.0%) |
| Total (Category) | 30 (69.8%) | 13 (30.2%) |
| Total (Overall) | 129 (62.0%) | 79 (38.0%) |
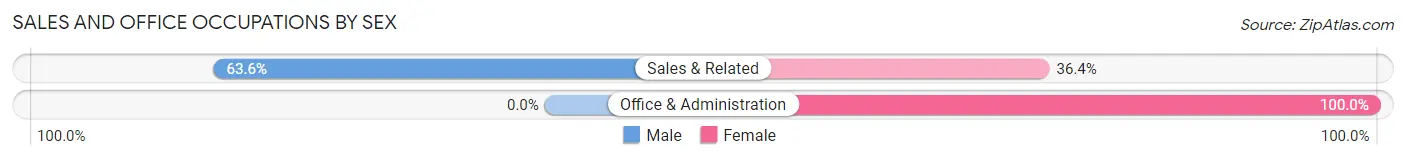
Sales and Office Occupations
The most common Sales and Office occupations in Urbanna are Sales & Related (33 | 15.9%), and Office & Administration (17 | 8.2%).
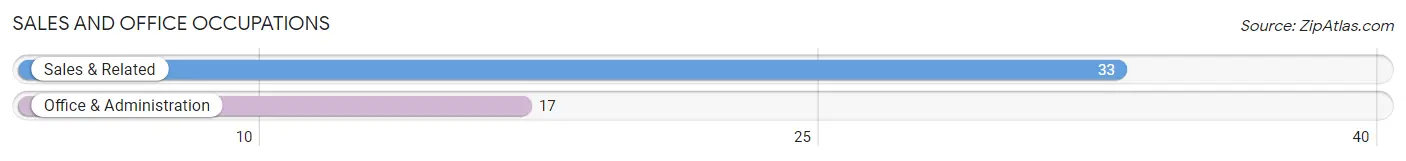
Sales and Office Occupations by Sex
| Occupation | Male | Female |
| Sales & Related | 21 (63.6%) | 12 (36.4%) |
| Office & Administration | 0 (0.0%) | 17 (100.0%) |
| Total (Category) | 21 (42.0%) | 29 (58.0%) |
| Total (Overall) | 129 (62.0%) | 79 (38.0%) |
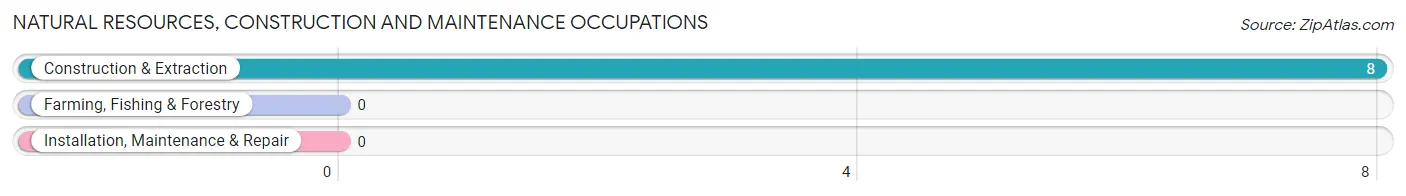
Natural Resources, Construction and Maintenance Occupations
The most common Natural Resources, Construction and Maintenance occupations in Urbanna are , and Construction & Extraction (8 | 3.8%).
Natural Resources, Construction and Maintenance Occupations by Sex
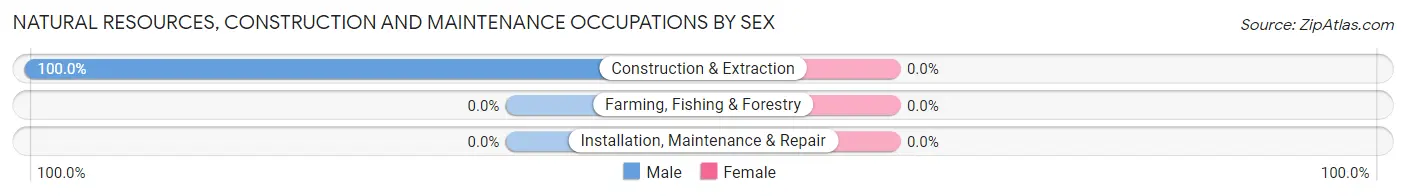
| Occupation | Male | Female |
| Farming, Fishing & Forestry | 0 (0.0%) | 0 (0.0%) |
| Construction & Extraction | 8 (100.0%) | 0 (0.0%) |
| Installation, Maintenance & Repair | 0 (0.0%) | 0 (0.0%) |
| Total (Category) | 8 (100.0%) | 0 (0.0%) |
| Total (Overall) | 129 (62.0%) | 79 (38.0%) |
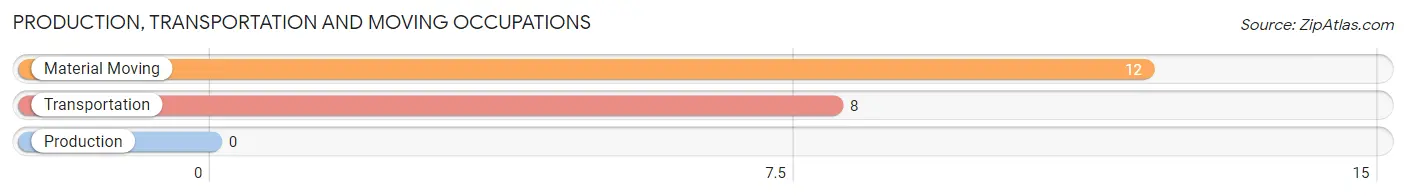
Production, Transportation and Moving Occupations
The most common Production, Transportation and Moving occupations in Urbanna are Material Moving (12 | 5.8%), and Transportation (8 | 3.8%).
Production, Transportation and Moving Occupations by Sex
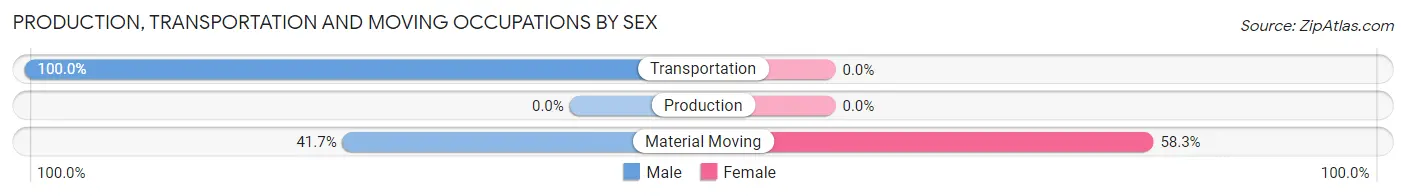
| Occupation | Male | Female |
| Production | 0 (0.0%) | 0 (0.0%) |
| Transportation | 8 (100.0%) | 0 (0.0%) |
| Material Moving | 5 (41.7%) | 7 (58.3%) |
| Total (Category) | 13 (65.0%) | 7 (35.0%) |
| Total (Overall) | 129 (62.0%) | 79 (38.0%) |
Employment Industries by Sex in Urbanna
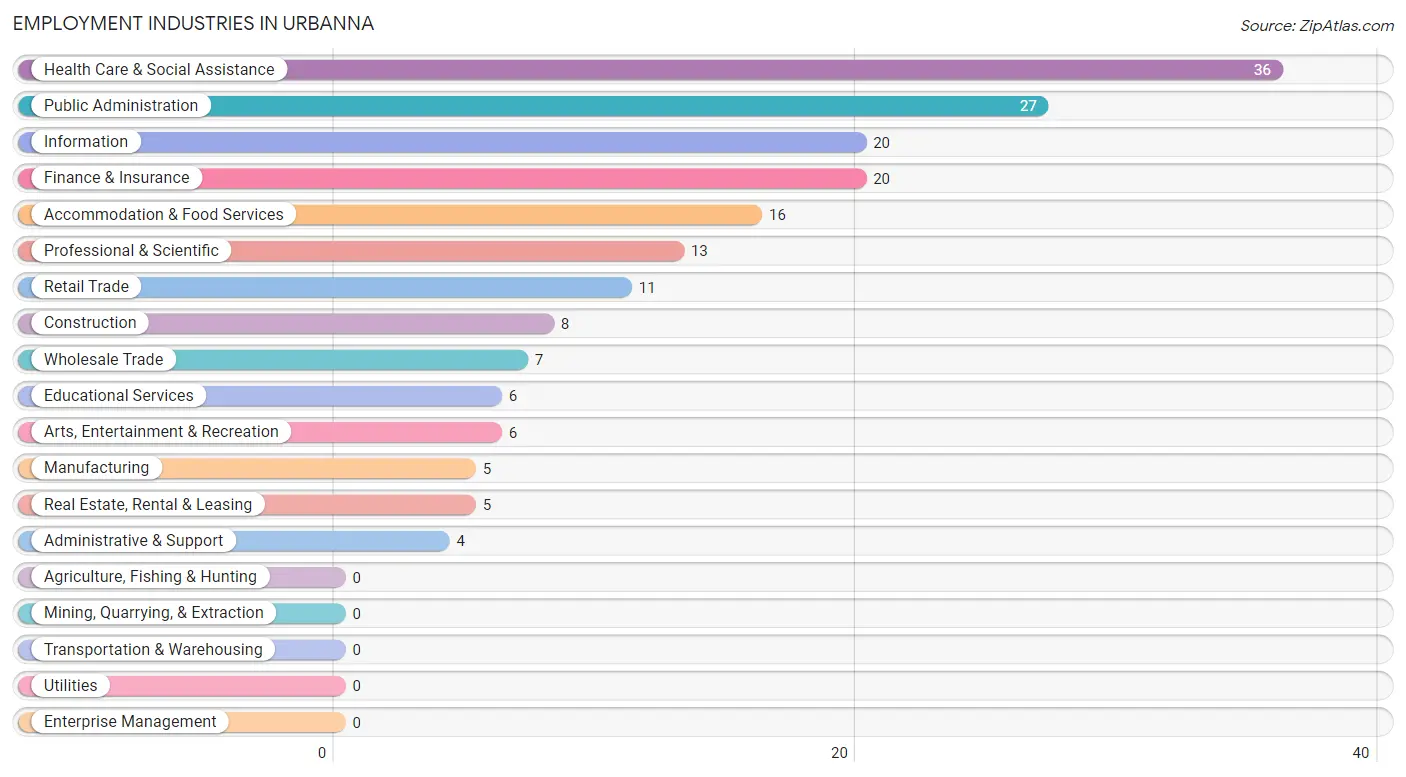
Employment Industries in Urbanna
The major employment industries in Urbanna include Health Care & Social Assistance (36 | 17.3%), Public Administration (27 | 13.0%), Information (20 | 9.6%), Finance & Insurance (20 | 9.6%), and Accommodation & Food Services (16 | 7.7%).
Employment Industries by Sex in Urbanna
The Urbanna industries that see more men than women are Construction (100.0%), Manufacturing (100.0%), and Information (100.0%), whereas the industries that tend to have a higher number of women are Wholesale Trade (100.0%), Retail Trade (100.0%), and Arts, Entertainment & Recreation (100.0%).
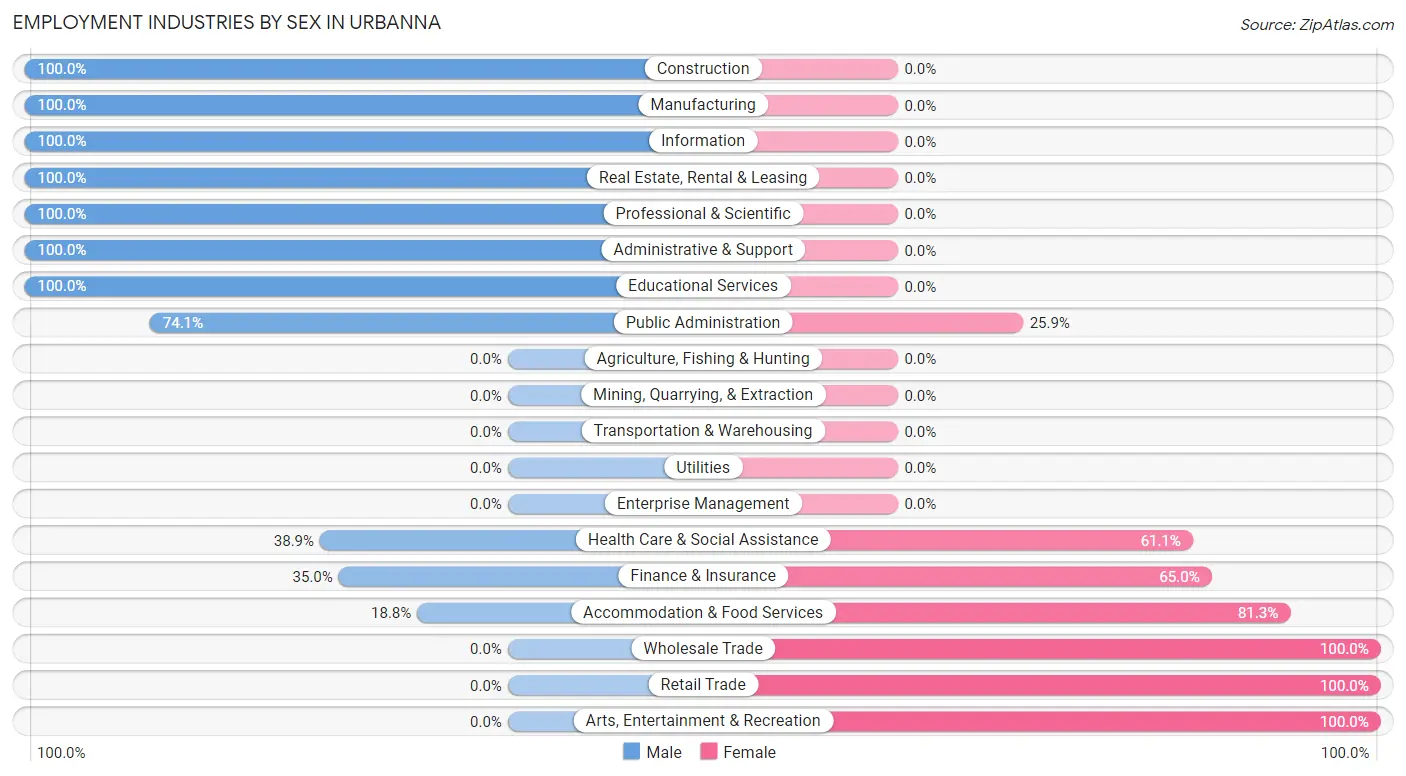
| Industry | Male | Female |
| Agriculture, Fishing & Hunting | 0 (0.0%) | 0 (0.0%) |
| Mining, Quarrying, & Extraction | 0 (0.0%) | 0 (0.0%) |
| Construction | 8 (100.0%) | 0 (0.0%) |
| Manufacturing | 5 (100.0%) | 0 (0.0%) |
| Wholesale Trade | 0 (0.0%) | 7 (100.0%) |
| Retail Trade | 0 (0.0%) | 11 (100.0%) |
| Transportation & Warehousing | 0 (0.0%) | 0 (0.0%) |
| Utilities | 0 (0.0%) | 0 (0.0%) |
| Information | 20 (100.0%) | 0 (0.0%) |
| Finance & Insurance | 7 (35.0%) | 13 (65.0%) |
| Real Estate, Rental & Leasing | 5 (100.0%) | 0 (0.0%) |
| Professional & Scientific | 13 (100.0%) | 0 (0.0%) |
| Enterprise Management | 0 (0.0%) | 0 (0.0%) |
| Administrative & Support | 4 (100.0%) | 0 (0.0%) |
| Educational Services | 6 (100.0%) | 0 (0.0%) |
| Health Care & Social Assistance | 14 (38.9%) | 22 (61.1%) |
| Arts, Entertainment & Recreation | 0 (0.0%) | 6 (100.0%) |
| Accommodation & Food Services | 3 (18.8%) | 13 (81.2%) |
| Public Administration | 20 (74.1%) | 7 (25.9%) |
| Total | 129 (62.0%) | 79 (38.0%) |
Education in Urbanna
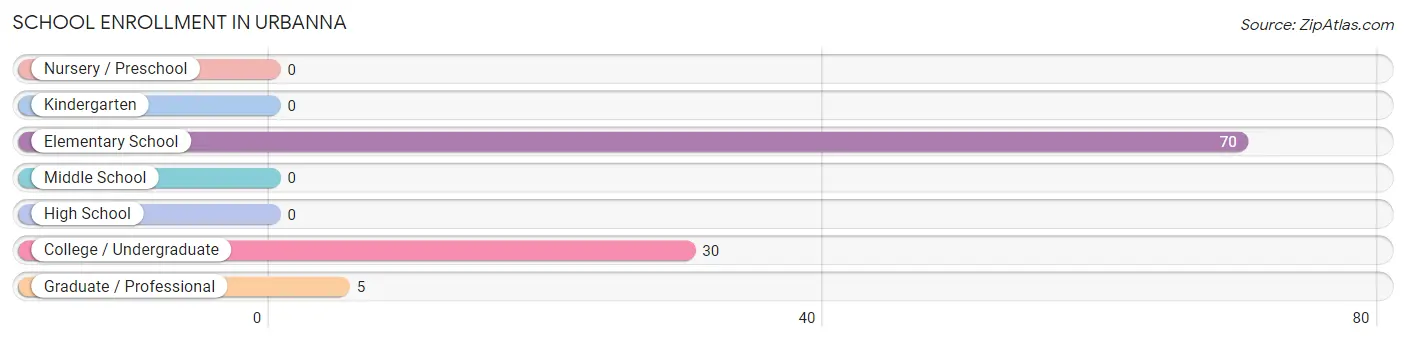
School Enrollment in Urbanna
The most common levels of schooling among the 105 students in Urbanna are elementary school (70 | 66.7%), college / undergraduate (30 | 28.6%), and graduate / professional (5 | 4.8%).
| School Level | # Students | % Students |
| Nursery / Preschool | 0 | 0.0% |
| Kindergarten | 0 | 0.0% |
| Elementary School | 70 | 66.7% |
| Middle School | 0 | 0.0% |
| High School | 0 | 0.0% |
| College / Undergraduate | 30 | 28.6% |
| Graduate / Professional | 5 | 4.8% |
| Total | 105 | 100.0% |
School Enrollment by Age by Funding Source in Urbanna
Out of a total of 105 students who are enrolled in schools in Urbanna, 40 (38.1%) attend a private institution, while the remaining 65 (61.9%) are enrolled in public schools. The age group of 20 to 24 year olds has the highest likelihood of being enrolled in private schools, with 20 (100.0% in the age bracket) enrolled. Conversely, the age group of 35 years and over has the lowest likelihood of being enrolled in a private school, with 5 (100.0% in the age bracket) attending a public institution.
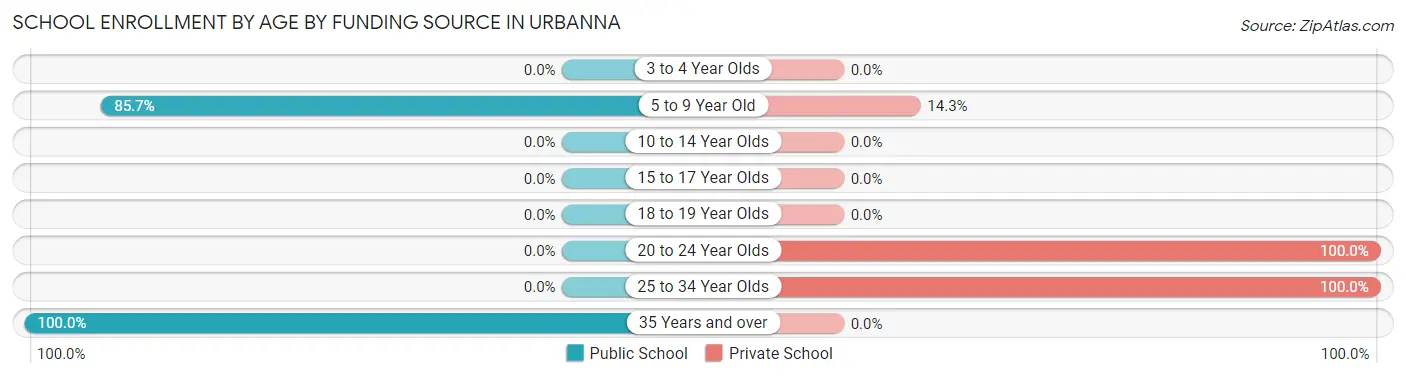
| Age Bracket | Public School | Private School |
| 3 to 4 Year Olds | 0 (0.0%) | 0 (0.0%) |
| 5 to 9 Year Old | 60 (85.7%) | 10 (14.3%) |
| 10 to 14 Year Olds | 0 (0.0%) | 0 (0.0%) |
| 15 to 17 Year Olds | 0 (0.0%) | 0 (0.0%) |
| 18 to 19 Year Olds | 0 (0.0%) | 0 (0.0%) |
| 20 to 24 Year Olds | 0 (0.0%) | 20 (100.0%) |
| 25 to 34 Year Olds | 0 (0.0%) | 10 (100.0%) |
| 35 Years and over | 5 (100.0%) | 0 (0.0%) |
| Total | 65 (61.9%) | 40 (38.1%) |
Educational Attainment by Field of Study in Urbanna
Education (33 | 30.0%), business (27 | 24.5%), science & technology (14 | 12.7%), psychology (7 | 6.4%), and social sciences (6 | 5.4%) are the most common fields of study among 110 individuals in Urbanna who have obtained a bachelor's degree or higher.
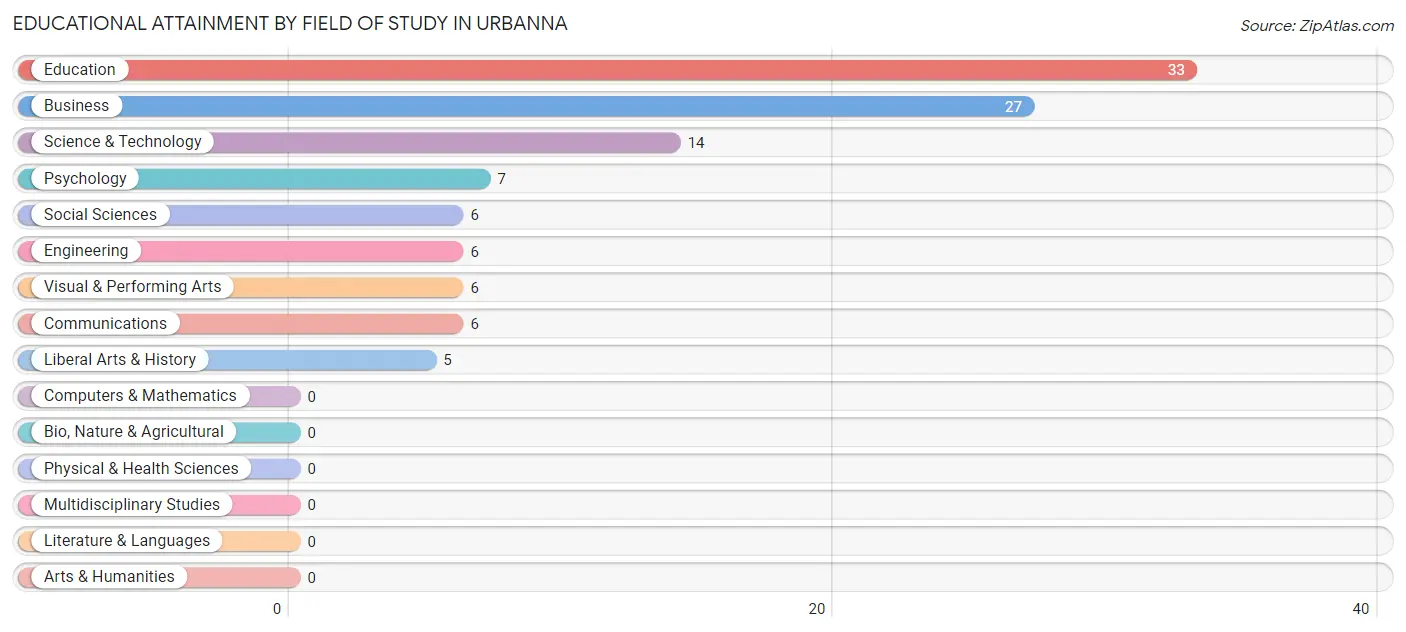
| Field of Study | # Graduates | % Graduates |
| Computers & Mathematics | 0 | 0.0% |
| Bio, Nature & Agricultural | 0 | 0.0% |
| Physical & Health Sciences | 0 | 0.0% |
| Psychology | 7 | 6.4% |
| Social Sciences | 6 | 5.4% |
| Engineering | 6 | 5.4% |
| Multidisciplinary Studies | 0 | 0.0% |
| Science & Technology | 14 | 12.7% |
| Business | 27 | 24.5% |
| Education | 33 | 30.0% |
| Literature & Languages | 0 | 0.0% |
| Liberal Arts & History | 5 | 4.5% |
| Visual & Performing Arts | 6 | 5.4% |
| Communications | 6 | 5.4% |
| Arts & Humanities | 0 | 0.0% |
| Total | 110 | 100.0% |
Transportation & Commute in Urbanna
Vehicle Availability by Sex in Urbanna
The most prevalent vehicle ownership categories in Urbanna are males with 3 vehicles (55, accounting for 42.6%) and females with 3 vehicles (26, making up 69.6%).
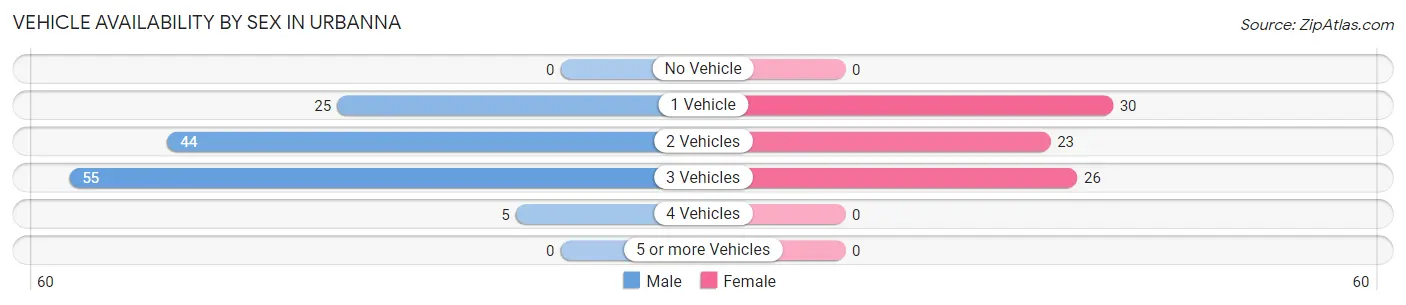
| Vehicles Available | Male | Female |
| No Vehicle | 0 (0.0%) | 0 (0.0%) |
| 1 Vehicle | 25 (19.4%) | 30 (38.0%) |
| 2 Vehicles | 44 (34.1%) | 23 (29.1%) |
| 3 Vehicles | 55 (42.6%) | 26 (32.9%) |
| 4 Vehicles | 5 (3.9%) | 0 (0.0%) |
| 5 or more Vehicles | 0 (0.0%) | 0 (0.0%) |
| Total | 129 (100.0%) | 79 (100.0%) |
Commute Time in Urbanna
The most frequently occuring commute durations in Urbanna are 5 to 9 minutes (60 commuters, 40.3%), 15 to 19 minutes (20 commuters, 13.4%), and 45 to 59 minutes (20 commuters, 13.4%).
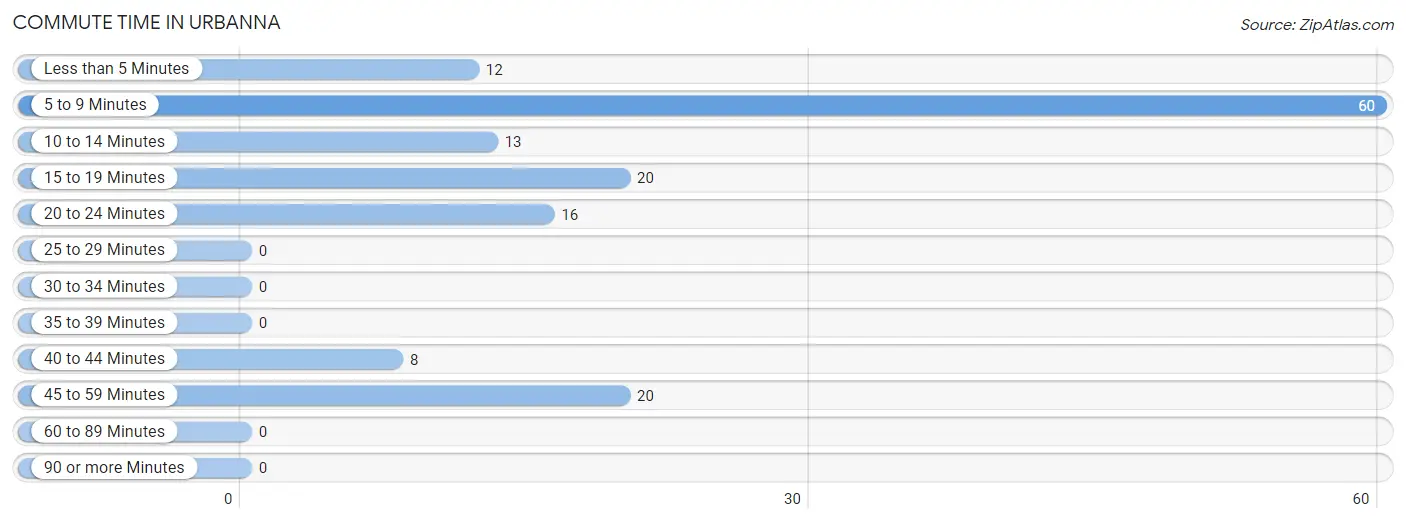
| Commute Time | # Commuters | % Commuters |
| Less than 5 Minutes | 12 | 8.1% |
| 5 to 9 Minutes | 60 | 40.3% |
| 10 to 14 Minutes | 13 | 8.7% |
| 15 to 19 Minutes | 20 | 13.4% |
| 20 to 24 Minutes | 16 | 10.7% |
| 25 to 29 Minutes | 0 | 0.0% |
| 30 to 34 Minutes | 0 | 0.0% |
| 35 to 39 Minutes | 0 | 0.0% |
| 40 to 44 Minutes | 8 | 5.4% |
| 45 to 59 Minutes | 20 | 13.4% |
| 60 to 89 Minutes | 0 | 0.0% |
| 90 or more Minutes | 0 | 0.0% |
Commute Time by Sex in Urbanna
The most common commute times in Urbanna are 5 to 9 minutes (33 commuters, 35.1%) for males and 5 to 9 minutes (27 commuters, 49.1%) for females.
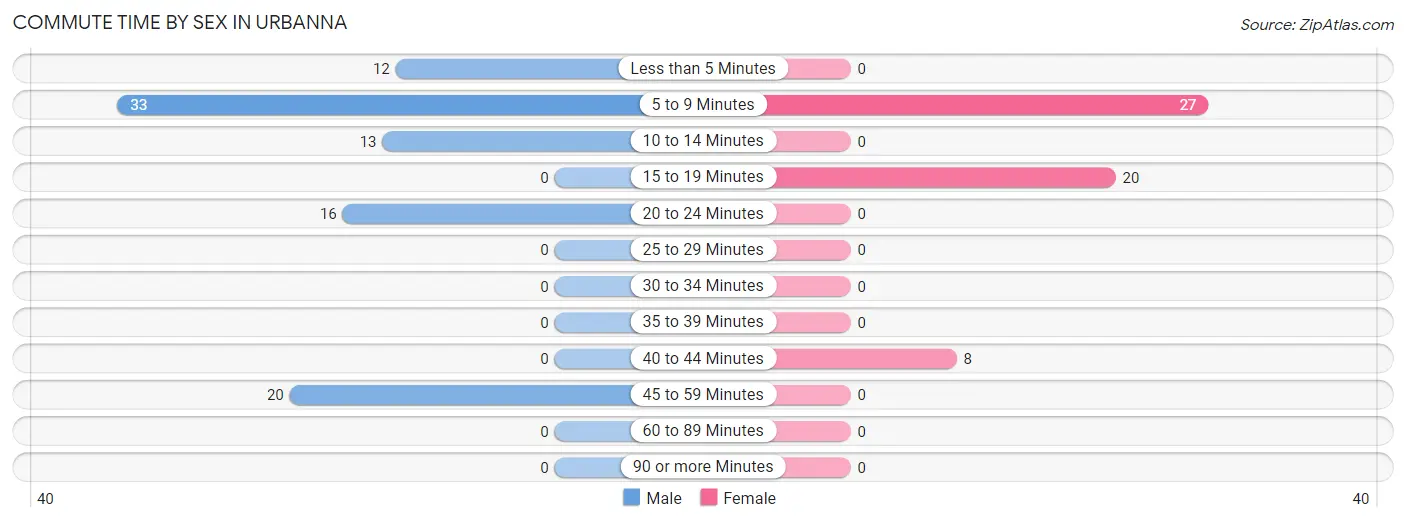
| Commute Time | Male | Female |
| Less than 5 Minutes | 12 (12.8%) | 0 (0.0%) |
| 5 to 9 Minutes | 33 (35.1%) | 27 (49.1%) |
| 10 to 14 Minutes | 13 (13.8%) | 0 (0.0%) |
| 15 to 19 Minutes | 0 (0.0%) | 20 (36.4%) |
| 20 to 24 Minutes | 16 (17.0%) | 0 (0.0%) |
| 25 to 29 Minutes | 0 (0.0%) | 0 (0.0%) |
| 30 to 34 Minutes | 0 (0.0%) | 0 (0.0%) |
| 35 to 39 Minutes | 0 (0.0%) | 0 (0.0%) |
| 40 to 44 Minutes | 0 (0.0%) | 8 (14.5%) |
| 45 to 59 Minutes | 20 (21.3%) | 0 (0.0%) |
| 60 to 89 Minutes | 0 (0.0%) | 0 (0.0%) |
| 90 or more Minutes | 0 (0.0%) | 0 (0.0%) |
Time of Departure to Work by Sex in Urbanna
The most frequent times of departure to work in Urbanna are 8:00 AM to 8:29 AM (39, 41.5%) for males and 8:00 AM to 8:29 AM (21, 38.2%) for females.
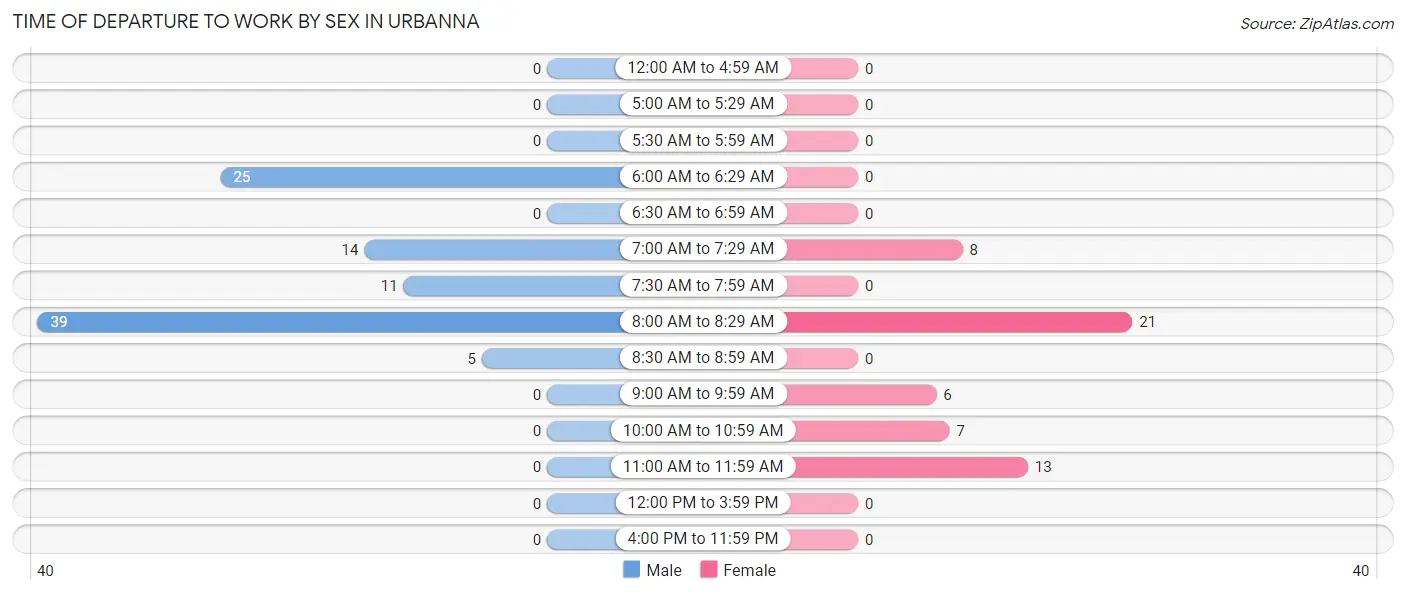
| Time of Departure | Male | Female |
| 12:00 AM to 4:59 AM | 0 (0.0%) | 0 (0.0%) |
| 5:00 AM to 5:29 AM | 0 (0.0%) | 0 (0.0%) |
| 5:30 AM to 5:59 AM | 0 (0.0%) | 0 (0.0%) |
| 6:00 AM to 6:29 AM | 25 (26.6%) | 0 (0.0%) |
| 6:30 AM to 6:59 AM | 0 (0.0%) | 0 (0.0%) |
| 7:00 AM to 7:29 AM | 14 (14.9%) | 8 (14.5%) |
| 7:30 AM to 7:59 AM | 11 (11.7%) | 0 (0.0%) |
| 8:00 AM to 8:29 AM | 39 (41.5%) | 21 (38.2%) |
| 8:30 AM to 8:59 AM | 5 (5.3%) | 0 (0.0%) |
| 9:00 AM to 9:59 AM | 0 (0.0%) | 6 (10.9%) |
| 10:00 AM to 10:59 AM | 0 (0.0%) | 7 (12.7%) |
| 11:00 AM to 11:59 AM | 0 (0.0%) | 13 (23.6%) |
| 12:00 PM to 3:59 PM | 0 (0.0%) | 0 (0.0%) |
| 4:00 PM to 11:59 PM | 0 (0.0%) | 0 (0.0%) |
| Total | 94 (100.0%) | 55 (100.0%) |
Housing Occupancy in Urbanna
Occupancy by Ownership in Urbanna
Of the total 209 dwellings in Urbanna, owner-occupied units account for 172 (82.3%), while renter-occupied units make up 37 (17.7%).
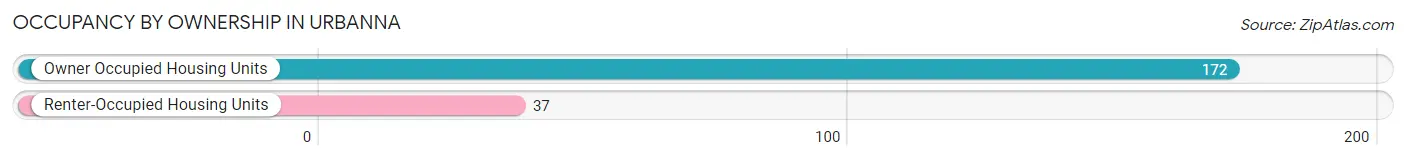
| Occupancy | # Housing Units | % Housing Units |
| Owner Occupied Housing Units | 172 | 82.3% |
| Renter-Occupied Housing Units | 37 | 17.7% |
| Total Occupied Housing Units | 209 | 100.0% |
Occupancy by Household Size in Urbanna
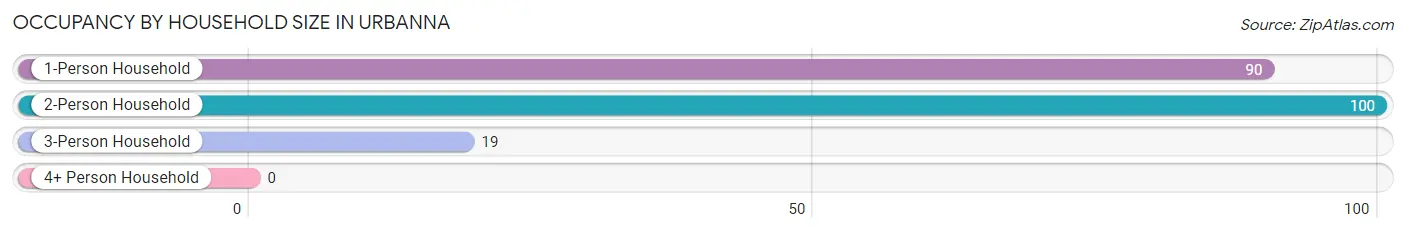
| Household Size | # Housing Units | % Housing Units |
| 1-Person Household | 90 | 43.1% |
| 2-Person Household | 100 | 47.8% |
| 3-Person Household | 19 | 9.1% |
| 4+ Person Household | 0 | 0.0% |
| Total Housing Units | 209 | 100.0% |
Occupancy by Ownership by Household Size in Urbanna
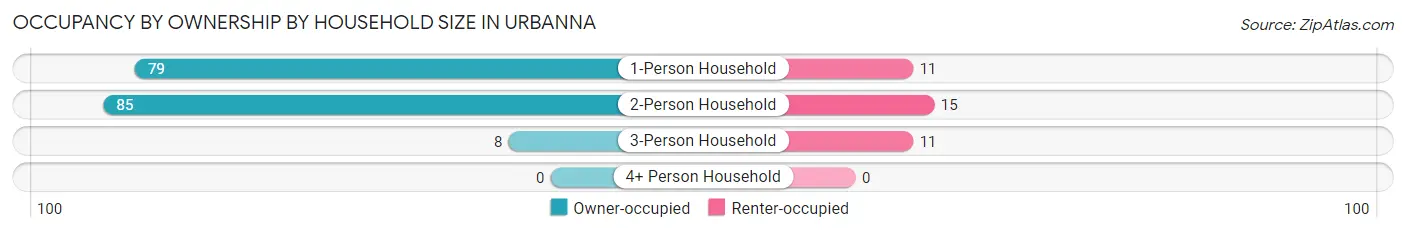
| Household Size | Owner-occupied | Renter-occupied |
| 1-Person Household | 79 (87.8%) | 11 (12.2%) |
| 2-Person Household | 85 (85.0%) | 15 (15.0%) |
| 3-Person Household | 8 (42.1%) | 11 (57.9%) |
| 4+ Person Household | 0 (0.0%) | 0 (0.0%) |
| Total Housing Units | 172 (82.3%) | 37 (17.7%) |
Occupancy by Educational Attainment in Urbanna
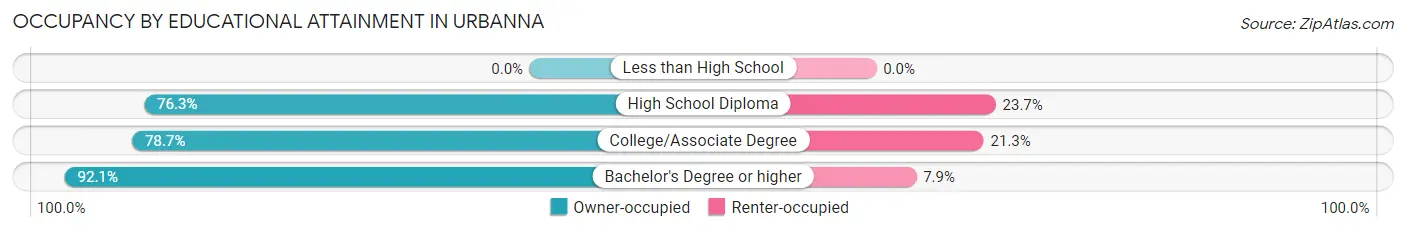
| Household Size | Owner-occupied | Renter-occupied |
| Less than High School | 0 (0.0%) | 0 (0.0%) |
| High School Diploma | 29 (76.3%) | 9 (23.7%) |
| College/Associate Degree | 85 (78.7%) | 23 (21.3%) |
| Bachelor's Degree or higher | 58 (92.1%) | 5 (7.9%) |
Occupancy by Age of Householder in Urbanna
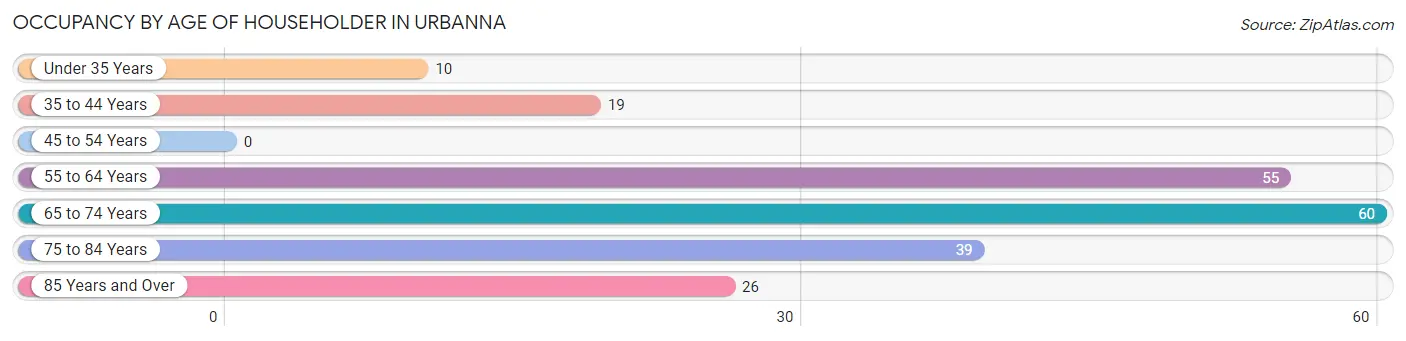
| Age Bracket | # Households | % Households |
| Under 35 Years | 10 | 4.8% |
| 35 to 44 Years | 19 | 9.1% |
| 45 to 54 Years | 0 | 0.0% |
| 55 to 64 Years | 55 | 26.3% |
| 65 to 74 Years | 60 | 28.7% |
| 75 to 84 Years | 39 | 18.7% |
| 85 Years and Over | 26 | 12.4% |
| Total | 209 | 100.0% |
Housing Finances in Urbanna
Median Income by Occupancy in Urbanna
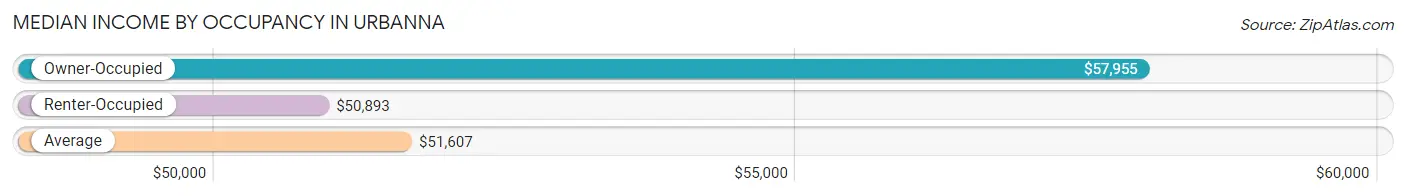
| Occupancy Type | # Households | Median Income |
| Owner-Occupied | 172 (82.3%) | $57,955 |
| Renter-Occupied | 37 (17.7%) | $50,893 |
| Average | 209 (100.0%) | $51,607 |
Occupancy by Householder Income Bracket in Urbanna
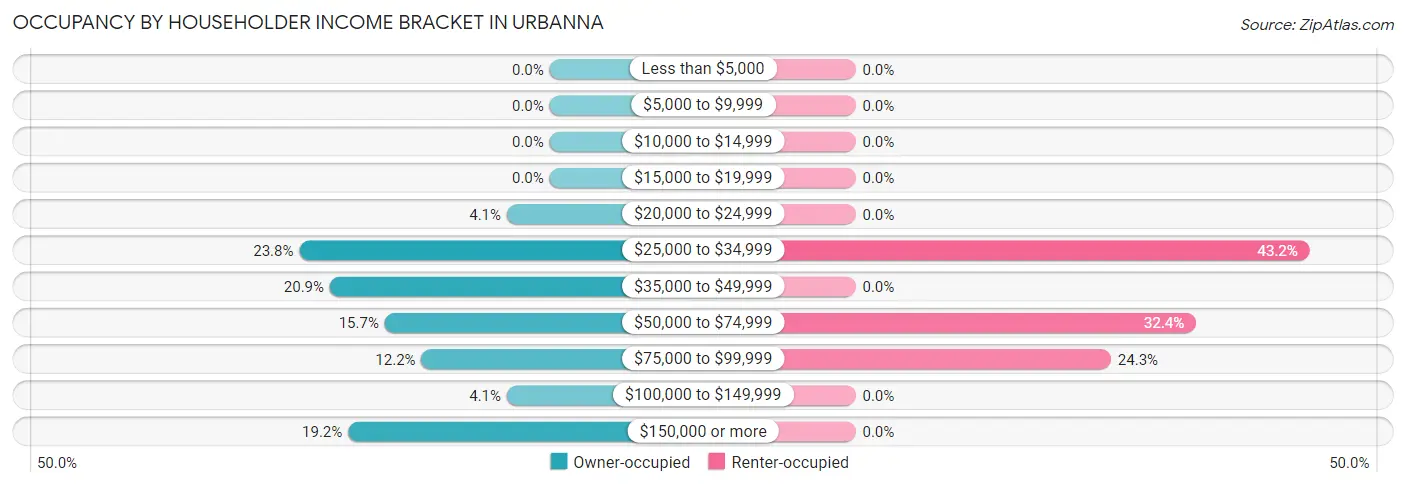
| Income Bracket | Owner-occupied | Renter-occupied |
| Less than $5,000 | 0 (0.0%) | 0 (0.0%) |
| $5,000 to $9,999 | 0 (0.0%) | 0 (0.0%) |
| $10,000 to $14,999 | 0 (0.0%) | 0 (0.0%) |
| $15,000 to $19,999 | 0 (0.0%) | 0 (0.0%) |
| $20,000 to $24,999 | 7 (4.1%) | 0 (0.0%) |
| $25,000 to $34,999 | 41 (23.8%) | 16 (43.2%) |
| $35,000 to $49,999 | 36 (20.9%) | 0 (0.0%) |
| $50,000 to $74,999 | 27 (15.7%) | 12 (32.4%) |
| $75,000 to $99,999 | 21 (12.2%) | 9 (24.3%) |
| $100,000 to $149,999 | 7 (4.1%) | 0 (0.0%) |
| $150,000 or more | 33 (19.2%) | 0 (0.0%) |
| Total | 172 (100.0%) | 37 (100.0%) |
Monthly Housing Cost Tiers in Urbanna
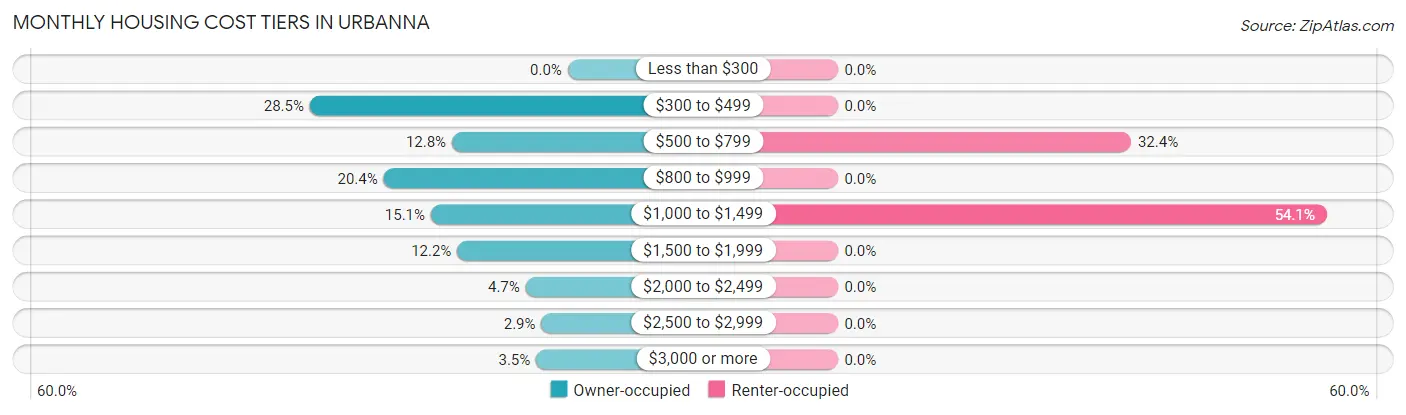
| Monthly Cost | Owner-occupied | Renter-occupied |
| Less than $300 | 0 (0.0%) | 0 (0.0%) |
| $300 to $499 | 49 (28.5%) | 0 (0.0%) |
| $500 to $799 | 22 (12.8%) | 12 (32.4%) |
| $800 to $999 | 35 (20.3%) | 0 (0.0%) |
| $1,000 to $1,499 | 26 (15.1%) | 20 (54.0%) |
| $1,500 to $1,999 | 21 (12.2%) | 0 (0.0%) |
| $2,000 to $2,499 | 8 (4.6%) | 0 (0.0%) |
| $2,500 to $2,999 | 5 (2.9%) | 0 (0.0%) |
| $3,000 or more | 6 (3.5%) | 0 (0.0%) |
| Total | 172 (100.0%) | 37 (100.0%) |
Physical Housing Characteristics in Urbanna
Housing Structures in Urbanna
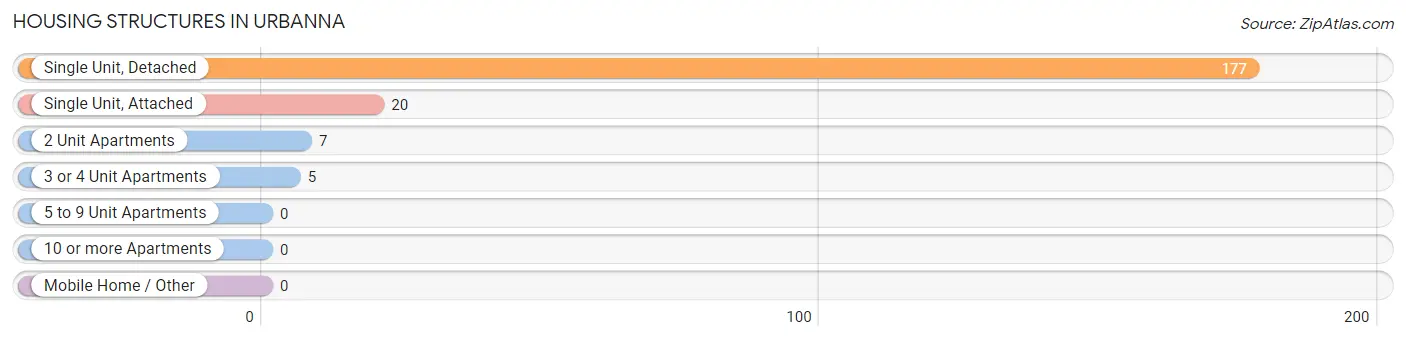
| Structure Type | # Housing Units | % Housing Units |
| Single Unit, Detached | 177 | 84.7% |
| Single Unit, Attached | 20 | 9.6% |
| 2 Unit Apartments | 7 | 3.4% |
| 3 or 4 Unit Apartments | 5 | 2.4% |
| 5 to 9 Unit Apartments | 0 | 0.0% |
| 10 or more Apartments | 0 | 0.0% |
| Mobile Home / Other | 0 | 0.0% |
| Total | 209 | 100.0% |
Housing Structures by Occupancy in Urbanna
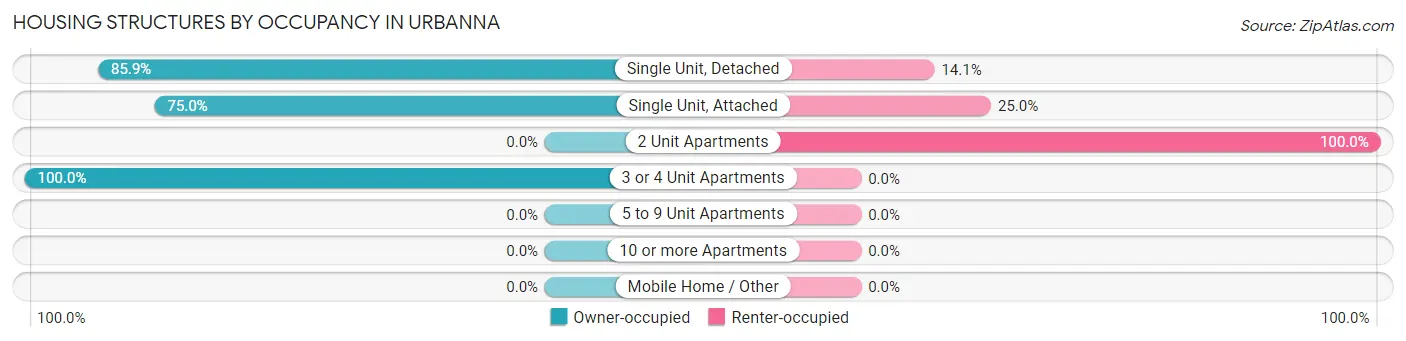
| Structure Type | Owner-occupied | Renter-occupied |
| Single Unit, Detached | 152 (85.9%) | 25 (14.1%) |
| Single Unit, Attached | 15 (75.0%) | 5 (25.0%) |
| 2 Unit Apartments | 0 (0.0%) | 7 (100.0%) |
| 3 or 4 Unit Apartments | 5 (100.0%) | 0 (0.0%) |
| 5 to 9 Unit Apartments | 0 (0.0%) | 0 (0.0%) |
| 10 or more Apartments | 0 (0.0%) | 0 (0.0%) |
| Mobile Home / Other | 0 (0.0%) | 0 (0.0%) |
| Total | 172 (82.3%) | 37 (17.7%) |
Housing Structures by Number of Rooms in Urbanna
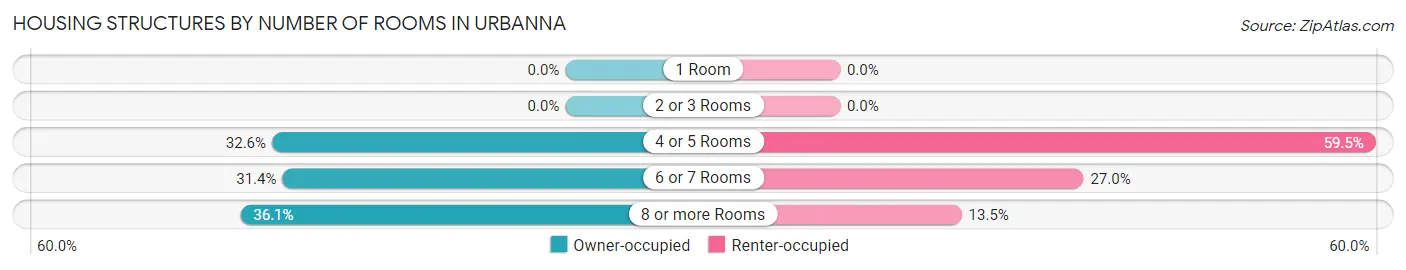
| Number of Rooms | Owner-occupied | Renter-occupied |
| 1 Room | 0 (0.0%) | 0 (0.0%) |
| 2 or 3 Rooms | 0 (0.0%) | 0 (0.0%) |
| 4 or 5 Rooms | 56 (32.6%) | 22 (59.5%) |
| 6 or 7 Rooms | 54 (31.4%) | 10 (27.0%) |
| 8 or more Rooms | 62 (36.0%) | 5 (13.5%) |
| Total | 172 (100.0%) | 37 (100.0%) |
Housing Structure by Heating Type in Urbanna
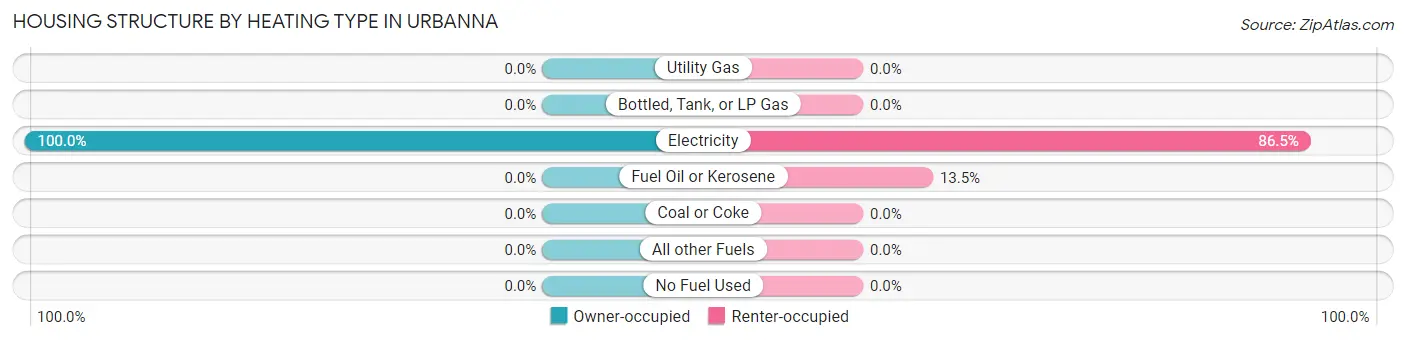
| Heating Type | Owner-occupied | Renter-occupied |
| Utility Gas | 0 (0.0%) | 0 (0.0%) |
| Bottled, Tank, or LP Gas | 0 (0.0%) | 0 (0.0%) |
| Electricity | 172 (100.0%) | 32 (86.5%) |
| Fuel Oil or Kerosene | 0 (0.0%) | 5 (13.5%) |
| Coal or Coke | 0 (0.0%) | 0 (0.0%) |
| All other Fuels | 0 (0.0%) | 0 (0.0%) |
| No Fuel Used | 0 (0.0%) | 0 (0.0%) |
| Total | 172 (100.0%) | 37 (100.0%) |
Household Vehicle Usage in Urbanna
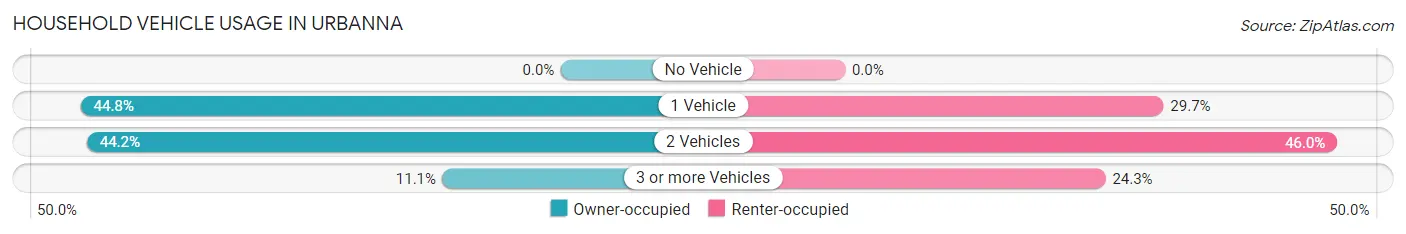
| Vehicles per Household | Owner-occupied | Renter-occupied |
| No Vehicle | 0 (0.0%) | 0 (0.0%) |
| 1 Vehicle | 77 (44.8%) | 11 (29.7%) |
| 2 Vehicles | 76 (44.2%) | 17 (46.0%) |
| 3 or more Vehicles | 19 (11.1%) | 9 (24.3%) |
| Total | 172 (100.0%) | 37 (100.0%) |
Real Estate & Mortgages in Urbanna
Real Estate and Mortgage Overview in Urbanna
| Characteristic | Without Mortgage | With Mortgage |
| Housing Units | 98 | 74 |
| Median Property Value | $331,800 | $250,000 |
| Median Household Income | $57,778 | $24 |
| Monthly Housing Costs | $500 | $6 |
| Real Estate Taxes | $2,155 | $0 |
Property Value by Mortgage Status in Urbanna
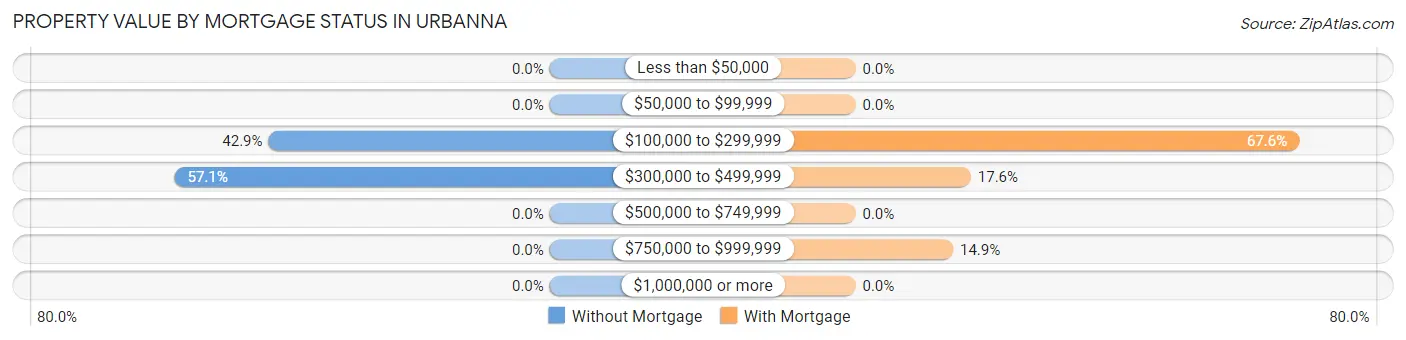
| Property Value | Without Mortgage | With Mortgage |
| Less than $50,000 | 0 (0.0%) | 0 (0.0%) |
| $50,000 to $99,999 | 0 (0.0%) | 0 (0.0%) |
| $100,000 to $299,999 | 42 (42.9%) | 50 (67.6%) |
| $300,000 to $499,999 | 56 (57.1%) | 13 (17.6%) |
| $500,000 to $749,999 | 0 (0.0%) | 0 (0.0%) |
| $750,000 to $999,999 | 0 (0.0%) | 11 (14.9%) |
| $1,000,000 or more | 0 (0.0%) | 0 (0.0%) |
| Total | 98 (100.0%) | 74 (100.0%) |
Household Income by Mortgage Status in Urbanna
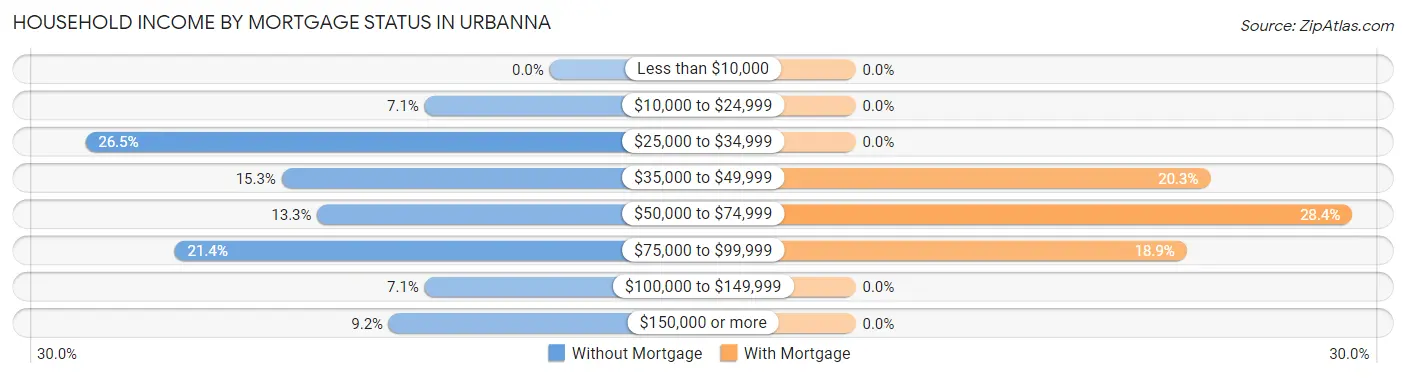
| Household Income | Without Mortgage | With Mortgage |
| Less than $10,000 | 0 (0.0%) | 0 (0.0%) |
| $10,000 to $24,999 | 7 (7.1%) | 0 (0.0%) |
| $25,000 to $34,999 | 26 (26.5%) | 0 (0.0%) |
| $35,000 to $49,999 | 15 (15.3%) | 15 (20.3%) |
| $50,000 to $74,999 | 13 (13.3%) | 21 (28.4%) |
| $75,000 to $99,999 | 21 (21.4%) | 14 (18.9%) |
| $100,000 to $149,999 | 7 (7.1%) | 0 (0.0%) |
| $150,000 or more | 9 (9.2%) | 0 (0.0%) |
| Total | 98 (100.0%) | 74 (100.0%) |
Property Value to Household Income Ratio in Urbanna
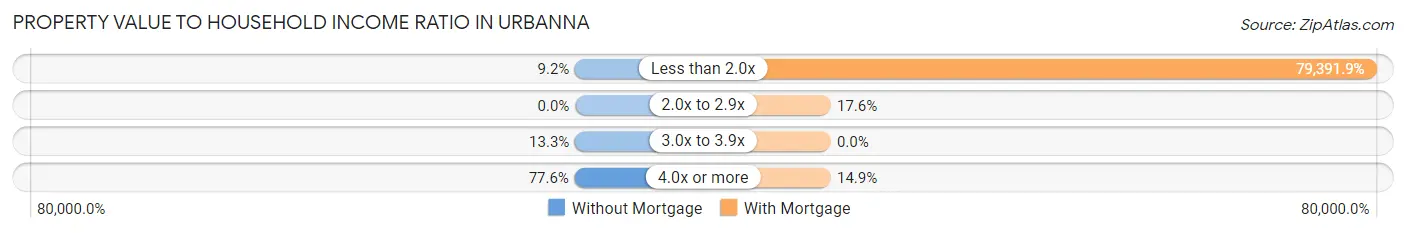
| Value-to-Income Ratio | Without Mortgage | With Mortgage |
| Less than 2.0x | 9 (9.2%) | 58,750 (79,391.9%) |
| 2.0x to 2.9x | 0 (0.0%) | 13 (17.6%) |
| 3.0x to 3.9x | 13 (13.3%) | 0 (0.0%) |
| 4.0x or more | 76 (77.5%) | 11 (14.9%) |
| Total | 98 (100.0%) | 74 (100.0%) |
Real Estate Taxes by Mortgage Status in Urbanna
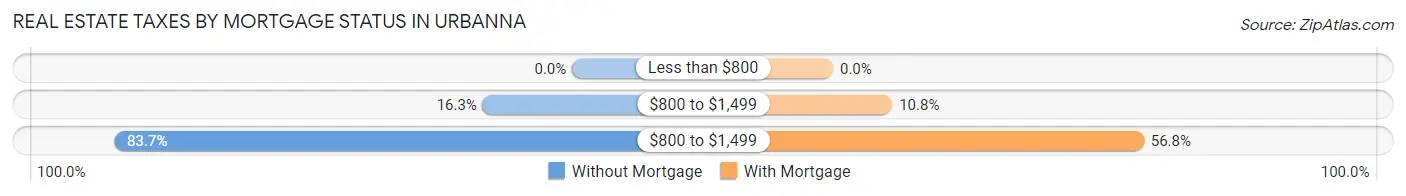
| Property Taxes | Without Mortgage | With Mortgage |
| Less than $800 | 0 (0.0%) | 0 (0.0%) |
| $800 to $1,499 | 16 (16.3%) | 8 (10.8%) |
| $800 to $1,499 | 82 (83.7%) | 42 (56.8%) |
| Total | 98 (100.0%) | 74 (100.0%) |
Health & Disability in Urbanna
Health Insurance Coverage by Age in Urbanna
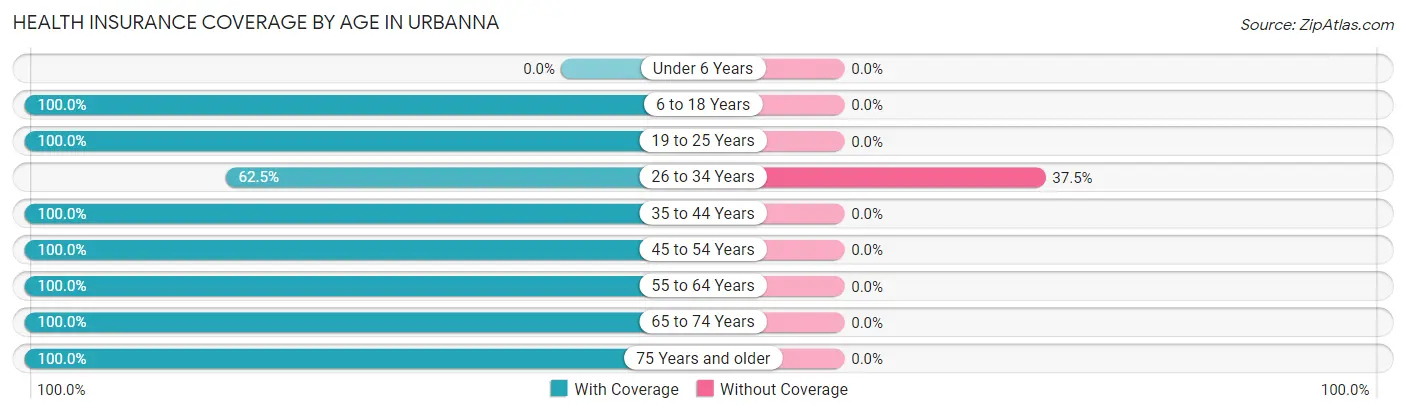
| Age Bracket | With Coverage | Without Coverage |
| Under 6 Years | 0 (0.0%) | 0 (0.0%) |
| 6 to 18 Years | 70 (100.0%) | 0 (0.0%) |
| 19 to 25 Years | 40 (100.0%) | 0 (0.0%) |
| 26 to 34 Years | 10 (62.5%) | 6 (37.5%) |
| 35 to 44 Years | 36 (100.0%) | 0 (0.0%) |
| 45 to 54 Years | 8 (100.0%) | 0 (0.0%) |
| 55 to 64 Years | 78 (100.0%) | 0 (0.0%) |
| 65 to 74 Years | 117 (100.0%) | 0 (0.0%) |
| 75 Years and older | 72 (100.0%) | 0 (0.0%) |
| Total | 431 (98.6%) | 6 (1.4%) |
Health Insurance Coverage by Citizenship Status in Urbanna
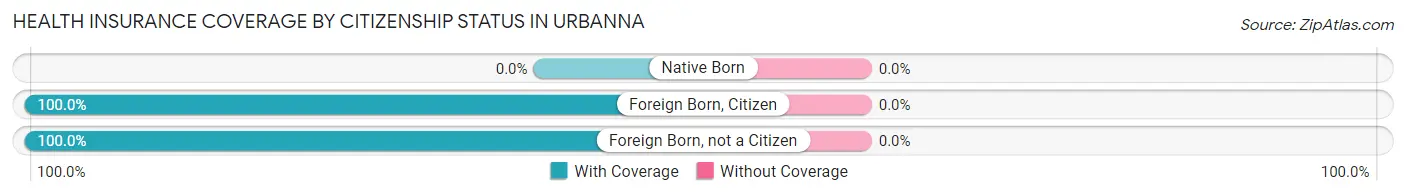
| Citizenship Status | With Coverage | Without Coverage |
| Native Born | 0 (0.0%) | 0 (0.0%) |
| Foreign Born, Citizen | 70 (100.0%) | 0 (0.0%) |
| Foreign Born, not a Citizen | 40 (100.0%) | 0 (0.0%) |
Health Insurance Coverage by Household Income in Urbanna
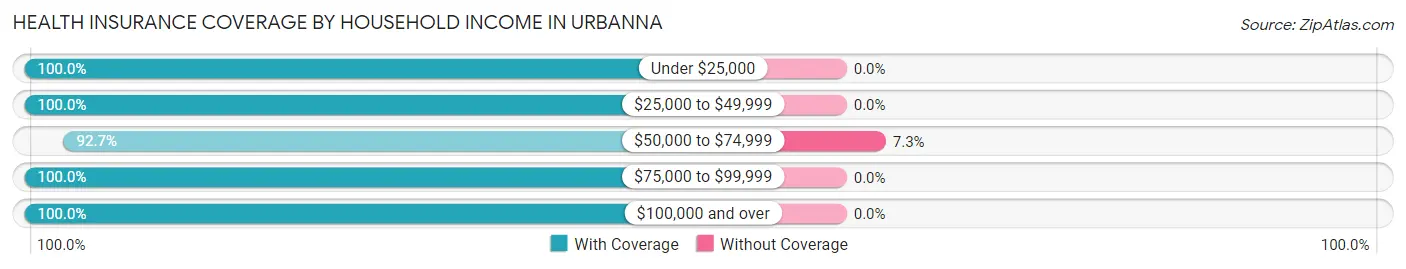
| Household Income | With Coverage | Without Coverage |
| Under $25,000 | 7 (100.0%) | 0 (0.0%) |
| $25,000 to $49,999 | 181 (100.0%) | 0 (0.0%) |
| $50,000 to $74,999 | 76 (92.7%) | 6 (7.3%) |
| $75,000 to $99,999 | 59 (100.0%) | 0 (0.0%) |
| $100,000 and over | 92 (100.0%) | 0 (0.0%) |
Public vs Private Health Insurance Coverage by Age in Urbanna
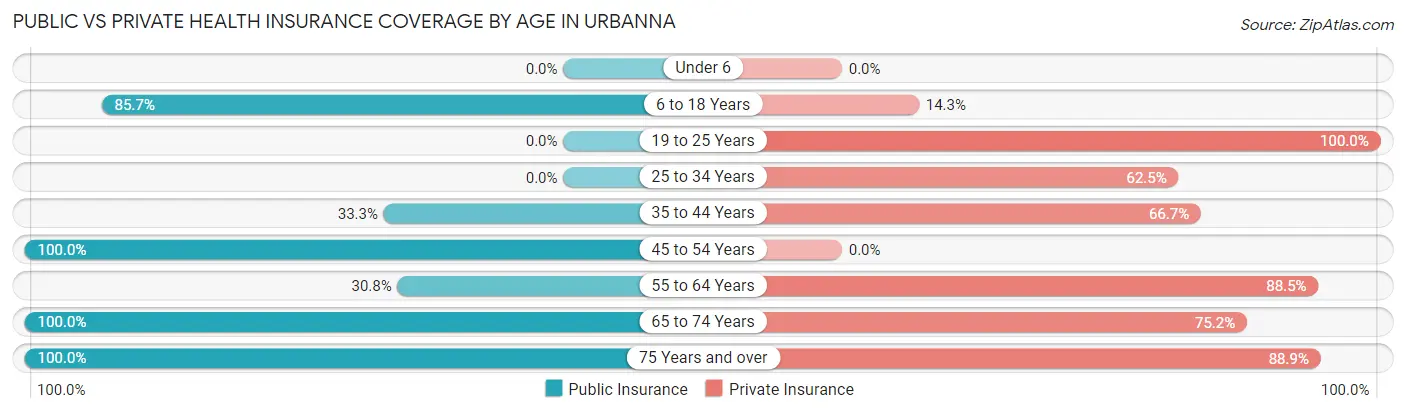
| Age Bracket | Public Insurance | Private Insurance |
| Under 6 | 0 (0.0%) | 0 (0.0%) |
| 6 to 18 Years | 60 (85.7%) | 10 (14.3%) |
| 19 to 25 Years | 0 (0.0%) | 40 (100.0%) |
| 25 to 34 Years | 0 (0.0%) | 10 (62.5%) |
| 35 to 44 Years | 12 (33.3%) | 24 (66.7%) |
| 45 to 54 Years | 8 (100.0%) | 0 (0.0%) |
| 55 to 64 Years | 24 (30.8%) | 69 (88.5%) |
| 65 to 74 Years | 117 (100.0%) | 88 (75.2%) |
| 75 Years and over | 72 (100.0%) | 64 (88.9%) |
| Total | 293 (67.0%) | 305 (69.8%) |
Disability Status by Sex by Age in Urbanna
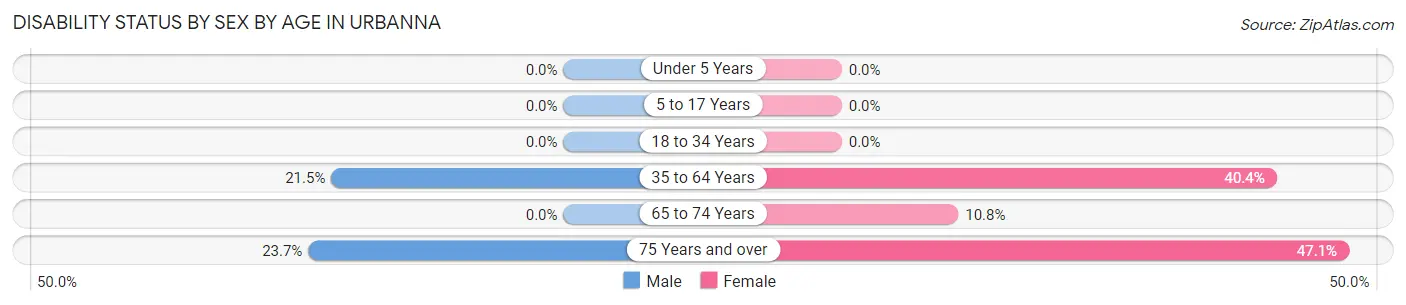
| Age Bracket | Male | Female |
| Under 5 Years | 0 (0.0%) | 0 (0.0%) |
| 5 to 17 Years | 0 (0.0%) | 0 (0.0%) |
| 18 to 34 Years | 0 (0.0%) | 0 (0.0%) |
| 35 to 64 Years | 14 (21.5%) | 23 (40.4%) |
| 65 to 74 Years | 0 (0.0%) | 8 (10.8%) |
| 75 Years and over | 9 (23.7%) | 16 (47.1%) |
Disability Class by Sex by Age in Urbanna
Disability Class: Hearing Difficulty
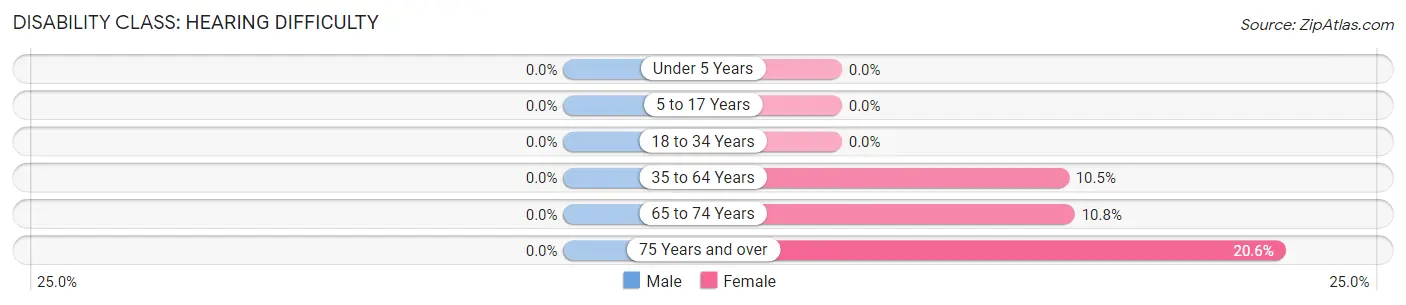
| Age Bracket | Male | Female |
| Under 5 Years | 0 (0.0%) | 0 (0.0%) |
| 5 to 17 Years | 0 (0.0%) | 0 (0.0%) |
| 18 to 34 Years | 0 (0.0%) | 0 (0.0%) |
| 35 to 64 Years | 0 (0.0%) | 6 (10.5%) |
| 65 to 74 Years | 0 (0.0%) | 8 (10.8%) |
| 75 Years and over | 0 (0.0%) | 7 (20.6%) |
Disability Class: Vision Difficulty
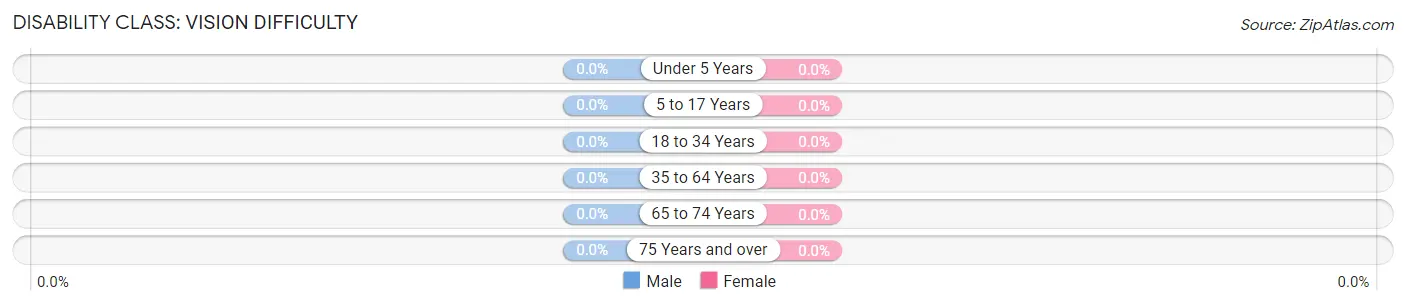
| Age Bracket | Male | Female |
| Under 5 Years | 0 (0.0%) | 0 (0.0%) |
| 5 to 17 Years | 0 (0.0%) | 0 (0.0%) |
| 18 to 34 Years | 0 (0.0%) | 0 (0.0%) |
| 35 to 64 Years | 0 (0.0%) | 0 (0.0%) |
| 65 to 74 Years | 0 (0.0%) | 0 (0.0%) |
| 75 Years and over | 0 (0.0%) | 0 (0.0%) |
Disability Class: Cognitive Difficulty
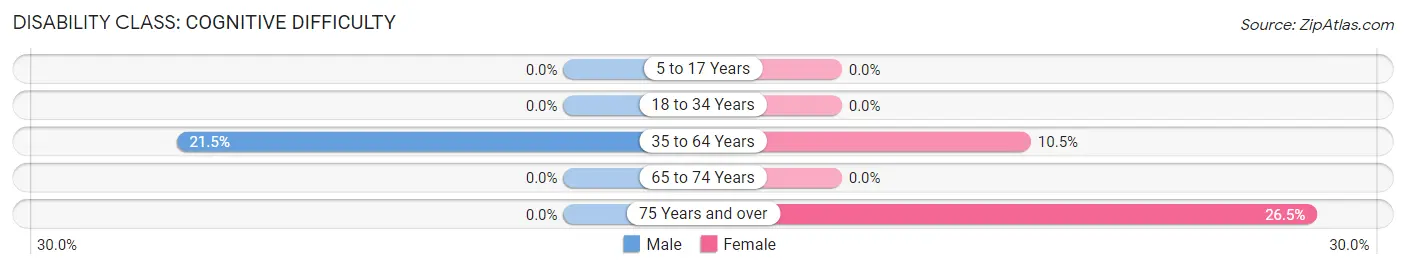
| Age Bracket | Male | Female |
| 5 to 17 Years | 0 (0.0%) | 0 (0.0%) |
| 18 to 34 Years | 0 (0.0%) | 0 (0.0%) |
| 35 to 64 Years | 14 (21.5%) | 6 (10.5%) |
| 65 to 74 Years | 0 (0.0%) | 0 (0.0%) |
| 75 Years and over | 0 (0.0%) | 9 (26.5%) |
Disability Class: Ambulatory Difficulty
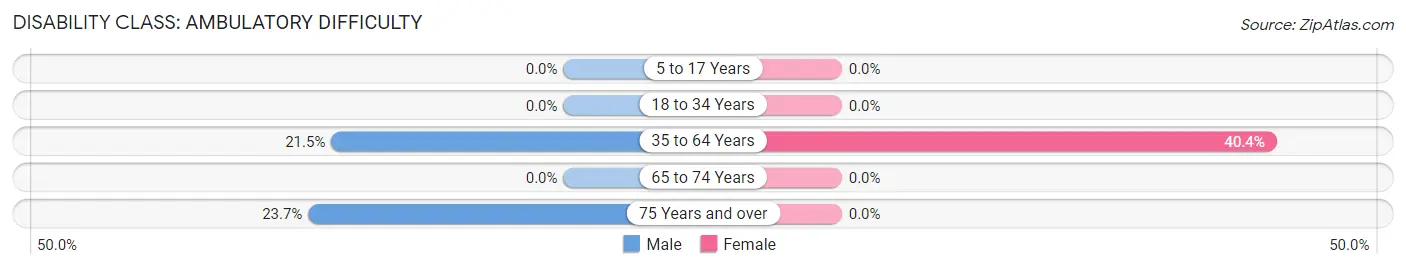
| Age Bracket | Male | Female |
| 5 to 17 Years | 0 (0.0%) | 0 (0.0%) |
| 18 to 34 Years | 0 (0.0%) | 0 (0.0%) |
| 35 to 64 Years | 14 (21.5%) | 23 (40.4%) |
| 65 to 74 Years | 0 (0.0%) | 0 (0.0%) |
| 75 Years and over | 9 (23.7%) | 0 (0.0%) |
Disability Class: Self-Care Difficulty
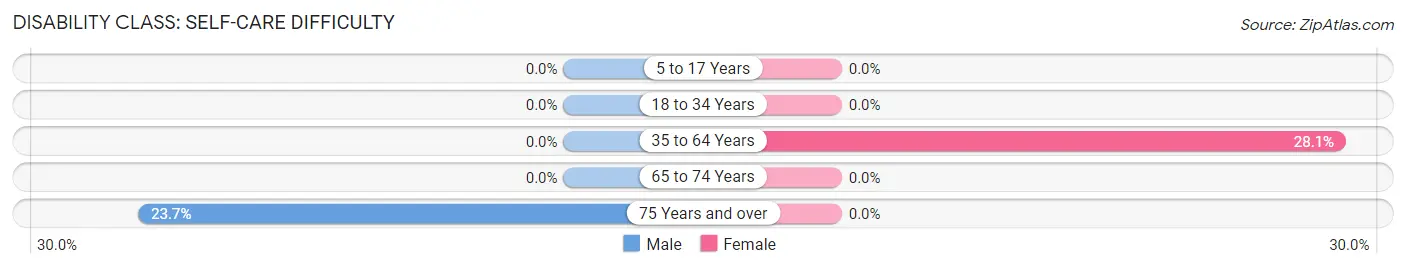
| Age Bracket | Male | Female |
| 5 to 17 Years | 0 (0.0%) | 0 (0.0%) |
| 18 to 34 Years | 0 (0.0%) | 0 (0.0%) |
| 35 to 64 Years | 0 (0.0%) | 16 (28.1%) |
| 65 to 74 Years | 0 (0.0%) | 0 (0.0%) |
| 75 Years and over | 9 (23.7%) | 0 (0.0%) |
Technology Access in Urbanna
Computing Device Access in Urbanna
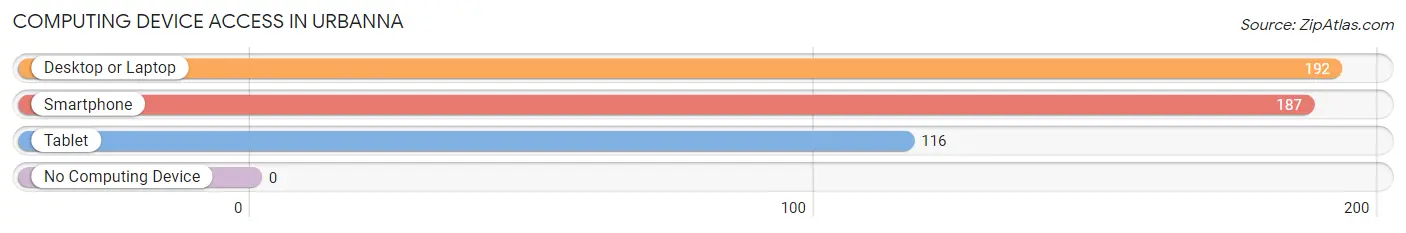
| Device Type | # Households | % Households |
| Desktop or Laptop | 192 | 91.9% |
| Smartphone | 187 | 89.5% |
| Tablet | 116 | 55.5% |
| No Computing Device | 0 | 0.0% |
| Total | 209 | 100.0% |
Internet Access in Urbanna
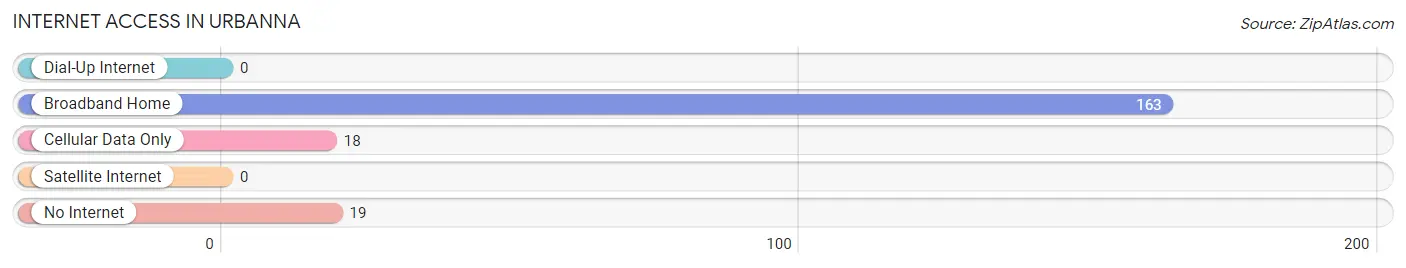
| Internet Type | # Households | % Households |
| Dial-Up Internet | 0 | 0.0% |
| Broadband Home | 163 | 78.0% |
| Cellular Data Only | 18 | 8.6% |
| Satellite Internet | 0 | 0.0% |
| No Internet | 19 | 9.1% |
| Total | 209 | 100.0% |
Urbanna Summary
Urbanna, Virginia is a small town located on the Rappahannock River in Middlesex County, Virginia. It is a part of the Northern Neck region of Virginia and is known for its historic charm and waterfront views. The town has a population of approximately 600 people and is a popular tourist destination.
History
The town of Urbanna was founded in 1680 by William Claiborne, who was granted a patent for the land by the King of England. The town was originally known as Claiborne’s Creek, but was later renamed Urbanna, which is derived from the Latin phrase “urbis anna” meaning “beautiful city.”
The town was an important port in the 18th century, and was the site of the first court in Middlesex County. It was also the site of the first post office in the county, which was established in 1793.
In the 19th century, Urbanna was a major center of the oyster industry. The town was also home to a number of shipbuilding companies, which produced vessels for the Confederate Navy during the Civil War.
Geography
Urbanna is located on the Rappahannock River in Middlesex County, Virginia. The town is situated on a peninsula between the Rappahannock and Piankatank Rivers. The town is bordered by the towns of Saluda and Topping to the north, and by the towns of Hartfield and Deltaville to the south.
The town is located approximately 50 miles east of Richmond, Virginia, and is accessible by car via Route 17. The town is also accessible by boat via the Rappahannock River.
Economy
The economy of Urbanna is largely based on tourism. The town is home to a number of bed and breakfasts, restaurants, and shops. The town is also home to a number of marinas, which provide services to boaters.
The town is also home to a number of oyster-related businesses, including oyster farms, oyster shucking houses, and oyster-related retail stores. The town is also home to a number of boat-building companies, which produce vessels for recreational and commercial use.
Demographics
As of the 2010 census, the population of Urbanna was 590. The racial makeup of the town was 94.3% White, 3.4% African American, 0.2% Native American, 0.2% Asian, 0.2% from other races, and 1.9% from two or more races. Hispanic or Latino of any race were 1.7% of the population.
The median income for a household in the town was $45,833, and the median income for a family was $50,000. The per capita income for the town was $22,845. About 8.3% of families and 10.2% of the population were below the poverty line, including 14.3% of those under age 18 and 8.3% of those age 65 or over.
Conclusion
Urbanna, Virginia is a small town located on the Rappahannock River in Middlesex County, Virginia. It is a part of the Northern Neck region of Virginia and is known for its historic charm and waterfront views. The town has a population of approximately 600 people and is a popular tourist destination. The economy of Urbanna is largely based on tourism, oyster-related businesses, and boat-building companies. The town has a diverse population, with a median income of $45,833 and a per capita income of $22,845.
Common Questions
What is Per Capita Income in Urbanna?
Per Capita income in Urbanna is $38,704.
What is the Median Family Income in Urbanna?
Median Family Income in Urbanna is $58,523.
What is the Median Household income in Urbanna?
Median Household Income in Urbanna is $51,607.
What is Income or Wage Gap in Urbanna?
Income or Wage Gap in Urbanna is 42.2%.
Women in Urbanna earn 57.8 cents for every dollar earned by a man.
What is Inequality or Gini Index in Urbanna?
Inequality or Gini Index in Urbanna is 0.40.
What is the Total Population of Urbanna?
Total Population of Urbanna is 437.
What is the Total Male Population of Urbanna?
Total Male Population of Urbanna is 252.
What is the Total Female Population of Urbanna?
Total Female Population of Urbanna is 185.
What is the Ratio of Males per 100 Females in Urbanna?
There are 136.22 Males per 100 Females in Urbanna.
What is the Ratio of Females per 100 Males in Urbanna?
There are 73.41 Females per 100 Males in Urbanna.
What is the Median Population Age in Urbanna?
Median Population Age in Urbanna is 64.3 Years.
What is the Average Family Size in Urbanna
Average Family Size in Urbanna is 2.8 People.
What is the Average Household Size in Urbanna
Average Household Size in Urbanna is 2.0 People.
How Large is the Labor Force in Urbanna?
There are 208 People in the Labor Forcein in Urbanna.
What is the Percentage of People in the Labor Force in Urbanna?
56.7% of People are in the Labor Force in Urbanna.