The Plains, VA Map & Demographics
The Plains Map
The Plains Overview
$34,654
PER CAPITA INCOME
$109,333
AVG FAMILY INCOME
$108,250
AVG HOUSEHOLD INCOME
0.30
INEQUALITY / GINI INDEX
273
TOTAL POPULATION
131
MALE POPULATION
142
FEMALE POPULATION
92.25
MALES / 100 FEMALES
108.40
FEMALES / 100 MALES
45.2
MEDIAN AGE
3.7
AVG FAMILY SIZE
2.9
AVG HOUSEHOLD SIZE
150
LABOR FORCE [ PEOPLE ]
66.7%
PERCENT IN LABOR FORCE
0.7%
UNEMPLOYMENT RATE
The Plains Zip Codes
The Plains Area Codes
Income in The Plains
Income Overview in The Plains
Per Capita Income in The Plains is $34,654, while median incomes of families and households are $109,333 and $108,250 respectively.
| Characteristic | Number | Measure |
| Per Capita Income | 273 | $34,654 |
| Median Family Income | 56 | $109,333 |
| Mean Family Income | 56 | $111,659 |
| Median Household Income | 93 | $108,250 |
| Mean Household Income | 93 | $105,766 |
| Income Deficit | 56 | $0 |
| Wage / Income Gap (%) | 273 | 0.00% |
| Wage / Income Gap ($) | 273 | 100.00¢ per $1 |
| Gini / Inequality Index | 273 | 0.30 |
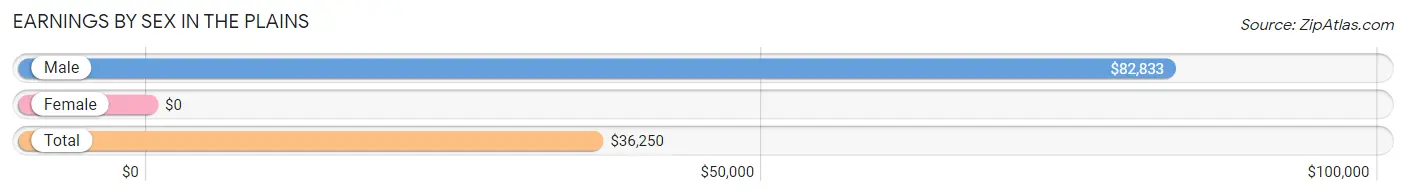
Earnings by Sex in The Plains
| Sex | Number | Average Earnings |
| Male | 86 (56.2%) | $82,833 |
| Female | 67 (43.8%) | $0 |
| Total | 153 (100.0%) | $36,250 |
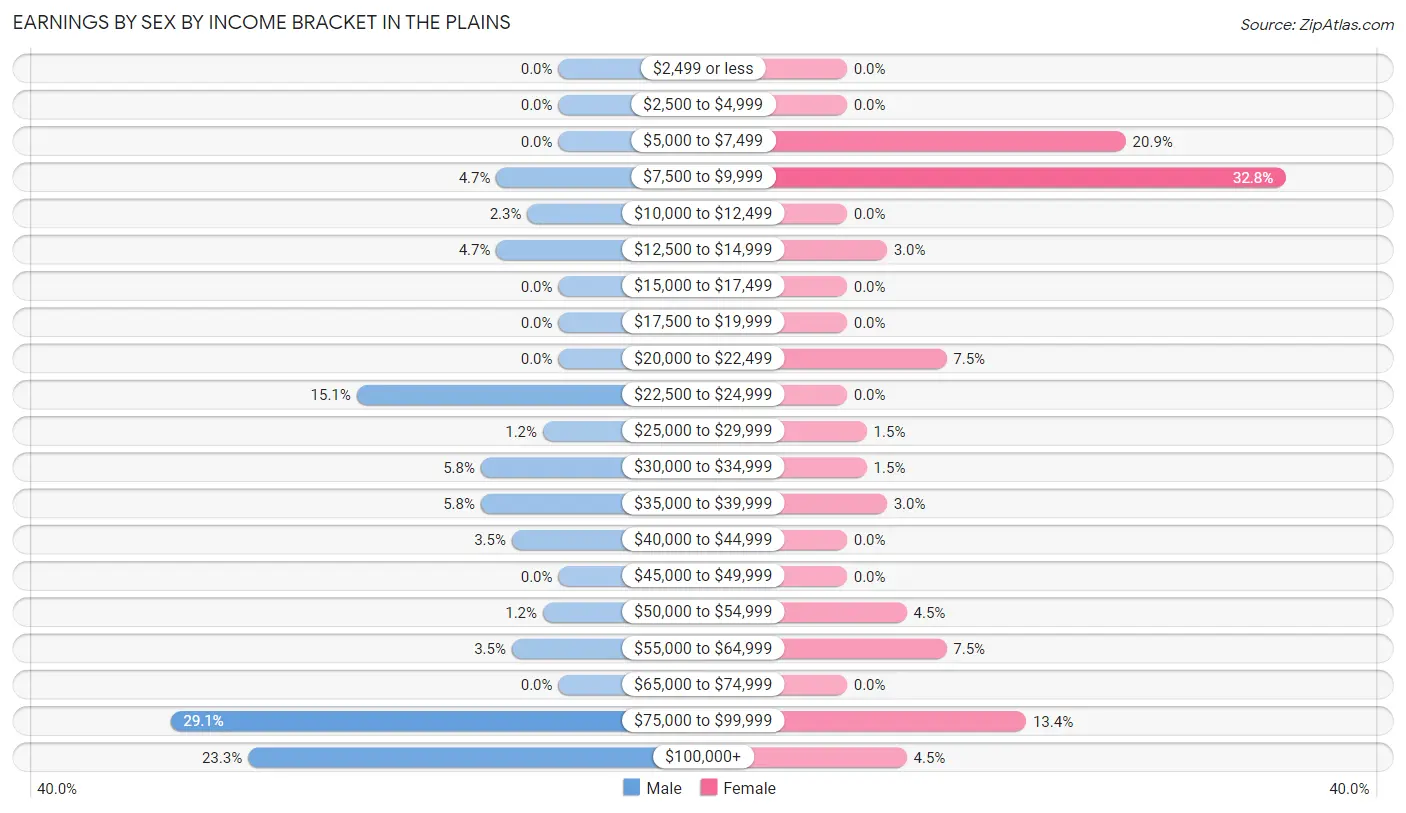
Earnings by Sex by Income Bracket in The Plains
The most common earnings brackets in The Plains are $75,000 to $99,999 for men (25 | 29.1%) and $7,500 to $9,999 for women (22 | 32.8%).
| Income | Male | Female |
| $2,499 or less | 0 (0.0%) | 0 (0.0%) |
| $2,500 to $4,999 | 0 (0.0%) | 0 (0.0%) |
| $5,000 to $7,499 | 0 (0.0%) | 14 (20.9%) |
| $7,500 to $9,999 | 4 (4.6%) | 22 (32.8%) |
| $10,000 to $12,499 | 2 (2.3%) | 0 (0.0%) |
| $12,500 to $14,999 | 4 (4.6%) | 2 (3.0%) |
| $15,000 to $17,499 | 0 (0.0%) | 0 (0.0%) |
| $17,500 to $19,999 | 0 (0.0%) | 0 (0.0%) |
| $20,000 to $22,499 | 0 (0.0%) | 5 (7.5%) |
| $22,500 to $24,999 | 13 (15.1%) | 0 (0.0%) |
| $25,000 to $29,999 | 1 (1.2%) | 1 (1.5%) |
| $30,000 to $34,999 | 5 (5.8%) | 1 (1.5%) |
| $35,000 to $39,999 | 5 (5.8%) | 2 (3.0%) |
| $40,000 to $44,999 | 3 (3.5%) | 0 (0.0%) |
| $45,000 to $49,999 | 0 (0.0%) | 0 (0.0%) |
| $50,000 to $54,999 | 1 (1.2%) | 3 (4.5%) |
| $55,000 to $64,999 | 3 (3.5%) | 5 (7.5%) |
| $65,000 to $74,999 | 0 (0.0%) | 0 (0.0%) |
| $75,000 to $99,999 | 25 (29.1%) | 9 (13.4%) |
| $100,000+ | 20 (23.3%) | 3 (4.5%) |
| Total | 86 (100.0%) | 67 (100.0%) |
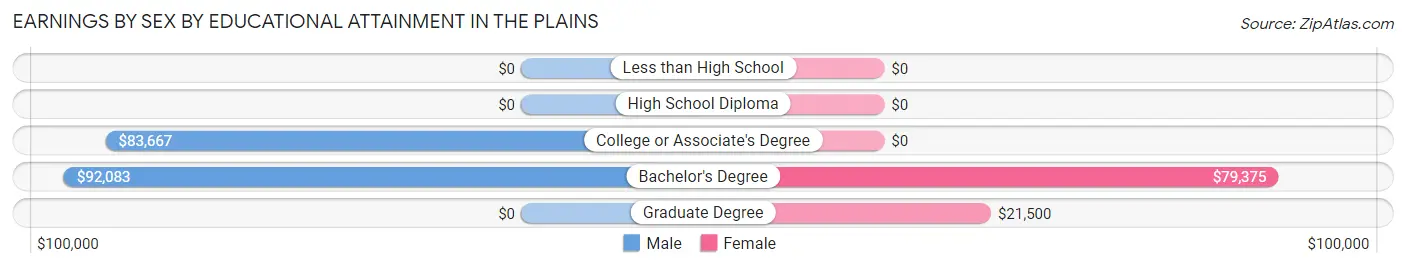
Earnings by Sex by Educational Attainment in The Plains
| Educational Attainment | Male Income | Female Income |
| Less than High School | - | - |
| High School Diploma | - | - |
| College or Associate's Degree | $83,667 | $0 |
| Bachelor's Degree | $92,083 | $79,375 |
| Graduate Degree | - | - |
| Total | $84,333 | $0 |
Family Income in The Plains
Family Income Brackets in The Plains
According to the The Plains family income data, there are 33 families falling into the $100,000 to $149,999 income range, which is the most common income bracket and makes up 58.9% of all families.
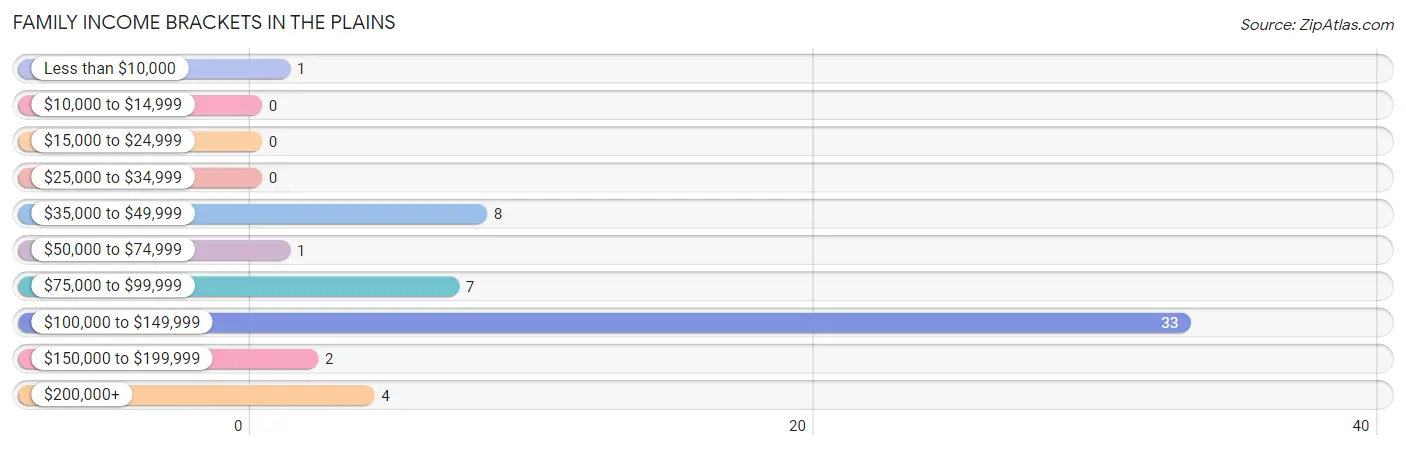
| Income Bracket | # Families | % Families |
| Less than $10,000 | 1 | 1.8% |
| $10,000 to $14,999 | 0 | 0.0% |
| $15,000 to $24,999 | 0 | 0.0% |
| $25,000 to $34,999 | 0 | 0.0% |
| $35,000 to $49,999 | 8 | 14.3% |
| $50,000 to $74,999 | 1 | 1.8% |
| $75,000 to $99,999 | 7 | 12.5% |
| $100,000 to $149,999 | 33 | 58.9% |
| $150,000 to $199,999 | 2 | 3.6% |
| $200,000+ | 4 | 7.1% |
Family Income by Famaliy Size in The Plains
| Income Bracket | # Families | Median Income |
| 2-Person Families | 17 (30.4%) | $0 |
| 3-Person Families | 2 (3.6%) | $0 |
| 4-Person Families | 16 (28.6%) | $0 |
| 5-Person Families | 18 (32.1%) | $0 |
| 6-Person Families | 3 (5.4%) | $0 |
| 7+ Person Families | 0 (0.0%) | $0 |
| Total | 56 (100.0%) | $109,333 |
Family Income by Number of Earners in The Plains
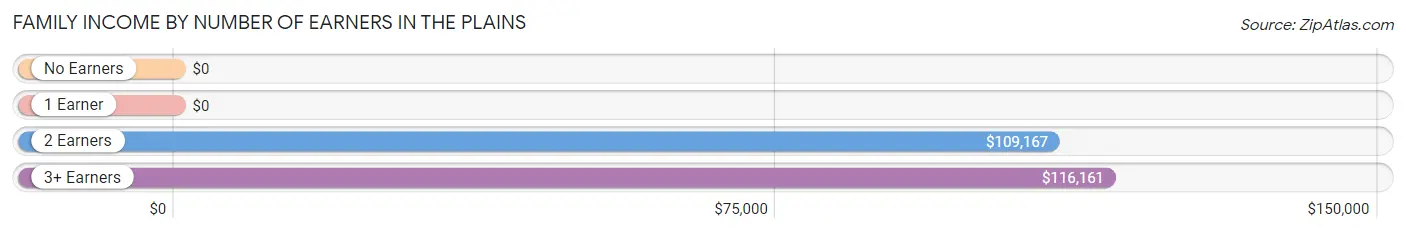
| Number of Earners | # Families | Median Income |
| No Earners | 1 (1.8%) | $0 |
| 1 Earner | 14 (25.0%) | $0 |
| 2 Earners | 22 (39.3%) | $109,167 |
| 3+ Earners | 19 (33.9%) | $116,161 |
| Total | 56 (100.0%) | $109,333 |
Household Income in The Plains
Household Income Brackets in The Plains
With 37 households falling in the category, the $100,000 to $149,999 income range is the most frequent in The Plains, accounting for 39.8% of all households.
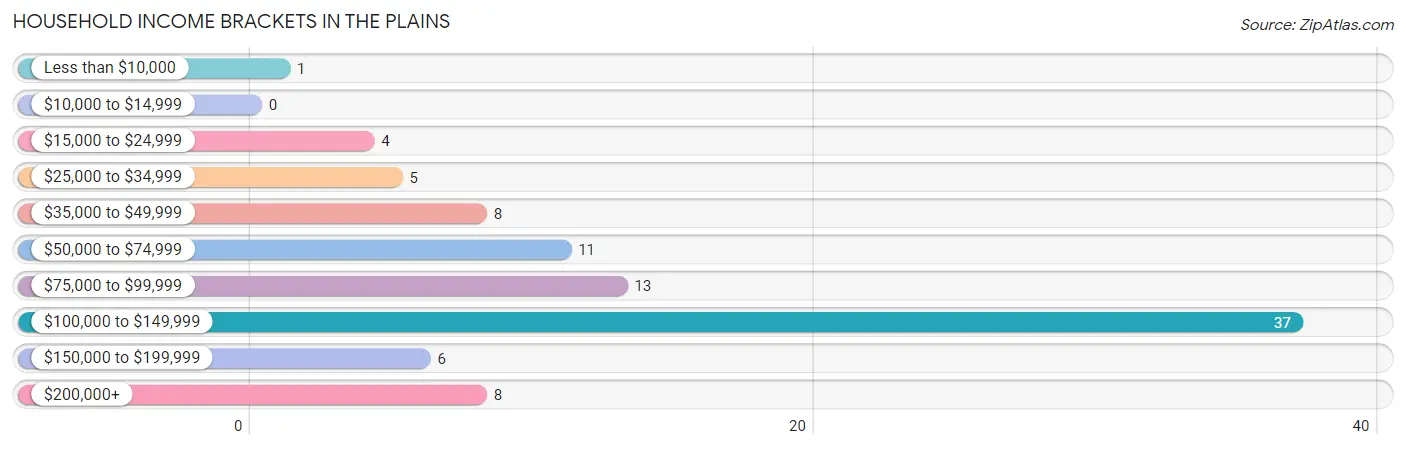
| Income Bracket | # Households | % Households |
| Less than $10,000 | 1 | 1.1% |
| $10,000 to $14,999 | 0 | 0.0% |
| $15,000 to $24,999 | 4 | 4.3% |
| $25,000 to $34,999 | 5 | 5.4% |
| $35,000 to $49,999 | 8 | 8.6% |
| $50,000 to $74,999 | 11 | 11.8% |
| $75,000 to $99,999 | 13 | 14.0% |
| $100,000 to $149,999 | 37 | 39.8% |
| $150,000 to $199,999 | 6 | 6.5% |
| $200,000+ | 8 | 8.6% |
Household Income by Householder Age in The Plains
The median household income in The Plains is $108,250, with the highest median household income of $109,667 found in the 45 to 64 years age bracket for the primary householder. A total of 58 households (62.4%) fall into this category.
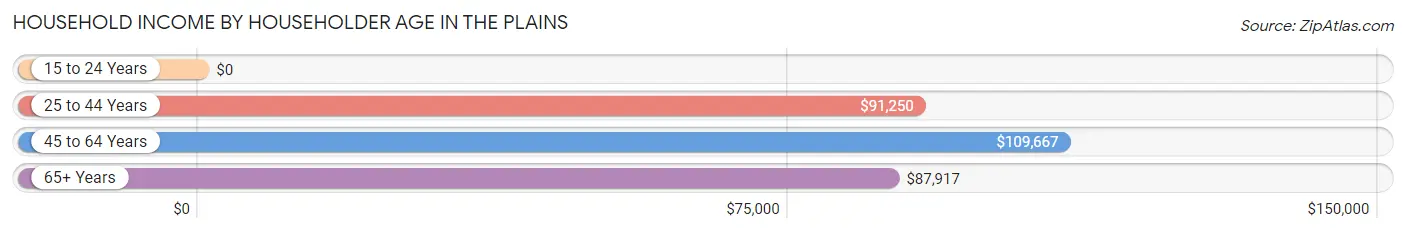
| Income Bracket | # Households | Median Income |
| 15 to 24 Years | 0 (0.0%) | $0 |
| 25 to 44 Years | 24 (25.8%) | $91,250 |
| 45 to 64 Years | 58 (62.4%) | $109,667 |
| 65+ Years | 11 (11.8%) | $87,917 |
| Total | 93 (100.0%) | $108,250 |
Poverty in The Plains
Income Below Poverty by Sex and Age in The Plains
With 0.8% poverty level for males and 17.6% for females among the residents of The Plains, 15 year old males and 45 to 54 year old females are the most vulnerable to poverty, with 1 males (100.0%) and 21 females (46.7%) in their respective age groups living below the poverty level.
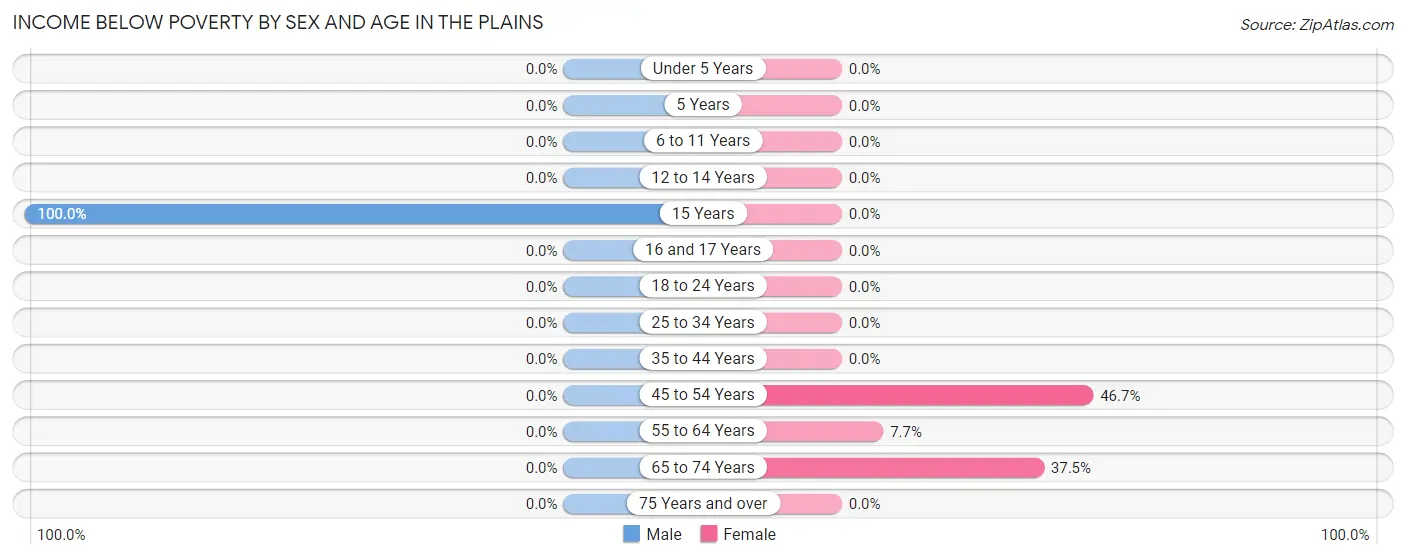
| Age Bracket | Male | Female |
| Under 5 Years | 0 (0.0%) | 0 (0.0%) |
| 5 Years | 0 (0.0%) | 0 (0.0%) |
| 6 to 11 Years | 0 (0.0%) | 0 (0.0%) |
| 12 to 14 Years | 0 (0.0%) | 0 (0.0%) |
| 15 Years | 1 (100.0%) | 0 (0.0%) |
| 16 and 17 Years | 0 (0.0%) | 0 (0.0%) |
| 18 to 24 Years | 0 (0.0%) | 0 (0.0%) |
| 25 to 34 Years | 0 (0.0%) | 0 (0.0%) |
| 35 to 44 Years | 0 (0.0%) | 0 (0.0%) |
| 45 to 54 Years | 0 (0.0%) | 21 (46.7%) |
| 55 to 64 Years | 0 (0.0%) | 1 (7.7%) |
| 65 to 74 Years | 0 (0.0%) | 3 (37.5%) |
| 75 Years and over | 0 (0.0%) | 0 (0.0%) |
| Total | 1 (0.8%) | 25 (17.6%) |
Income Above Poverty by Sex and Age in The Plains
According to the poverty statistics in The Plains, males aged under 5 years and females aged under 5 years are the age groups that are most secure financially, with 100.0% of males and 100.0% of females in these age groups living above the poverty line.
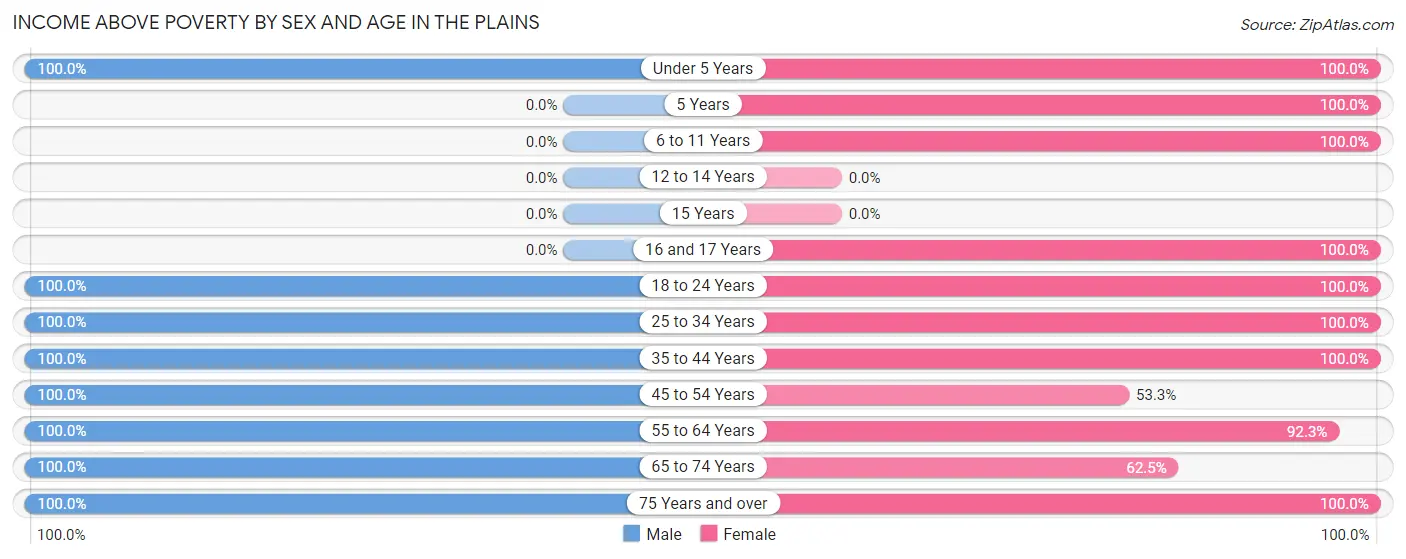
| Age Bracket | Male | Female |
| Under 5 Years | 28 (100.0%) | 5 (100.0%) |
| 5 Years | 0 (0.0%) | 5 (100.0%) |
| 6 to 11 Years | 0 (0.0%) | 9 (100.0%) |
| 12 to 14 Years | 0 (0.0%) | 0 (0.0%) |
| 15 Years | 0 (0.0%) | 0 (0.0%) |
| 16 and 17 Years | 0 (0.0%) | 10 (100.0%) |
| 18 to 24 Years | 18 (100.0%) | 22 (100.0%) |
| 25 to 34 Years | 10 (100.0%) | 7 (100.0%) |
| 35 to 44 Years | 3 (100.0%) | 13 (100.0%) |
| 45 to 54 Years | 31 (100.0%) | 24 (53.3%) |
| 55 to 64 Years | 25 (100.0%) | 12 (92.3%) |
| 65 to 74 Years | 8 (100.0%) | 5 (62.5%) |
| 75 Years and over | 7 (100.0%) | 5 (100.0%) |
| Total | 130 (99.2%) | 117 (82.4%) |
Income Below Poverty Among Married-Couple Families in The Plains
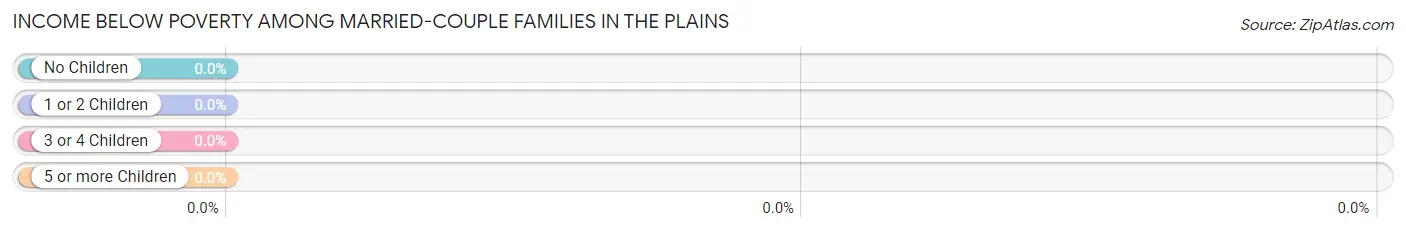
| Children | Above Poverty | Below Poverty |
| No Children | 14 (100.0%) | 0 (0.0%) |
| 1 or 2 Children | 19 (100.0%) | 0 (0.0%) |
| 3 or 4 Children | 0 (0.0%) | 0 (0.0%) |
| 5 or more Children | 0 (0.0%) | 0 (0.0%) |
| Total | 33 (100.0%) | 0 (0.0%) |
Income Below Poverty Among Single-Parent Households in The Plains
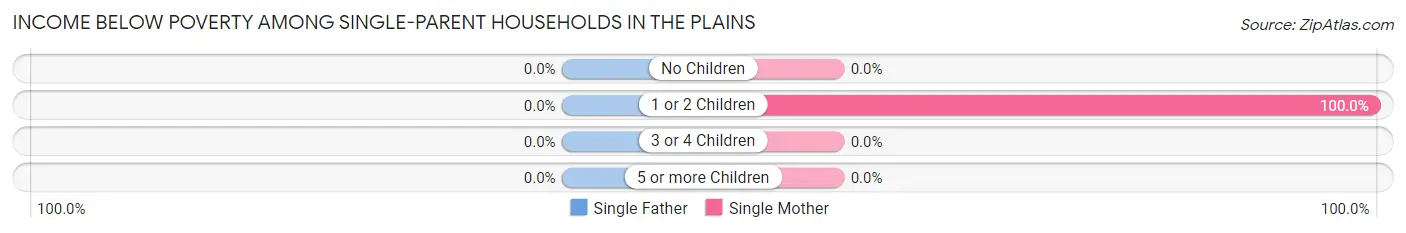
| Children | Single Father | Single Mother |
| No Children | 0 (0.0%) | 0 (0.0%) |
| 1 or 2 Children | 0 (0.0%) | 1 (100.0%) |
| 3 or 4 Children | 0 (0.0%) | 0 (0.0%) |
| 5 or more Children | 0 (0.0%) | 0 (0.0%) |
| Total | 0 (0.0%) | 1 (50.0%) |
Income Below Poverty Among Married-Couple vs Single-Parent Households in The Plains
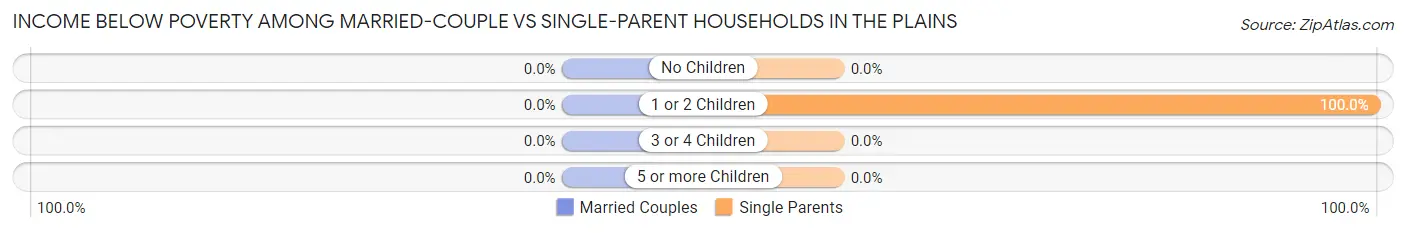
| Children | Married-Couple Families | Single-Parent Households |
| No Children | 0 (0.0%) | 0 (0.0%) |
| 1 or 2 Children | 0 (0.0%) | 1 (100.0%) |
| 3 or 4 Children | 0 (0.0%) | 0 (0.0%) |
| 5 or more Children | 0 (0.0%) | 0 (0.0%) |
| Total | 0 (0.0%) | 1 (4.3%) |
Race in The Plains
The most populous races in The Plains are White / Caucasian (175 | 64.1%), Hispanic or Latino (73 | 26.7%), and Some other Race (57 | 20.9%).
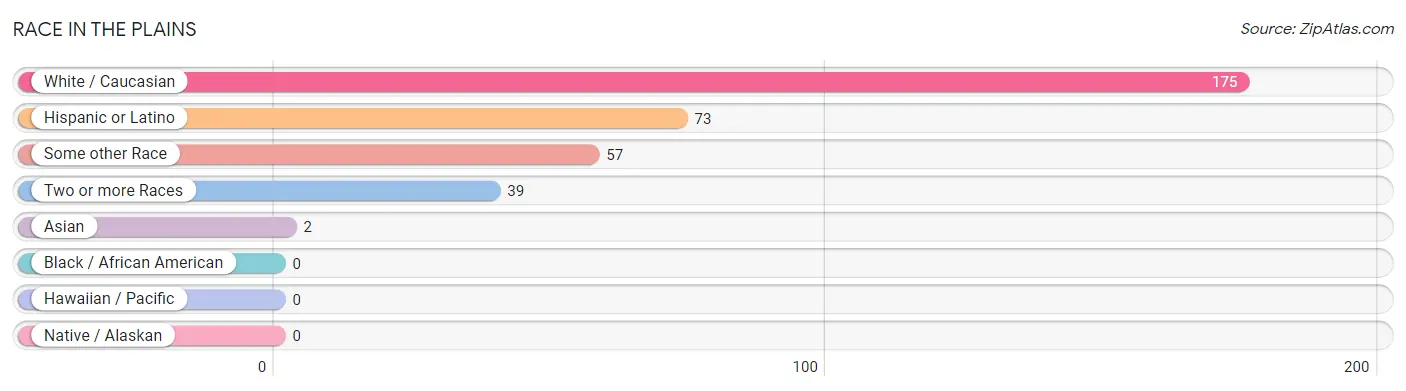
| Race | # Population | % Population |
| Asian | 2 | 0.7% |
| Black / African American | 0 | 0.0% |
| Hawaiian / Pacific | 0 | 0.0% |
| Hispanic or Latino | 73 | 26.7% |
| Native / Alaskan | 0 | 0.0% |
| White / Caucasian | 175 | 64.1% |
| Two or more Races | 39 | 14.3% |
| Some other Race | 57 | 20.9% |
| Total | 273 | 100.0% |
Ancestry in The Plains
The most populous ancestries reported in The Plains are Irish (81 | 29.7%), Mexican (70 | 25.6%), German (59 | 21.6%), American (46 | 16.9%), and English (16 | 5.9%), together accounting for 99.6% of all The Plains residents.
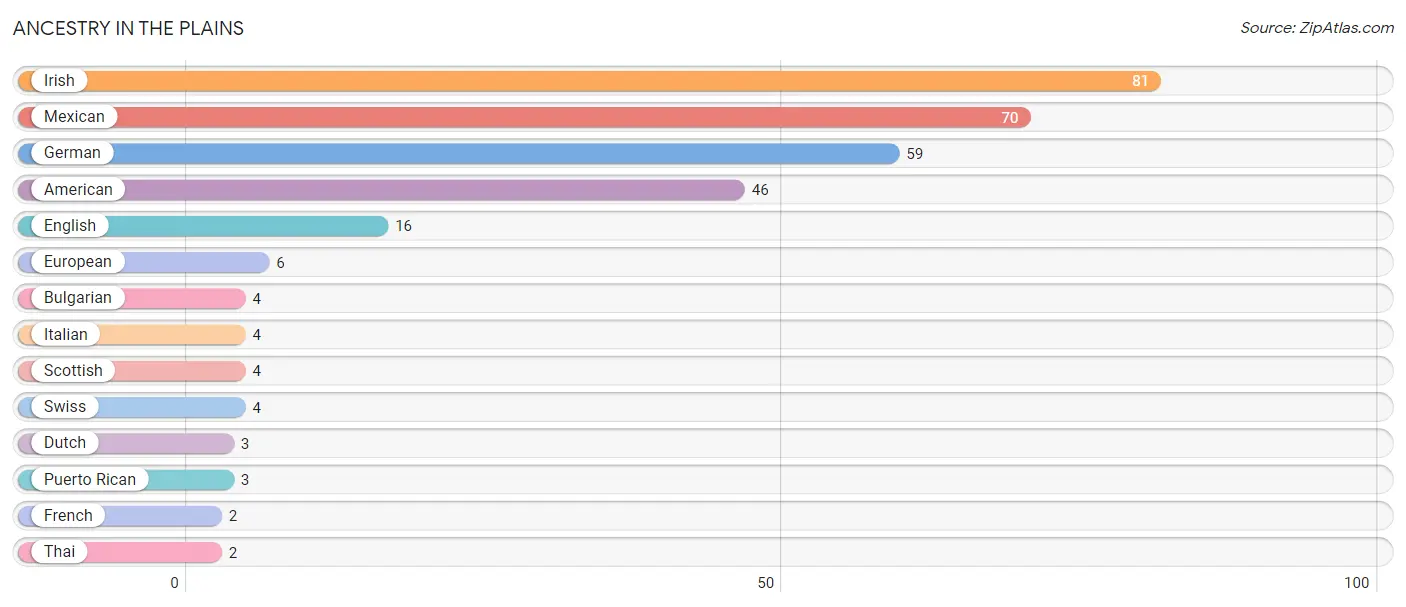
| Ancestry | # Population | % Population |
| American | 46 | 16.9% |
| Bulgarian | 4 | 1.5% |
| Dutch | 3 | 1.1% |
| English | 16 | 5.9% |
| European | 6 | 2.2% |
| French | 2 | 0.7% |
| German | 59 | 21.6% |
| Irish | 81 | 29.7% |
| Italian | 4 | 1.5% |
| Mexican | 70 | 25.6% |
| Puerto Rican | 3 | 1.1% |
| Scottish | 4 | 1.5% |
| Swiss | 4 | 1.5% |
| Thai | 2 | 0.7% | View All 14 Rows |
Immigrants in The Plains
The most numerous immigrant groups reported in The Plains came from Central America (36 | 13.2%), Latin America (36 | 13.2%), Mexico (36 | 13.2%), Europe (7 | 2.6%), and Bulgaria (4 | 1.5%), together accounting for 43.6% of all The Plains residents.
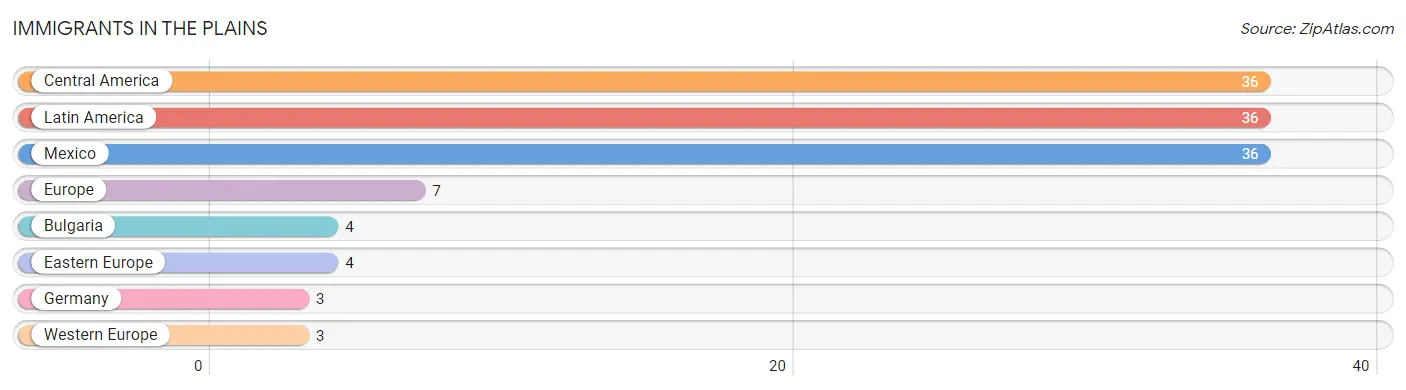
| Immigration Origin | # Population | % Population |
| Bulgaria | 4 | 1.5% |
| Central America | 36 | 13.2% |
| Eastern Europe | 4 | 1.5% |
| Europe | 7 | 2.6% |
| Germany | 3 | 1.1% |
| Latin America | 36 | 13.2% |
| Mexico | 36 | 13.2% |
| Western Europe | 3 | 1.1% | View All 8 Rows |
Sex and Age in The Plains
Sex and Age in The Plains
The most populous age groups in The Plains are Under 5 Years (28 | 21.4%) for men and 45 to 49 Years (40 | 28.2%) for women.
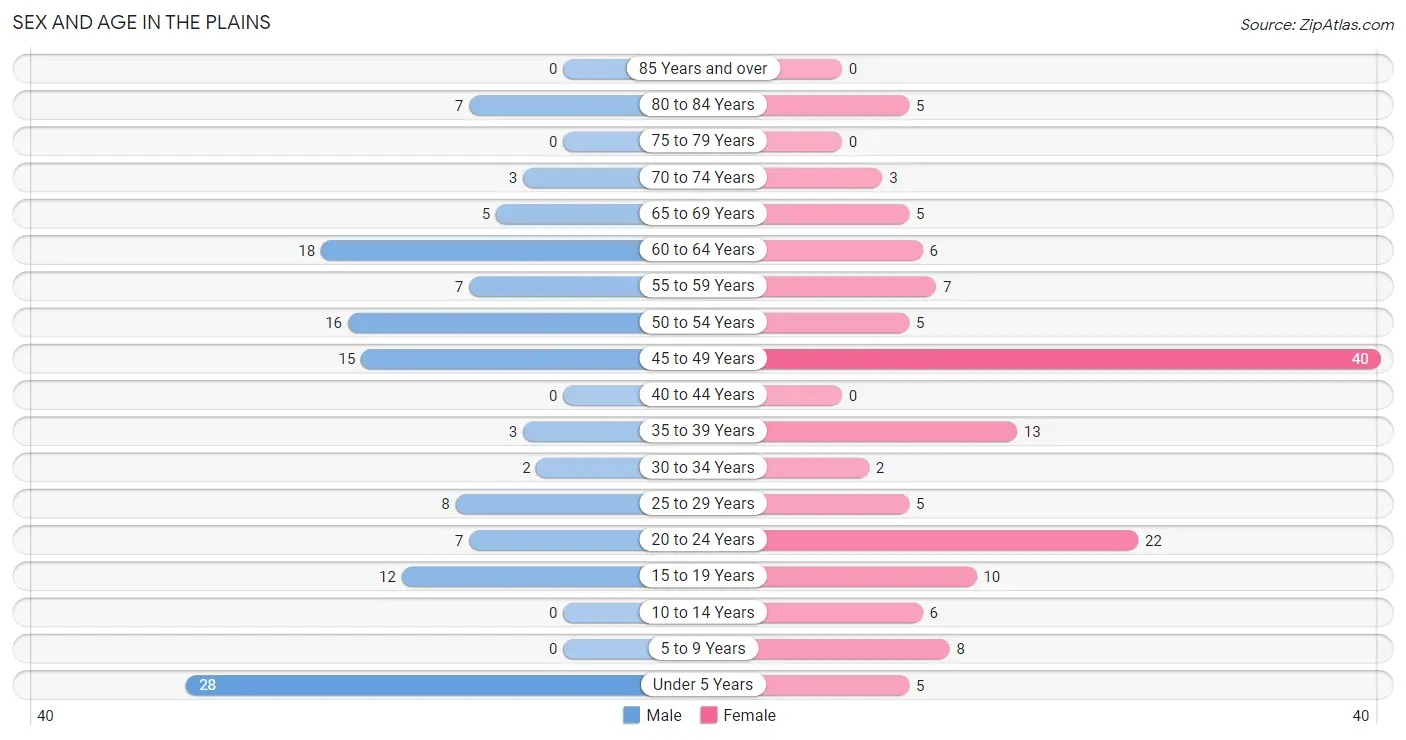
| Age Bracket | Male | Female |
| Under 5 Years | 28 (21.4%) | 5 (3.5%) |
| 5 to 9 Years | 0 (0.0%) | 8 (5.6%) |
| 10 to 14 Years | 0 (0.0%) | 6 (4.2%) |
| 15 to 19 Years | 12 (9.2%) | 10 (7.0%) |
| 20 to 24 Years | 7 (5.3%) | 22 (15.5%) |
| 25 to 29 Years | 8 (6.1%) | 5 (3.5%) |
| 30 to 34 Years | 2 (1.5%) | 2 (1.4%) |
| 35 to 39 Years | 3 (2.3%) | 13 (9.1%) |
| 40 to 44 Years | 0 (0.0%) | 0 (0.0%) |
| 45 to 49 Years | 15 (11.5%) | 40 (28.2%) |
| 50 to 54 Years | 16 (12.2%) | 5 (3.5%) |
| 55 to 59 Years | 7 (5.3%) | 7 (4.9%) |
| 60 to 64 Years | 18 (13.7%) | 6 (4.2%) |
| 65 to 69 Years | 5 (3.8%) | 5 (3.5%) |
| 70 to 74 Years | 3 (2.3%) | 3 (2.1%) |
| 75 to 79 Years | 0 (0.0%) | 0 (0.0%) |
| 80 to 84 Years | 7 (5.3%) | 5 (3.5%) |
| 85 Years and over | 0 (0.0%) | 0 (0.0%) |
| Total | 131 (100.0%) | 142 (100.0%) |
Families and Households in The Plains
Median Family Size in The Plains
The median family size in The Plains is 3.66 persons per family, with married-couple families (33 | 58.9%) accounting for the largest median family size of 4.33 persons per family. On the other hand, single female/mother families (2 | 3.6%) represent the smallest median family size with 2.00 persons per family.
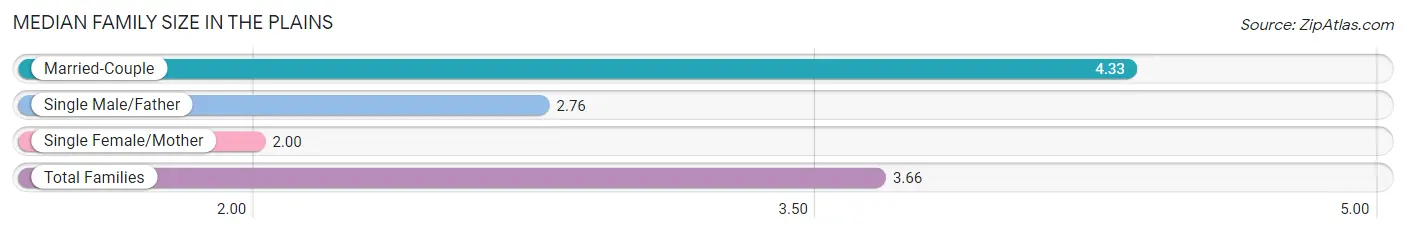
| Family Type | # Families | Family Size |
| Married-Couple | 33 (58.9%) | 4.33 |
| Single Male/Father | 21 (37.5%) | 2.76 |
| Single Female/Mother | 2 (3.6%) | 2.00 |
| Total Families | 56 (100.0%) | 3.66 |
Median Household Size in The Plains
The median household size in The Plains is 2.94 persons per household, with married-couple households (33 | 35.5%) accounting for the largest median household size of 4.33 persons per household. non-family households (37 | 39.8%) represent the smallest median household size with 1.27 persons per household.
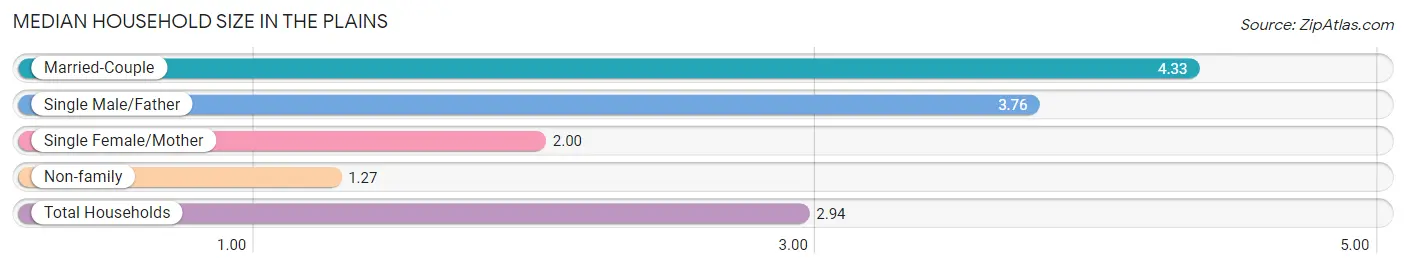
| Household Type | # Households | Household Size |
| Married-Couple | 33 (35.5%) | 4.33 |
| Single Male/Father | 21 (22.6%) | 3.76 |
| Single Female/Mother | 2 (2.1%) | 2.00 |
| Non-family | 37 (39.8%) | 1.27 |
| Total Households | 93 (100.0%) | 2.94 |
Household Size by Marriage Status in The Plains
Out of a total of 93 households in The Plains, 56 (60.2%) are family households, while 37 (39.8%) are nonfamily households. The most numerous type of family households are 6-person households, comprising 18, and the most common type of nonfamily households are 1-person households, comprising 27.
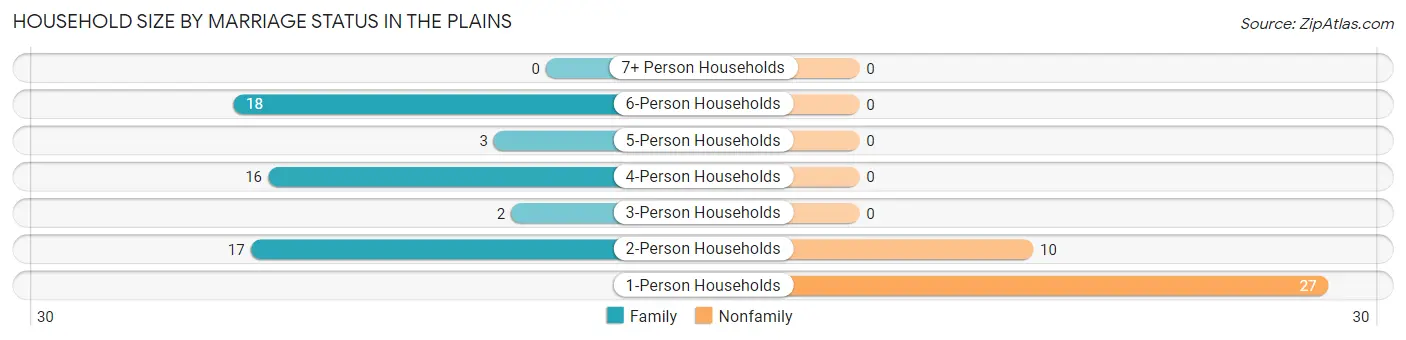
| Household Size | Family Households | Nonfamily Households |
| 1-Person Households | - | 27 (29.0%) |
| 2-Person Households | 17 (18.3%) | 10 (10.7%) |
| 3-Person Households | 2 (2.1%) | 0 (0.0%) |
| 4-Person Households | 16 (17.2%) | 0 (0.0%) |
| 5-Person Households | 3 (3.2%) | 0 (0.0%) |
| 6-Person Households | 18 (19.4%) | 0 (0.0%) |
| 7+ Person Households | 0 (0.0%) | 0 (0.0%) |
| Total | 56 (60.2%) | 37 (39.8%) |
Female Fertility in The Plains
Fertility by Age in The Plains
Average fertility rate in The Plains is 11.0 births per 1,000 women. Women in the age bracket of 20 to 34 years have the highest fertility rate with 34.0 births per 1,000 women. Women in the age bracket of 20 to 34 years acount for 100.0% of all women with births.
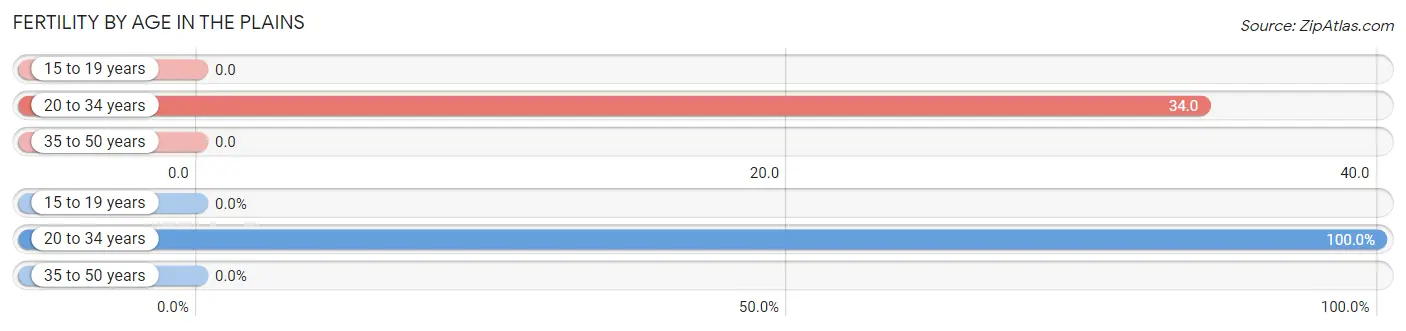
| Age Bracket | Women with Births | Births / 1,000 Women |
| 15 to 19 years | 0 (0.0%) | 0.0 |
| 20 to 34 years | 1 (100.0%) | 34.0 |
| 35 to 50 years | 0 (0.0%) | 0.0 |
| Total | 1 (100.0%) | 11.0 |
Fertility by Age by Marriage Status in The Plains
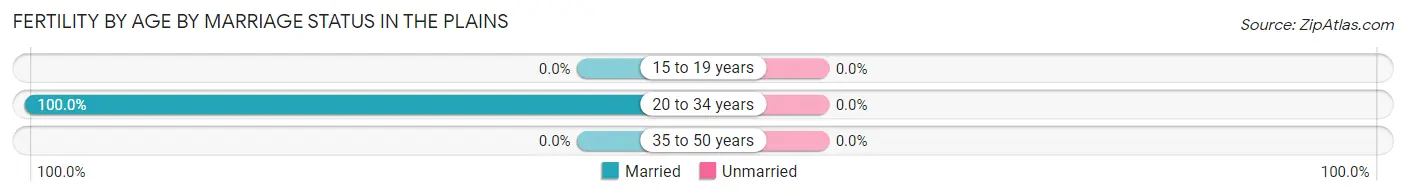
| Age Bracket | Married | Unmarried |
| 15 to 19 years | 0 (0.0%) | 0 (0.0%) |
| 20 to 34 years | 1 (100.0%) | 0 (0.0%) |
| 35 to 50 years | 0 (0.0%) | 0 (0.0%) |
| Total | 1 (100.0%) | 0 (0.0%) |
Fertility by Education in The Plains
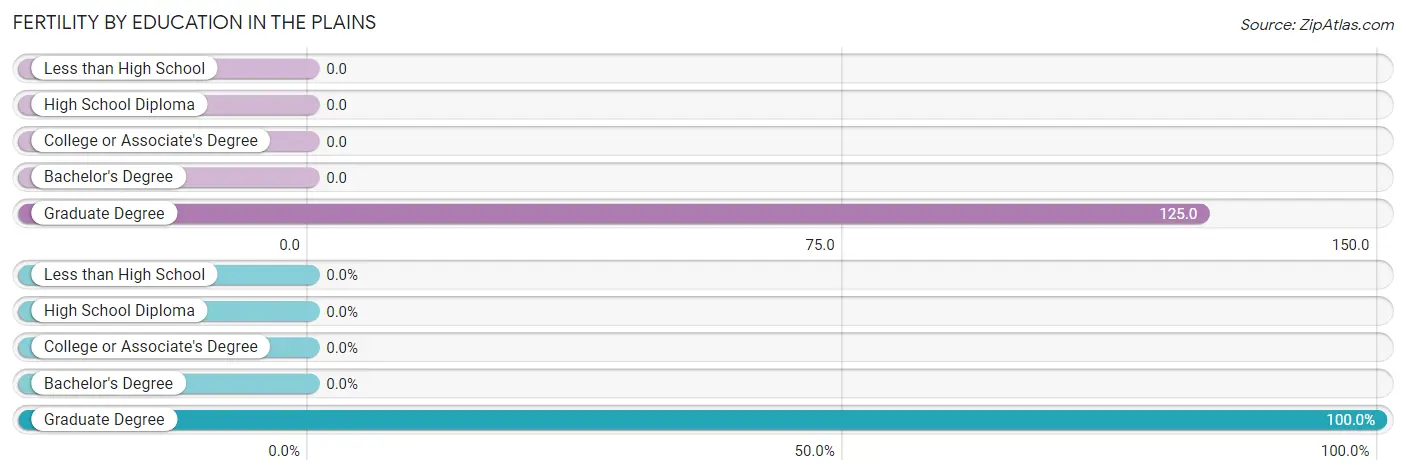
| Educational Attainment | Women with Births | Births / 1,000 Women |
| Less than High School | 0 (0.0%) | 0.0 |
| High School Diploma | 0 (0.0%) | 0.0 |
| College or Associate's Degree | 0 (0.0%) | 0.0 |
| Bachelor's Degree | 0 (0.0%) | 0.0 |
| Graduate Degree | 1 (100.0%) | 125.0 |
| Total | 1 (100.0%) | 11.0 |
Fertility by Education by Marriage Status in The Plains
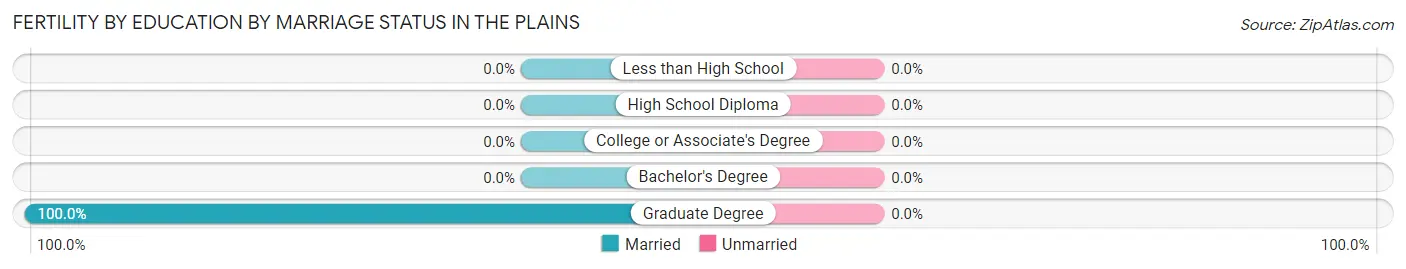
| Educational Attainment | Married | Unmarried |
| Less than High School | 0 (0.0%) | 0 (0.0%) |
| High School Diploma | 0 (0.0%) | 0 (0.0%) |
| College or Associate's Degree | 0 (0.0%) | 0 (0.0%) |
| Bachelor's Degree | 0 (0.0%) | 0 (0.0%) |
| Graduate Degree | 1 (100.0%) | 0 (0.0%) |
| Total | 1 (100.0%) | 0 (0.0%) |
Employment Characteristics in The Plains
Employment by Class of Employer in The Plains
Among the 149 employed individuals in The Plains, private company employees (78 | 52.3%), self-employed (not incorporated) (38 | 25.5%), and local government employees (19 | 12.8%) make up the most common classes of employment.
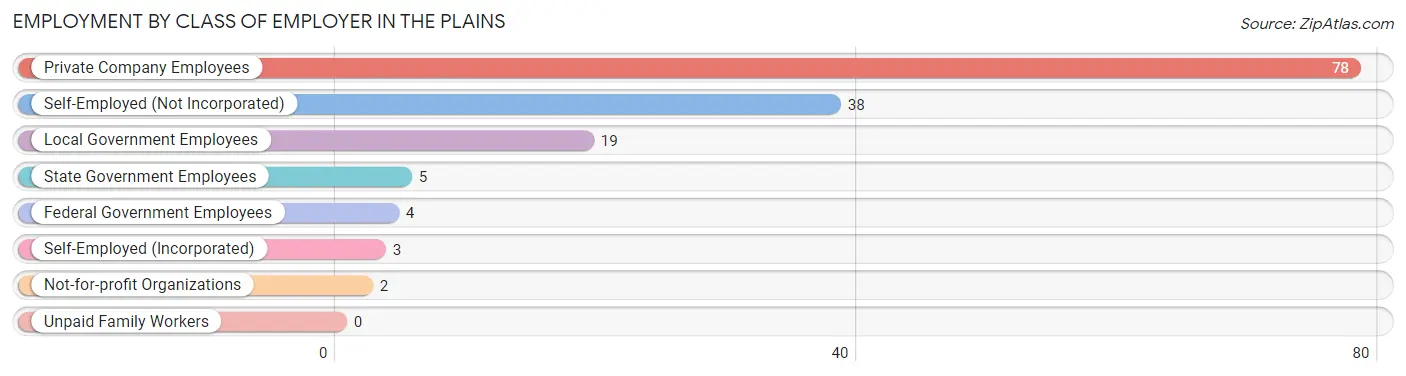
| Employer Class | # Employees | % Employees |
| Private Company Employees | 78 | 52.3% |
| Self-Employed (Incorporated) | 3 | 2.0% |
| Self-Employed (Not Incorporated) | 38 | 25.5% |
| Not-for-profit Organizations | 2 | 1.3% |
| Local Government Employees | 19 | 12.8% |
| State Government Employees | 5 | 3.4% |
| Federal Government Employees | 4 | 2.7% |
| Unpaid Family Workers | 0 | 0.0% |
| Total | 149 | 100.0% |
Employment Status by Age in The Plains
According to the labor force statistics for The Plains, out of the total population over 16 years of age (225), 66.7% or 150 individuals are in the labor force, with 0.7% or 1 of them unemployed. The age group with the highest labor force participation rate is 20 to 24 years, with 100.0% or 29 individuals in the labor force. Within the labor force, the 55 to 59 years age range has the highest percentage of unemployed individuals, with 10.0% or 1 of them being unemployed.
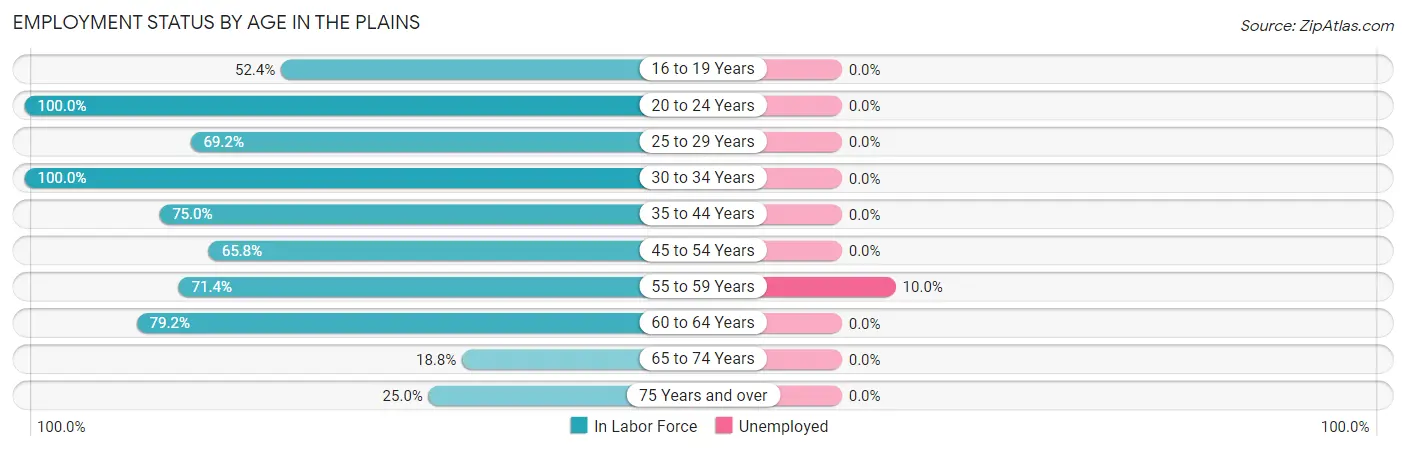
| Age Bracket | In Labor Force | Unemployed |
| 16 to 19 Years | 11 (52.4%) | 0 (0.0%) |
| 20 to 24 Years | 29 (100.0%) | 0 (0.0%) |
| 25 to 29 Years | 9 (69.2%) | 0 (0.0%) |
| 30 to 34 Years | 4 (100.0%) | 0 (0.0%) |
| 35 to 44 Years | 12 (75.0%) | 0 (0.0%) |
| 45 to 54 Years | 50 (65.8%) | 0 (0.0%) |
| 55 to 59 Years | 10 (71.4%) | 1 (10.0%) |
| 60 to 64 Years | 19 (79.2%) | 0 (0.0%) |
| 65 to 74 Years | 3 (18.8%) | 0 (0.0%) |
| 75 Years and over | 3 (25.0%) | 0 (0.0%) |
| Total | 150 (66.7%) | 1 (0.7%) |
Employment Status by Educational Attainment in The Plains
According to labor force statistics for The Plains, 70.7% of individuals (104) out of the total population between 25 and 64 years of age (147) are in the labor force, with 1.0% or 1 of them being unemployed. The group with the highest labor force participation rate are those with the educational attainment of college / associate degree, with 91.8% or 45 individuals in the labor force. Within the labor force, individuals with bachelor's degree or higher education have the highest percentage of unemployment, with 2.9% or 1 of them being unemployed.
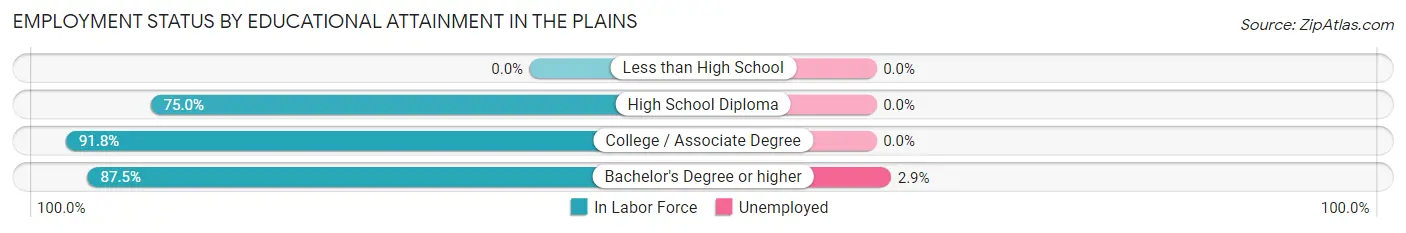
| Educational Attainment | In Labor Force | Unemployed |
| Less than High School | 0 (0.0%) | 0 (0.0%) |
| High School Diploma | 24 (75.0%) | 0 (0.0%) |
| College / Associate Degree | 45 (91.8%) | 0 (0.0%) |
| Bachelor's Degree or higher | 35 (87.5%) | 1 (2.9%) |
| Total | 104 (70.7%) | 1 (1.0%) |
Employment Occupations by Sex in The Plains
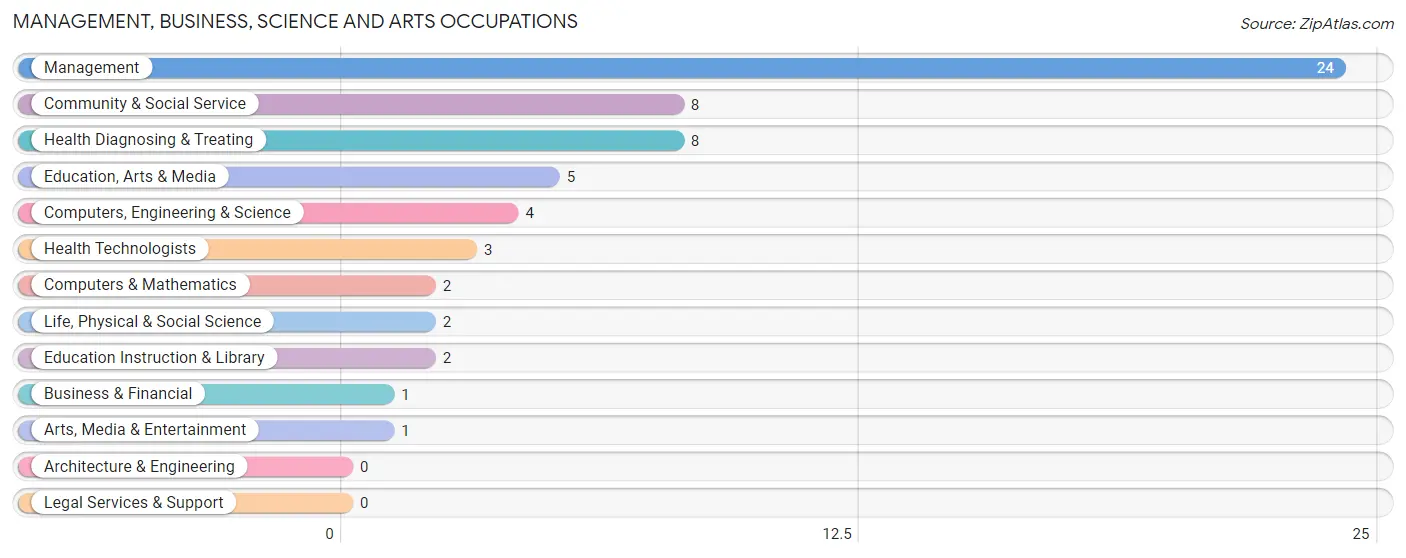
Management, Business, Science and Arts Occupations
The most common Management, Business, Science and Arts occupations in The Plains are Management (24 | 16.1%), Community & Social Service (8 | 5.4%), Health Diagnosing & Treating (8 | 5.4%), Education, Arts & Media (5 | 3.4%), and Computers, Engineering & Science (4 | 2.7%).
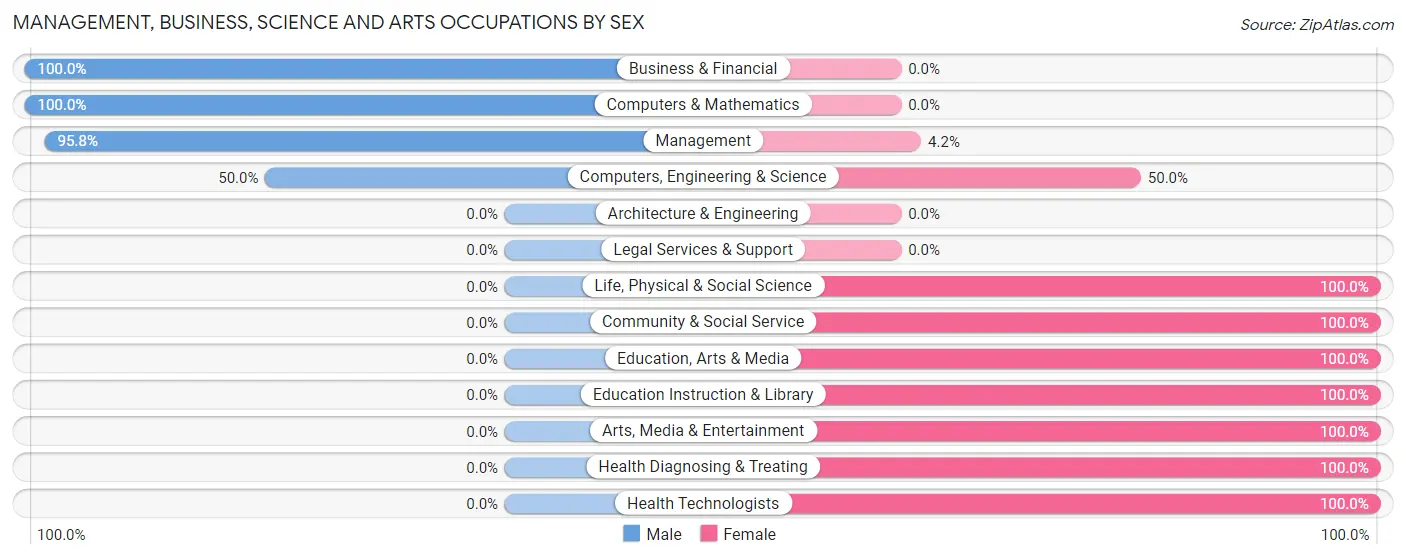
Management, Business, Science and Arts Occupations by Sex
Within the Management, Business, Science and Arts occupations in The Plains, the most male-oriented occupations are Business & Financial (100.0%), Computers & Mathematics (100.0%), and Management (95.8%), while the most female-oriented occupations are Life, Physical & Social Science (100.0%), Community & Social Service (100.0%), and Education, Arts & Media (100.0%).
| Occupation | Male | Female |
| Management | 23 (95.8%) | 1 (4.2%) |
| Business & Financial | 1 (100.0%) | 0 (0.0%) |
| Computers, Engineering & Science | 2 (50.0%) | 2 (50.0%) |
| Computers & Mathematics | 2 (100.0%) | 0 (0.0%) |
| Architecture & Engineering | 0 (0.0%) | 0 (0.0%) |
| Life, Physical & Social Science | 0 (0.0%) | 2 (100.0%) |
| Community & Social Service | 0 (0.0%) | 8 (100.0%) |
| Education, Arts & Media | 0 (0.0%) | 5 (100.0%) |
| Legal Services & Support | 0 (0.0%) | 0 (0.0%) |
| Education Instruction & Library | 0 (0.0%) | 2 (100.0%) |
| Arts, Media & Entertainment | 0 (0.0%) | 1 (100.0%) |
| Health Diagnosing & Treating | 0 (0.0%) | 8 (100.0%) |
| Health Technologists | 0 (0.0%) | 3 (100.0%) |
| Total (Category) | 26 (57.8%) | 19 (42.2%) |
| Total (Overall) | 82 (55.0%) | 67 (45.0%) |
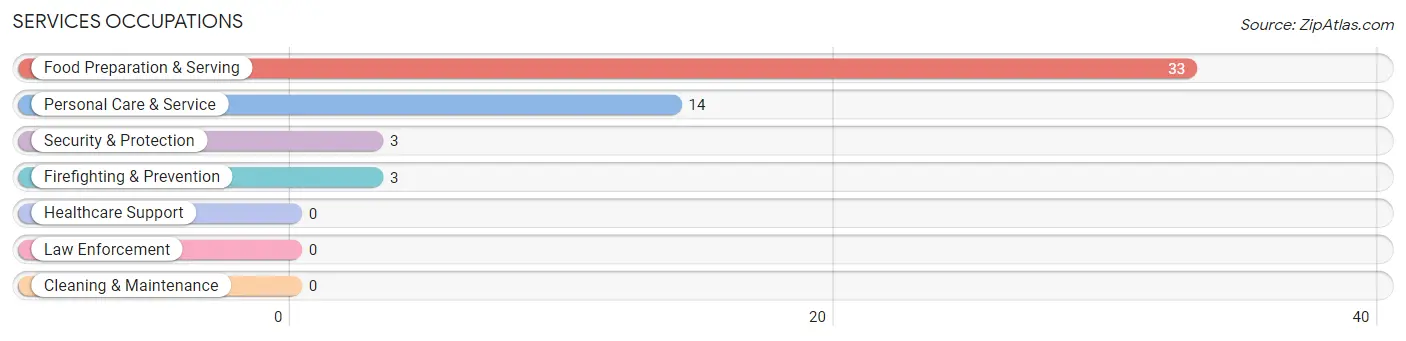
Services Occupations
The most common Services occupations in The Plains are Food Preparation & Serving (33 | 22.2%), Personal Care & Service (14 | 9.4%), Security & Protection (3 | 2.0%), and Firefighting & Prevention (3 | 2.0%).
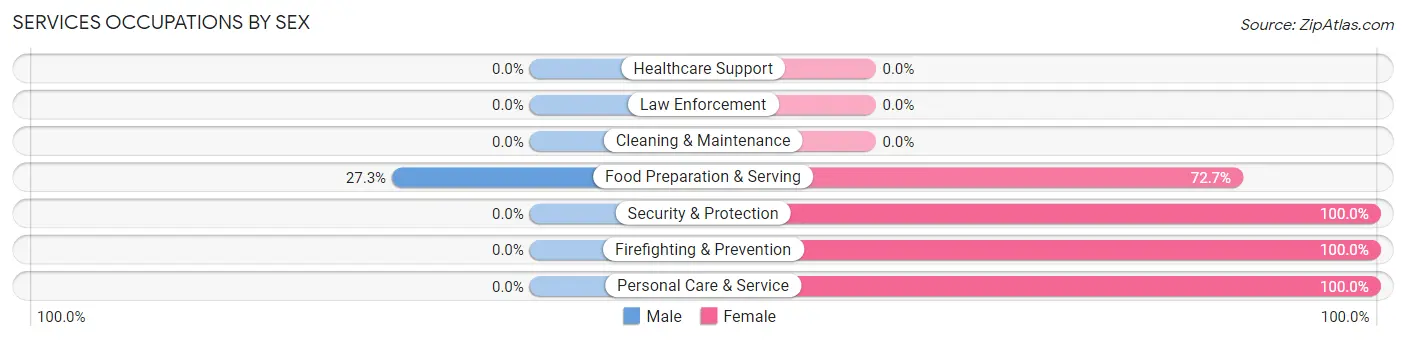
Services Occupations by Sex
| Occupation | Male | Female |
| Healthcare Support | 0 (0.0%) | 0 (0.0%) |
| Security & Protection | 0 (0.0%) | 3 (100.0%) |
| Firefighting & Prevention | 0 (0.0%) | 3 (100.0%) |
| Law Enforcement | 0 (0.0%) | 0 (0.0%) |
| Food Preparation & Serving | 9 (27.3%) | 24 (72.7%) |
| Cleaning & Maintenance | 0 (0.0%) | 0 (0.0%) |
| Personal Care & Service | 0 (0.0%) | 14 (100.0%) |
| Total (Category) | 9 (18.0%) | 41 (82.0%) |
| Total (Overall) | 82 (55.0%) | 67 (45.0%) |
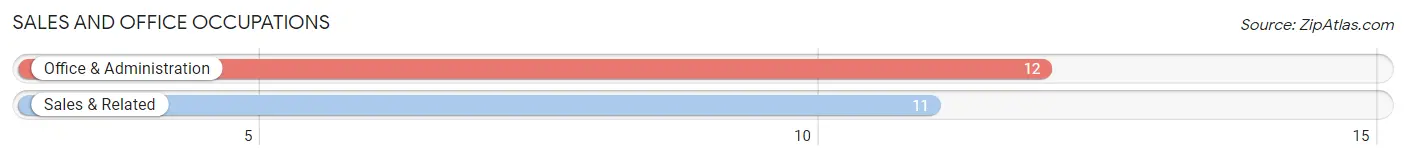
Sales and Office Occupations
The most common Sales and Office occupations in The Plains are Office & Administration (12 | 8.1%), and Sales & Related (11 | 7.4%).
Sales and Office Occupations by Sex
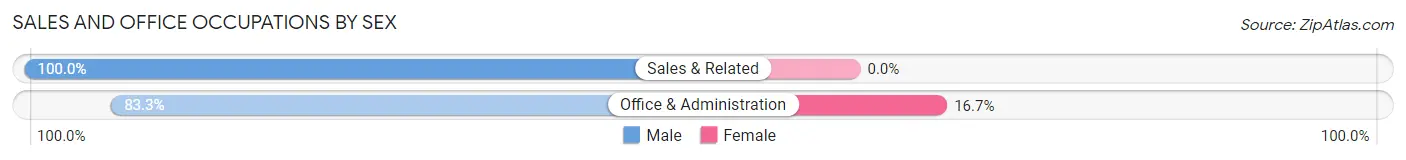
| Occupation | Male | Female |
| Sales & Related | 11 (100.0%) | 0 (0.0%) |
| Office & Administration | 10 (83.3%) | 2 (16.7%) |
| Total (Category) | 21 (91.3%) | 2 (8.7%) |
| Total (Overall) | 82 (55.0%) | 67 (45.0%) |
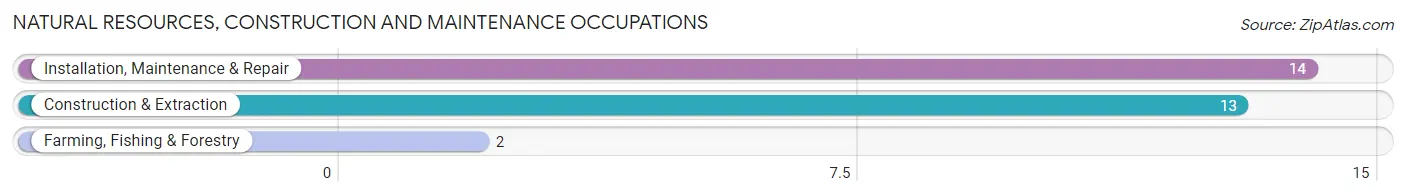
Natural Resources, Construction and Maintenance Occupations
The most common Natural Resources, Construction and Maintenance occupations in The Plains are Installation, Maintenance & Repair (14 | 9.4%), Construction & Extraction (13 | 8.7%), and Farming, Fishing & Forestry (2 | 1.3%).
Natural Resources, Construction and Maintenance Occupations by Sex
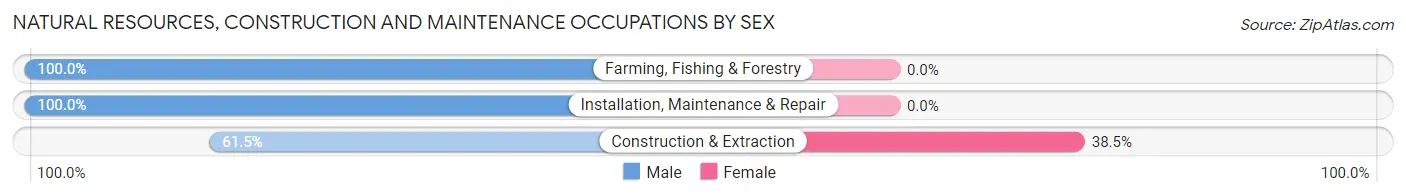
| Occupation | Male | Female |
| Farming, Fishing & Forestry | 2 (100.0%) | 0 (0.0%) |
| Construction & Extraction | 8 (61.5%) | 5 (38.5%) |
| Installation, Maintenance & Repair | 14 (100.0%) | 0 (0.0%) |
| Total (Category) | 24 (82.8%) | 5 (17.2%) |
| Total (Overall) | 82 (55.0%) | 67 (45.0%) |
Production, Transportation and Moving Occupations
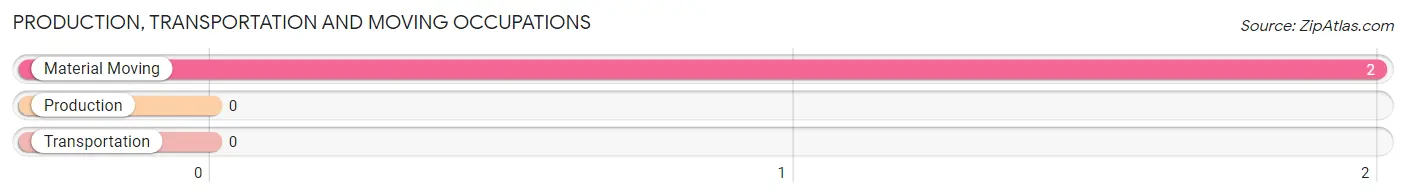
The most common Production, Transportation and Moving occupations in The Plains are , and Material Moving (2 | 1.3%).
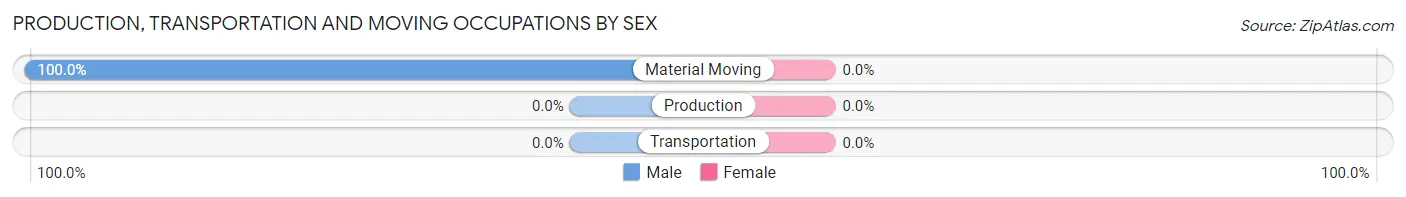
Production, Transportation and Moving Occupations by Sex
| Occupation | Male | Female |
| Production | 0 (0.0%) | 0 (0.0%) |
| Transportation | 0 (0.0%) | 0 (0.0%) |
| Material Moving | 2 (100.0%) | 0 (0.0%) |
| Total (Category) | 2 (100.0%) | 0 (0.0%) |
| Total (Overall) | 82 (55.0%) | 67 (45.0%) |
Employment Industries by Sex in The Plains
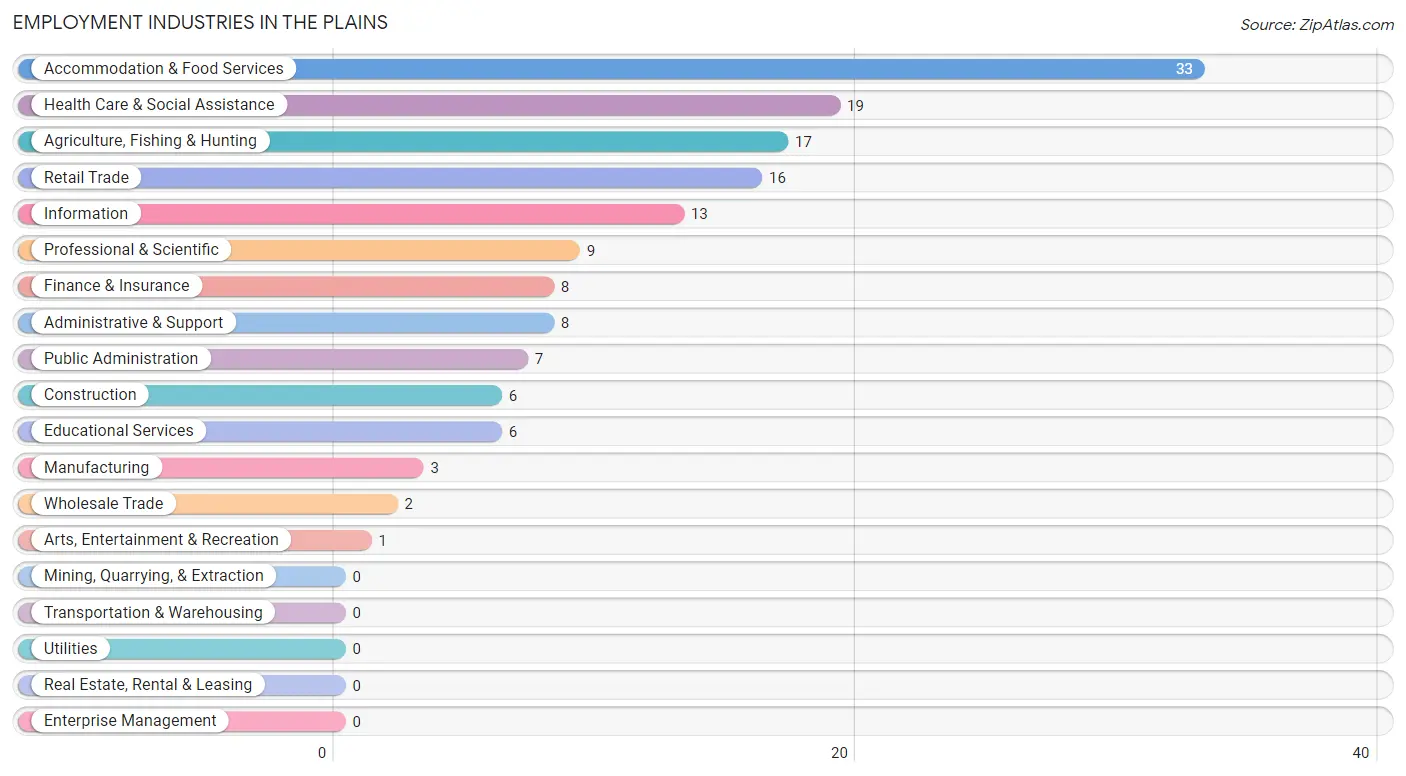
Employment Industries in The Plains
The major employment industries in The Plains include Accommodation & Food Services (33 | 22.2%), Health Care & Social Assistance (19 | 12.8%), Agriculture, Fishing & Hunting (17 | 11.4%), Retail Trade (16 | 10.7%), and Information (13 | 8.7%).
Employment Industries by Sex in The Plains
The The Plains industries that see more men than women are Agriculture, Fishing & Hunting (100.0%), Construction (100.0%), and Manufacturing (100.0%), whereas the industries that tend to have a higher number of women are Health Care & Social Assistance (100.0%), Arts, Entertainment & Recreation (100.0%), and Accommodation & Food Services (72.7%).
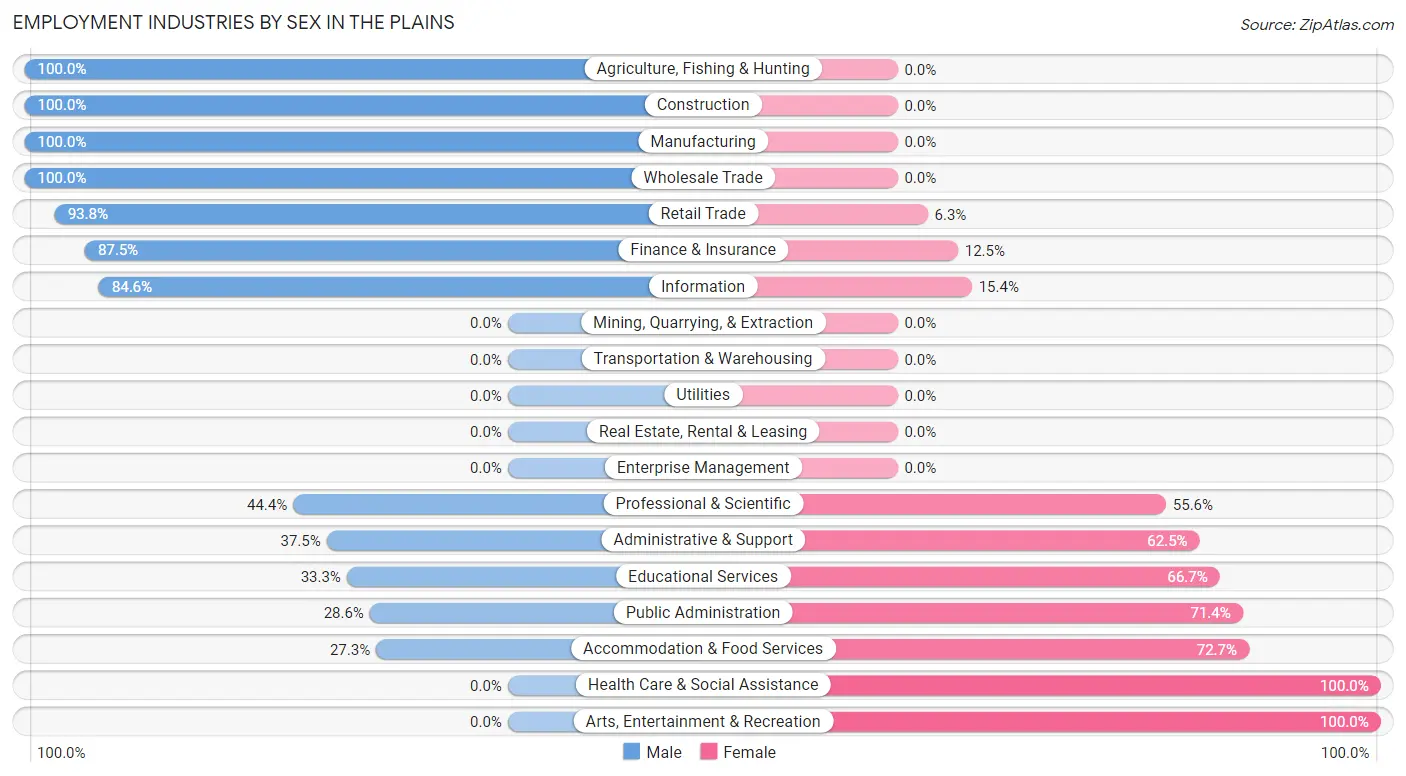
| Industry | Male | Female |
| Agriculture, Fishing & Hunting | 17 (100.0%) | 0 (0.0%) |
| Mining, Quarrying, & Extraction | 0 (0.0%) | 0 (0.0%) |
| Construction | 6 (100.0%) | 0 (0.0%) |
| Manufacturing | 3 (100.0%) | 0 (0.0%) |
| Wholesale Trade | 2 (100.0%) | 0 (0.0%) |
| Retail Trade | 15 (93.8%) | 1 (6.2%) |
| Transportation & Warehousing | 0 (0.0%) | 0 (0.0%) |
| Utilities | 0 (0.0%) | 0 (0.0%) |
| Information | 11 (84.6%) | 2 (15.4%) |
| Finance & Insurance | 7 (87.5%) | 1 (12.5%) |
| Real Estate, Rental & Leasing | 0 (0.0%) | 0 (0.0%) |
| Professional & Scientific | 4 (44.4%) | 5 (55.6%) |
| Enterprise Management | 0 (0.0%) | 0 (0.0%) |
| Administrative & Support | 3 (37.5%) | 5 (62.5%) |
| Educational Services | 2 (33.3%) | 4 (66.7%) |
| Health Care & Social Assistance | 0 (0.0%) | 19 (100.0%) |
| Arts, Entertainment & Recreation | 0 (0.0%) | 1 (100.0%) |
| Accommodation & Food Services | 9 (27.3%) | 24 (72.7%) |
| Public Administration | 2 (28.6%) | 5 (71.4%) |
| Total | 82 (55.0%) | 67 (45.0%) |
Education in The Plains
School Enrollment in The Plains
The most common levels of schooling among the 57 students in The Plains are high school (23 | 40.4%), college / undergraduate (13 | 22.8%), and middle school (6 | 10.5%).
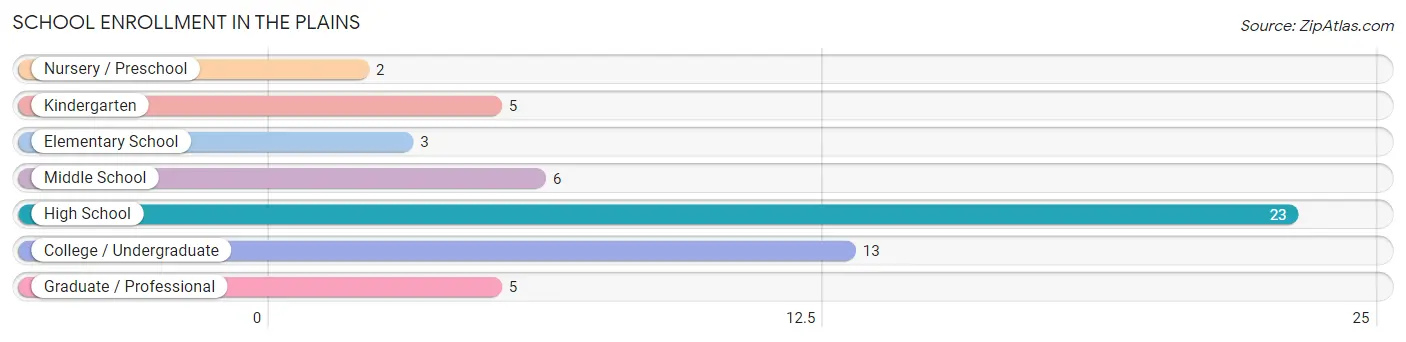
| School Level | # Students | % Students |
| Nursery / Preschool | 2 | 3.5% |
| Kindergarten | 5 | 8.8% |
| Elementary School | 3 | 5.3% |
| Middle School | 6 | 10.5% |
| High School | 23 | 40.4% |
| College / Undergraduate | 13 | 22.8% |
| Graduate / Professional | 5 | 8.8% |
| Total | 57 | 100.0% |
School Enrollment by Age by Funding Source in The Plains
Out of a total of 57 students who are enrolled in schools in The Plains, 2 (3.5%) attend a private institution, while the remaining 55 (96.5%) are enrolled in public schools. The age group of 3 to 4 year olds has the highest likelihood of being enrolled in private schools, with 2 (100.0% in the age bracket) enrolled. Conversely, the age group of 5 to 9 year old has the lowest likelihood of being enrolled in a private school, with 8 (100.0% in the age bracket) attending a public institution.
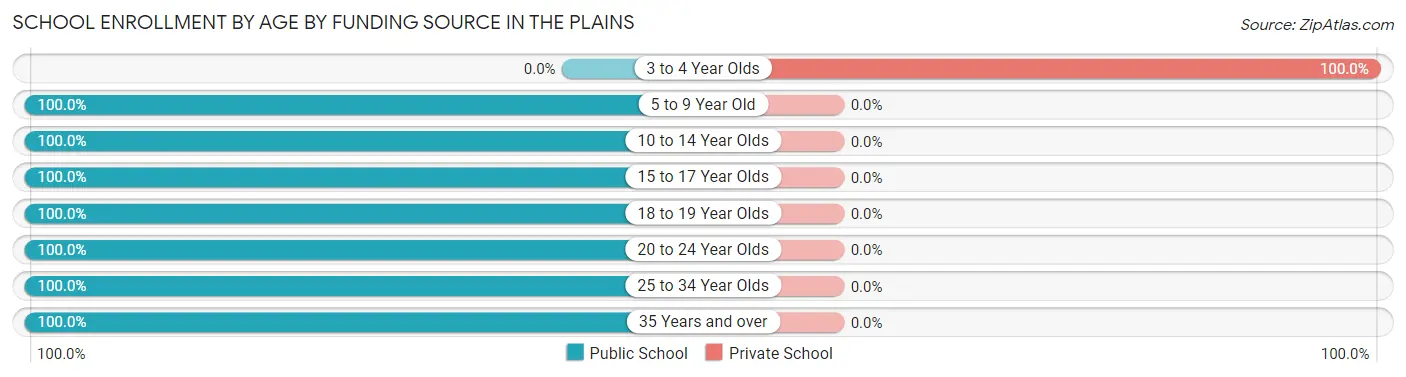
| Age Bracket | Public School | Private School |
| 3 to 4 Year Olds | 0 (0.0%) | 2 (100.0%) |
| 5 to 9 Year Old | 8 (100.0%) | 0 (0.0%) |
| 10 to 14 Year Olds | 6 (100.0%) | 0 (0.0%) |
| 15 to 17 Year Olds | 11 (100.0%) | 0 (0.0%) |
| 18 to 19 Year Olds | 9 (100.0%) | 0 (0.0%) |
| 20 to 24 Year Olds | 4 (100.0%) | 0 (0.0%) |
| 25 to 34 Year Olds | 2 (100.0%) | 0 (0.0%) |
| 35 Years and over | 15 (100.0%) | 0 (0.0%) |
| Total | 55 (96.5%) | 2 (3.5%) |
Educational Attainment by Field of Study in The Plains
Engineering (9 | 17.3%), education (7 | 13.5%), science & technology (6 | 11.5%), liberal arts & history (6 | 11.5%), and social sciences (5 | 9.6%) are the most common fields of study among 52 individuals in The Plains who have obtained a bachelor's degree or higher.
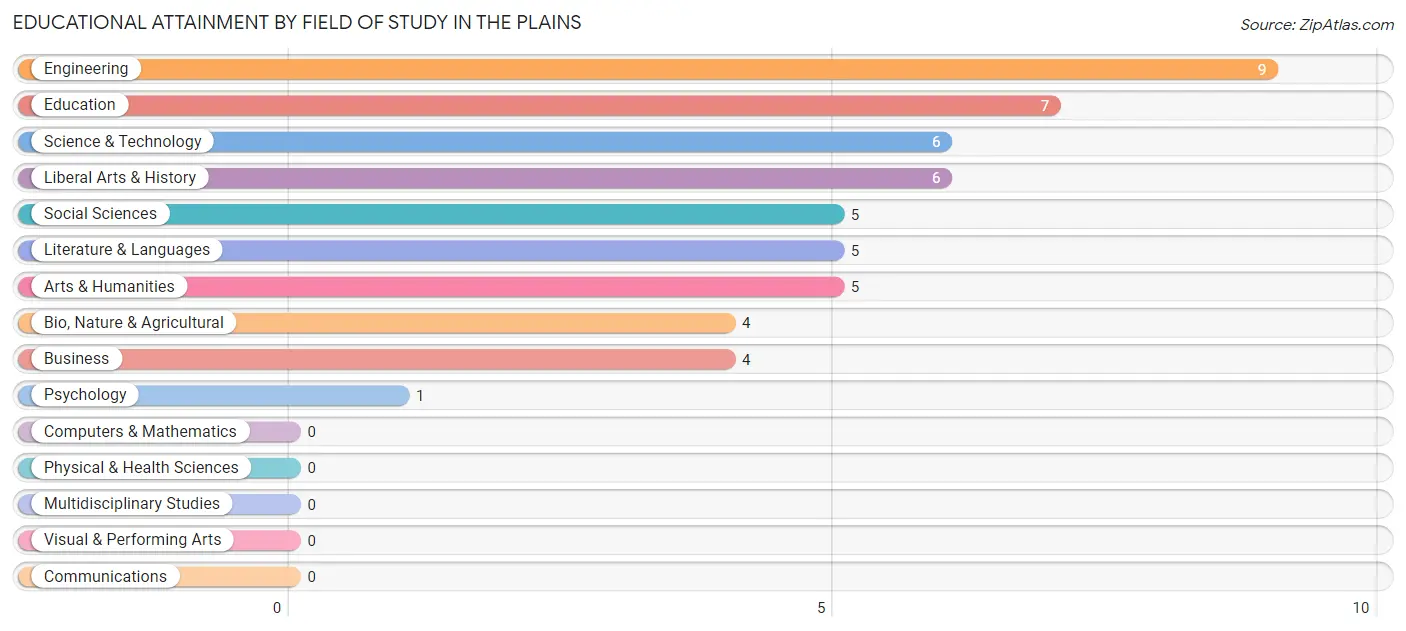
| Field of Study | # Graduates | % Graduates |
| Computers & Mathematics | 0 | 0.0% |
| Bio, Nature & Agricultural | 4 | 7.7% |
| Physical & Health Sciences | 0 | 0.0% |
| Psychology | 1 | 1.9% |
| Social Sciences | 5 | 9.6% |
| Engineering | 9 | 17.3% |
| Multidisciplinary Studies | 0 | 0.0% |
| Science & Technology | 6 | 11.5% |
| Business | 4 | 7.7% |
| Education | 7 | 13.5% |
| Literature & Languages | 5 | 9.6% |
| Liberal Arts & History | 6 | 11.5% |
| Visual & Performing Arts | 0 | 0.0% |
| Communications | 0 | 0.0% |
| Arts & Humanities | 5 | 9.6% |
| Total | 52 | 100.0% |
Transportation & Commute in The Plains
Vehicle Availability by Sex in The Plains
The most prevalent vehicle ownership categories in The Plains are males with 4 vehicles (33, accounting for 40.2%) and females with 4 vehicles (6, making up 49.2%).
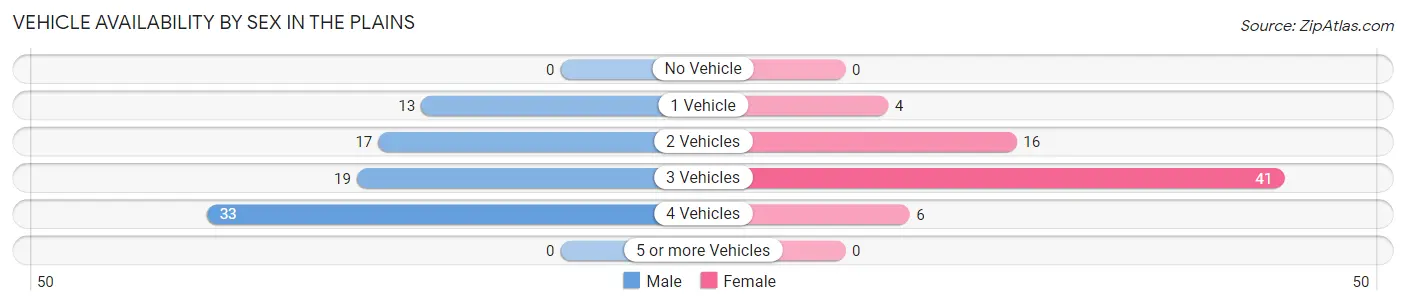
| Vehicles Available | Male | Female |
| No Vehicle | 0 (0.0%) | 0 (0.0%) |
| 1 Vehicle | 13 (15.9%) | 4 (6.0%) |
| 2 Vehicles | 17 (20.7%) | 16 (23.9%) |
| 3 Vehicles | 19 (23.2%) | 41 (61.2%) |
| 4 Vehicles | 33 (40.2%) | 6 (9.0%) |
| 5 or more Vehicles | 0 (0.0%) | 0 (0.0%) |
| Total | 82 (100.0%) | 67 (100.0%) |
Commute Time in The Plains
The most frequently occuring commute durations in The Plains are 10 to 14 minutes (43 commuters, 29.7%), 20 to 24 minutes (22 commuters, 15.2%), and 60 to 89 minutes (19 commuters, 13.1%).
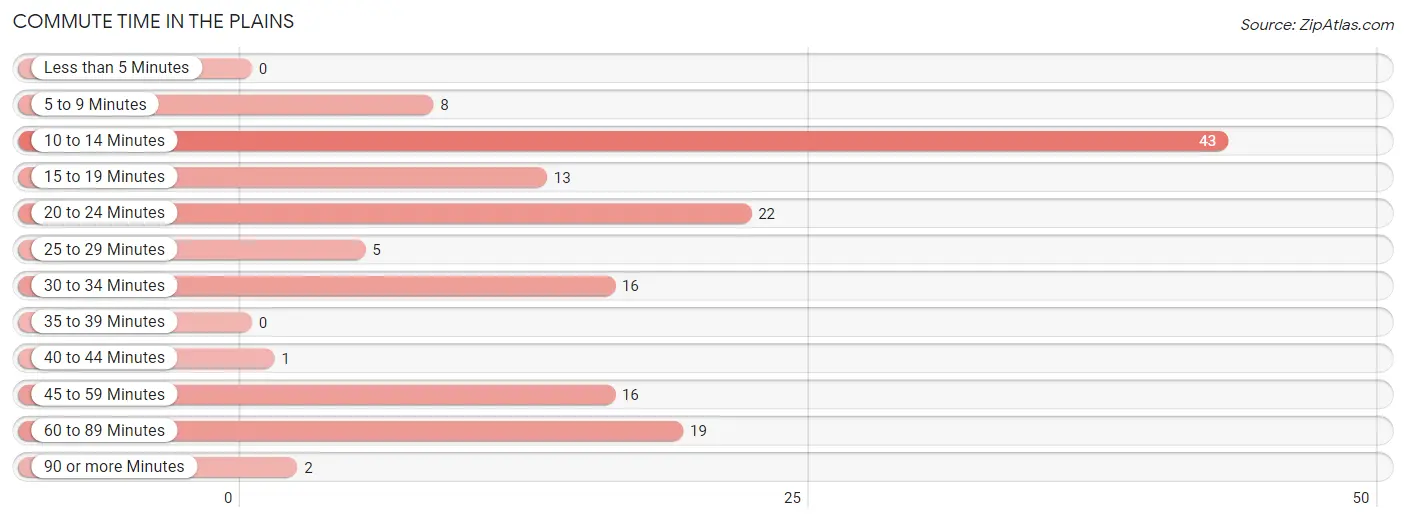
| Commute Time | # Commuters | % Commuters |
| Less than 5 Minutes | 0 | 0.0% |
| 5 to 9 Minutes | 8 | 5.5% |
| 10 to 14 Minutes | 43 | 29.7% |
| 15 to 19 Minutes | 13 | 9.0% |
| 20 to 24 Minutes | 22 | 15.2% |
| 25 to 29 Minutes | 5 | 3.5% |
| 30 to 34 Minutes | 16 | 11.0% |
| 35 to 39 Minutes | 0 | 0.0% |
| 40 to 44 Minutes | 1 | 0.7% |
| 45 to 59 Minutes | 16 | 11.0% |
| 60 to 89 Minutes | 19 | 13.1% |
| 90 or more Minutes | 2 | 1.4% |
Commute Time by Sex in The Plains
The most common commute times in The Plains are 10 to 14 minutes (28 commuters, 34.2%) for males and 20 to 24 minutes (22 commuters, 34.9%) for females.
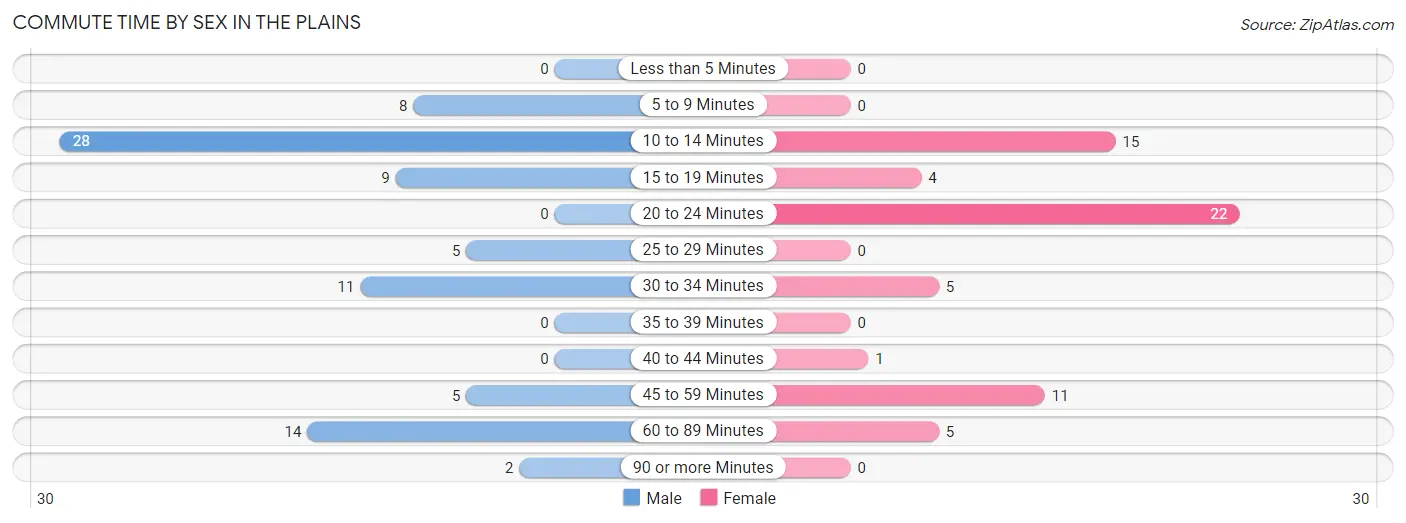
| Commute Time | Male | Female |
| Less than 5 Minutes | 0 (0.0%) | 0 (0.0%) |
| 5 to 9 Minutes | 8 (9.8%) | 0 (0.0%) |
| 10 to 14 Minutes | 28 (34.2%) | 15 (23.8%) |
| 15 to 19 Minutes | 9 (11.0%) | 4 (6.4%) |
| 20 to 24 Minutes | 0 (0.0%) | 22 (34.9%) |
| 25 to 29 Minutes | 5 (6.1%) | 0 (0.0%) |
| 30 to 34 Minutes | 11 (13.4%) | 5 (7.9%) |
| 35 to 39 Minutes | 0 (0.0%) | 0 (0.0%) |
| 40 to 44 Minutes | 0 (0.0%) | 1 (1.6%) |
| 45 to 59 Minutes | 5 (6.1%) | 11 (17.5%) |
| 60 to 89 Minutes | 14 (17.1%) | 5 (7.9%) |
| 90 or more Minutes | 2 (2.4%) | 0 (0.0%) |
Time of Departure to Work by Sex in The Plains
The most frequent times of departure to work in The Plains are 6:00 AM to 6:29 AM (23, 28.1%) for males and 12:00 PM to 3:59 PM (24, 38.1%) for females.
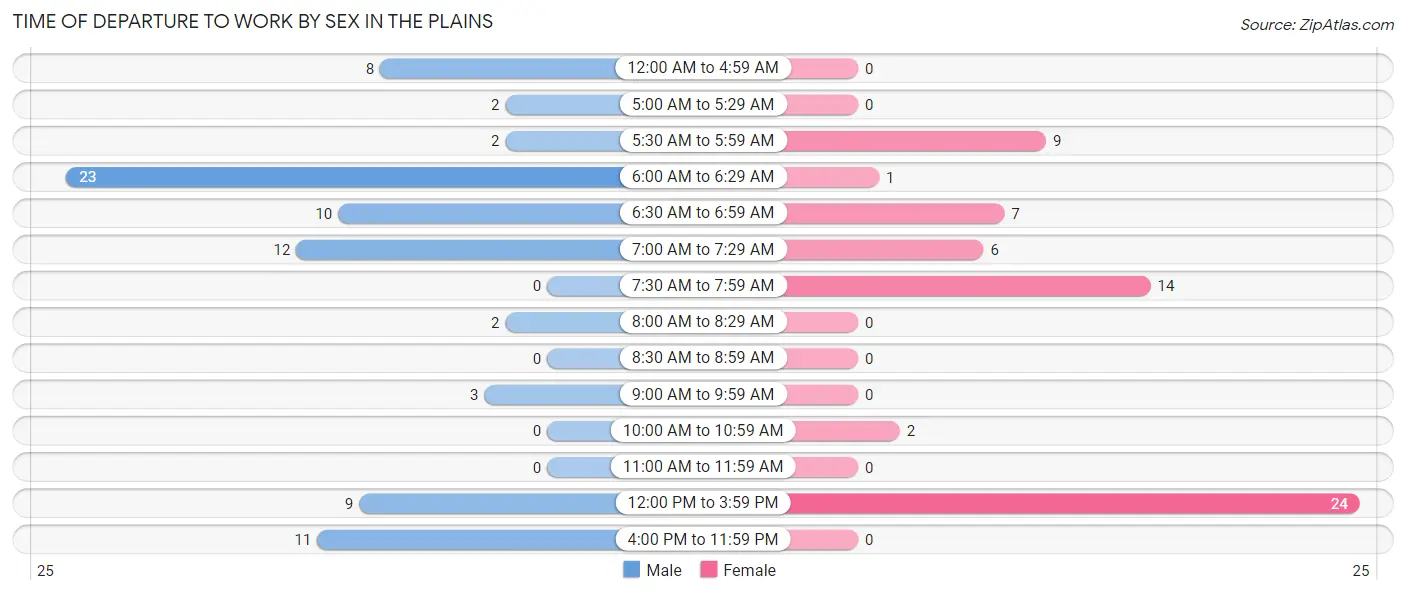
| Time of Departure | Male | Female |
| 12:00 AM to 4:59 AM | 8 (9.8%) | 0 (0.0%) |
| 5:00 AM to 5:29 AM | 2 (2.4%) | 0 (0.0%) |
| 5:30 AM to 5:59 AM | 2 (2.4%) | 9 (14.3%) |
| 6:00 AM to 6:29 AM | 23 (28.1%) | 1 (1.6%) |
| 6:30 AM to 6:59 AM | 10 (12.2%) | 7 (11.1%) |
| 7:00 AM to 7:29 AM | 12 (14.6%) | 6 (9.5%) |
| 7:30 AM to 7:59 AM | 0 (0.0%) | 14 (22.2%) |
| 8:00 AM to 8:29 AM | 2 (2.4%) | 0 (0.0%) |
| 8:30 AM to 8:59 AM | 0 (0.0%) | 0 (0.0%) |
| 9:00 AM to 9:59 AM | 3 (3.7%) | 0 (0.0%) |
| 10:00 AM to 10:59 AM | 0 (0.0%) | 2 (3.2%) |
| 11:00 AM to 11:59 AM | 0 (0.0%) | 0 (0.0%) |
| 12:00 PM to 3:59 PM | 9 (11.0%) | 24 (38.1%) |
| 4:00 PM to 11:59 PM | 11 (13.4%) | 0 (0.0%) |
| Total | 82 (100.0%) | 63 (100.0%) |
Housing Occupancy in The Plains
Occupancy by Ownership in The Plains
Of the total 93 dwellings in The Plains, owner-occupied units account for 31 (33.3%), while renter-occupied units make up 62 (66.7%).
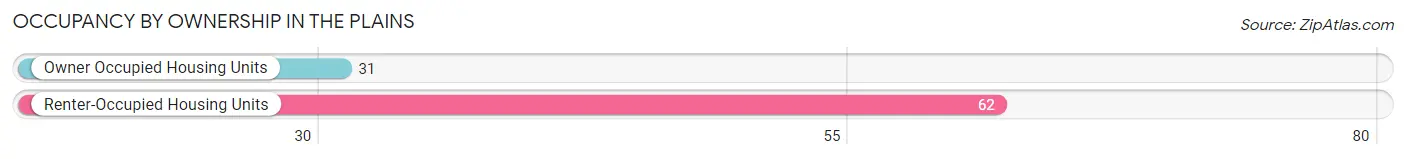
| Occupancy | # Housing Units | % Housing Units |
| Owner Occupied Housing Units | 31 | 33.3% |
| Renter-Occupied Housing Units | 62 | 66.7% |
| Total Occupied Housing Units | 93 | 100.0% |
Occupancy by Household Size in The Plains
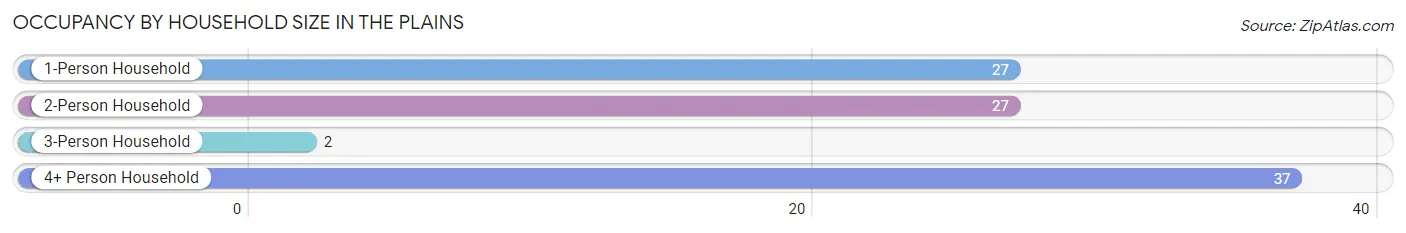
| Household Size | # Housing Units | % Housing Units |
| 1-Person Household | 27 | 29.0% |
| 2-Person Household | 27 | 29.0% |
| 3-Person Household | 2 | 2.1% |
| 4+ Person Household | 37 | 39.8% |
| Total Housing Units | 93 | 100.0% |
Occupancy by Ownership by Household Size in The Plains
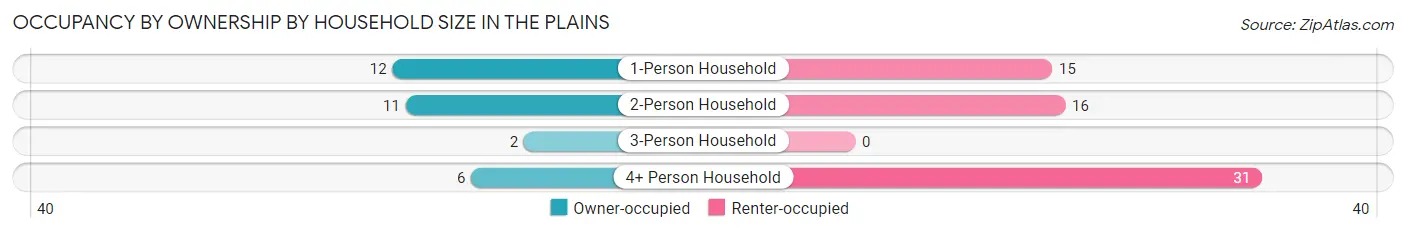
| Household Size | Owner-occupied | Renter-occupied |
| 1-Person Household | 12 (44.4%) | 15 (55.6%) |
| 2-Person Household | 11 (40.7%) | 16 (59.3%) |
| 3-Person Household | 2 (100.0%) | 0 (0.0%) |
| 4+ Person Household | 6 (16.2%) | 31 (83.8%) |
| Total Housing Units | 31 (33.3%) | 62 (66.7%) |
Occupancy by Educational Attainment in The Plains
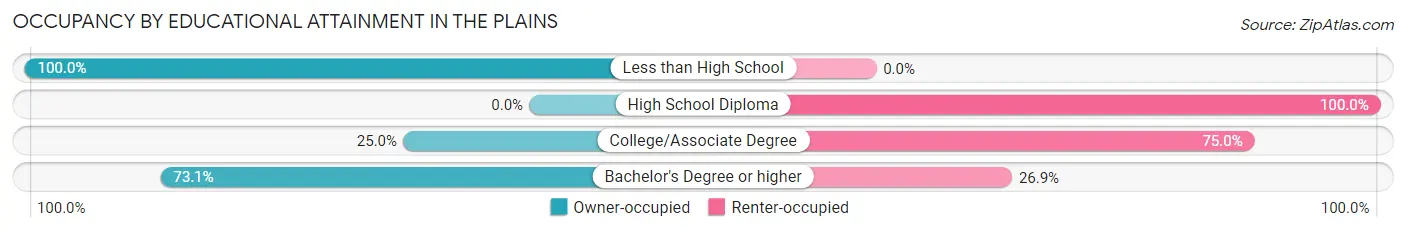
| Household Size | Owner-occupied | Renter-occupied |
| Less than High School | 3 (100.0%) | 0 (0.0%) |
| High School Diploma | 0 (0.0%) | 28 (100.0%) |
| College/Associate Degree | 9 (25.0%) | 27 (75.0%) |
| Bachelor's Degree or higher | 19 (73.1%) | 7 (26.9%) |
Occupancy by Age of Householder in The Plains
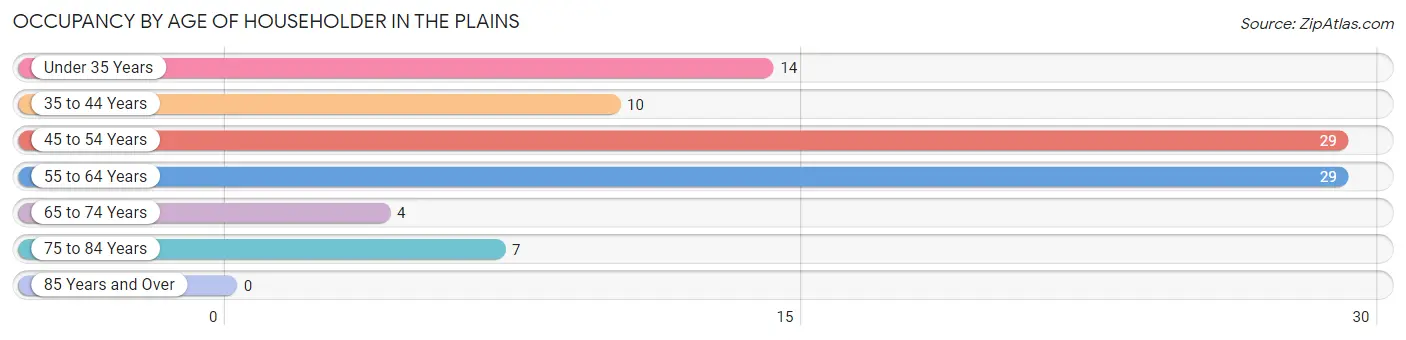
| Age Bracket | # Households | % Households |
| Under 35 Years | 14 | 15.0% |
| 35 to 44 Years | 10 | 10.7% |
| 45 to 54 Years | 29 | 31.2% |
| 55 to 64 Years | 29 | 31.2% |
| 65 to 74 Years | 4 | 4.3% |
| 75 to 84 Years | 7 | 7.5% |
| 85 Years and Over | 0 | 0.0% |
| Total | 93 | 100.0% |
Housing Finances in The Plains
Median Income by Occupancy in The Plains
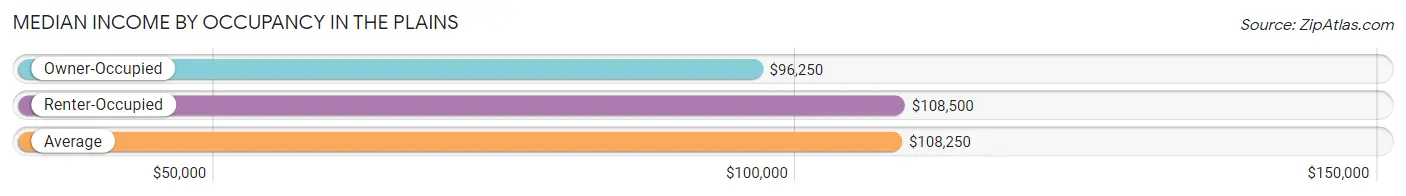
| Occupancy Type | # Households | Median Income |
| Owner-Occupied | 31 (33.3%) | $96,250 |
| Renter-Occupied | 62 (66.7%) | $108,500 |
| Average | 93 (100.0%) | $108,250 |
Occupancy by Householder Income Bracket in The Plains
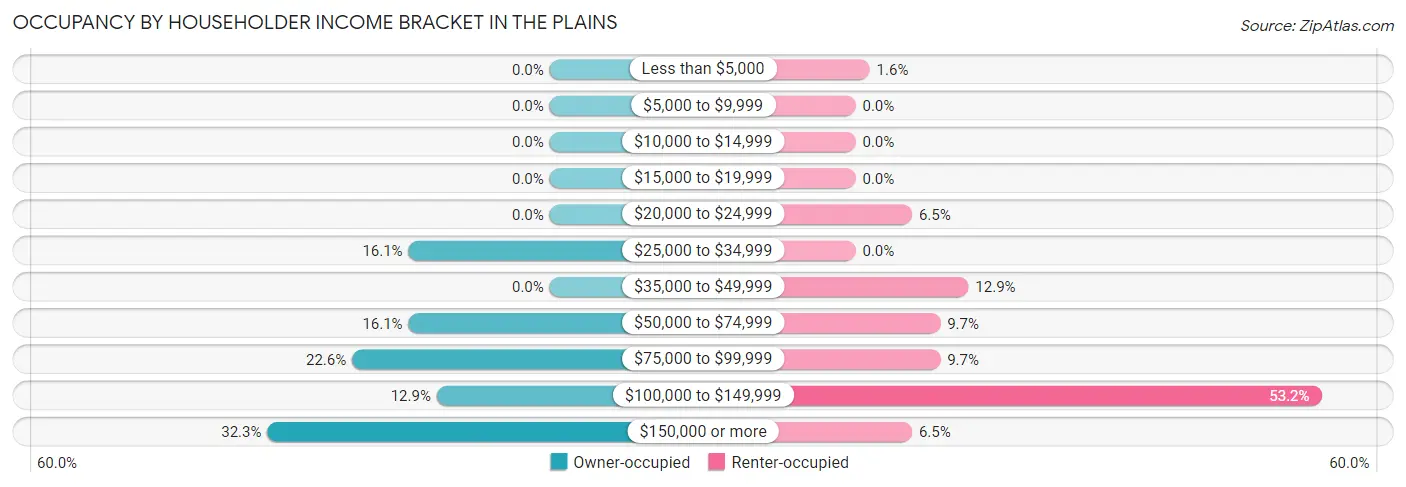
| Income Bracket | Owner-occupied | Renter-occupied |
| Less than $5,000 | 0 (0.0%) | 1 (1.6%) |
| $5,000 to $9,999 | 0 (0.0%) | 0 (0.0%) |
| $10,000 to $14,999 | 0 (0.0%) | 0 (0.0%) |
| $15,000 to $19,999 | 0 (0.0%) | 0 (0.0%) |
| $20,000 to $24,999 | 0 (0.0%) | 4 (6.5%) |
| $25,000 to $34,999 | 5 (16.1%) | 0 (0.0%) |
| $35,000 to $49,999 | 0 (0.0%) | 8 (12.9%) |
| $50,000 to $74,999 | 5 (16.1%) | 6 (9.7%) |
| $75,000 to $99,999 | 7 (22.6%) | 6 (9.7%) |
| $100,000 to $149,999 | 4 (12.9%) | 33 (53.2%) |
| $150,000 or more | 10 (32.3%) | 4 (6.5%) |
| Total | 31 (100.0%) | 62 (100.0%) |
Monthly Housing Cost Tiers in The Plains
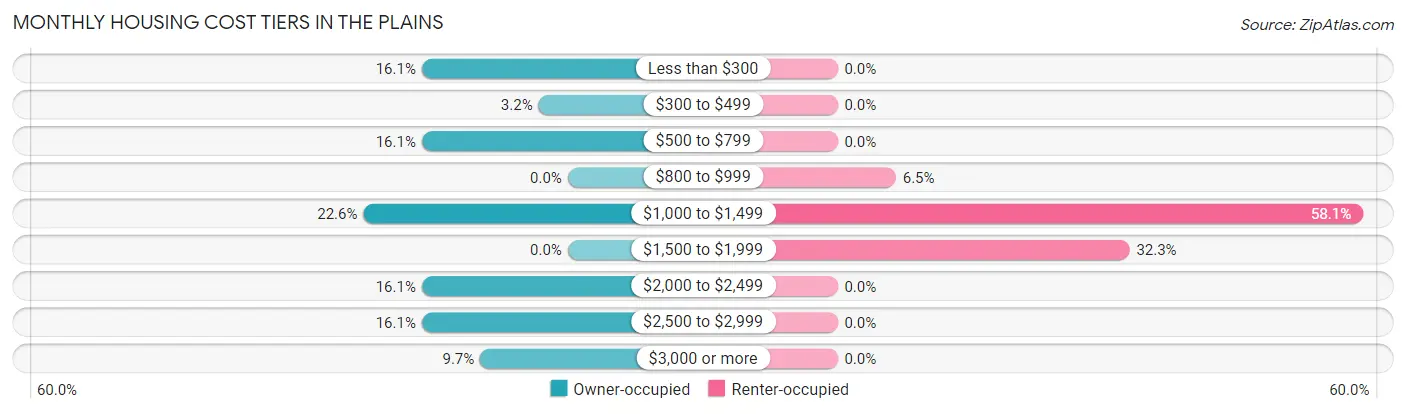
| Monthly Cost | Owner-occupied | Renter-occupied |
| Less than $300 | 5 (16.1%) | 0 (0.0%) |
| $300 to $499 | 1 (3.2%) | 0 (0.0%) |
| $500 to $799 | 5 (16.1%) | 0 (0.0%) |
| $800 to $999 | 0 (0.0%) | 4 (6.5%) |
| $1,000 to $1,499 | 7 (22.6%) | 36 (58.1%) |
| $1,500 to $1,999 | 0 (0.0%) | 20 (32.3%) |
| $2,000 to $2,499 | 5 (16.1%) | 0 (0.0%) |
| $2,500 to $2,999 | 5 (16.1%) | 0 (0.0%) |
| $3,000 or more | 3 (9.7%) | 0 (0.0%) |
| Total | 31 (100.0%) | 62 (100.0%) |
Physical Housing Characteristics in The Plains
Housing Structures in The Plains
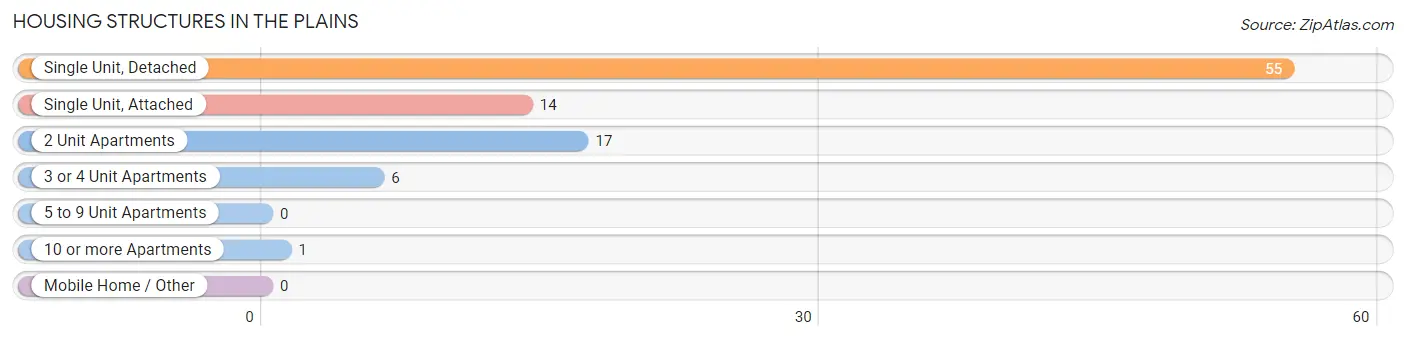
| Structure Type | # Housing Units | % Housing Units |
| Single Unit, Detached | 55 | 59.1% |
| Single Unit, Attached | 14 | 15.0% |
| 2 Unit Apartments | 17 | 18.3% |
| 3 or 4 Unit Apartments | 6 | 6.5% |
| 5 to 9 Unit Apartments | 0 | 0.0% |
| 10 or more Apartments | 1 | 1.1% |
| Mobile Home / Other | 0 | 0.0% |
| Total | 93 | 100.0% |
Housing Structures by Occupancy in The Plains
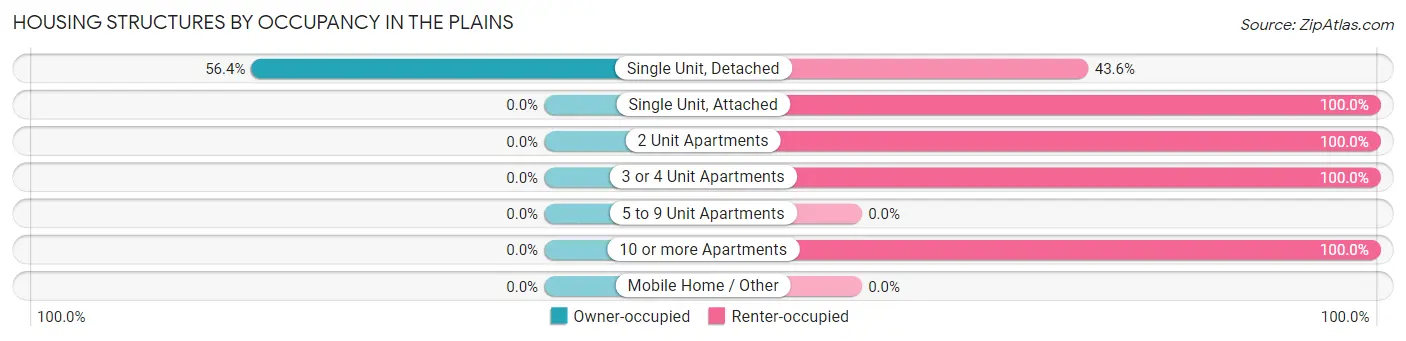
| Structure Type | Owner-occupied | Renter-occupied |
| Single Unit, Detached | 31 (56.4%) | 24 (43.6%) |
| Single Unit, Attached | 0 (0.0%) | 14 (100.0%) |
| 2 Unit Apartments | 0 (0.0%) | 17 (100.0%) |
| 3 or 4 Unit Apartments | 0 (0.0%) | 6 (100.0%) |
| 5 to 9 Unit Apartments | 0 (0.0%) | 0 (0.0%) |
| 10 or more Apartments | 0 (0.0%) | 1 (100.0%) |
| Mobile Home / Other | 0 (0.0%) | 0 (0.0%) |
| Total | 31 (33.3%) | 62 (66.7%) |
Housing Structures by Number of Rooms in The Plains
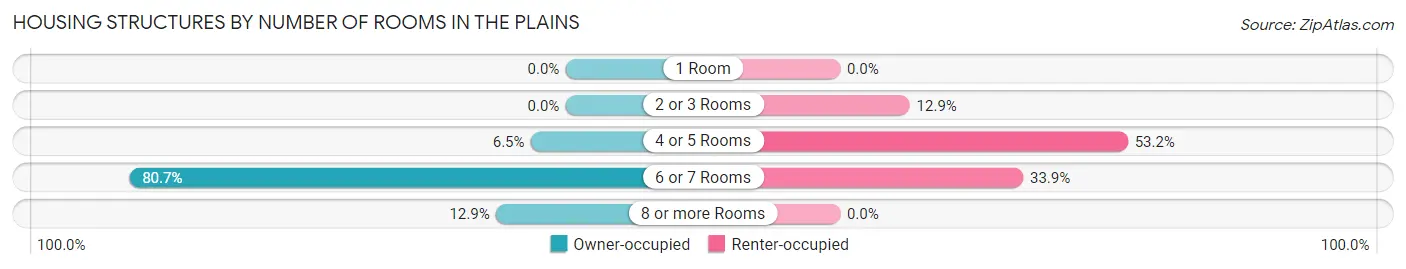
| Number of Rooms | Owner-occupied | Renter-occupied |
| 1 Room | 0 (0.0%) | 0 (0.0%) |
| 2 or 3 Rooms | 0 (0.0%) | 8 (12.9%) |
| 4 or 5 Rooms | 2 (6.5%) | 33 (53.2%) |
| 6 or 7 Rooms | 25 (80.6%) | 21 (33.9%) |
| 8 or more Rooms | 4 (12.9%) | 0 (0.0%) |
| Total | 31 (100.0%) | 62 (100.0%) |
Housing Structure by Heating Type in The Plains
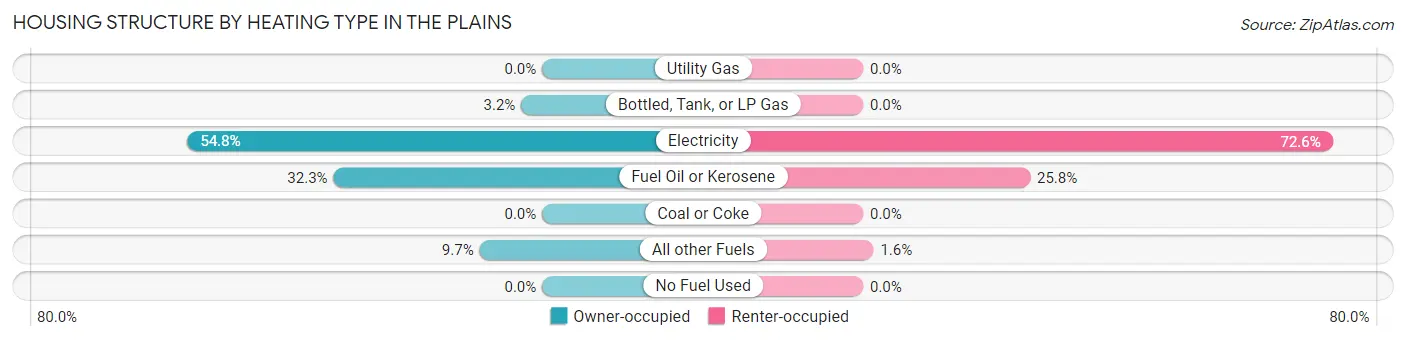
| Heating Type | Owner-occupied | Renter-occupied |
| Utility Gas | 0 (0.0%) | 0 (0.0%) |
| Bottled, Tank, or LP Gas | 1 (3.2%) | 0 (0.0%) |
| Electricity | 17 (54.8%) | 45 (72.6%) |
| Fuel Oil or Kerosene | 10 (32.3%) | 16 (25.8%) |
| Coal or Coke | 0 (0.0%) | 0 (0.0%) |
| All other Fuels | 3 (9.7%) | 1 (1.6%) |
| No Fuel Used | 0 (0.0%) | 0 (0.0%) |
| Total | 31 (100.0%) | 62 (100.0%) |
Household Vehicle Usage in The Plains
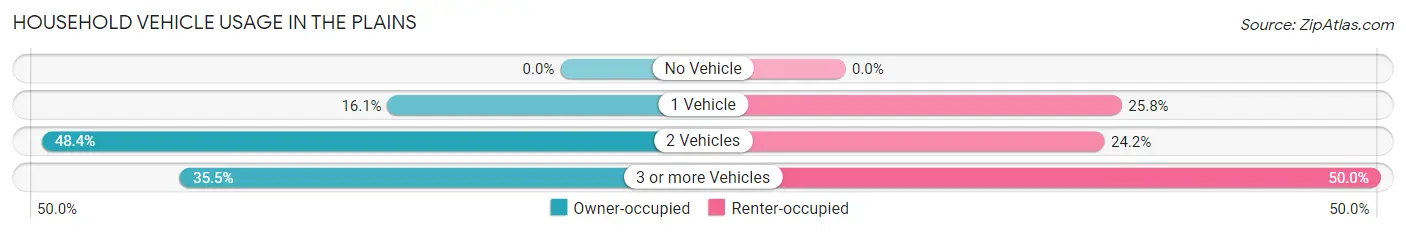
| Vehicles per Household | Owner-occupied | Renter-occupied |
| No Vehicle | 0 (0.0%) | 0 (0.0%) |
| 1 Vehicle | 5 (16.1%) | 16 (25.8%) |
| 2 Vehicles | 15 (48.4%) | 15 (24.2%) |
| 3 or more Vehicles | 11 (35.5%) | 31 (50.0%) |
| Total | 31 (100.0%) | 62 (100.0%) |
Real Estate & Mortgages in The Plains
Real Estate and Mortgage Overview in The Plains
| Characteristic | Without Mortgage | With Mortgage |
| Housing Units | 10 | 21 |
| Median Property Value | - | - |
| Median Household Income | $85,000 | $8 |
| Monthly Housing Costs | $680 | $3 |
| Real Estate Taxes | $3,500 | $0 |
Property Value by Mortgage Status in The Plains
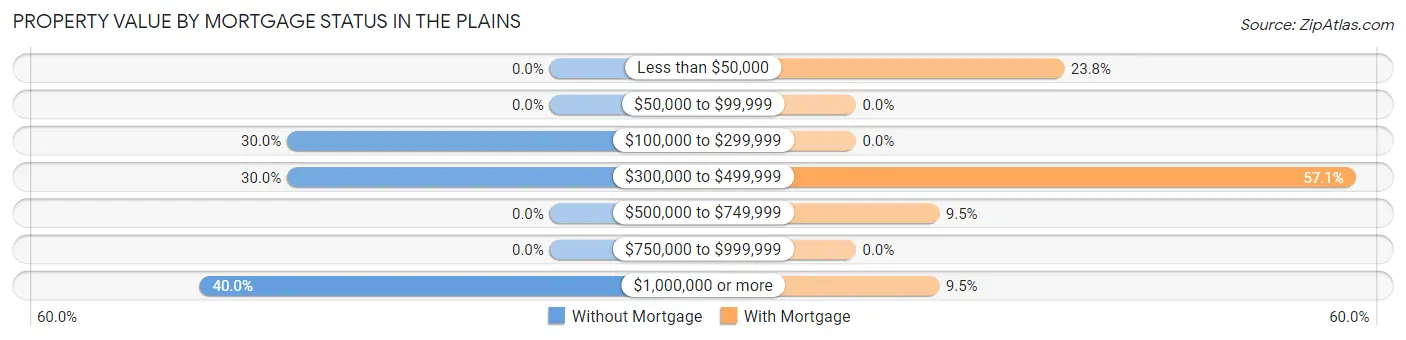
| Property Value | Without Mortgage | With Mortgage |
| Less than $50,000 | 0 (0.0%) | 5 (23.8%) |
| $50,000 to $99,999 | 0 (0.0%) | 0 (0.0%) |
| $100,000 to $299,999 | 3 (30.0%) | 0 (0.0%) |
| $300,000 to $499,999 | 3 (30.0%) | 12 (57.1%) |
| $500,000 to $749,999 | 0 (0.0%) | 2 (9.5%) |
| $750,000 to $999,999 | 0 (0.0%) | 0 (0.0%) |
| $1,000,000 or more | 4 (40.0%) | 2 (9.5%) |
| Total | 10 (100.0%) | 21 (100.0%) |
Household Income by Mortgage Status in The Plains
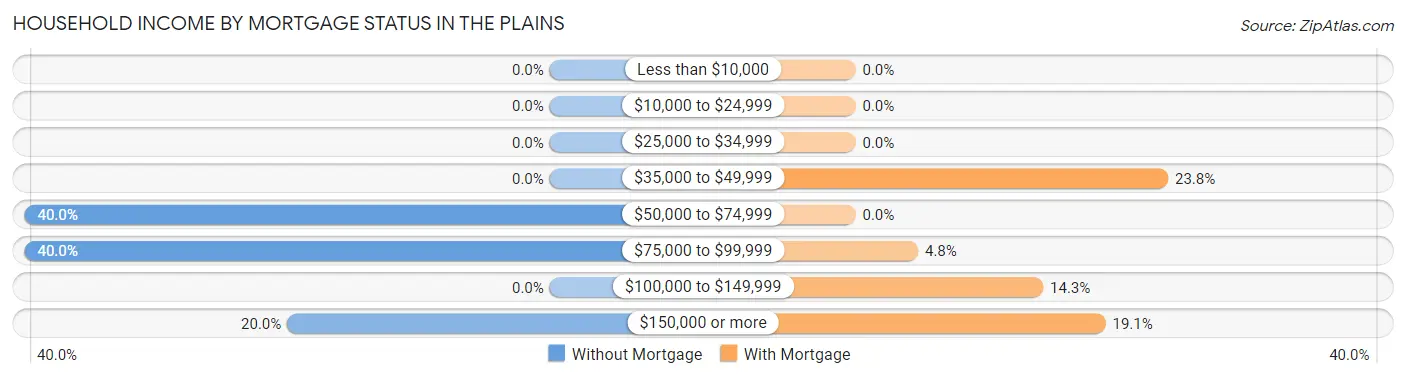
| Household Income | Without Mortgage | With Mortgage |
| Less than $10,000 | 0 (0.0%) | 0 (0.0%) |
| $10,000 to $24,999 | 0 (0.0%) | 0 (0.0%) |
| $25,000 to $34,999 | 0 (0.0%) | 0 (0.0%) |
| $35,000 to $49,999 | 0 (0.0%) | 5 (23.8%) |
| $50,000 to $74,999 | 4 (40.0%) | 0 (0.0%) |
| $75,000 to $99,999 | 4 (40.0%) | 1 (4.8%) |
| $100,000 to $149,999 | 0 (0.0%) | 3 (14.3%) |
| $150,000 or more | 2 (20.0%) | 4 (19.1%) |
| Total | 10 (100.0%) | 21 (100.0%) |
Property Value to Household Income Ratio in The Plains
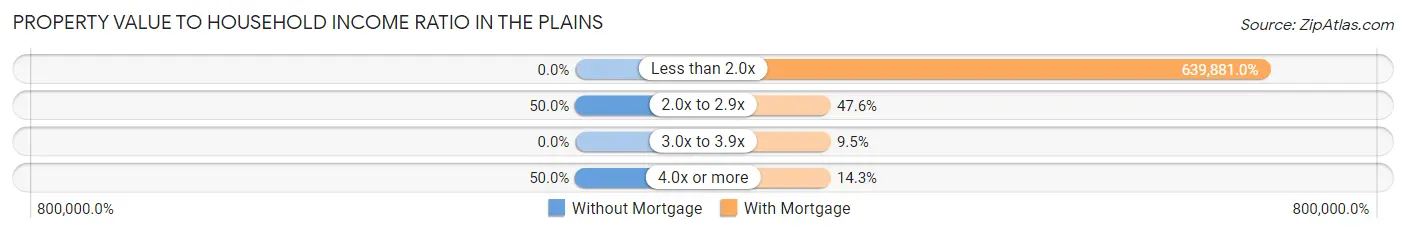
| Value-to-Income Ratio | Without Mortgage | With Mortgage |
| Less than 2.0x | 0 (0.0%) | 134,375 (639,881.0%) |
| 2.0x to 2.9x | 5 (50.0%) | 10 (47.6%) |
| 3.0x to 3.9x | 0 (0.0%) | 2 (9.5%) |
| 4.0x or more | 5 (50.0%) | 3 (14.3%) |
| Total | 10 (100.0%) | 21 (100.0%) |
Real Estate Taxes by Mortgage Status in The Plains
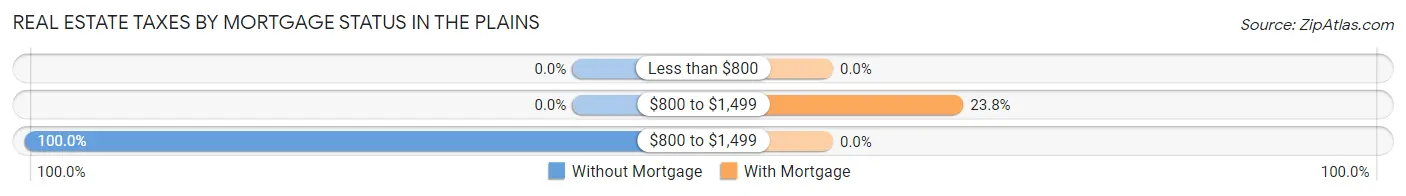
| Property Taxes | Without Mortgage | With Mortgage |
| Less than $800 | 0 (0.0%) | 0 (0.0%) |
| $800 to $1,499 | 0 (0.0%) | 5 (23.8%) |
| $800 to $1,499 | 10 (100.0%) | 0 (0.0%) |
| Total | 10 (100.0%) | 21 (100.0%) |
Health & Disability in The Plains
Health Insurance Coverage by Age in The Plains
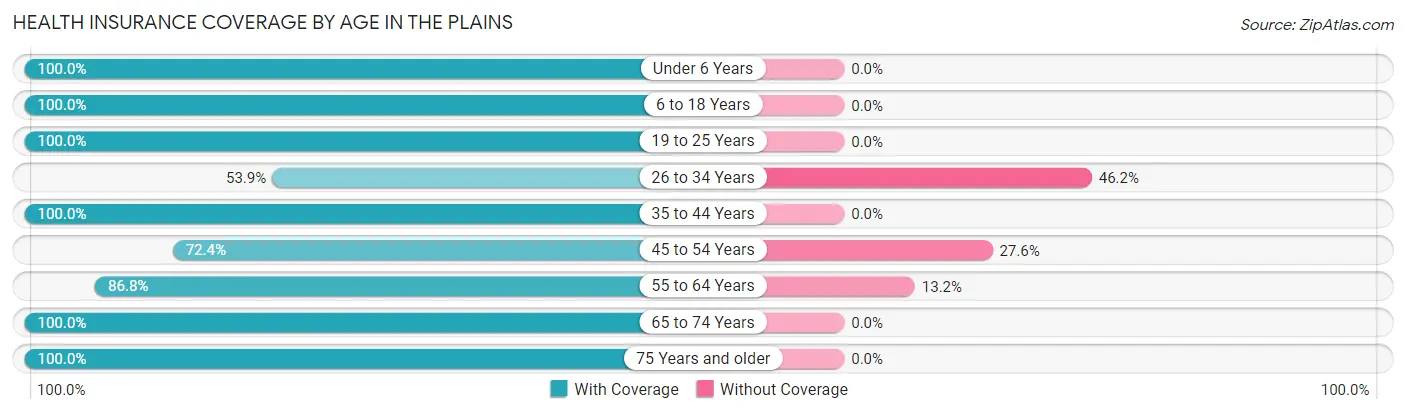
| Age Bracket | With Coverage | Without Coverage |
| Under 6 Years | 38 (100.0%) | 0 (0.0%) |
| 6 to 18 Years | 31 (100.0%) | 0 (0.0%) |
| 19 to 25 Years | 33 (100.0%) | 0 (0.0%) |
| 26 to 34 Years | 7 (53.8%) | 6 (46.2%) |
| 35 to 44 Years | 16 (100.0%) | 0 (0.0%) |
| 45 to 54 Years | 55 (72.4%) | 21 (27.6%) |
| 55 to 64 Years | 33 (86.8%) | 5 (13.2%) |
| 65 to 74 Years | 16 (100.0%) | 0 (0.0%) |
| 75 Years and older | 12 (100.0%) | 0 (0.0%) |
| Total | 241 (88.3%) | 32 (11.7%) |
Health Insurance Coverage by Citizenship Status in The Plains
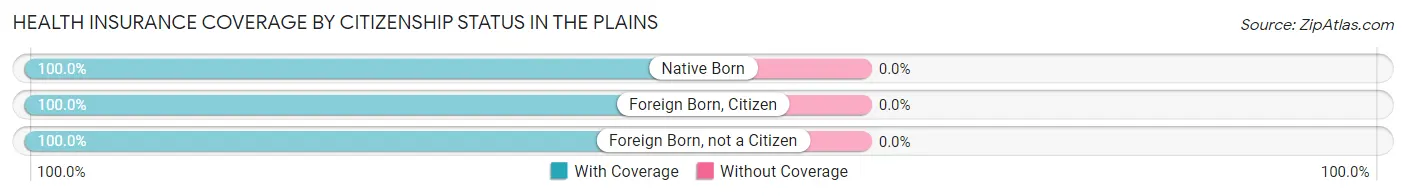
| Citizenship Status | With Coverage | Without Coverage |
| Native Born | 38 (100.0%) | 0 (0.0%) |
| Foreign Born, Citizen | 31 (100.0%) | 0 (0.0%) |
| Foreign Born, not a Citizen | 33 (100.0%) | 0 (0.0%) |
Health Insurance Coverage by Household Income in The Plains
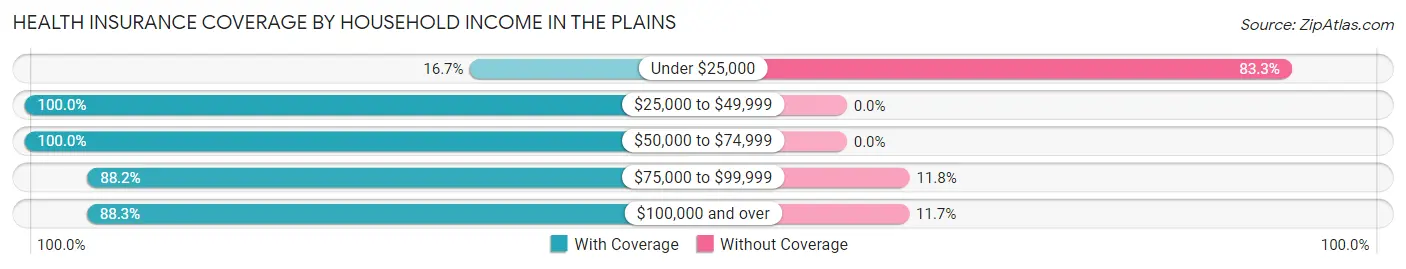
| Household Income | With Coverage | Without Coverage |
| Under $25,000 | 1 (16.7%) | 5 (83.3%) |
| $25,000 to $49,999 | 21 (100.0%) | 0 (0.0%) |
| $50,000 to $74,999 | 15 (100.0%) | 0 (0.0%) |
| $75,000 to $99,999 | 45 (88.2%) | 6 (11.8%) |
| $100,000 and over | 159 (88.3%) | 21 (11.7%) |
Public vs Private Health Insurance Coverage by Age in The Plains
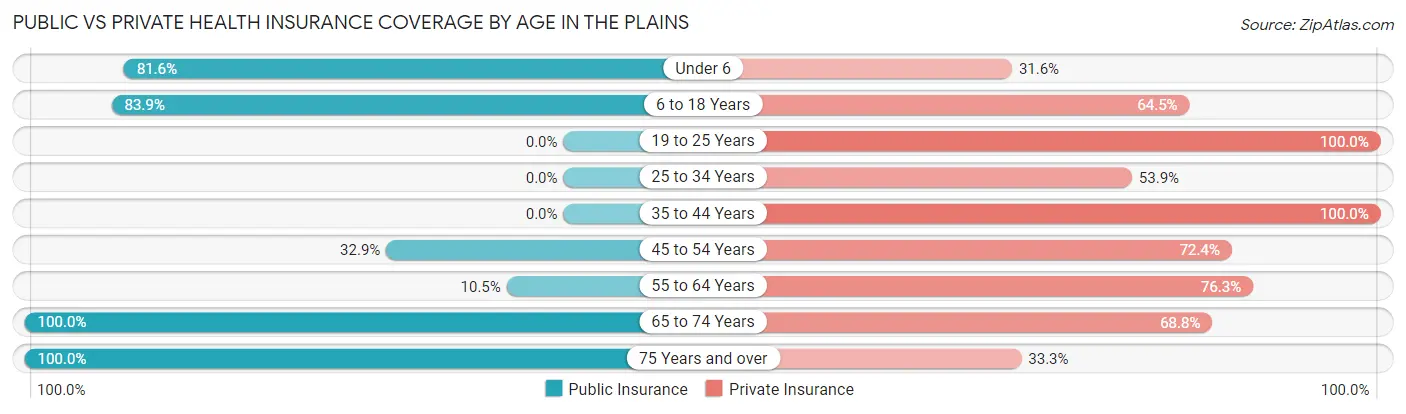
| Age Bracket | Public Insurance | Private Insurance |
| Under 6 | 31 (81.6%) | 12 (31.6%) |
| 6 to 18 Years | 26 (83.9%) | 20 (64.5%) |
| 19 to 25 Years | 0 (0.0%) | 33 (100.0%) |
| 25 to 34 Years | 0 (0.0%) | 7 (53.8%) |
| 35 to 44 Years | 0 (0.0%) | 16 (100.0%) |
| 45 to 54 Years | 25 (32.9%) | 55 (72.4%) |
| 55 to 64 Years | 4 (10.5%) | 29 (76.3%) |
| 65 to 74 Years | 16 (100.0%) | 11 (68.8%) |
| 75 Years and over | 12 (100.0%) | 4 (33.3%) |
| Total | 114 (41.8%) | 187 (68.5%) |
Disability Status by Sex by Age in The Plains
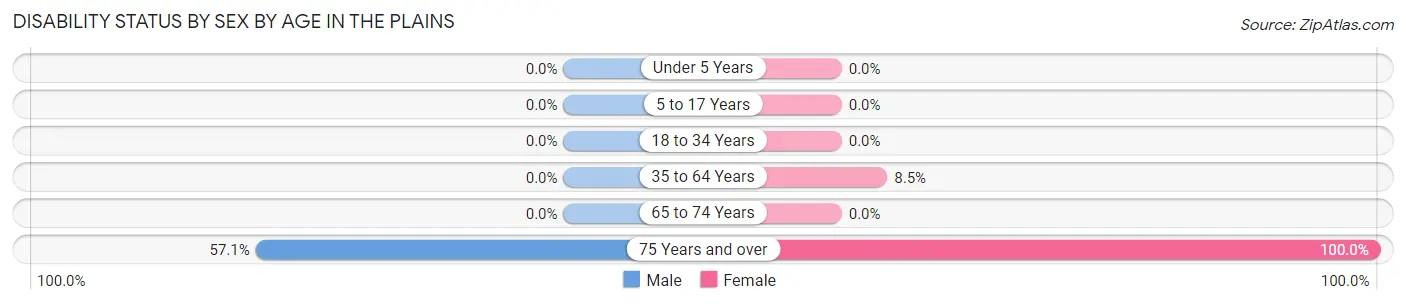
| Age Bracket | Male | Female |
| Under 5 Years | 0 (0.0%) | 0 (0.0%) |
| 5 to 17 Years | 0 (0.0%) | 0 (0.0%) |
| 18 to 34 Years | 0 (0.0%) | 0 (0.0%) |
| 35 to 64 Years | 0 (0.0%) | 6 (8.5%) |
| 65 to 74 Years | 0 (0.0%) | 0 (0.0%) |
| 75 Years and over | 4 (57.1%) | 5 (100.0%) |
Disability Class by Sex by Age in The Plains
Disability Class: Hearing Difficulty
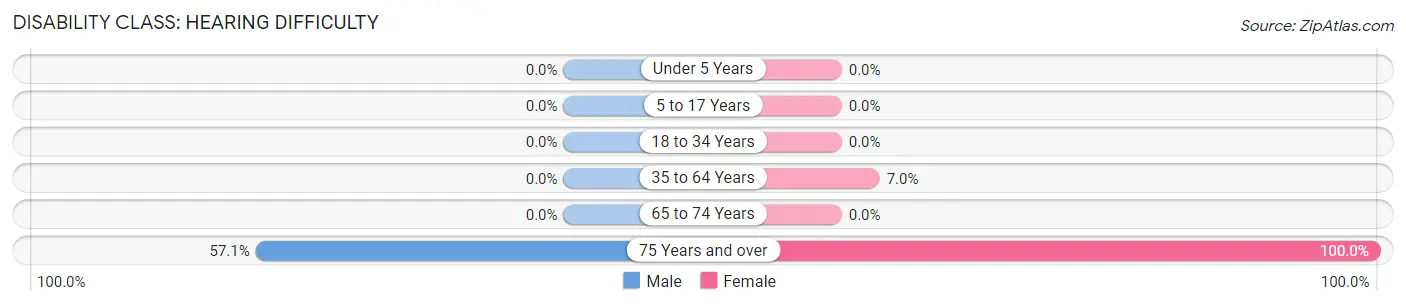
| Age Bracket | Male | Female |
| Under 5 Years | 0 (0.0%) | 0 (0.0%) |
| 5 to 17 Years | 0 (0.0%) | 0 (0.0%) |
| 18 to 34 Years | 0 (0.0%) | 0 (0.0%) |
| 35 to 64 Years | 0 (0.0%) | 5 (7.0%) |
| 65 to 74 Years | 0 (0.0%) | 0 (0.0%) |
| 75 Years and over | 4 (57.1%) | 5 (100.0%) |
Disability Class: Vision Difficulty
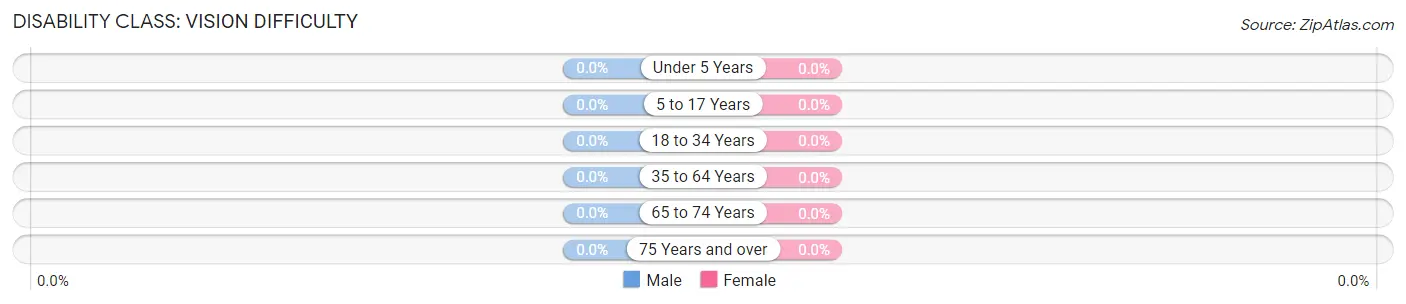
| Age Bracket | Male | Female |
| Under 5 Years | 0 (0.0%) | 0 (0.0%) |
| 5 to 17 Years | 0 (0.0%) | 0 (0.0%) |
| 18 to 34 Years | 0 (0.0%) | 0 (0.0%) |
| 35 to 64 Years | 0 (0.0%) | 0 (0.0%) |
| 65 to 74 Years | 0 (0.0%) | 0 (0.0%) |
| 75 Years and over | 0 (0.0%) | 0 (0.0%) |
Disability Class: Cognitive Difficulty
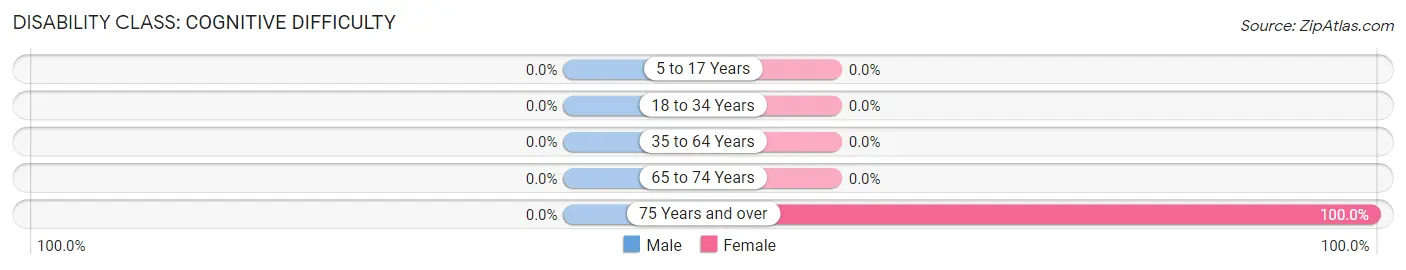
| Age Bracket | Male | Female |
| 5 to 17 Years | 0 (0.0%) | 0 (0.0%) |
| 18 to 34 Years | 0 (0.0%) | 0 (0.0%) |
| 35 to 64 Years | 0 (0.0%) | 0 (0.0%) |
| 65 to 74 Years | 0 (0.0%) | 0 (0.0%) |
| 75 Years and over | 0 (0.0%) | 5 (100.0%) |
Disability Class: Ambulatory Difficulty
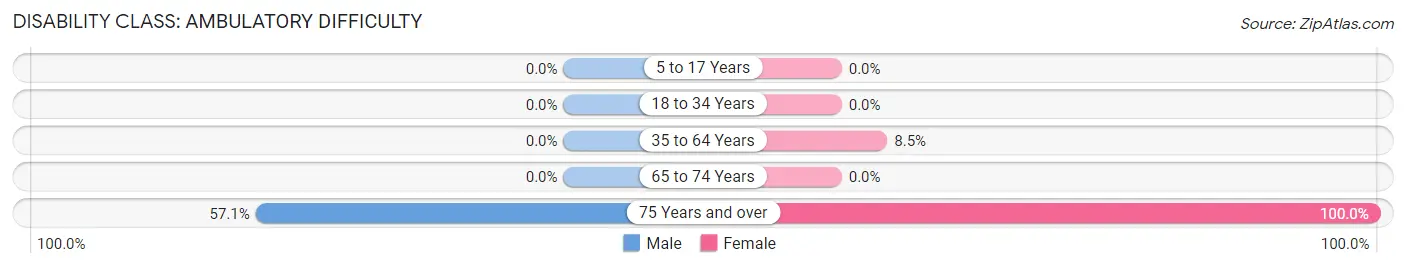
| Age Bracket | Male | Female |
| 5 to 17 Years | 0 (0.0%) | 0 (0.0%) |
| 18 to 34 Years | 0 (0.0%) | 0 (0.0%) |
| 35 to 64 Years | 0 (0.0%) | 6 (8.5%) |
| 65 to 74 Years | 0 (0.0%) | 0 (0.0%) |
| 75 Years and over | 4 (57.1%) | 5 (100.0%) |
Disability Class: Self-Care Difficulty
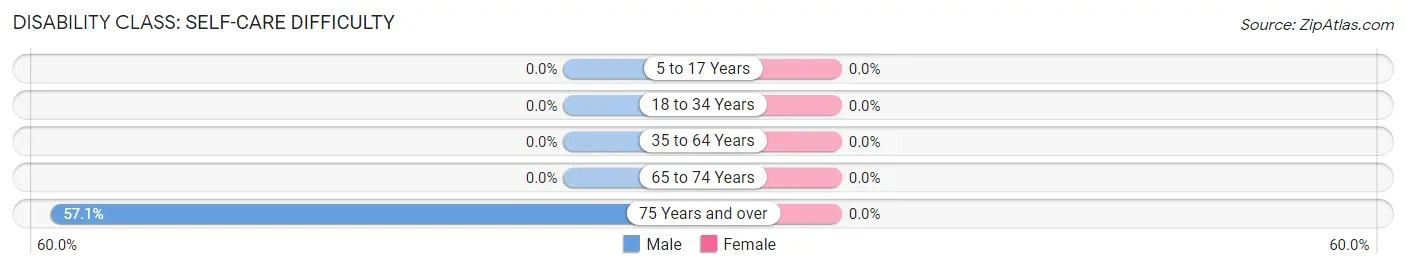
| Age Bracket | Male | Female |
| 5 to 17 Years | 0 (0.0%) | 0 (0.0%) |
| 18 to 34 Years | 0 (0.0%) | 0 (0.0%) |
| 35 to 64 Years | 0 (0.0%) | 0 (0.0%) |
| 65 to 74 Years | 0 (0.0%) | 0 (0.0%) |
| 75 Years and over | 4 (57.1%) | 0 (0.0%) |
Technology Access in The Plains
Computing Device Access in The Plains
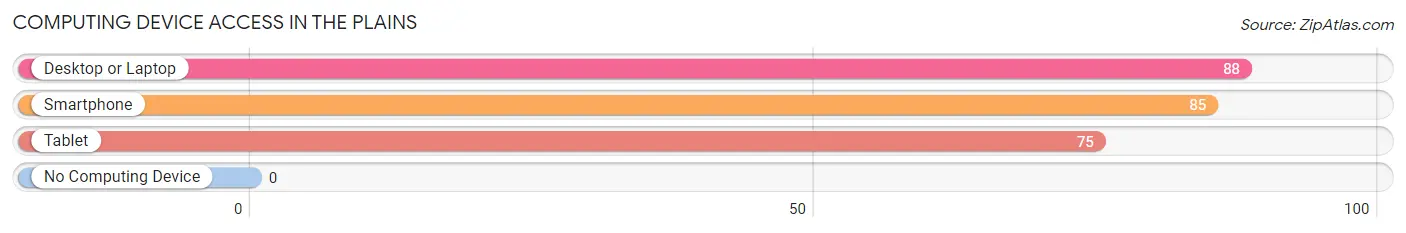
| Device Type | # Households | % Households |
| Desktop or Laptop | 88 | 94.6% |
| Smartphone | 85 | 91.4% |
| Tablet | 75 | 80.6% |
| No Computing Device | 0 | 0.0% |
| Total | 93 | 100.0% |
Internet Access in The Plains
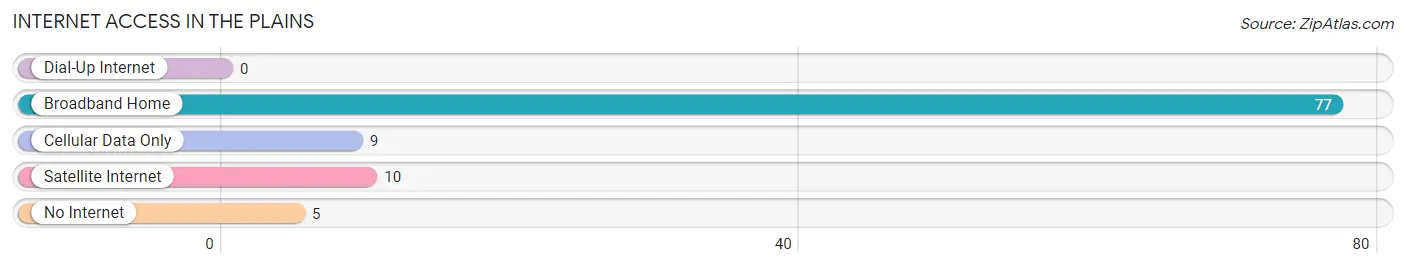
| Internet Type | # Households | % Households |
| Dial-Up Internet | 0 | 0.0% |
| Broadband Home | 77 | 82.8% |
| Cellular Data Only | 9 | 9.7% |
| Satellite Internet | 10 | 10.7% |
| No Internet | 5 | 5.4% |
| Total | 93 | 100.0% |
The Plains Summary
History
The Plains is a small town located in Fauquier County, Virginia. It is situated in the foothills of the Blue Ridge Mountains, about 40 miles west of Washington, D.C. The town was founded in 1798 by a group of settlers from Pennsylvania and Maryland. The town was originally known as “The Plains of Fauquier” and was named after the nearby Fauquier County.
The town was an important stop on the stagecoach route between Washington, D.C. and Winchester, Virginia. The stagecoach route was used by many prominent figures of the time, including George Washington, Thomas Jefferson, and James Madison.
The town was also an important stop on the Manassas Gap Railroad, which connected the Shenandoah Valley to the Potomac River. The railroad was used to transport goods and passengers between the two regions.
The town was also the site of a Civil War battle in 1862. The Battle of The Plains was fought between Union and Confederate forces and resulted in a Confederate victory.
The town has a rich history and is home to many historic sites, including the Fauquier County Courthouse, the Old Stone Church, and the Old Stone House.
Geography
The Plains is located in the foothills of the Blue Ridge Mountains in Fauquier County, Virginia. The town is situated at an elevation of 830 feet above sea level. The town is located about 40 miles west of Washington, D.C. and is bordered by the towns of Warrenton, Marshall, and Middleburg.
The town is situated in a rural area and is surrounded by rolling hills and farmland. The town is located near the Shenandoah River and is close to several state parks, including Sky Meadows State Park and Shenandoah National Park.
Economy
The economy of The Plains is largely based on agriculture and tourism. The town is home to several farms, including dairy farms, horse farms, and vegetable farms. The town is also home to several wineries and vineyards.
Tourism is an important part of the economy of The Plains. The town is home to several historic sites, including the Fauquier County Courthouse, the Old Stone Church, and the Old Stone House. The town is also home to several wineries and vineyards, which attract visitors from all over the region.
Demographics
The population of The Plains was 1,845 in the 2010 census. The town is predominantly white, with a small African American population. The median household income in The Plains is $63,750, and the median home value is $310,000. The town has a low unemployment rate of 3.2%.
The town is served by the Fauquier County Public Schools system. The town is home to several churches, including the Old Stone Church and the Church of the Brethren. The town is also home to several parks, including the Fauquier County Park and the Sky Meadows State Park.
Conclusion
The Plains is a small town located in Fauquier County, Virginia. The town has a rich history and is home to many historic sites. The economy of The Plains is largely based on agriculture and tourism. The town is predominantly white, with a small African American population. The town is served by the Fauquier County Public Schools system and is home to several churches and parks.
Common Questions
What is Per Capita Income in The Plains?
Per Capita income in The Plains is $34,654.
What is the Median Family Income in The Plains?
Median Family Income in The Plains is $109,333.
What is the Median Household income in The Plains?
Median Household Income in The Plains is $108,250.
What is Inequality or Gini Index in The Plains?
Inequality or Gini Index in The Plains is 0.30.
What is the Total Population of The Plains?
Total Population of The Plains is 273.
What is the Total Male Population of The Plains?
Total Male Population of The Plains is 131.
What is the Total Female Population of The Plains?
Total Female Population of The Plains is 142.
What is the Ratio of Males per 100 Females in The Plains?
There are 92.25 Males per 100 Females in The Plains.
What is the Ratio of Females per 100 Males in The Plains?
There are 108.40 Females per 100 Males in The Plains.
What is the Median Population Age in The Plains?
Median Population Age in The Plains is 45.2 Years.
What is the Average Family Size in The Plains
Average Family Size in The Plains is 3.7 People.
What is the Average Household Size in The Plains
Average Household Size in The Plains is 2.9 People.
How Large is the Labor Force in The Plains?
There are 150 People in the Labor Forcein in The Plains.
What is the Percentage of People in the Labor Force in The Plains?
66.7% of People are in the Labor Force in The Plains.
What is the Unemployment Rate in The Plains?
Unemployment Rate in The Plains is 0.7%.