Surry, VA Map & Demographics
Surry Map
Surry Overview
$39,068
PER CAPITA INCOME
$91,964
AVG FAMILY INCOME
$87,917
AVG HOUSEHOLD INCOME
30.2%
WAGE / INCOME GAP [ % ]
69.8¢/ $1
WAGE / INCOME GAP [ $ ]
0.31
INEQUALITY / GINI INDEX
222
TOTAL POPULATION
107
MALE POPULATION
115
FEMALE POPULATION
93.04
MALES / 100 FEMALES
107.48
FEMALES / 100 MALES
45.9
MEDIAN AGE
3.3
AVG FAMILY SIZE
2.7
AVG HOUSEHOLD SIZE
111
LABOR FORCE [ PEOPLE ]
62.7%
PERCENT IN LABOR FORCE
1.8%
UNEMPLOYMENT RATE
Surry Zip Codes
Surry Area Codes
Income in Surry
Income Overview in Surry
Per Capita Income in Surry is $39,068, while median incomes of families and households are $91,964 and $87,917 respectively.
| Characteristic | Number | Measure |
| Per Capita Income | 222 | $39,068 |
| Median Family Income | 53 | $91,964 |
| Mean Family Income | 53 | $113,515 |
| Median Household Income | 83 | $87,917 |
| Mean Household Income | 83 | $96,742 |
| Income Deficit | 53 | $0 |
| Wage / Income Gap (%) | 222 | 30.23% |
| Wage / Income Gap ($) | 222 | 69.77¢ per $1 |
| Gini / Inequality Index | 222 | 0.31 |
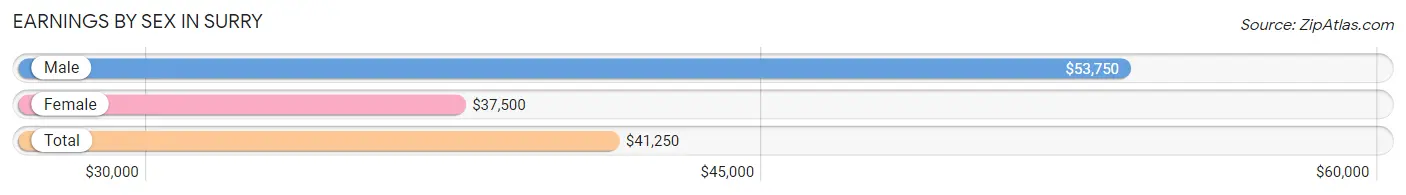
Earnings by Sex in Surry
Average Earnings in Surry are $41,250, $53,750 for men and $37,500 for women, a difference of 30.2%.
| Sex | Number | Average Earnings |
| Male | 68 (54.0%) | $53,750 |
| Female | 58 (46.0%) | $37,500 |
| Total | 126 (100.0%) | $41,250 |
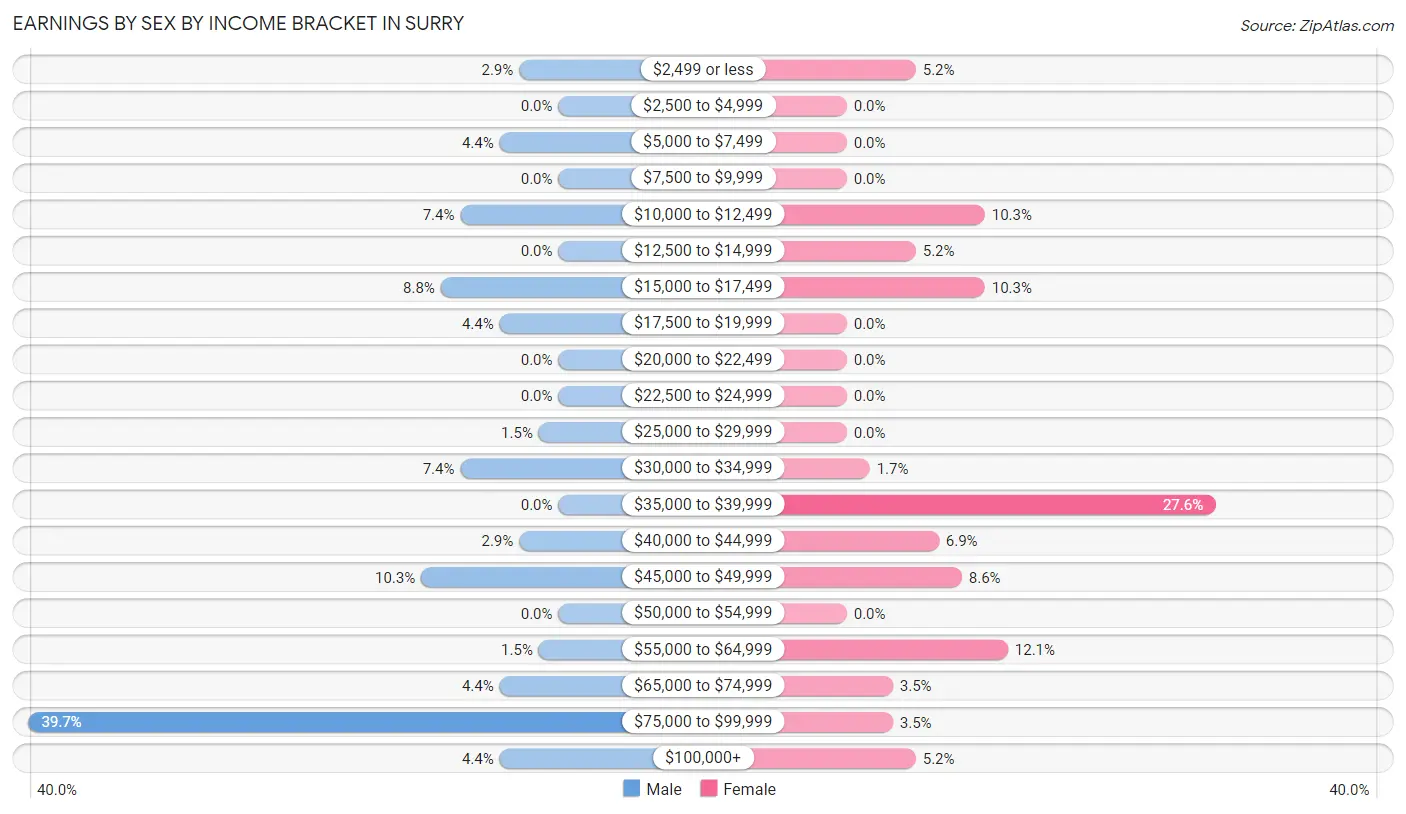
Earnings by Sex by Income Bracket in Surry
The most common earnings brackets in Surry are $75,000 to $99,999 for men (27 | 39.7%) and $35,000 to $39,999 for women (16 | 27.6%).
| Income | Male | Female |
| $2,499 or less | 2 (2.9%) | 3 (5.2%) |
| $2,500 to $4,999 | 0 (0.0%) | 0 (0.0%) |
| $5,000 to $7,499 | 3 (4.4%) | 0 (0.0%) |
| $7,500 to $9,999 | 0 (0.0%) | 0 (0.0%) |
| $10,000 to $12,499 | 5 (7.3%) | 6 (10.3%) |
| $12,500 to $14,999 | 0 (0.0%) | 3 (5.2%) |
| $15,000 to $17,499 | 6 (8.8%) | 6 (10.3%) |
| $17,500 to $19,999 | 3 (4.4%) | 0 (0.0%) |
| $20,000 to $22,499 | 0 (0.0%) | 0 (0.0%) |
| $22,500 to $24,999 | 0 (0.0%) | 0 (0.0%) |
| $25,000 to $29,999 | 1 (1.5%) | 0 (0.0%) |
| $30,000 to $34,999 | 5 (7.3%) | 1 (1.7%) |
| $35,000 to $39,999 | 0 (0.0%) | 16 (27.6%) |
| $40,000 to $44,999 | 2 (2.9%) | 4 (6.9%) |
| $45,000 to $49,999 | 7 (10.3%) | 5 (8.6%) |
| $50,000 to $54,999 | 0 (0.0%) | 0 (0.0%) |
| $55,000 to $64,999 | 1 (1.5%) | 7 (12.1%) |
| $65,000 to $74,999 | 3 (4.4%) | 2 (3.5%) |
| $75,000 to $99,999 | 27 (39.7%) | 2 (3.5%) |
| $100,000+ | 3 (4.4%) | 3 (5.2%) |
| Total | 68 (100.0%) | 58 (100.0%) |
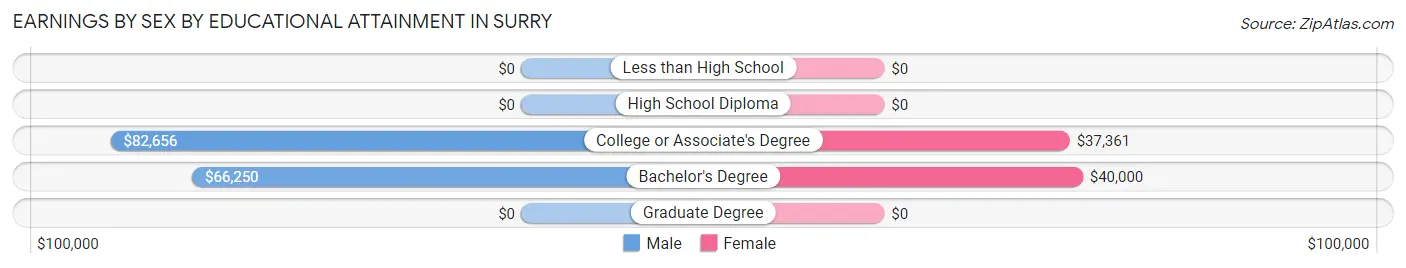
Earnings by Sex by Educational Attainment in Surry
Average earnings in Surry are $65,417 for men and $39,792 for women, a difference of 39.2%. Men with an educational attainment of college or associate's degree enjoy the highest average annual earnings of $82,656, while those with bachelor's degree education earn the least with $66,250. Women with an educational attainment of bachelor's degree earn the most with the average annual earnings of $40,000, while those with college or associate's degree education have the smallest earnings of $37,361.
| Educational Attainment | Male Income | Female Income |
| Less than High School | - | - |
| High School Diploma | - | - |
| College or Associate's Degree | $82,656 | $37,361 |
| Bachelor's Degree | $66,250 | $40,000 |
| Graduate Degree | - | - |
| Total | $65,417 | $39,792 |
Family Income in Surry
Family Income Brackets in Surry
According to the Surry family income data, there are 26 families falling into the $75,000 to $99,999 income range, which is the most common income bracket and makes up 49.1% of all families.
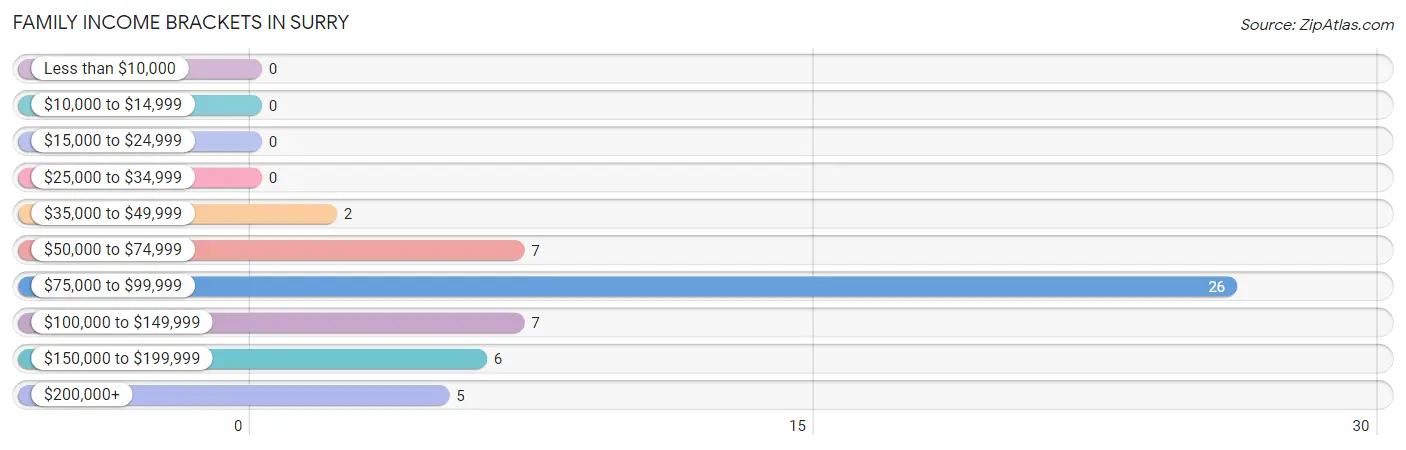
| Income Bracket | # Families | % Families |
| Less than $10,000 | 0 | 0.0% |
| $10,000 to $14,999 | 0 | 0.0% |
| $15,000 to $24,999 | 0 | 0.0% |
| $25,000 to $34,999 | 0 | 0.0% |
| $35,000 to $49,999 | 2 | 3.8% |
| $50,000 to $74,999 | 7 | 13.2% |
| $75,000 to $99,999 | 26 | 49.1% |
| $100,000 to $149,999 | 7 | 13.2% |
| $150,000 to $199,999 | 6 | 11.3% |
| $200,000+ | 5 | 9.4% |
Family Income by Famaliy Size in Surry
3-person families (19 | 35.8%) account for the highest median family income in Surry with $97,083 per family, while 2-person families (24 | 45.3%) have the highest median income of $45,536 per family member.
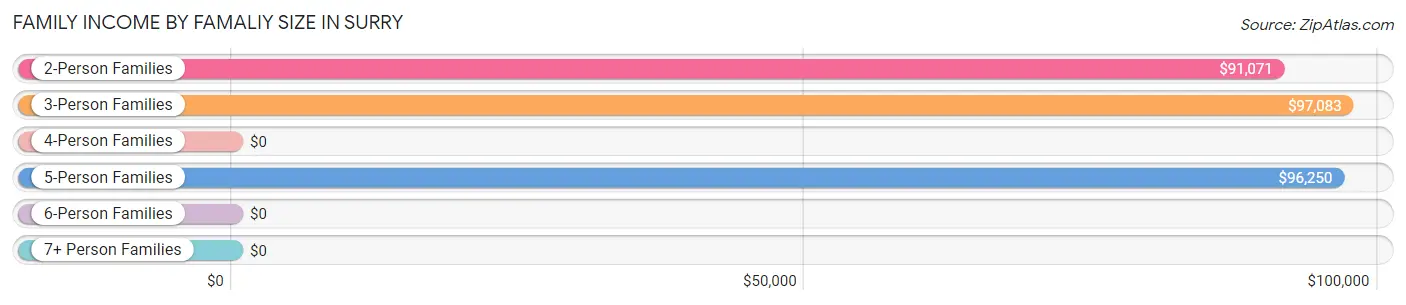
| Income Bracket | # Families | Median Income |
| 2-Person Families | 24 (45.3%) | $91,071 |
| 3-Person Families | 19 (35.8%) | $97,083 |
| 4-Person Families | 2 (3.8%) | $0 |
| 5-Person Families | 6 (11.3%) | $96,250 |
| 6-Person Families | 2 (3.8%) | $0 |
| 7+ Person Families | 0 (0.0%) | $0 |
| Total | 53 (100.0%) | $91,964 |
Family Income by Number of Earners in Surry
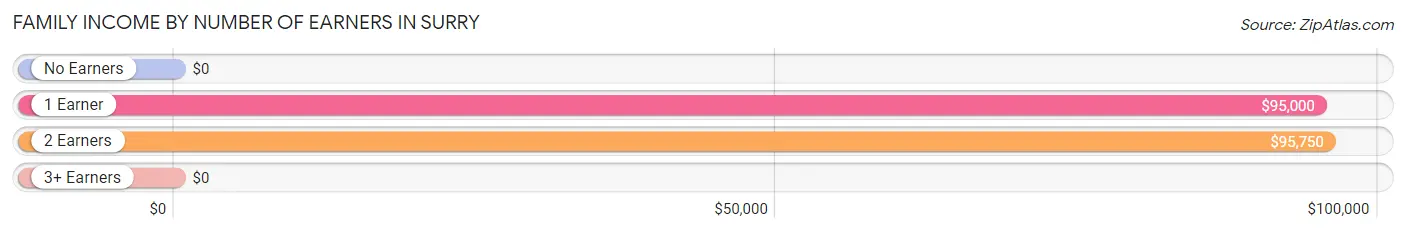
| Number of Earners | # Families | Median Income |
| No Earners | 6 (11.3%) | $0 |
| 1 Earner | 16 (30.2%) | $95,000 |
| 2 Earners | 29 (54.7%) | $95,750 |
| 3+ Earners | 2 (3.8%) | $0 |
| Total | 53 (100.0%) | $91,964 |
Household Income in Surry
Household Income Brackets in Surry
With 31 households falling in the category, the $75,000 to $99,999 income range is the most frequent in Surry, accounting for 37.3% of all households.
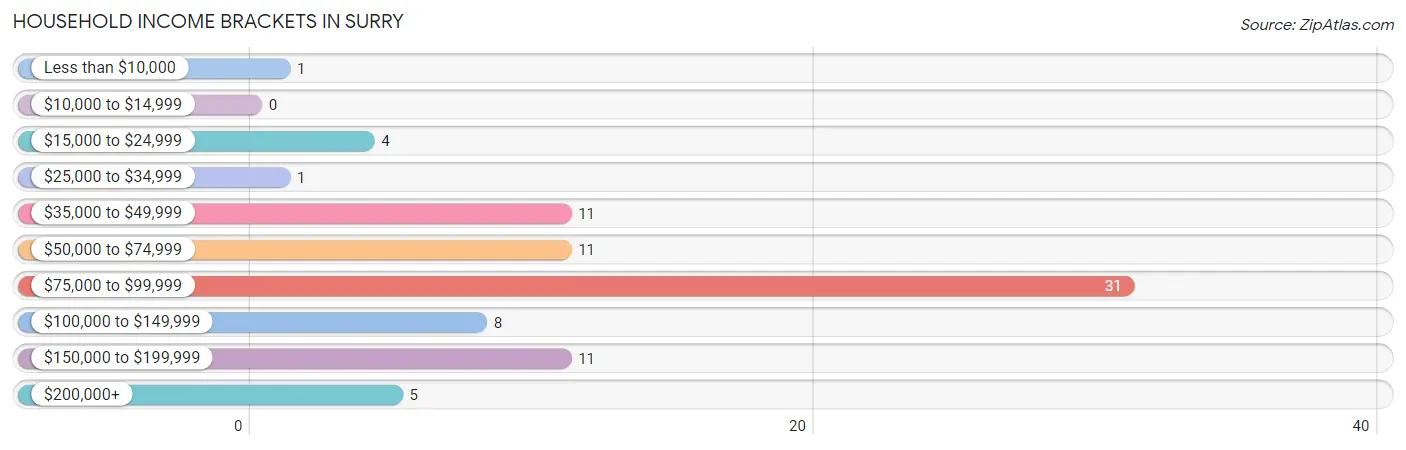
| Income Bracket | # Households | % Households |
| Less than $10,000 | 1 | 1.2% |
| $10,000 to $14,999 | 0 | 0.0% |
| $15,000 to $24,999 | 4 | 4.8% |
| $25,000 to $34,999 | 1 | 1.2% |
| $35,000 to $49,999 | 11 | 13.3% |
| $50,000 to $74,999 | 11 | 13.3% |
| $75,000 to $99,999 | 31 | 37.3% |
| $100,000 to $149,999 | 8 | 9.6% |
| $150,000 to $199,999 | 11 | 13.3% |
| $200,000+ | 5 | 6.0% |
Household Income by Householder Age in Surry
The median household income in Surry is $87,917, with the highest median household income of $95,750 found in the 25 to 44 years age bracket for the primary householder. A total of 11 households (13.3%) fall into this category. Meanwhile, the 15 to 24 years age bracket for the primary householder has the lowest median household income of $0, with 1 households (1.2%) in this group.
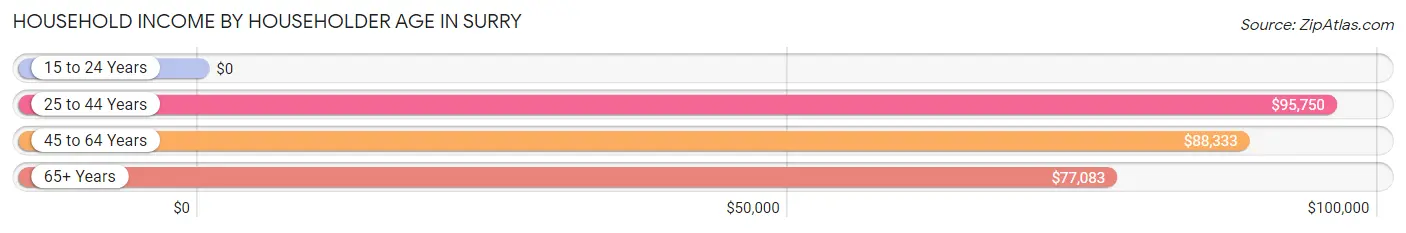
| Income Bracket | # Households | Median Income |
| 15 to 24 Years | 1 (1.2%) | $0 |
| 25 to 44 Years | 11 (13.3%) | $95,750 |
| 45 to 64 Years | 44 (53.0%) | $88,333 |
| 65+ Years | 27 (32.5%) | $77,083 |
| Total | 83 (100.0%) | $87,917 |
Poverty in Surry
Income Below Poverty by Sex and Age in Surry
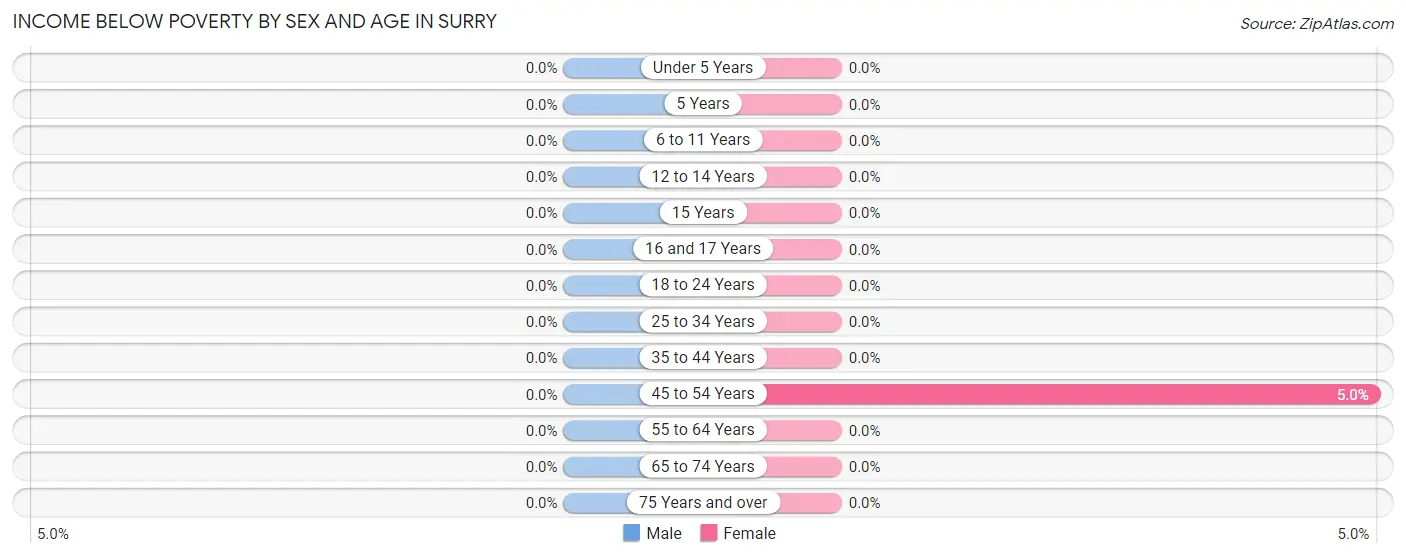
| Age Bracket | Male | Female |
| Under 5 Years | 0 (0.0%) | 0 (0.0%) |
| 5 Years | 0 (0.0%) | 0 (0.0%) |
| 6 to 11 Years | 0 (0.0%) | 0 (0.0%) |
| 12 to 14 Years | 0 (0.0%) | 0 (0.0%) |
| 15 Years | 0 (0.0%) | 0 (0.0%) |
| 16 and 17 Years | 0 (0.0%) | 0 (0.0%) |
| 18 to 24 Years | 0 (0.0%) | 0 (0.0%) |
| 25 to 34 Years | 0 (0.0%) | 0 (0.0%) |
| 35 to 44 Years | 0 (0.0%) | 0 (0.0%) |
| 45 to 54 Years | 0 (0.0%) | 1 (5.0%) |
| 55 to 64 Years | 0 (0.0%) | 0 (0.0%) |
| 65 to 74 Years | 0 (0.0%) | 0 (0.0%) |
| 75 Years and over | 0 (0.0%) | 0 (0.0%) |
| Total | 0 (0.0%) | 1 (0.9%) |
Income Above Poverty by Sex and Age in Surry
According to the poverty statistics in Surry, males aged under 5 years and females aged under 5 years are the age groups that are most secure financially, with 100.0% of males and 100.0% of females in these age groups living above the poverty line.
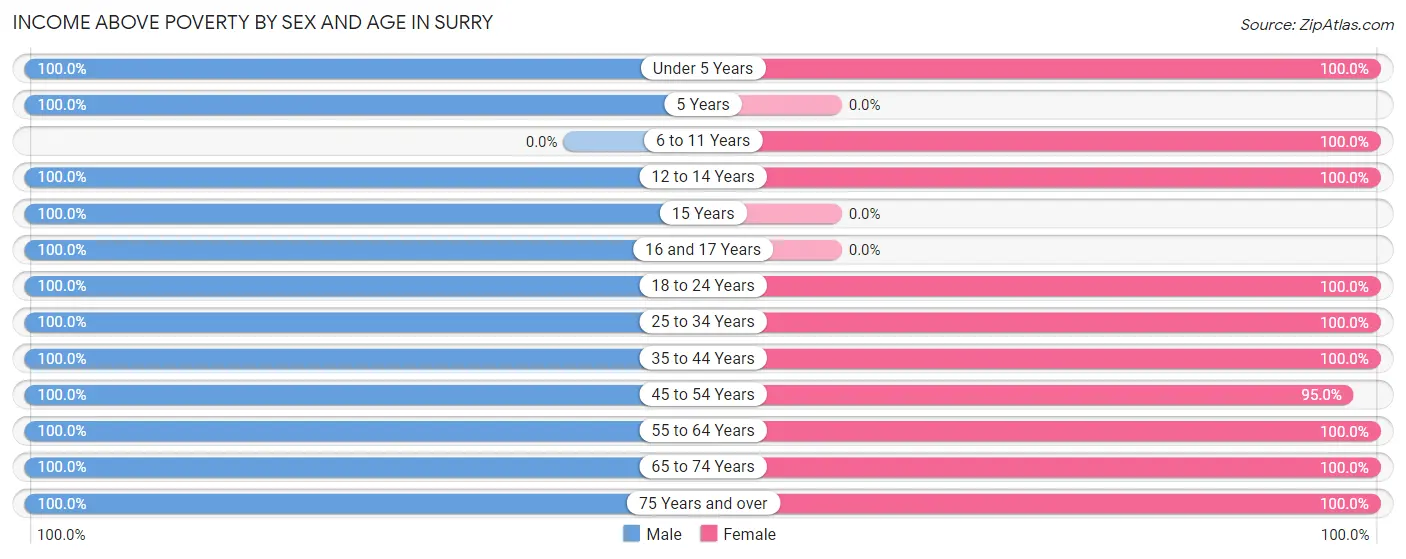
| Age Bracket | Male | Female |
| Under 5 Years | 9 (100.0%) | 10 (100.0%) |
| 5 Years | 1 (100.0%) | 0 (0.0%) |
| 6 to 11 Years | 0 (0.0%) | 7 (100.0%) |
| 12 to 14 Years | 3 (100.0%) | 13 (100.0%) |
| 15 Years | 2 (100.0%) | 0 (0.0%) |
| 16 and 17 Years | 1 (100.0%) | 0 (0.0%) |
| 18 to 24 Years | 3 (100.0%) | 11 (100.0%) |
| 25 to 34 Years | 18 (100.0%) | 11 (100.0%) |
| 35 to 44 Years | 13 (100.0%) | 3 (100.0%) |
| 45 to 54 Years | 17 (100.0%) | 19 (95.0%) |
| 55 to 64 Years | 18 (100.0%) | 24 (100.0%) |
| 65 to 74 Years | 12 (100.0%) | 11 (100.0%) |
| 75 Years and over | 10 (100.0%) | 5 (100.0%) |
| Total | 107 (100.0%) | 114 (99.1%) |
Income Below Poverty Among Married-Couple Families in Surry
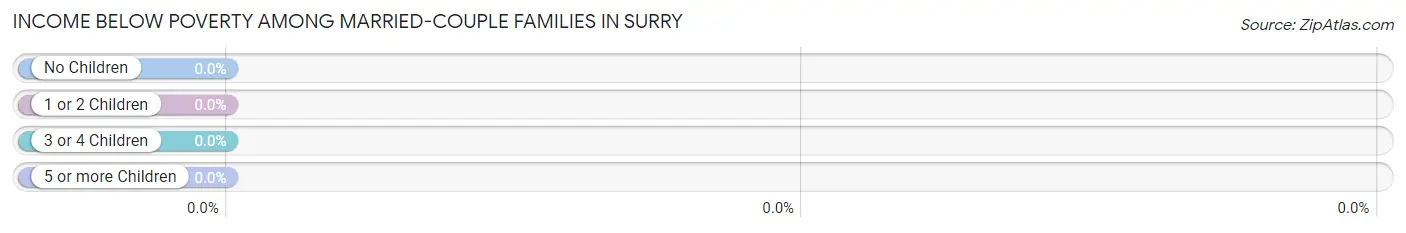
| Children | Above Poverty | Below Poverty |
| No Children | 30 (100.0%) | 0 (0.0%) |
| 1 or 2 Children | 12 (100.0%) | 0 (0.0%) |
| 3 or 4 Children | 6 (100.0%) | 0 (0.0%) |
| 5 or more Children | 0 (0.0%) | 0 (0.0%) |
| Total | 48 (100.0%) | 0 (0.0%) |
Income Below Poverty Among Single-Parent Households in Surry
| Children | Single Father | Single Mother |
| No Children | 0 (0.0%) | 0 (0.0%) |
| 1 or 2 Children | 0 (0.0%) | 0 (0.0%) |
| 3 or 4 Children | 0 (0.0%) | 0 (0.0%) |
| 5 or more Children | 0 (0.0%) | 0 (0.0%) |
| Total | 0 (0.0%) | 0 (0.0%) |
Income Below Poverty Among Married-Couple vs Single-Parent Households in Surry
| Children | Married-Couple Families | Single-Parent Households |
| No Children | 0 (0.0%) | 0 (0.0%) |
| 1 or 2 Children | 0 (0.0%) | 0 (0.0%) |
| 3 or 4 Children | 0 (0.0%) | 0 (0.0%) |
| 5 or more Children | 0 (0.0%) | 0 (0.0%) |
| Total | 0 (0.0%) | 0 (0.0%) |
Race in Surry
The most populous races in Surry are White / Caucasian (159 | 71.6%), Black / African American (45 | 20.3%), and Two or more Races (18 | 8.1%).
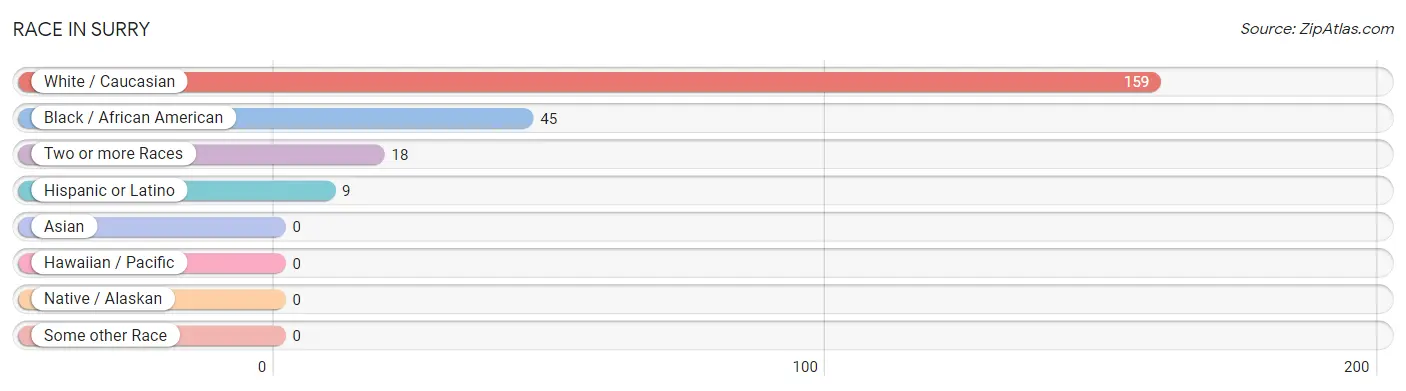
| Race | # Population | % Population |
| Asian | 0 | 0.0% |
| Black / African American | 45 | 20.3% |
| Hawaiian / Pacific | 0 | 0.0% |
| Hispanic or Latino | 9 | 4.1% |
| Native / Alaskan | 0 | 0.0% |
| White / Caucasian | 159 | 71.6% |
| Two or more Races | 18 | 8.1% |
| Some other Race | 0 | 0.0% |
| Total | 222 | 100.0% |
Ancestry in Surry
The most populous ancestries reported in Surry are Irish (40 | 18.0%), English (35 | 15.8%), German (12 | 5.4%), Subsaharan African (12 | 5.4%), and African (11 | 5.0%), together accounting for 49.6% of all Surry residents.
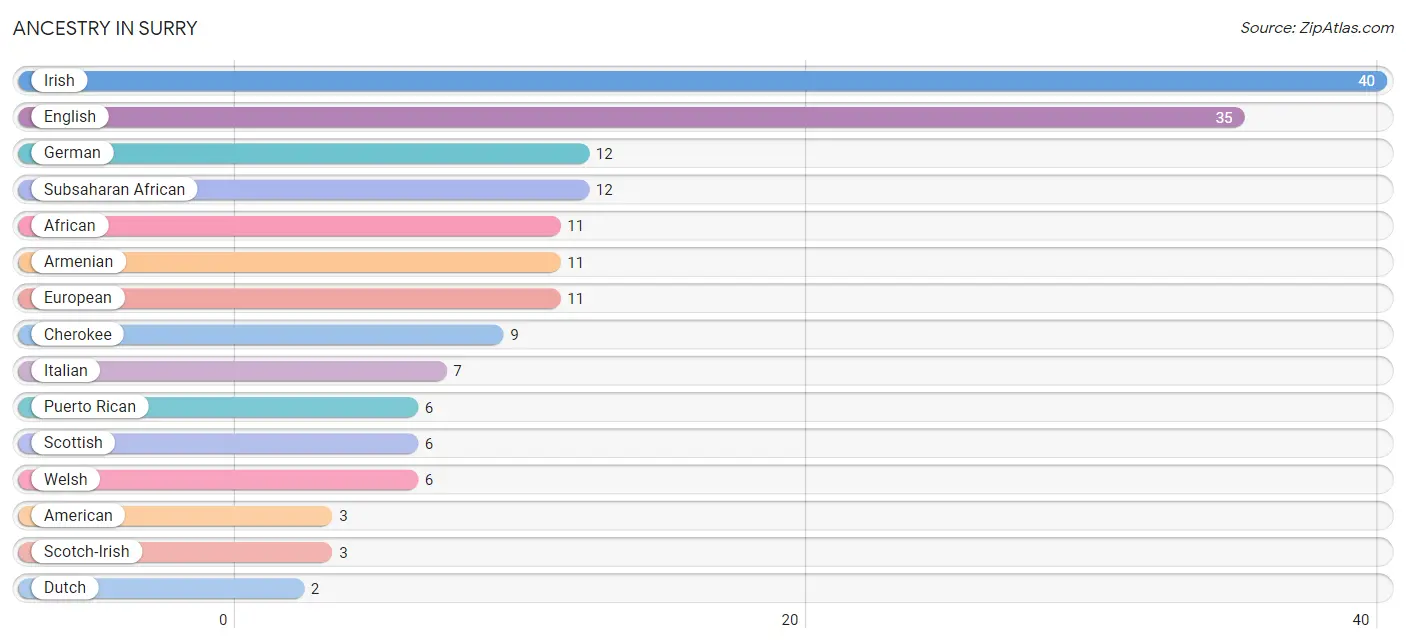
| Ancestry | # Population | % Population |
| African | 11 | 5.0% |
| American | 3 | 1.3% |
| Armenian | 11 | 5.0% |
| Cherokee | 9 | 4.1% |
| Dutch | 2 | 0.9% |
| English | 35 | 15.8% |
| European | 11 | 5.0% |
| French | 2 | 0.9% |
| German | 12 | 5.4% |
| Irish | 40 | 18.0% |
| Italian | 7 | 3.2% |
| Lithuanian | 1 | 0.4% |
| Mexican | 1 | 0.4% |
| Nigerian | 1 | 0.4% |
| Polish | 2 | 0.9% |
| Puerto Rican | 6 | 2.7% |
| Scotch-Irish | 3 | 1.3% |
| Scottish | 6 | 2.7% |
| Subsaharan African | 12 | 5.4% |
| Welsh | 6 | 2.7% | View All 20 Rows |
Immigrants in Surry
The most numerous immigrant groups reported in Surry came from Argentina (2 | 0.9%), Latin America (2 | 0.9%), and South America (2 | 0.9%), together accounting for 2.7% of all Surry residents.
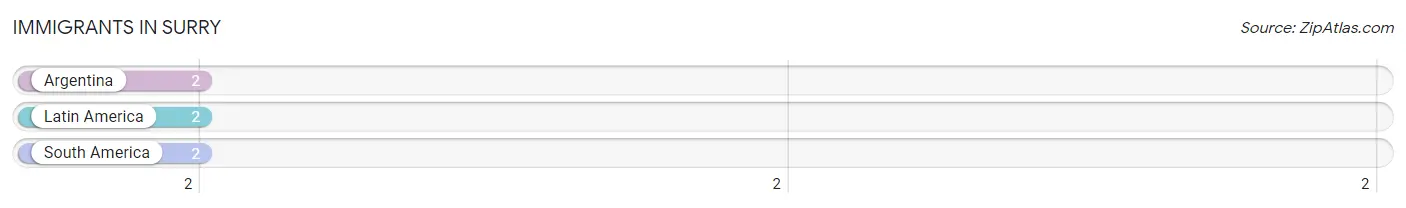
| Immigration Origin | # Population | % Population |
| Argentina | 2 | 0.9% |
| Latin America | 2 | 0.9% |
| South America | 2 | 0.9% | View All 3 Rows |
Sex and Age in Surry
Sex and Age in Surry
The most populous age groups in Surry are 50 to 54 Years (15 | 14.0%) for men and 60 to 64 Years (17 | 14.8%) for women.
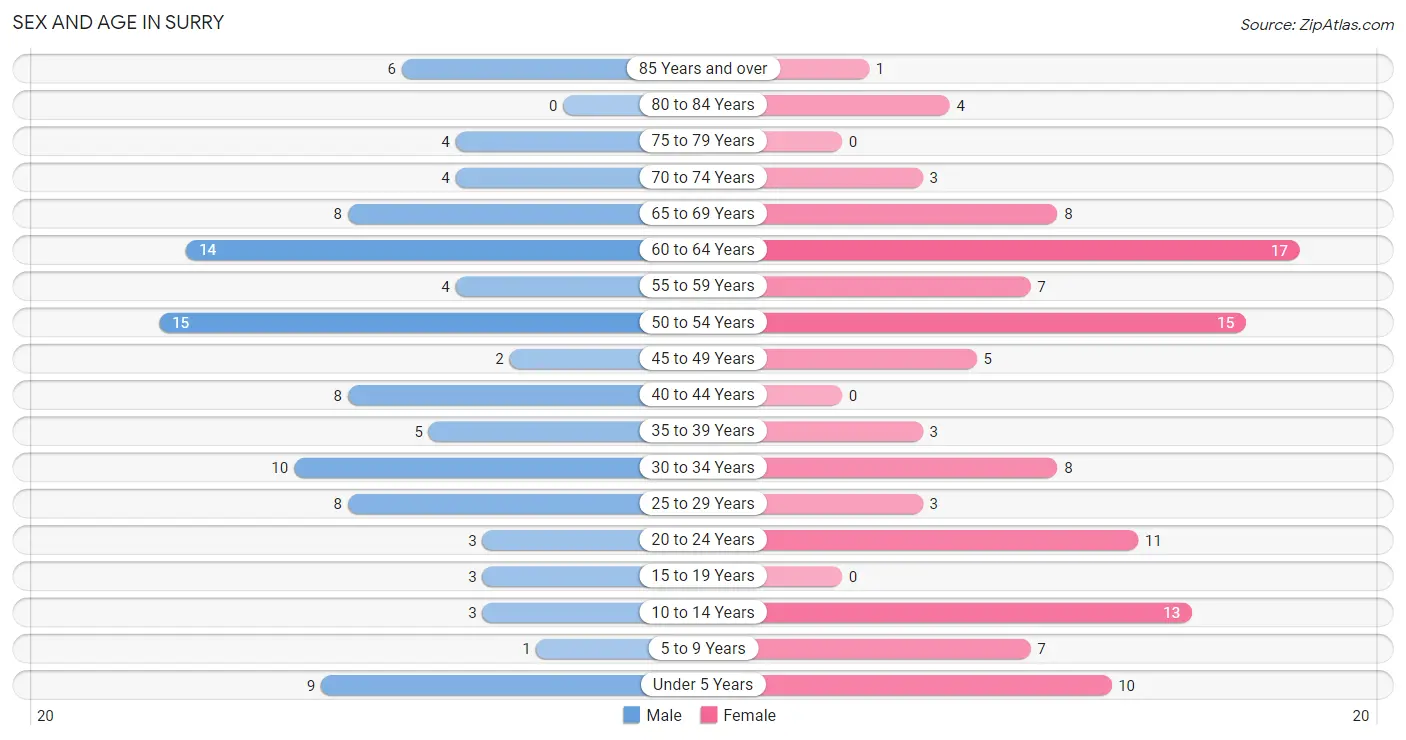
| Age Bracket | Male | Female |
| Under 5 Years | 9 (8.4%) | 10 (8.7%) |
| 5 to 9 Years | 1 (0.9%) | 7 (6.1%) |
| 10 to 14 Years | 3 (2.8%) | 13 (11.3%) |
| 15 to 19 Years | 3 (2.8%) | 0 (0.0%) |
| 20 to 24 Years | 3 (2.8%) | 11 (9.6%) |
| 25 to 29 Years | 8 (7.5%) | 3 (2.6%) |
| 30 to 34 Years | 10 (9.3%) | 8 (7.0%) |
| 35 to 39 Years | 5 (4.7%) | 3 (2.6%) |
| 40 to 44 Years | 8 (7.5%) | 0 (0.0%) |
| 45 to 49 Years | 2 (1.9%) | 5 (4.3%) |
| 50 to 54 Years | 15 (14.0%) | 15 (13.0%) |
| 55 to 59 Years | 4 (3.7%) | 7 (6.1%) |
| 60 to 64 Years | 14 (13.1%) | 17 (14.8%) |
| 65 to 69 Years | 8 (7.5%) | 8 (7.0%) |
| 70 to 74 Years | 4 (3.7%) | 3 (2.6%) |
| 75 to 79 Years | 4 (3.7%) | 0 (0.0%) |
| 80 to 84 Years | 0 (0.0%) | 4 (3.5%) |
| 85 Years and over | 6 (5.6%) | 1 (0.9%) |
| Total | 107 (100.0%) | 115 (100.0%) |
Families and Households in Surry
Median Family Size in Surry
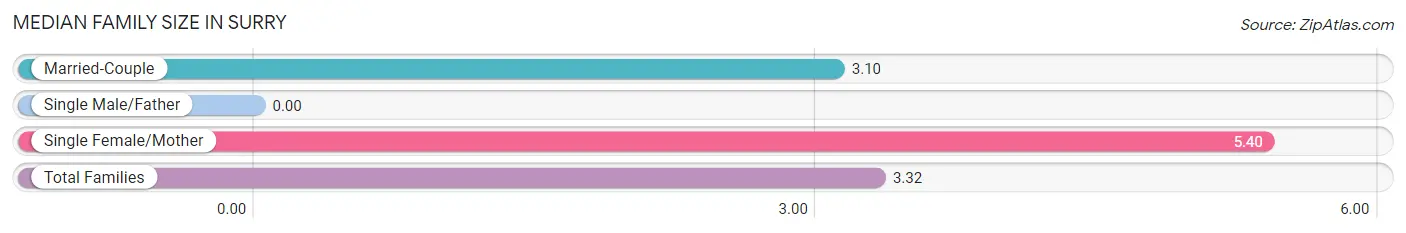
| Family Type | # Families | Family Size |
| Married-Couple | 48 (90.6%) | 3.10 |
| Single Male/Father | 0 (0.0%) | - |
| Single Female/Mother | 5 (9.4%) | 5.40 |
| Total Families | 53 (100.0%) | 3.32 |
Median Household Size in Surry
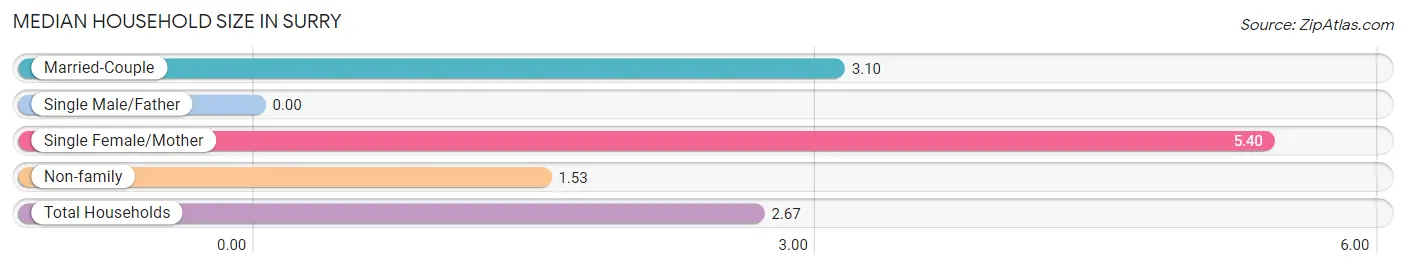
| Household Type | # Households | Household Size |
| Married-Couple | 48 (57.8%) | 3.10 |
| Single Male/Father | 0 (0.0%) | - |
| Single Female/Mother | 5 (6.0%) | 5.40 |
| Non-family | 30 (36.1%) | 1.53 |
| Total Households | 83 (100.0%) | 2.67 |
Household Size by Marriage Status in Surry
Out of a total of 83 households in Surry, 53 (63.9%) are family households, while 30 (36.1%) are nonfamily households. The most numerous type of family households are 2-person households, comprising 24, and the most common type of nonfamily households are 1-person households, comprising 23.
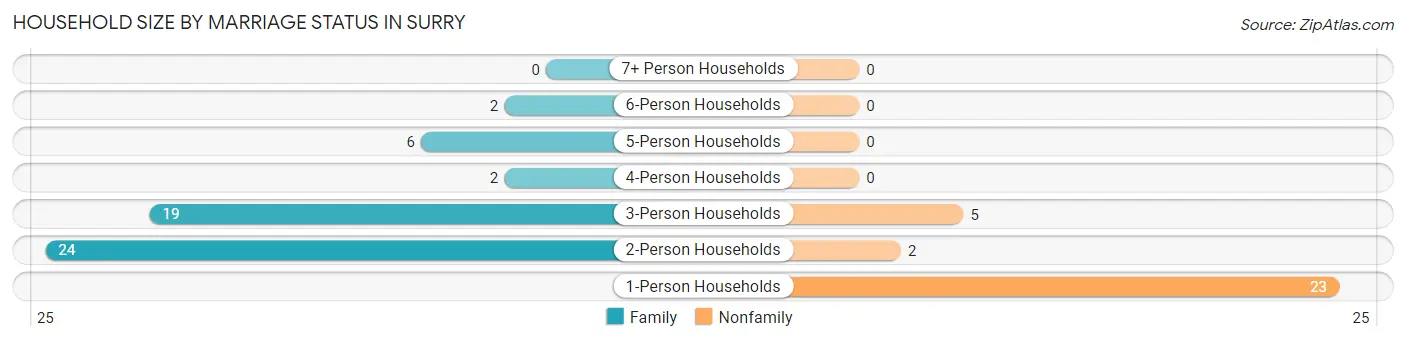
| Household Size | Family Households | Nonfamily Households |
| 1-Person Households | - | 23 (27.7%) |
| 2-Person Households | 24 (28.9%) | 2 (2.4%) |
| 3-Person Households | 19 (22.9%) | 5 (6.0%) |
| 4-Person Households | 2 (2.4%) | 0 (0.0%) |
| 5-Person Households | 6 (7.2%) | 0 (0.0%) |
| 6-Person Households | 2 (2.4%) | 0 (0.0%) |
| 7+ Person Households | 0 (0.0%) | 0 (0.0%) |
| Total | 53 (63.9%) | 30 (36.1%) |
Female Fertility in Surry
Fertility by Age in Surry
Average fertility rate in Surry is 33.0 births per 1,000 women. Women in the age bracket of 20 to 34 years have the highest fertility rate with 45.0 births per 1,000 women. Women in the age bracket of 20 to 34 years acount for 100.0% of all women with births.
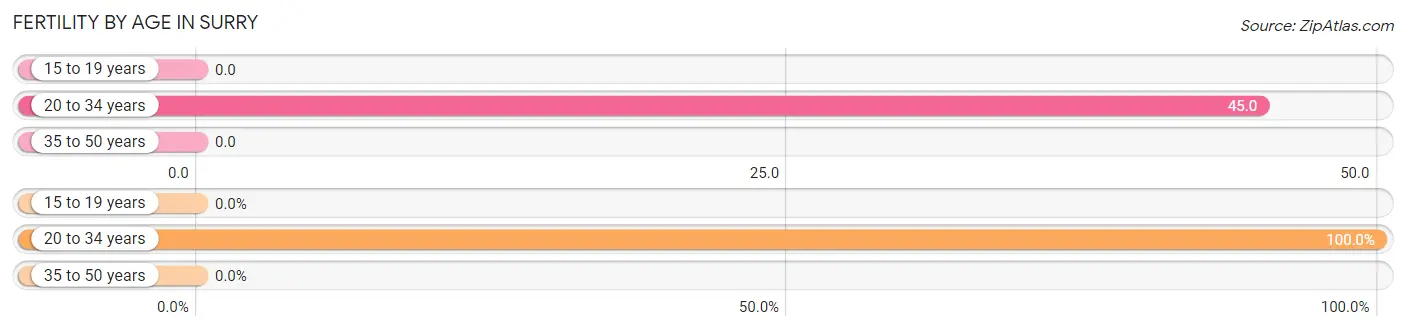
| Age Bracket | Women with Births | Births / 1,000 Women |
| 15 to 19 years | 0 (0.0%) | 0.0 |
| 20 to 34 years | 1 (100.0%) | 45.0 |
| 35 to 50 years | 0 (0.0%) | 0.0 |
| Total | 1 (100.0%) | 33.0 |
Fertility by Age by Marriage Status in Surry
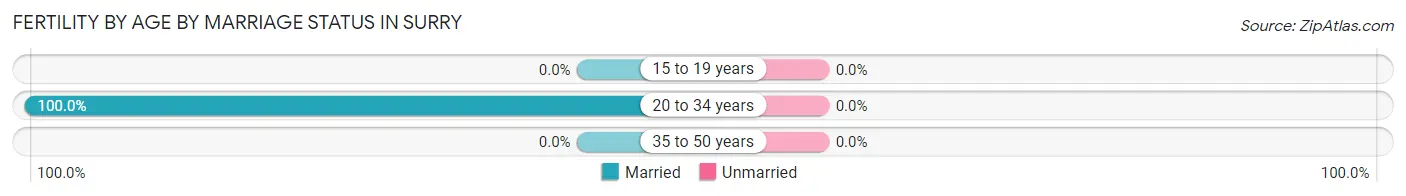
| Age Bracket | Married | Unmarried |
| 15 to 19 years | 0 (0.0%) | 0 (0.0%) |
| 20 to 34 years | 1 (100.0%) | 0 (0.0%) |
| 35 to 50 years | 0 (0.0%) | 0 (0.0%) |
| Total | 1 (100.0%) | 0 (0.0%) |
Fertility by Education in Surry
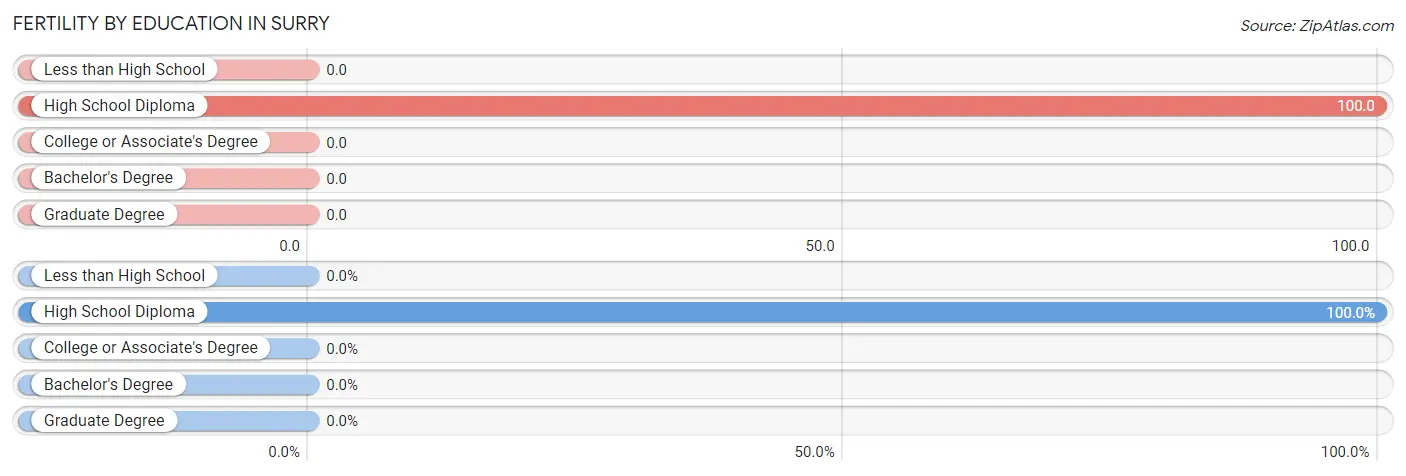
| Educational Attainment | Women with Births | Births / 1,000 Women |
| Less than High School | 0 (0.0%) | 0.0 |
| High School Diploma | 1 (100.0%) | 100.0 |
| College or Associate's Degree | 0 (0.0%) | 0.0 |
| Bachelor's Degree | 0 (0.0%) | 0.0 |
| Graduate Degree | 0 (0.0%) | 0.0 |
| Total | 1 (100.0%) | 33.0 |
Fertility by Education by Marriage Status in Surry
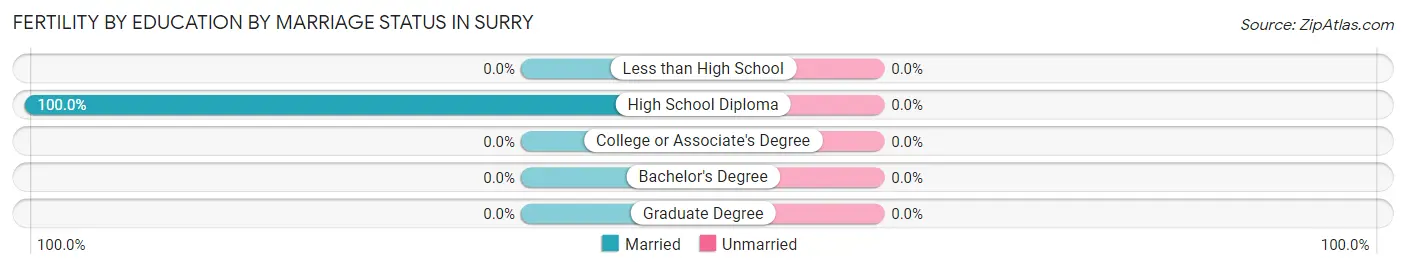
| Educational Attainment | Married | Unmarried |
| Less than High School | 0 (0.0%) | 0 (0.0%) |
| High School Diploma | 1 (100.0%) | 0 (0.0%) |
| College or Associate's Degree | 0 (0.0%) | 0 (0.0%) |
| Bachelor's Degree | 0 (0.0%) | 0 (0.0%) |
| Graduate Degree | 0 (0.0%) | 0 (0.0%) |
| Total | 1 (100.0%) | 0 (0.0%) |
Employment Characteristics in Surry
Employment by Class of Employer in Surry
Among the 109 employed individuals in Surry, private company employees (53 | 48.6%), self-employed (not incorporated) (15 | 13.8%), and local government employees (15 | 13.8%) make up the most common classes of employment.
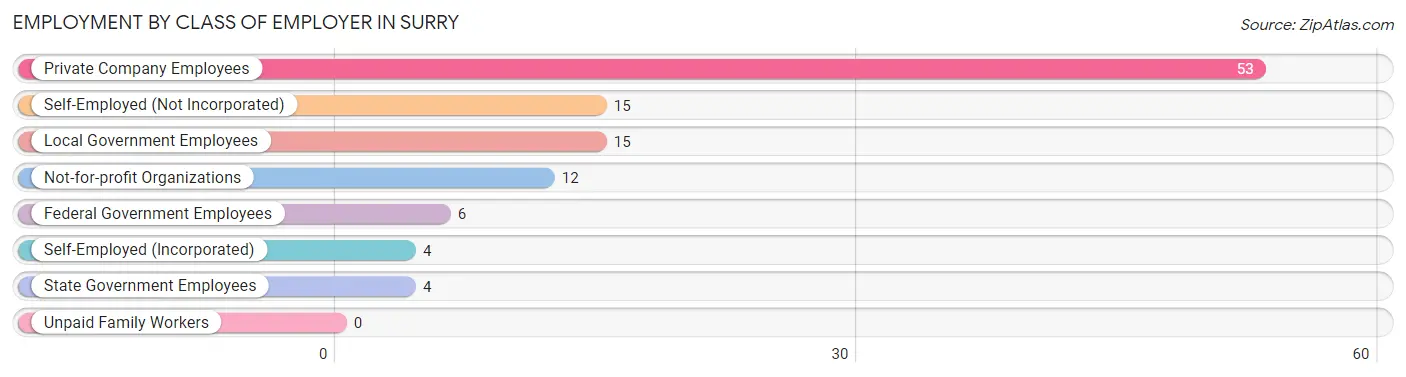
| Employer Class | # Employees | % Employees |
| Private Company Employees | 53 | 48.6% |
| Self-Employed (Incorporated) | 4 | 3.7% |
| Self-Employed (Not Incorporated) | 15 | 13.8% |
| Not-for-profit Organizations | 12 | 11.0% |
| Local Government Employees | 15 | 13.8% |
| State Government Employees | 4 | 3.7% |
| Federal Government Employees | 6 | 5.5% |
| Unpaid Family Workers | 0 | 0.0% |
| Total | 109 | 100.0% |
Employment Status by Age in Surry
According to the labor force statistics for Surry, out of the total population over 16 years of age (177), 62.7% or 111 individuals are in the labor force, with 1.8% or 2 of them unemployed. The age group with the highest labor force participation rate is 25 to 29 years, with 100.0% or 11 individuals in the labor force. Within the labor force, the 25 to 29 years age range has the highest percentage of unemployed individuals, with 18.2% or 2 of them being unemployed.
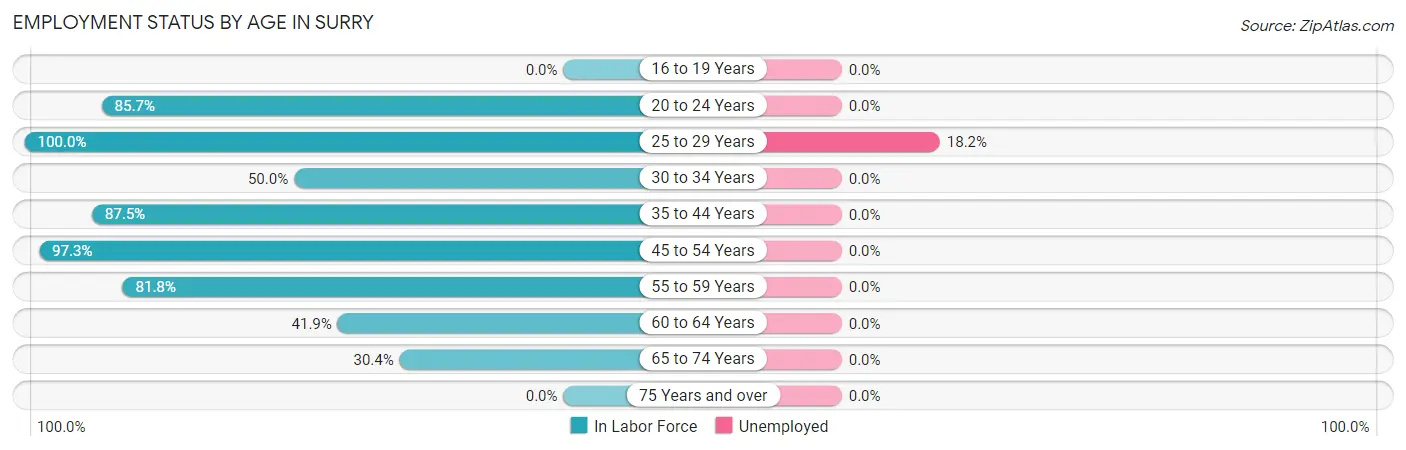
| Age Bracket | In Labor Force | Unemployed |
| 16 to 19 Years | 0 (0.0%) | 0 (0.0%) |
| 20 to 24 Years | 12 (85.7%) | 0 (0.0%) |
| 25 to 29 Years | 11 (100.0%) | 2 (18.2%) |
| 30 to 34 Years | 9 (50.0%) | 0 (0.0%) |
| 35 to 44 Years | 14 (87.5%) | 0 (0.0%) |
| 45 to 54 Years | 36 (97.3%) | 0 (0.0%) |
| 55 to 59 Years | 9 (81.8%) | 0 (0.0%) |
| 60 to 64 Years | 13 (41.9%) | 0 (0.0%) |
| 65 to 74 Years | 7 (30.4%) | 0 (0.0%) |
| 75 Years and over | 0 (0.0%) | 0 (0.0%) |
| Total | 111 (62.7%) | 2 (1.8%) |
Employment Status by Educational Attainment in Surry
According to labor force statistics for Surry, 74.2% of individuals (92) out of the total population between 25 and 64 years of age (124) are in the labor force, with 2.2% or 2 of them being unemployed. The group with the highest labor force participation rate are those with the educational attainment of college / associate degree, with 94.3% or 50 individuals in the labor force. Within the labor force, individuals with college / associate degree education have the highest percentage of unemployment, with 4.0% or 2 of them being unemployed.
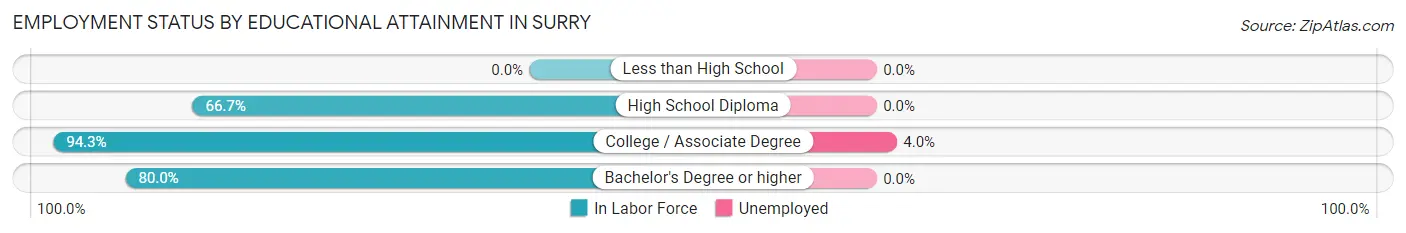
| Educational Attainment | In Labor Force | Unemployed |
| Less than High School | 0 (0.0%) | 0 (0.0%) |
| High School Diploma | 6 (66.7%) | 0 (0.0%) |
| College / Associate Degree | 50 (94.3%) | 2 (4.0%) |
| Bachelor's Degree or higher | 36 (80.0%) | 0 (0.0%) |
| Total | 92 (74.2%) | 3 (2.2%) |
Employment Occupations by Sex in Surry
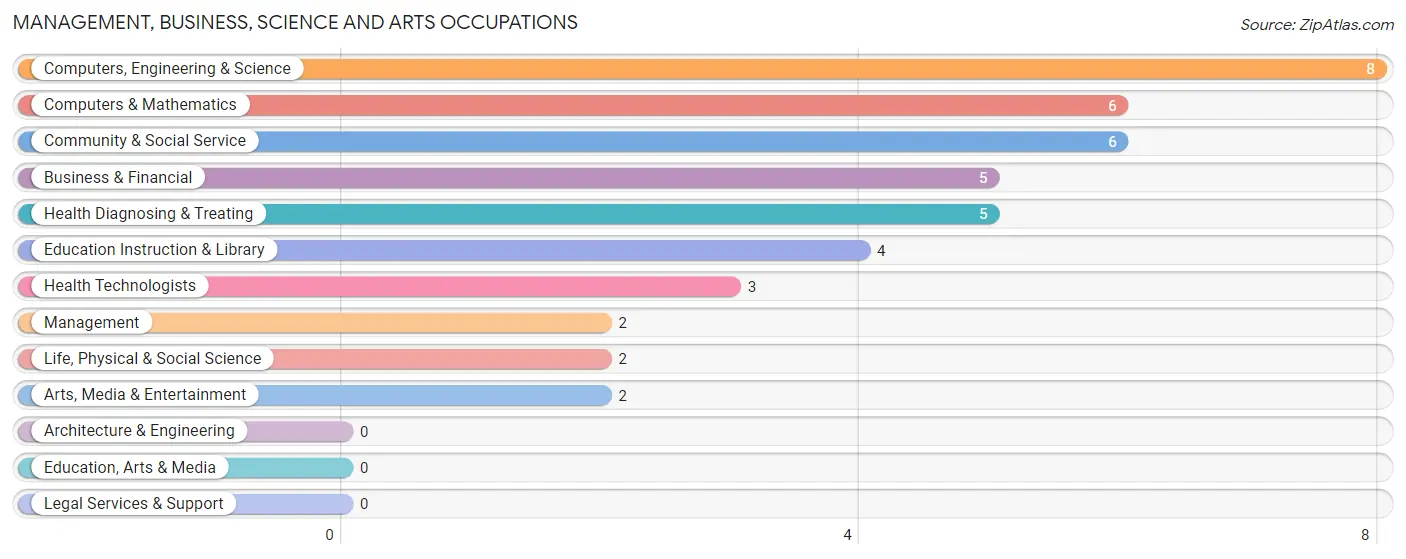
Management, Business, Science and Arts Occupations
The most common Management, Business, Science and Arts occupations in Surry are Computers, Engineering & Science (8 | 7.3%), Computers & Mathematics (6 | 5.5%), Community & Social Service (6 | 5.5%), Business & Financial (5 | 4.6%), and Health Diagnosing & Treating (5 | 4.6%).
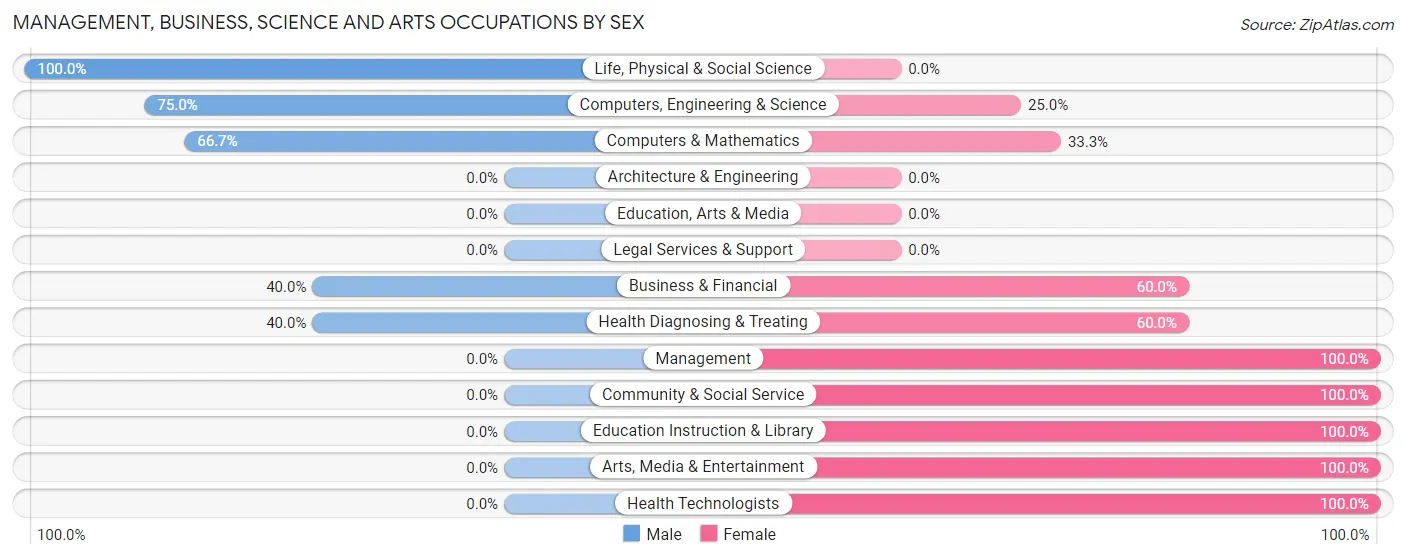
Management, Business, Science and Arts Occupations by Sex
Within the Management, Business, Science and Arts occupations in Surry, the most male-oriented occupations are Life, Physical & Social Science (100.0%), Computers, Engineering & Science (75.0%), and Computers & Mathematics (66.7%), while the most female-oriented occupations are Management (100.0%), Community & Social Service (100.0%), and Education Instruction & Library (100.0%).
| Occupation | Male | Female |
| Management | 0 (0.0%) | 2 (100.0%) |
| Business & Financial | 2 (40.0%) | 3 (60.0%) |
| Computers, Engineering & Science | 6 (75.0%) | 2 (25.0%) |
| Computers & Mathematics | 4 (66.7%) | 2 (33.3%) |
| Architecture & Engineering | 0 (0.0%) | 0 (0.0%) |
| Life, Physical & Social Science | 2 (100.0%) | 0 (0.0%) |
| Community & Social Service | 0 (0.0%) | 6 (100.0%) |
| Education, Arts & Media | 0 (0.0%) | 0 (0.0%) |
| Legal Services & Support | 0 (0.0%) | 0 (0.0%) |
| Education Instruction & Library | 0 (0.0%) | 4 (100.0%) |
| Arts, Media & Entertainment | 0 (0.0%) | 2 (100.0%) |
| Health Diagnosing & Treating | 2 (40.0%) | 3 (60.0%) |
| Health Technologists | 0 (0.0%) | 3 (100.0%) |
| Total (Category) | 10 (38.5%) | 16 (61.5%) |
| Total (Overall) | 57 (52.3%) | 52 (47.7%) |
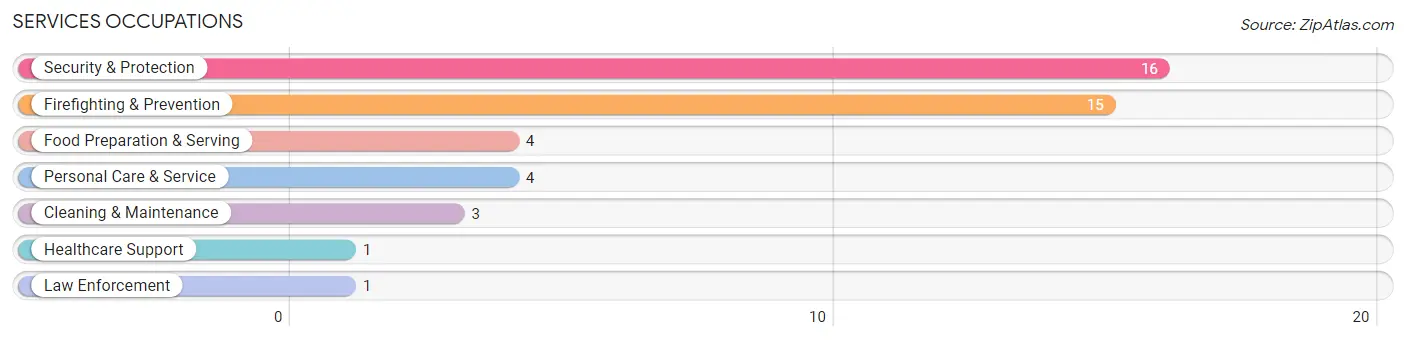
Services Occupations
The most common Services occupations in Surry are Security & Protection (16 | 14.7%), Firefighting & Prevention (15 | 13.8%), Food Preparation & Serving (4 | 3.7%), Personal Care & Service (4 | 3.7%), and Cleaning & Maintenance (3 | 2.8%).
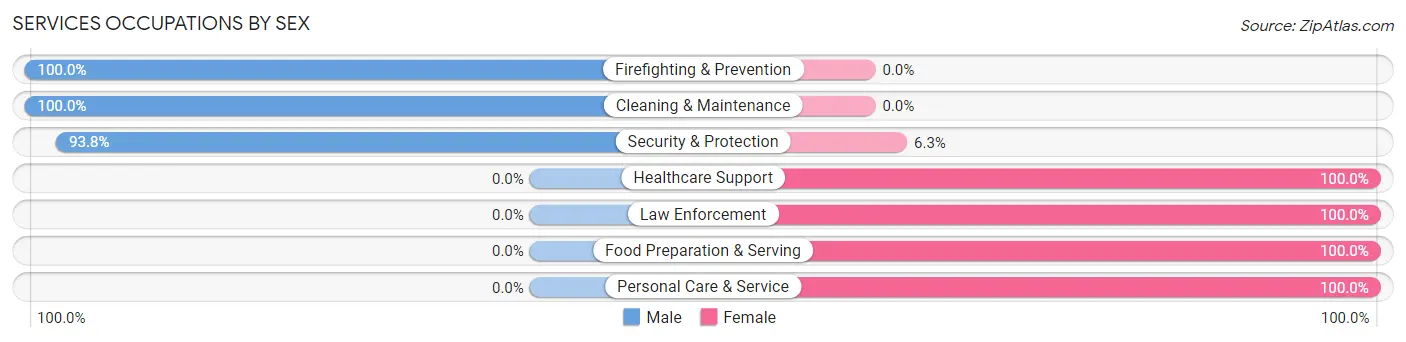
Services Occupations by Sex
Within the Services occupations in Surry, the most male-oriented occupations are Firefighting & Prevention (100.0%), Cleaning & Maintenance (100.0%), and Security & Protection (93.8%), while the most female-oriented occupations are Healthcare Support (100.0%), Law Enforcement (100.0%), and Food Preparation & Serving (100.0%).
| Occupation | Male | Female |
| Healthcare Support | 0 (0.0%) | 1 (100.0%) |
| Security & Protection | 15 (93.8%) | 1 (6.2%) |
| Firefighting & Prevention | 15 (100.0%) | 0 (0.0%) |
| Law Enforcement | 0 (0.0%) | 1 (100.0%) |
| Food Preparation & Serving | 0 (0.0%) | 4 (100.0%) |
| Cleaning & Maintenance | 3 (100.0%) | 0 (0.0%) |
| Personal Care & Service | 0 (0.0%) | 4 (100.0%) |
| Total (Category) | 18 (64.3%) | 10 (35.7%) |
| Total (Overall) | 57 (52.3%) | 52 (47.7%) |
Sales and Office Occupations
The most common Sales and Office occupations in Surry are Office & Administration (13 | 11.9%), and Sales & Related (8 | 7.3%).
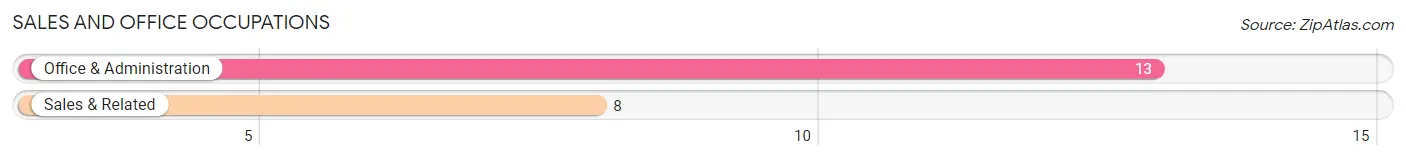
Sales and Office Occupations by Sex
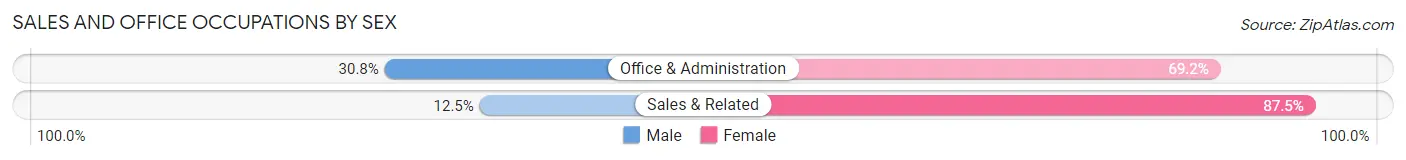
| Occupation | Male | Female |
| Sales & Related | 1 (12.5%) | 7 (87.5%) |
| Office & Administration | 4 (30.8%) | 9 (69.2%) |
| Total (Category) | 5 (23.8%) | 16 (76.2%) |
| Total (Overall) | 57 (52.3%) | 52 (47.7%) |
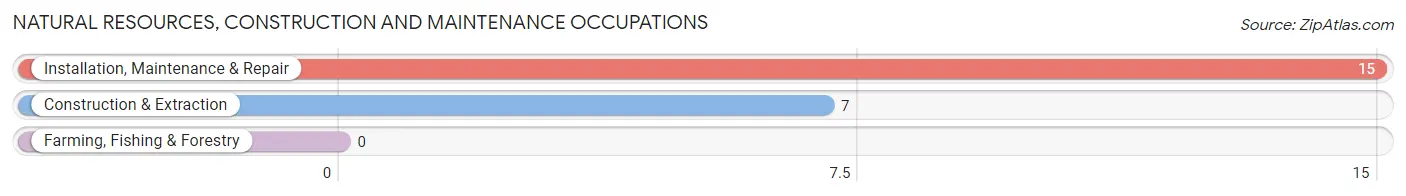
Natural Resources, Construction and Maintenance Occupations
The most common Natural Resources, Construction and Maintenance occupations in Surry are Installation, Maintenance & Repair (15 | 13.8%), and Construction & Extraction (7 | 6.4%).
Natural Resources, Construction and Maintenance Occupations by Sex
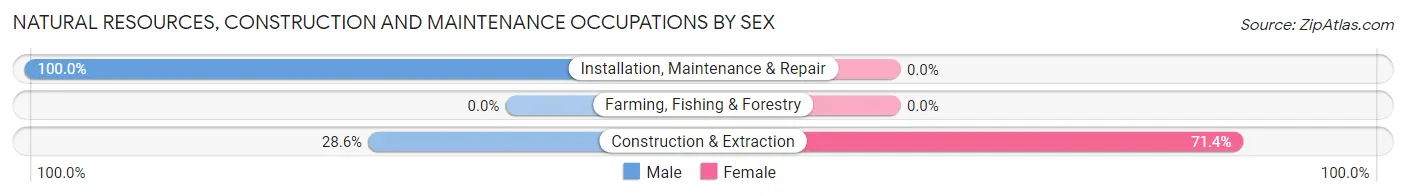
| Occupation | Male | Female |
| Farming, Fishing & Forestry | 0 (0.0%) | 0 (0.0%) |
| Construction & Extraction | 2 (28.6%) | 5 (71.4%) |
| Installation, Maintenance & Repair | 15 (100.0%) | 0 (0.0%) |
| Total (Category) | 17 (77.3%) | 5 (22.7%) |
| Total (Overall) | 57 (52.3%) | 52 (47.7%) |
Production, Transportation and Moving Occupations
The most common Production, Transportation and Moving occupations in Surry are Production (7 | 6.4%), and Material Moving (5 | 4.6%).
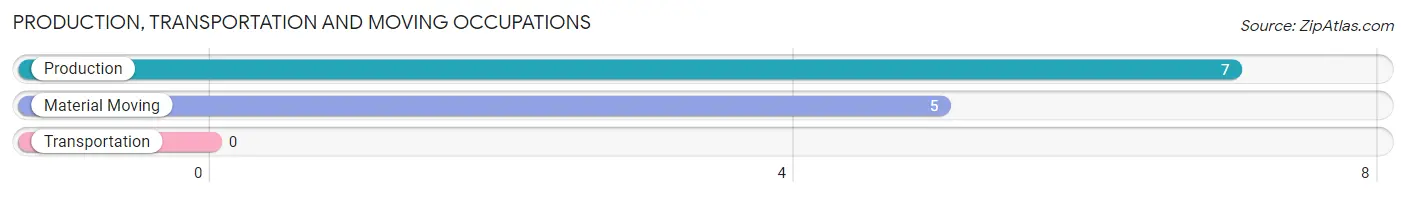
Production, Transportation and Moving Occupations by Sex
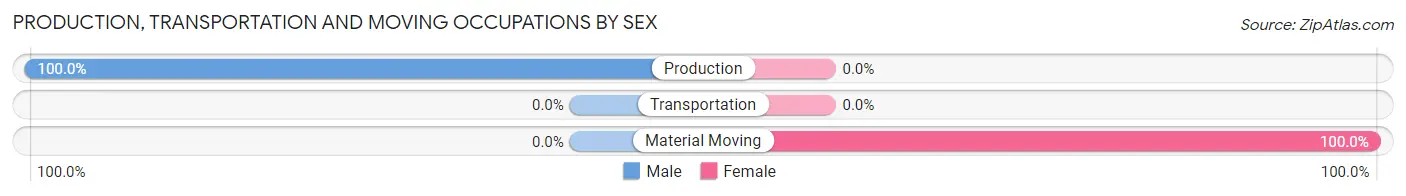
| Occupation | Male | Female |
| Production | 7 (100.0%) | 0 (0.0%) |
| Transportation | 0 (0.0%) | 0 (0.0%) |
| Material Moving | 0 (0.0%) | 5 (100.0%) |
| Total (Category) | 7 (58.3%) | 5 (41.7%) |
| Total (Overall) | 57 (52.3%) | 52 (47.7%) |
Employment Industries by Sex in Surry
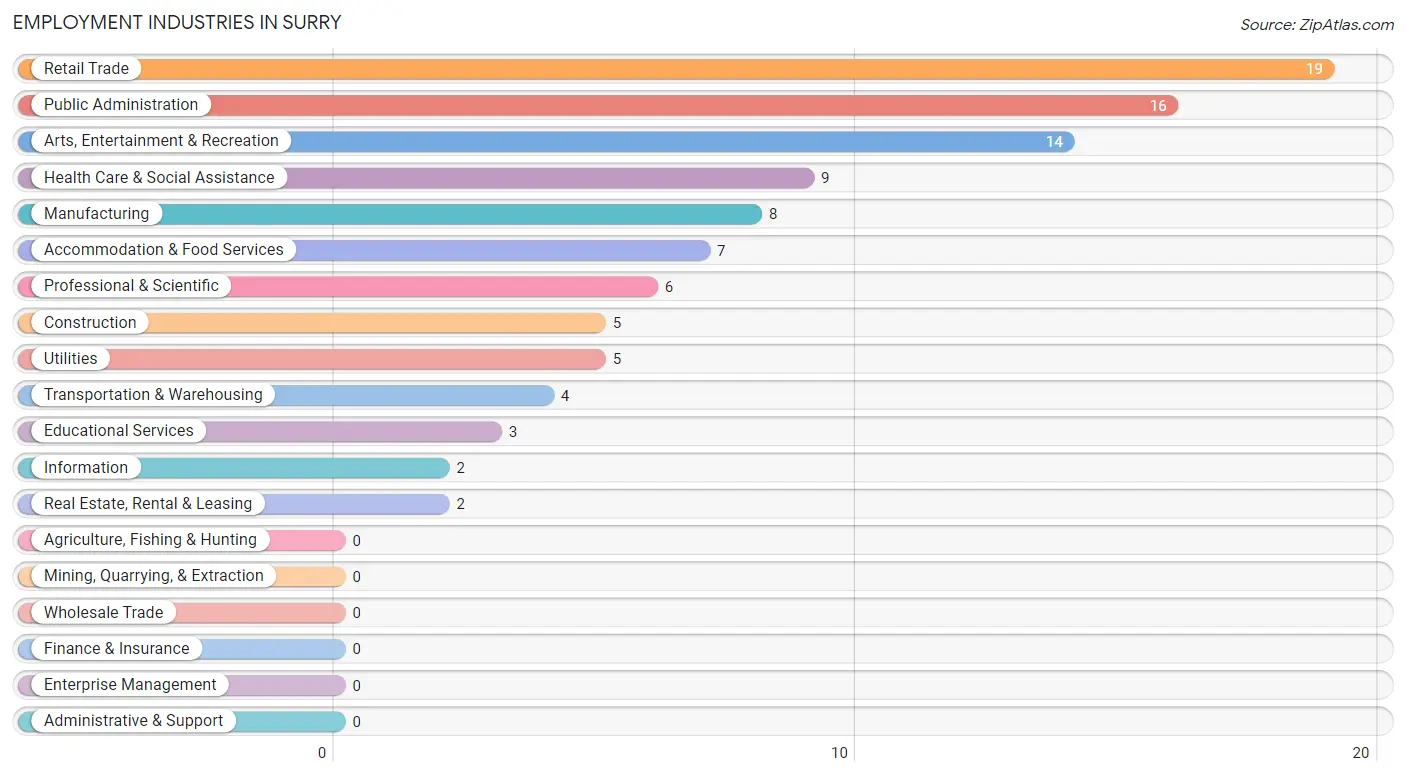
Employment Industries in Surry
The major employment industries in Surry include Retail Trade (19 | 17.4%), Public Administration (16 | 14.7%), Arts, Entertainment & Recreation (14 | 12.8%), Health Care & Social Assistance (9 | 8.3%), and Manufacturing (8 | 7.3%).
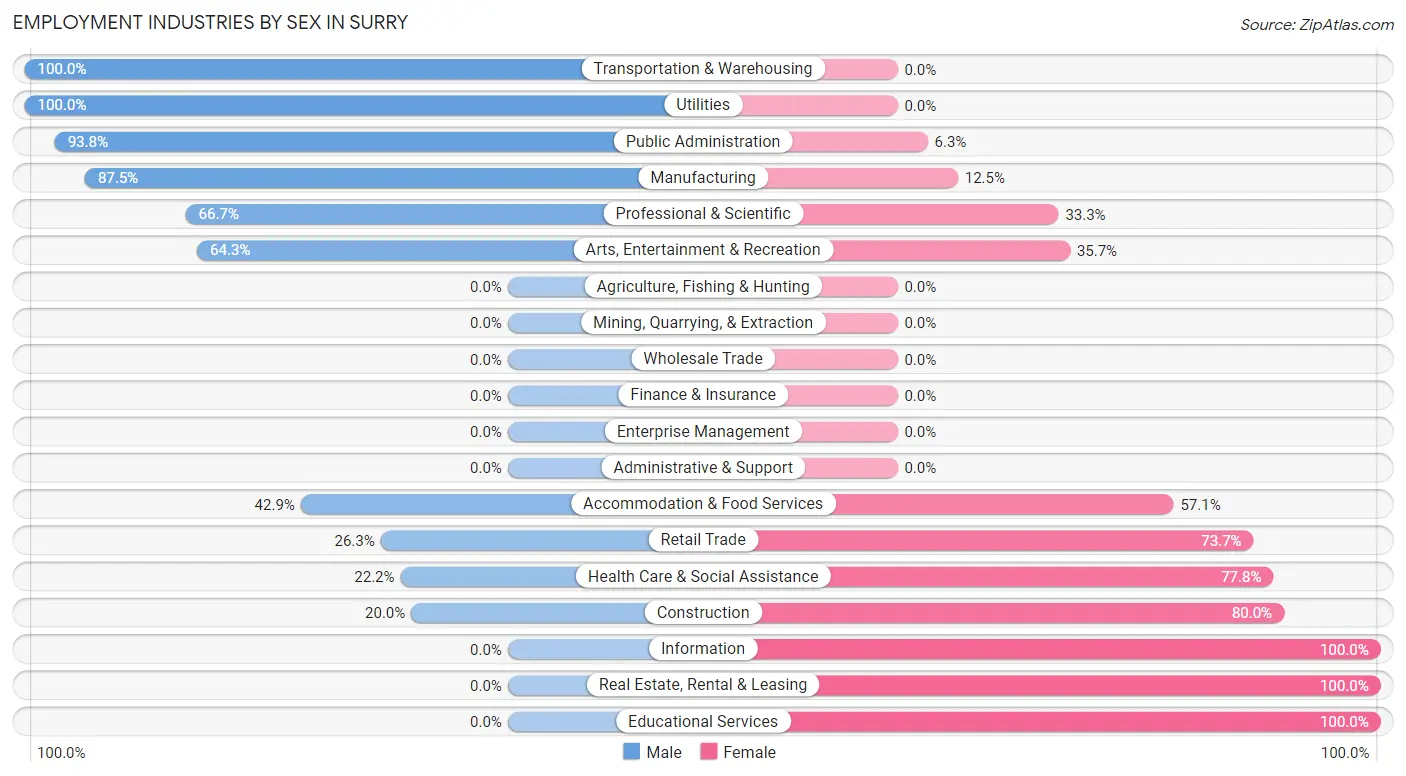
Employment Industries by Sex in Surry
The Surry industries that see more men than women are Transportation & Warehousing (100.0%), Utilities (100.0%), and Public Administration (93.8%), whereas the industries that tend to have a higher number of women are Information (100.0%), Real Estate, Rental & Leasing (100.0%), and Educational Services (100.0%).
| Industry | Male | Female |
| Agriculture, Fishing & Hunting | 0 (0.0%) | 0 (0.0%) |
| Mining, Quarrying, & Extraction | 0 (0.0%) | 0 (0.0%) |
| Construction | 1 (20.0%) | 4 (80.0%) |
| Manufacturing | 7 (87.5%) | 1 (12.5%) |
| Wholesale Trade | 0 (0.0%) | 0 (0.0%) |
| Retail Trade | 5 (26.3%) | 14 (73.7%) |
| Transportation & Warehousing | 4 (100.0%) | 0 (0.0%) |
| Utilities | 5 (100.0%) | 0 (0.0%) |
| Information | 0 (0.0%) | 2 (100.0%) |
| Finance & Insurance | 0 (0.0%) | 0 (0.0%) |
| Real Estate, Rental & Leasing | 0 (0.0%) | 2 (100.0%) |
| Professional & Scientific | 4 (66.7%) | 2 (33.3%) |
| Enterprise Management | 0 (0.0%) | 0 (0.0%) |
| Administrative & Support | 0 (0.0%) | 0 (0.0%) |
| Educational Services | 0 (0.0%) | 3 (100.0%) |
| Health Care & Social Assistance | 2 (22.2%) | 7 (77.8%) |
| Arts, Entertainment & Recreation | 9 (64.3%) | 5 (35.7%) |
| Accommodation & Food Services | 3 (42.9%) | 4 (57.1%) |
| Public Administration | 15 (93.8%) | 1 (6.2%) |
| Total | 57 (52.3%) | 52 (47.7%) |
Education in Surry
School Enrollment in Surry
The most common levels of schooling among the 37 students in Surry are middle school (16 | 43.2%), high school (8 | 21.6%), and elementary school (5 | 13.5%).
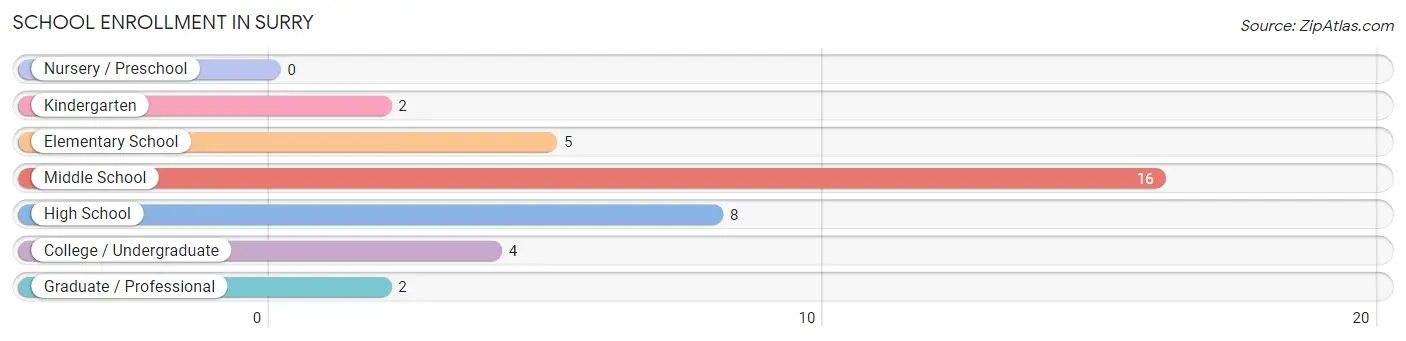
| School Level | # Students | % Students |
| Nursery / Preschool | 0 | 0.0% |
| Kindergarten | 2 | 5.4% |
| Elementary School | 5 | 13.5% |
| Middle School | 16 | 43.2% |
| High School | 8 | 21.6% |
| College / Undergraduate | 4 | 10.8% |
| Graduate / Professional | 2 | 5.4% |
| Total | 37 | 100.0% |
School Enrollment by Age by Funding Source in Surry
Out of a total of 37 students who are enrolled in schools in Surry, 14 (37.8%) attend a private institution, while the remaining 23 (62.2%) are enrolled in public schools. The age group of 5 to 9 year old has the highest likelihood of being enrolled in private schools, with 5 (71.4% in the age bracket) enrolled. Conversely, the age group of 15 to 17 year olds has the lowest likelihood of being enrolled in a private school, with 3 (100.0% in the age bracket) attending a public institution.
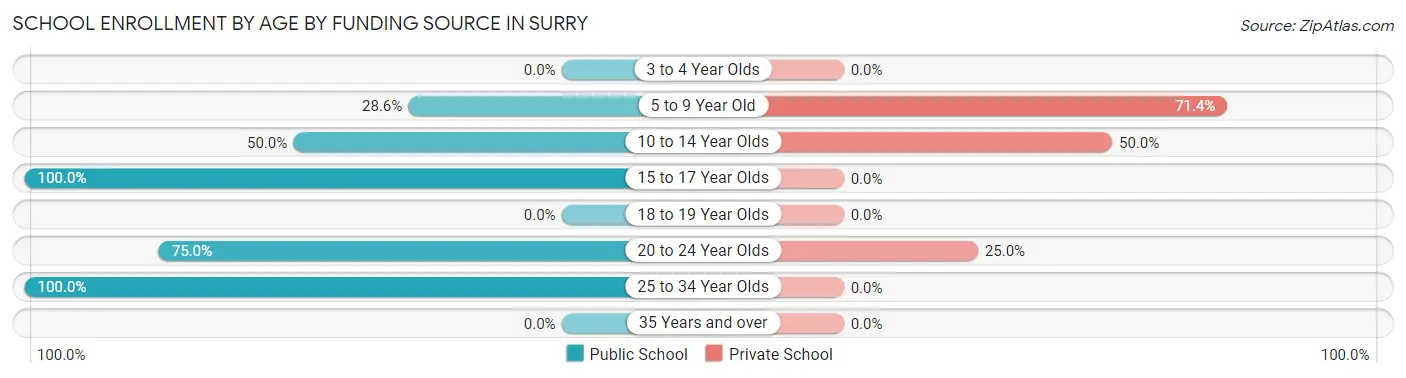
| Age Bracket | Public School | Private School |
| 3 to 4 Year Olds | 0 (0.0%) | 0 (0.0%) |
| 5 to 9 Year Old | 2 (28.6%) | 5 (71.4%) |
| 10 to 14 Year Olds | 8 (50.0%) | 8 (50.0%) |
| 15 to 17 Year Olds | 3 (100.0%) | 0 (0.0%) |
| 18 to 19 Year Olds | 0 (0.0%) | 0 (0.0%) |
| 20 to 24 Year Olds | 3 (75.0%) | 1 (25.0%) |
| 25 to 34 Year Olds | 7 (100.0%) | 0 (0.0%) |
| 35 Years and over | 0 (0.0%) | 0 (0.0%) |
| Total | 23 (62.2%) | 14 (37.8%) |
Educational Attainment by Field of Study in Surry
Liberal arts & history (18 | 27.3%), business (14 | 21.2%), bio, nature & agricultural (10 | 15.1%), social sciences (8 | 12.1%), and visual & performing arts (6 | 9.1%) are the most common fields of study among 66 individuals in Surry who have obtained a bachelor's degree or higher.
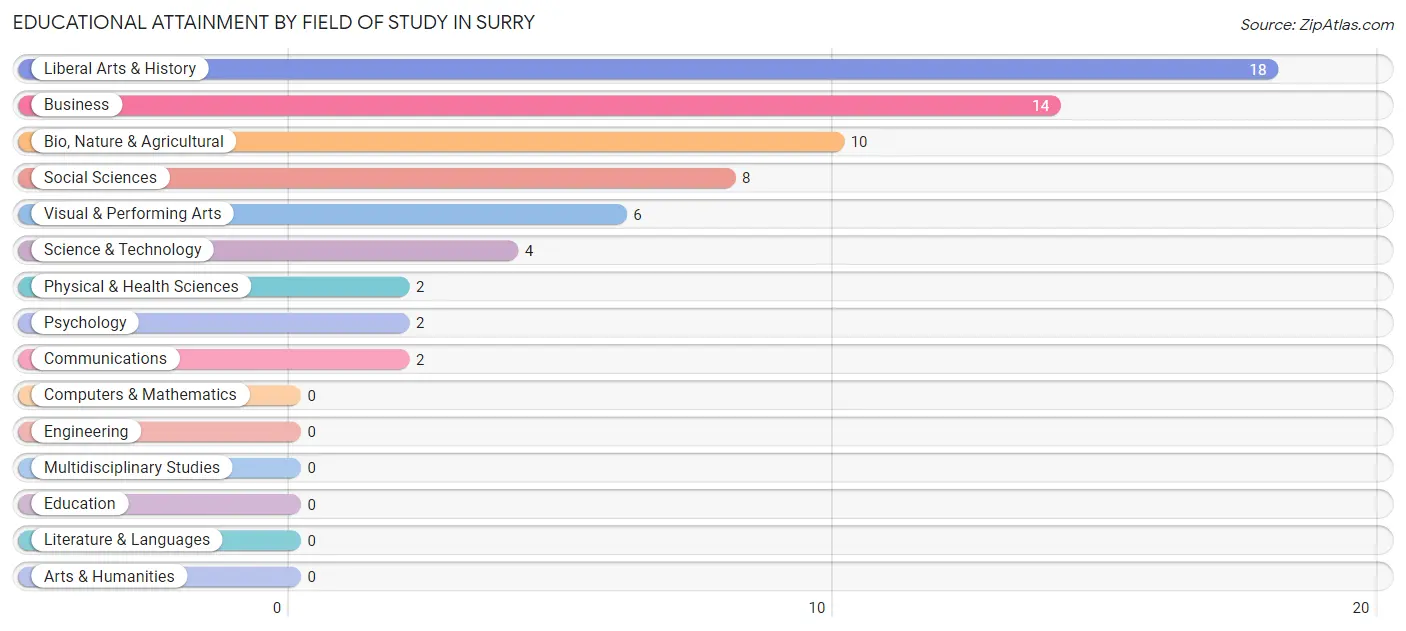
| Field of Study | # Graduates | % Graduates |
| Computers & Mathematics | 0 | 0.0% |
| Bio, Nature & Agricultural | 10 | 15.1% |
| Physical & Health Sciences | 2 | 3.0% |
| Psychology | 2 | 3.0% |
| Social Sciences | 8 | 12.1% |
| Engineering | 0 | 0.0% |
| Multidisciplinary Studies | 0 | 0.0% |
| Science & Technology | 4 | 6.1% |
| Business | 14 | 21.2% |
| Education | 0 | 0.0% |
| Literature & Languages | 0 | 0.0% |
| Liberal Arts & History | 18 | 27.3% |
| Visual & Performing Arts | 6 | 9.1% |
| Communications | 2 | 3.0% |
| Arts & Humanities | 0 | 0.0% |
| Total | 66 | 100.0% |
Transportation & Commute in Surry
Vehicle Availability by Sex in Surry
The most prevalent vehicle ownership categories in Surry are males with 2 vehicles (25, accounting for 43.9%) and females with 2 vehicles (15, making up 48.1%).
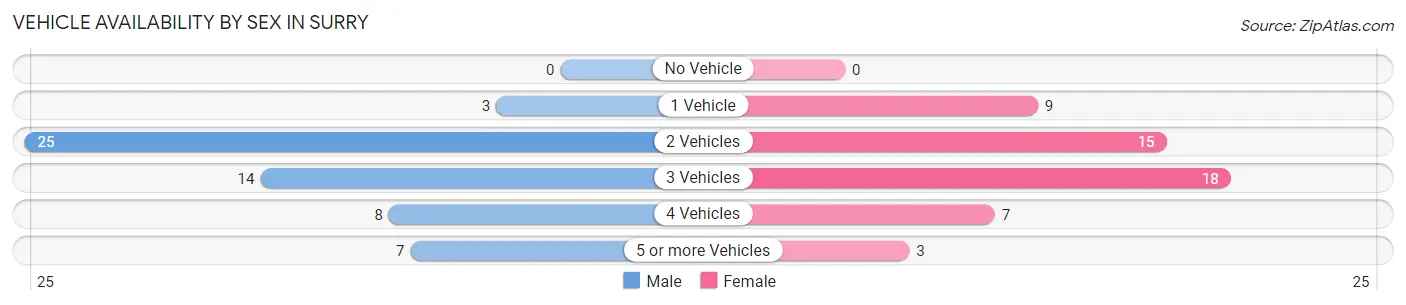
| Vehicles Available | Male | Female |
| No Vehicle | 0 (0.0%) | 0 (0.0%) |
| 1 Vehicle | 3 (5.3%) | 9 (17.3%) |
| 2 Vehicles | 25 (43.9%) | 15 (28.8%) |
| 3 Vehicles | 14 (24.6%) | 18 (34.6%) |
| 4 Vehicles | 8 (14.0%) | 7 (13.5%) |
| 5 or more Vehicles | 7 (12.3%) | 3 (5.8%) |
| Total | 57 (100.0%) | 52 (100.0%) |
Commute Time in Surry
The most frequently occuring commute durations in Surry are 45 to 59 minutes (25 commuters, 24.0%), 60 to 89 minutes (19 commuters, 18.3%), and less than 5 minutes (10 commuters, 9.6%).
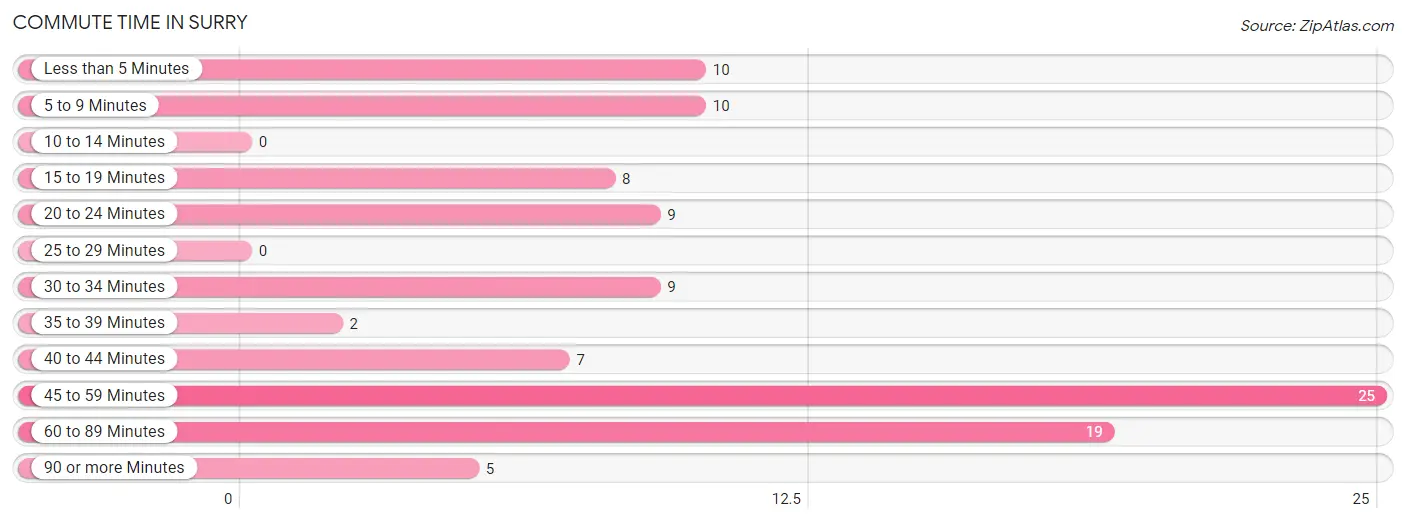
| Commute Time | # Commuters | % Commuters |
| Less than 5 Minutes | 10 | 9.6% |
| 5 to 9 Minutes | 10 | 9.6% |
| 10 to 14 Minutes | 0 | 0.0% |
| 15 to 19 Minutes | 8 | 7.7% |
| 20 to 24 Minutes | 9 | 8.6% |
| 25 to 29 Minutes | 0 | 0.0% |
| 30 to 34 Minutes | 9 | 8.6% |
| 35 to 39 Minutes | 2 | 1.9% |
| 40 to 44 Minutes | 7 | 6.7% |
| 45 to 59 Minutes | 25 | 24.0% |
| 60 to 89 Minutes | 19 | 18.3% |
| 90 or more Minutes | 5 | 4.8% |
Commute Time by Sex in Surry
The most common commute times in Surry are 45 to 59 minutes (16 commuters, 28.1%) for males and 5 to 9 minutes (10 commuters, 21.3%) for females.

| Commute Time | Male | Female |
| Less than 5 Minutes | 2 (3.5%) | 8 (17.0%) |
| 5 to 9 Minutes | 0 (0.0%) | 10 (21.3%) |
| 10 to 14 Minutes | 0 (0.0%) | 0 (0.0%) |
| 15 to 19 Minutes | 5 (8.8%) | 3 (6.4%) |
| 20 to 24 Minutes | 5 (8.8%) | 4 (8.5%) |
| 25 to 29 Minutes | 0 (0.0%) | 0 (0.0%) |
| 30 to 34 Minutes | 8 (14.0%) | 1 (2.1%) |
| 35 to 39 Minutes | 0 (0.0%) | 2 (4.3%) |
| 40 to 44 Minutes | 7 (12.3%) | 0 (0.0%) |
| 45 to 59 Minutes | 16 (28.1%) | 9 (19.2%) |
| 60 to 89 Minutes | 9 (15.8%) | 10 (21.3%) |
| 90 or more Minutes | 5 (8.8%) | 0 (0.0%) |
Time of Departure to Work by Sex in Surry
The most frequent times of departure to work in Surry are 6:00 AM to 6:29 AM (20, 35.1%) for males and 9:00 AM to 9:59 AM (13, 27.7%) for females.
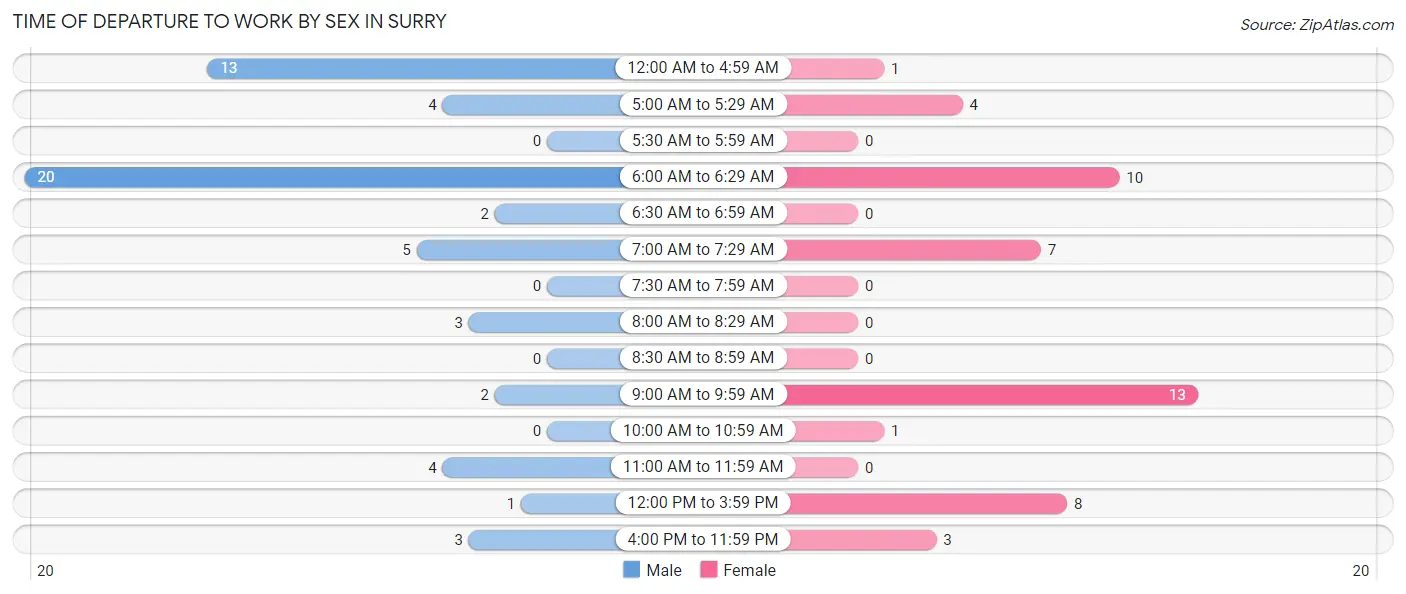
| Time of Departure | Male | Female |
| 12:00 AM to 4:59 AM | 13 (22.8%) | 1 (2.1%) |
| 5:00 AM to 5:29 AM | 4 (7.0%) | 4 (8.5%) |
| 5:30 AM to 5:59 AM | 0 (0.0%) | 0 (0.0%) |
| 6:00 AM to 6:29 AM | 20 (35.1%) | 10 (21.3%) |
| 6:30 AM to 6:59 AM | 2 (3.5%) | 0 (0.0%) |
| 7:00 AM to 7:29 AM | 5 (8.8%) | 7 (14.9%) |
| 7:30 AM to 7:59 AM | 0 (0.0%) | 0 (0.0%) |
| 8:00 AM to 8:29 AM | 3 (5.3%) | 0 (0.0%) |
| 8:30 AM to 8:59 AM | 0 (0.0%) | 0 (0.0%) |
| 9:00 AM to 9:59 AM | 2 (3.5%) | 13 (27.7%) |
| 10:00 AM to 10:59 AM | 0 (0.0%) | 1 (2.1%) |
| 11:00 AM to 11:59 AM | 4 (7.0%) | 0 (0.0%) |
| 12:00 PM to 3:59 PM | 1 (1.8%) | 8 (17.0%) |
| 4:00 PM to 11:59 PM | 3 (5.3%) | 3 (6.4%) |
| Total | 57 (100.0%) | 47 (100.0%) |
Housing Occupancy in Surry
Occupancy by Ownership in Surry
Of the total 83 dwellings in Surry, owner-occupied units account for 66 (79.5%), while renter-occupied units make up 17 (20.5%).
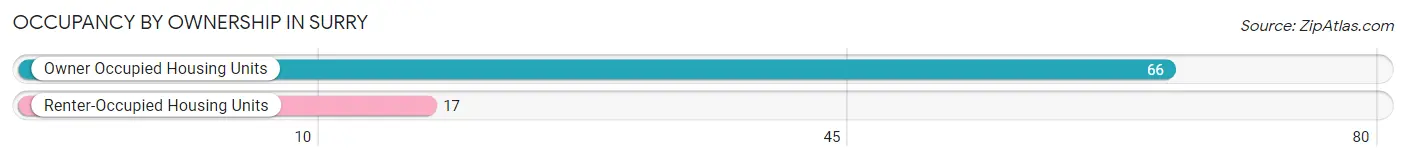
| Occupancy | # Housing Units | % Housing Units |
| Owner Occupied Housing Units | 66 | 79.5% |
| Renter-Occupied Housing Units | 17 | 20.5% |
| Total Occupied Housing Units | 83 | 100.0% |
Occupancy by Household Size in Surry
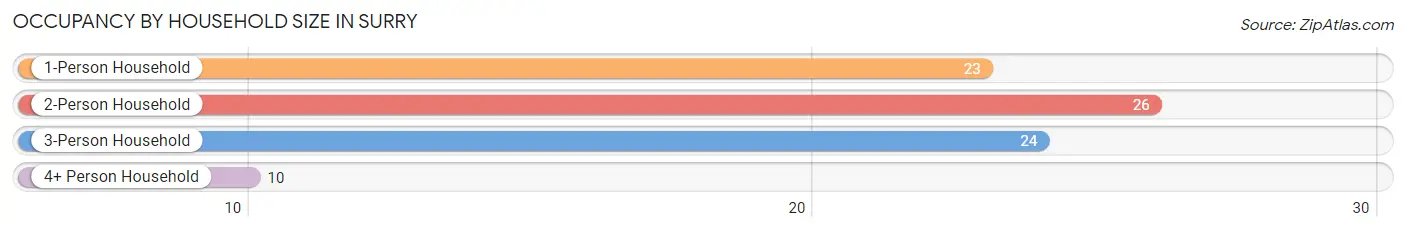
| Household Size | # Housing Units | % Housing Units |
| 1-Person Household | 23 | 27.7% |
| 2-Person Household | 26 | 31.3% |
| 3-Person Household | 24 | 28.9% |
| 4+ Person Household | 10 | 12.0% |
| Total Housing Units | 83 | 100.0% |
Occupancy by Ownership by Household Size in Surry
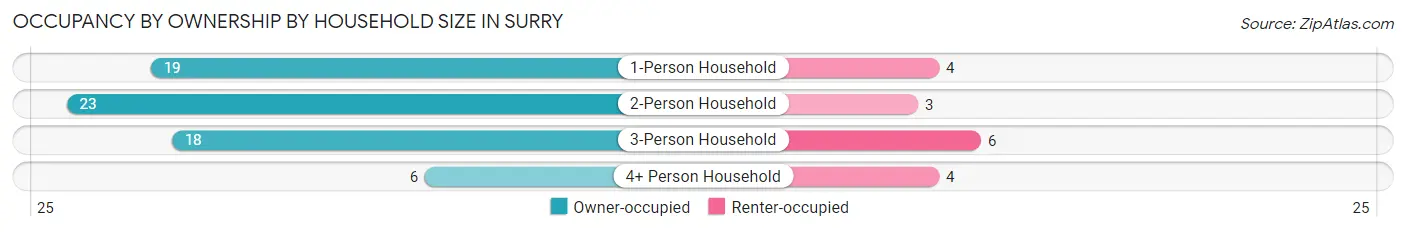
| Household Size | Owner-occupied | Renter-occupied |
| 1-Person Household | 19 (82.6%) | 4 (17.4%) |
| 2-Person Household | 23 (88.5%) | 3 (11.5%) |
| 3-Person Household | 18 (75.0%) | 6 (25.0%) |
| 4+ Person Household | 6 (60.0%) | 4 (40.0%) |
| Total Housing Units | 66 (79.5%) | 17 (20.5%) |
Occupancy by Educational Attainment in Surry
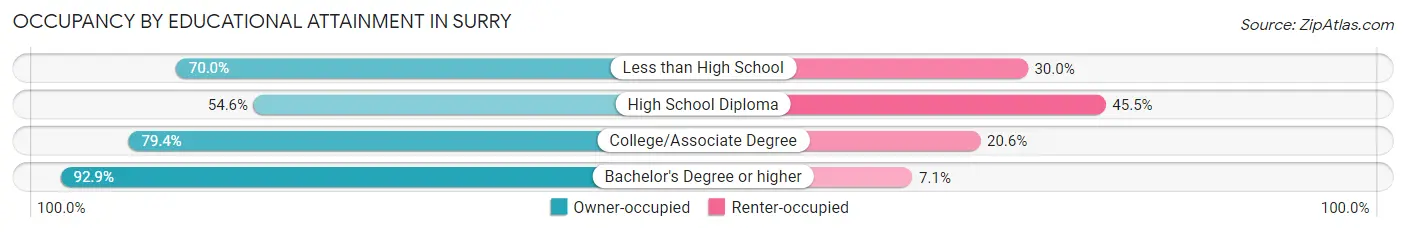
| Household Size | Owner-occupied | Renter-occupied |
| Less than High School | 7 (70.0%) | 3 (30.0%) |
| High School Diploma | 6 (54.5%) | 5 (45.5%) |
| College/Associate Degree | 27 (79.4%) | 7 (20.6%) |
| Bachelor's Degree or higher | 26 (92.9%) | 2 (7.1%) |
Occupancy by Age of Householder in Surry
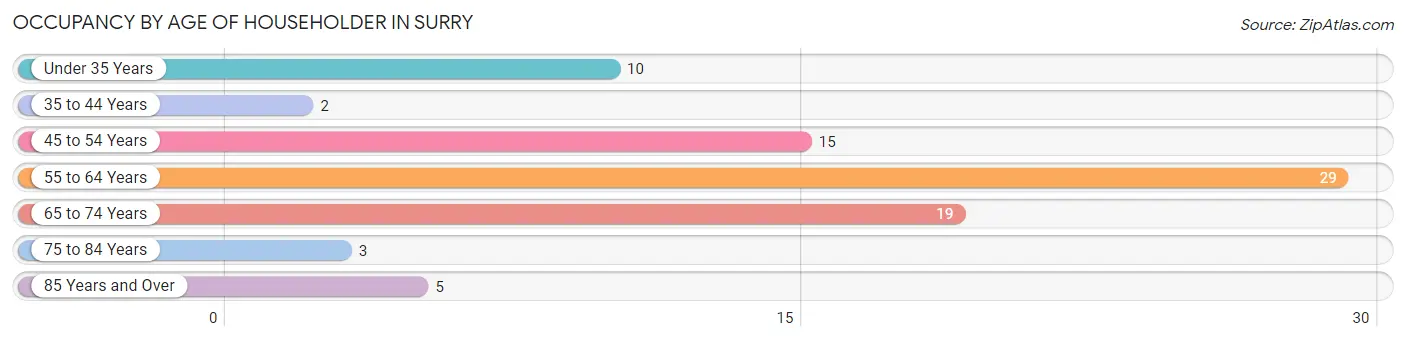
| Age Bracket | # Households | % Households |
| Under 35 Years | 10 | 12.0% |
| 35 to 44 Years | 2 | 2.4% |
| 45 to 54 Years | 15 | 18.1% |
| 55 to 64 Years | 29 | 34.9% |
| 65 to 74 Years | 19 | 22.9% |
| 75 to 84 Years | 3 | 3.6% |
| 85 Years and Over | 5 | 6.0% |
| Total | 83 | 100.0% |
Housing Finances in Surry
Median Income by Occupancy in Surry
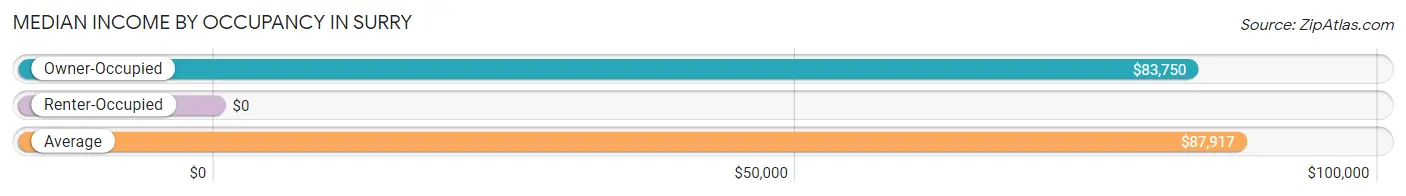
| Occupancy Type | # Households | Median Income |
| Owner-Occupied | 66 (79.5%) | $83,750 |
| Renter-Occupied | 17 (20.5%) | $0 |
| Average | 83 (100.0%) | $87,917 |
Occupancy by Householder Income Bracket in Surry
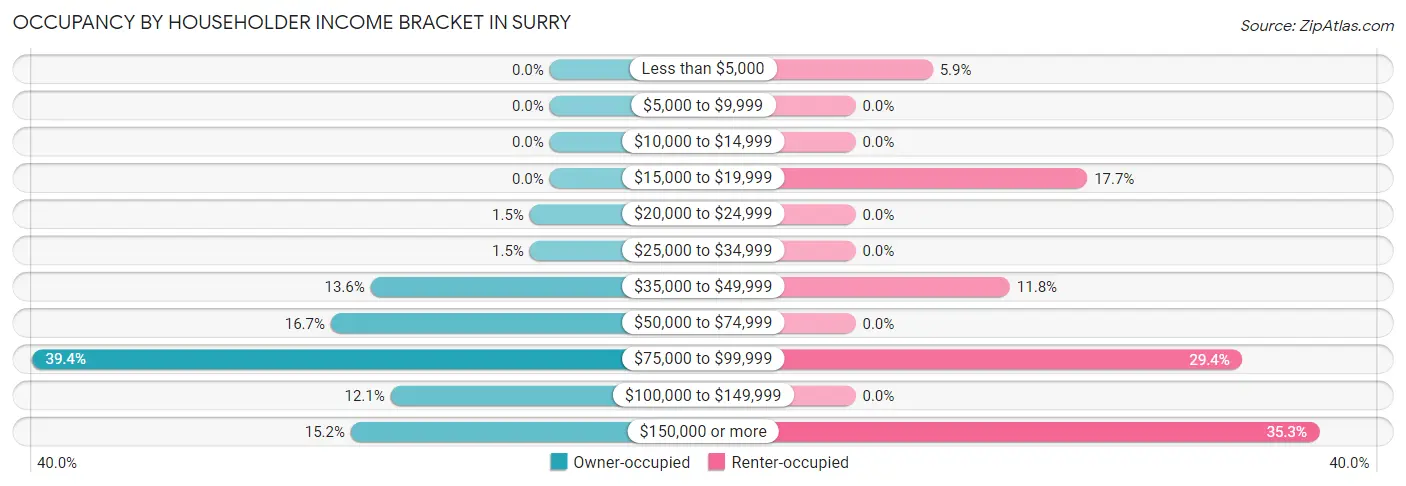
| Income Bracket | Owner-occupied | Renter-occupied |
| Less than $5,000 | 0 (0.0%) | 1 (5.9%) |
| $5,000 to $9,999 | 0 (0.0%) | 0 (0.0%) |
| $10,000 to $14,999 | 0 (0.0%) | 0 (0.0%) |
| $15,000 to $19,999 | 0 (0.0%) | 3 (17.6%) |
| $20,000 to $24,999 | 1 (1.5%) | 0 (0.0%) |
| $25,000 to $34,999 | 1 (1.5%) | 0 (0.0%) |
| $35,000 to $49,999 | 9 (13.6%) | 2 (11.8%) |
| $50,000 to $74,999 | 11 (16.7%) | 0 (0.0%) |
| $75,000 to $99,999 | 26 (39.4%) | 5 (29.4%) |
| $100,000 to $149,999 | 8 (12.1%) | 0 (0.0%) |
| $150,000 or more | 10 (15.1%) | 6 (35.3%) |
| Total | 66 (100.0%) | 17 (100.0%) |
Monthly Housing Cost Tiers in Surry
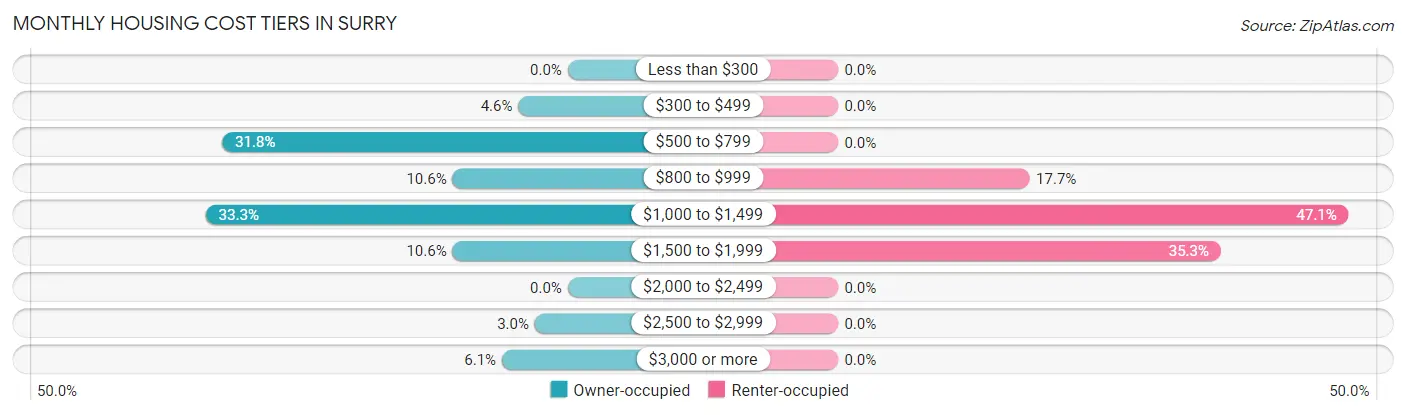
| Monthly Cost | Owner-occupied | Renter-occupied |
| Less than $300 | 0 (0.0%) | 0 (0.0%) |
| $300 to $499 | 3 (4.5%) | 0 (0.0%) |
| $500 to $799 | 21 (31.8%) | 0 (0.0%) |
| $800 to $999 | 7 (10.6%) | 3 (17.6%) |
| $1,000 to $1,499 | 22 (33.3%) | 8 (47.1%) |
| $1,500 to $1,999 | 7 (10.6%) | 6 (35.3%) |
| $2,000 to $2,499 | 0 (0.0%) | 0 (0.0%) |
| $2,500 to $2,999 | 2 (3.0%) | 0 (0.0%) |
| $3,000 or more | 4 (6.1%) | 0 (0.0%) |
| Total | 66 (100.0%) | 17 (100.0%) |
Physical Housing Characteristics in Surry
Housing Structures in Surry
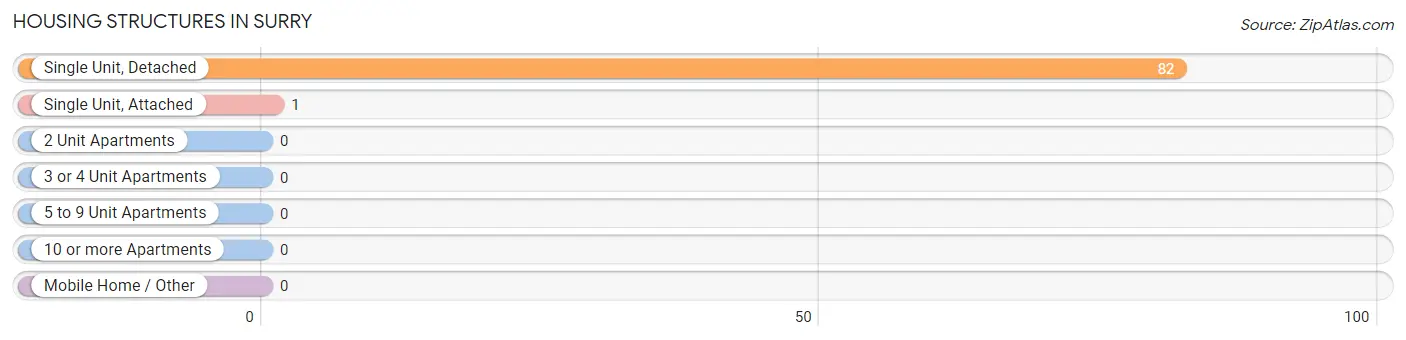
| Structure Type | # Housing Units | % Housing Units |
| Single Unit, Detached | 82 | 98.8% |
| Single Unit, Attached | 1 | 1.2% |
| 2 Unit Apartments | 0 | 0.0% |
| 3 or 4 Unit Apartments | 0 | 0.0% |
| 5 to 9 Unit Apartments | 0 | 0.0% |
| 10 or more Apartments | 0 | 0.0% |
| Mobile Home / Other | 0 | 0.0% |
| Total | 83 | 100.0% |
Housing Structures by Occupancy in Surry
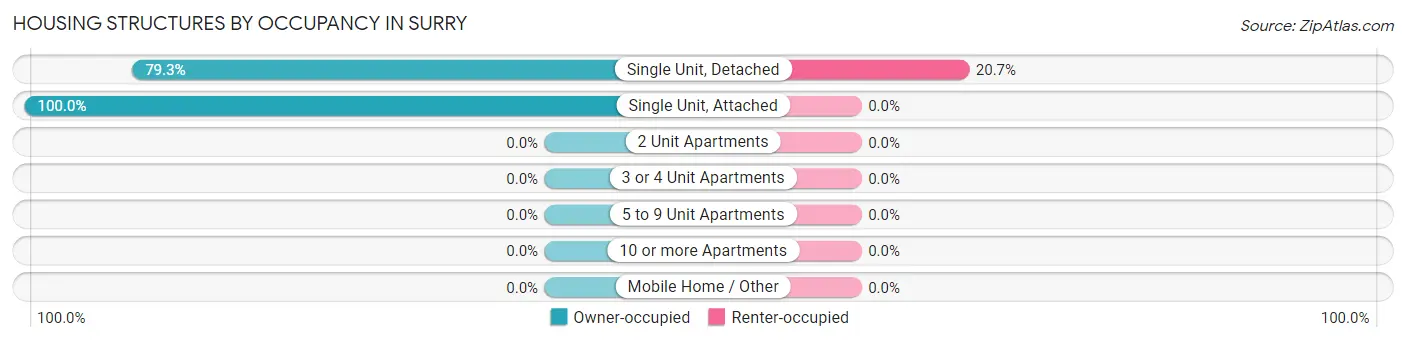
| Structure Type | Owner-occupied | Renter-occupied |
| Single Unit, Detached | 65 (79.3%) | 17 (20.7%) |
| Single Unit, Attached | 1 (100.0%) | 0 (0.0%) |
| 2 Unit Apartments | 0 (0.0%) | 0 (0.0%) |
| 3 or 4 Unit Apartments | 0 (0.0%) | 0 (0.0%) |
| 5 to 9 Unit Apartments | 0 (0.0%) | 0 (0.0%) |
| 10 or more Apartments | 0 (0.0%) | 0 (0.0%) |
| Mobile Home / Other | 0 (0.0%) | 0 (0.0%) |
| Total | 66 (79.5%) | 17 (20.5%) |
Housing Structures by Number of Rooms in Surry
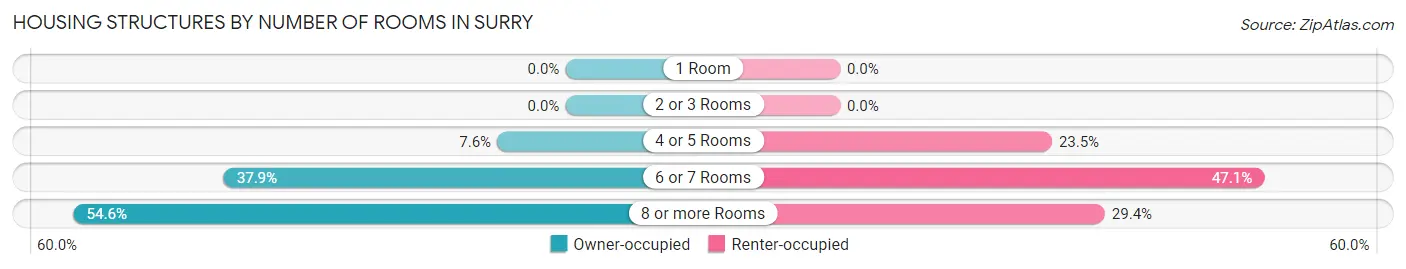
| Number of Rooms | Owner-occupied | Renter-occupied |
| 1 Room | 0 (0.0%) | 0 (0.0%) |
| 2 or 3 Rooms | 0 (0.0%) | 0 (0.0%) |
| 4 or 5 Rooms | 5 (7.6%) | 4 (23.5%) |
| 6 or 7 Rooms | 25 (37.9%) | 8 (47.1%) |
| 8 or more Rooms | 36 (54.5%) | 5 (29.4%) |
| Total | 66 (100.0%) | 17 (100.0%) |
Housing Structure by Heating Type in Surry
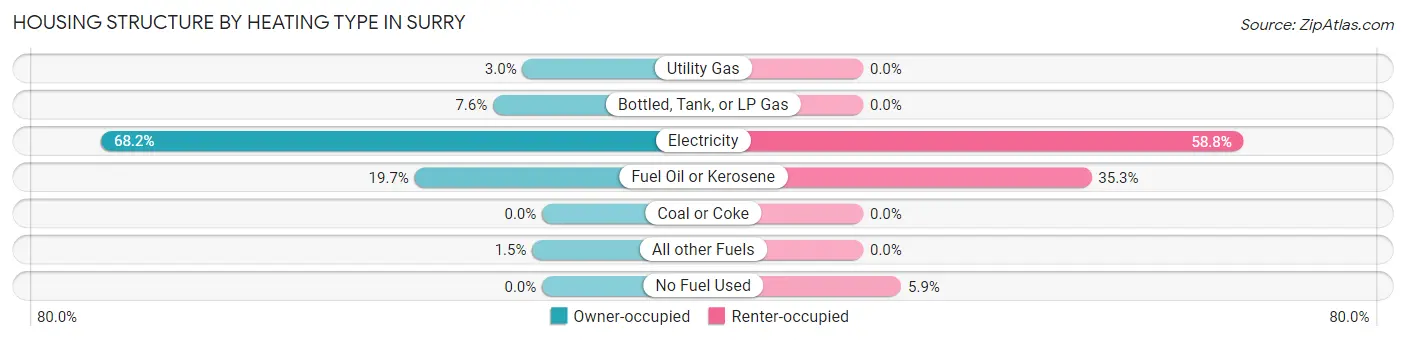
| Heating Type | Owner-occupied | Renter-occupied |
| Utility Gas | 2 (3.0%) | 0 (0.0%) |
| Bottled, Tank, or LP Gas | 5 (7.6%) | 0 (0.0%) |
| Electricity | 45 (68.2%) | 10 (58.8%) |
| Fuel Oil or Kerosene | 13 (19.7%) | 6 (35.3%) |
| Coal or Coke | 0 (0.0%) | 0 (0.0%) |
| All other Fuels | 1 (1.5%) | 0 (0.0%) |
| No Fuel Used | 0 (0.0%) | 1 (5.9%) |
| Total | 66 (100.0%) | 17 (100.0%) |
Household Vehicle Usage in Surry
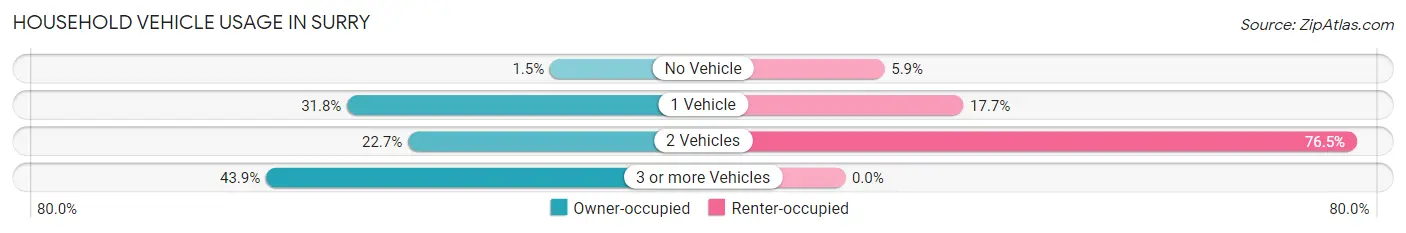
| Vehicles per Household | Owner-occupied | Renter-occupied |
| No Vehicle | 1 (1.5%) | 1 (5.9%) |
| 1 Vehicle | 21 (31.8%) | 3 (17.6%) |
| 2 Vehicles | 15 (22.7%) | 13 (76.5%) |
| 3 or more Vehicles | 29 (43.9%) | 0 (0.0%) |
| Total | 66 (100.0%) | 17 (100.0%) |
Real Estate & Mortgages in Surry
Real Estate and Mortgage Overview in Surry
| Characteristic | Without Mortgage | With Mortgage |
| Housing Units | 22 | 44 |
| Median Property Value | $200,000 | $175,000 |
| Median Household Income | $120,625 | $5 |
| Monthly Housing Costs | $580 | $4 |
| Real Estate Taxes | $1,444 | $0 |
Property Value by Mortgage Status in Surry
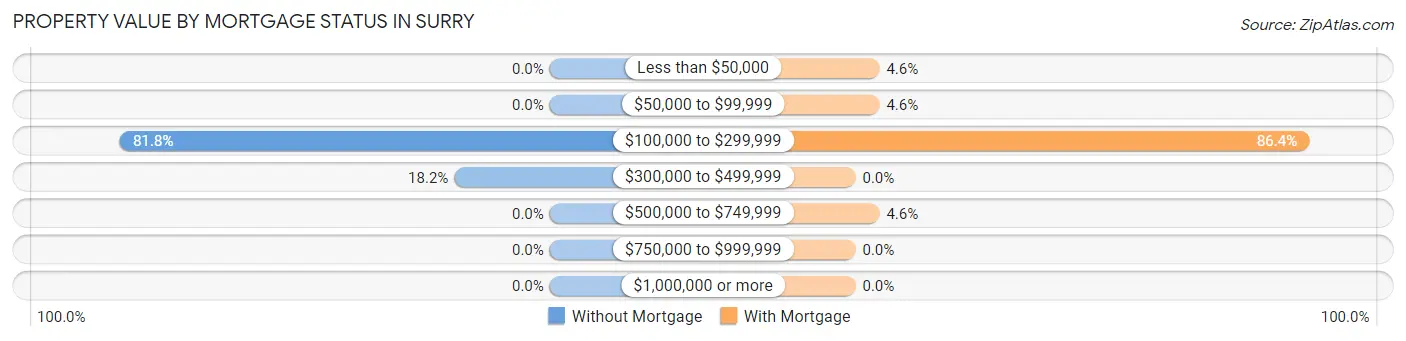
| Property Value | Without Mortgage | With Mortgage |
| Less than $50,000 | 0 (0.0%) | 2 (4.5%) |
| $50,000 to $99,999 | 0 (0.0%) | 2 (4.5%) |
| $100,000 to $299,999 | 18 (81.8%) | 38 (86.4%) |
| $300,000 to $499,999 | 4 (18.2%) | 0 (0.0%) |
| $500,000 to $749,999 | 0 (0.0%) | 2 (4.5%) |
| $750,000 to $999,999 | 0 (0.0%) | 0 (0.0%) |
| $1,000,000 or more | 0 (0.0%) | 0 (0.0%) |
| Total | 22 (100.0%) | 44 (100.0%) |
Household Income by Mortgage Status in Surry
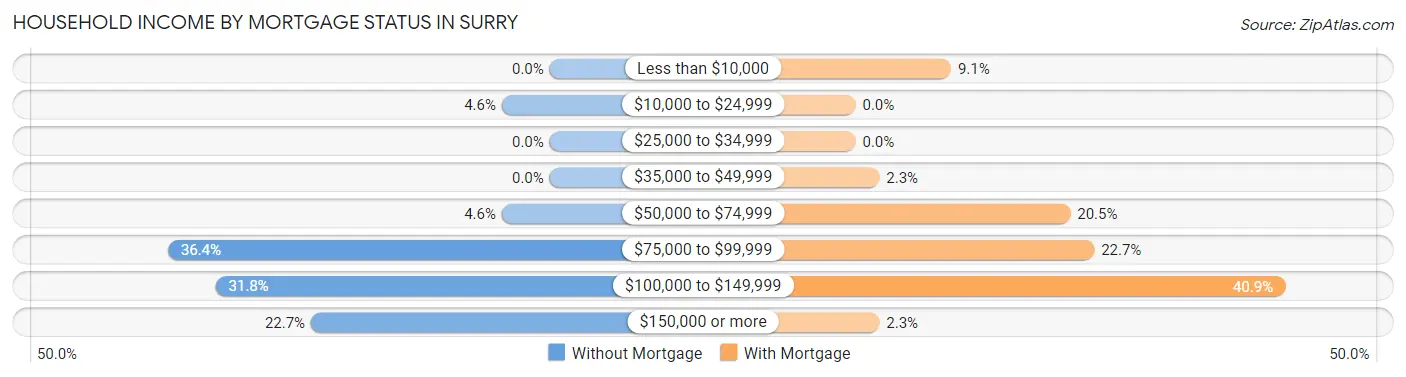
| Household Income | Without Mortgage | With Mortgage |
| Less than $10,000 | 0 (0.0%) | 4 (9.1%) |
| $10,000 to $24,999 | 1 (4.5%) | 0 (0.0%) |
| $25,000 to $34,999 | 0 (0.0%) | 0 (0.0%) |
| $35,000 to $49,999 | 0 (0.0%) | 1 (2.3%) |
| $50,000 to $74,999 | 1 (4.5%) | 9 (20.4%) |
| $75,000 to $99,999 | 8 (36.4%) | 10 (22.7%) |
| $100,000 to $149,999 | 7 (31.8%) | 18 (40.9%) |
| $150,000 or more | 5 (22.7%) | 1 (2.3%) |
| Total | 22 (100.0%) | 44 (100.0%) |
Property Value to Household Income Ratio in Surry
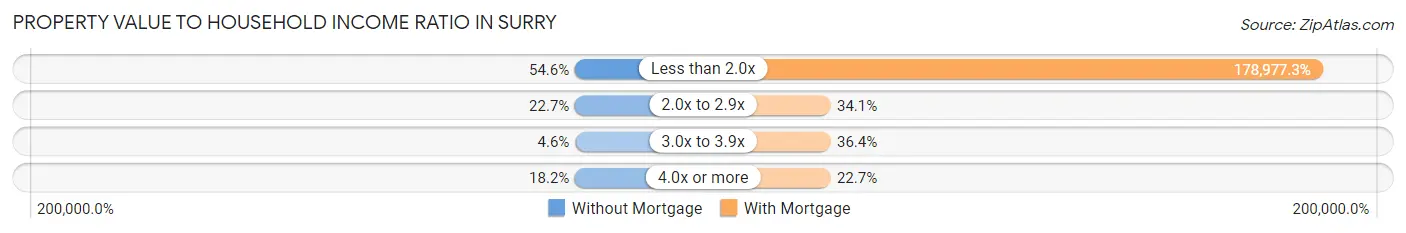
| Value-to-Income Ratio | Without Mortgage | With Mortgage |
| Less than 2.0x | 12 (54.5%) | 78,750 (178,977.3%) |
| 2.0x to 2.9x | 5 (22.7%) | 15 (34.1%) |
| 3.0x to 3.9x | 1 (4.5%) | 16 (36.4%) |
| 4.0x or more | 4 (18.2%) | 10 (22.7%) |
| Total | 22 (100.0%) | 44 (100.0%) |
Real Estate Taxes by Mortgage Status in Surry
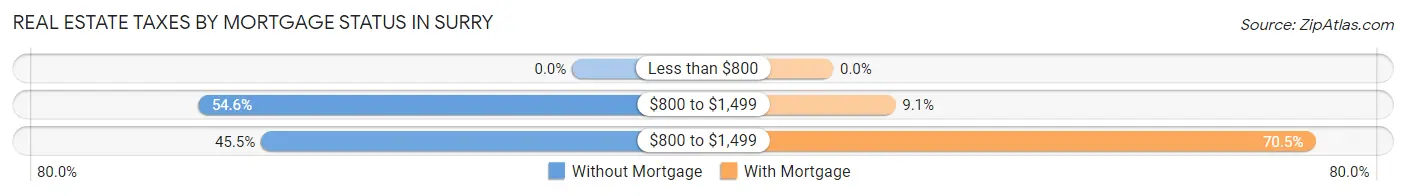
| Property Taxes | Without Mortgage | With Mortgage |
| Less than $800 | 0 (0.0%) | 0 (0.0%) |
| $800 to $1,499 | 12 (54.5%) | 4 (9.1%) |
| $800 to $1,499 | 10 (45.5%) | 31 (70.5%) |
| Total | 22 (100.0%) | 44 (100.0%) |
Health & Disability in Surry
Health Insurance Coverage by Age in Surry
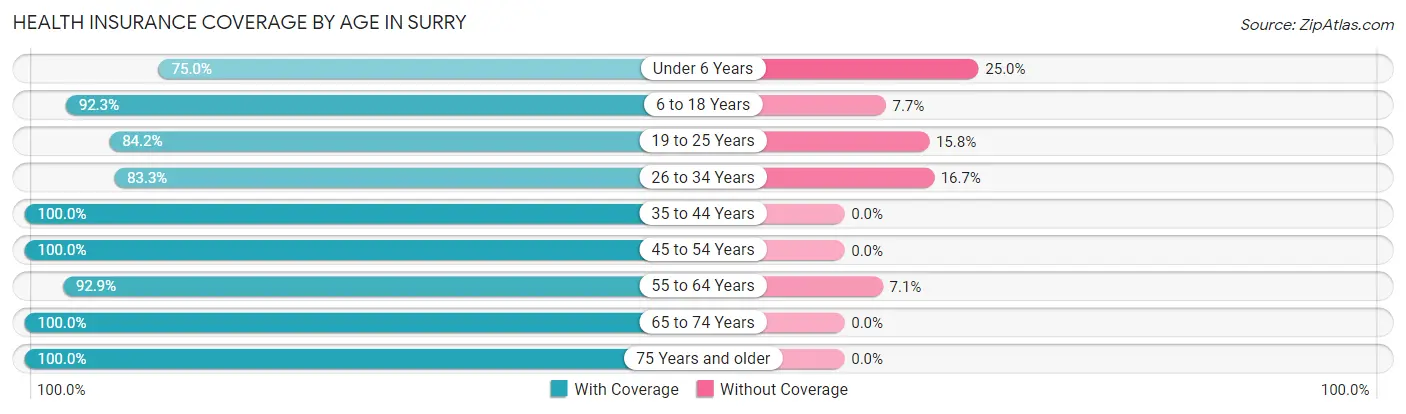
| Age Bracket | With Coverage | Without Coverage |
| Under 6 Years | 15 (75.0%) | 5 (25.0%) |
| 6 to 18 Years | 24 (92.3%) | 2 (7.7%) |
| 19 to 25 Years | 16 (84.2%) | 3 (15.8%) |
| 26 to 34 Years | 20 (83.3%) | 4 (16.7%) |
| 35 to 44 Years | 16 (100.0%) | 0 (0.0%) |
| 45 to 54 Years | 37 (100.0%) | 0 (0.0%) |
| 55 to 64 Years | 39 (92.9%) | 3 (7.1%) |
| 65 to 74 Years | 23 (100.0%) | 0 (0.0%) |
| 75 Years and older | 15 (100.0%) | 0 (0.0%) |
| Total | 205 (92.3%) | 17 (7.7%) |
Health Insurance Coverage by Citizenship Status in Surry
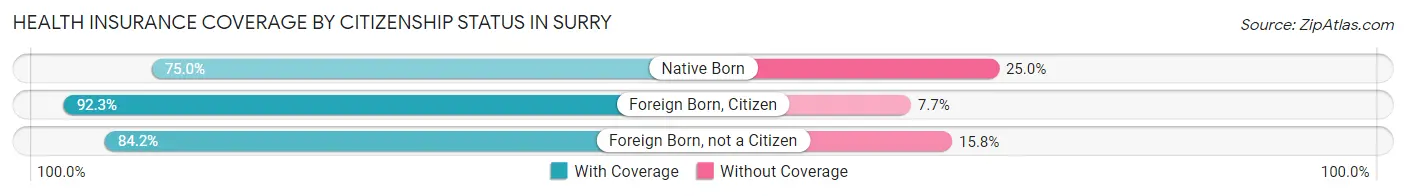
| Citizenship Status | With Coverage | Without Coverage |
| Native Born | 15 (75.0%) | 5 (25.0%) |
| Foreign Born, Citizen | 24 (92.3%) | 2 (7.7%) |
| Foreign Born, not a Citizen | 16 (84.2%) | 3 (15.8%) |
Health Insurance Coverage by Household Income in Surry
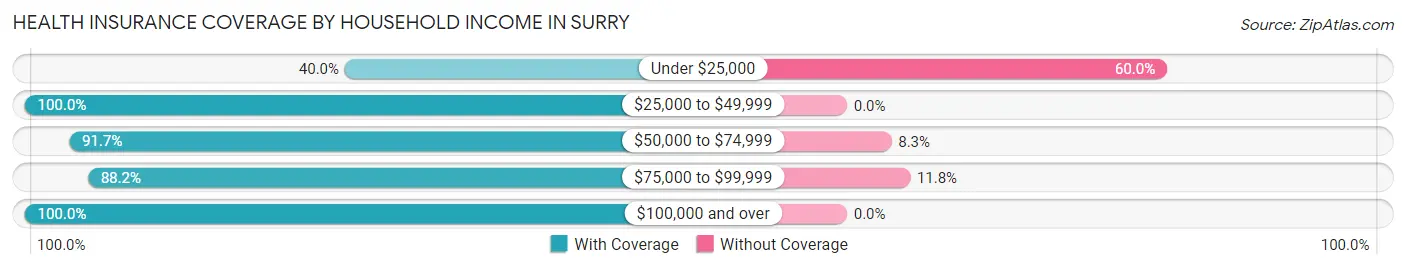
| Household Income | With Coverage | Without Coverage |
| Under $25,000 | 2 (40.0%) | 3 (60.0%) |
| $25,000 to $49,999 | 17 (100.0%) | 0 (0.0%) |
| $50,000 to $74,999 | 33 (91.7%) | 3 (8.3%) |
| $75,000 to $99,999 | 82 (88.2%) | 11 (11.8%) |
| $100,000 and over | 71 (100.0%) | 0 (0.0%) |
Public vs Private Health Insurance Coverage by Age in Surry
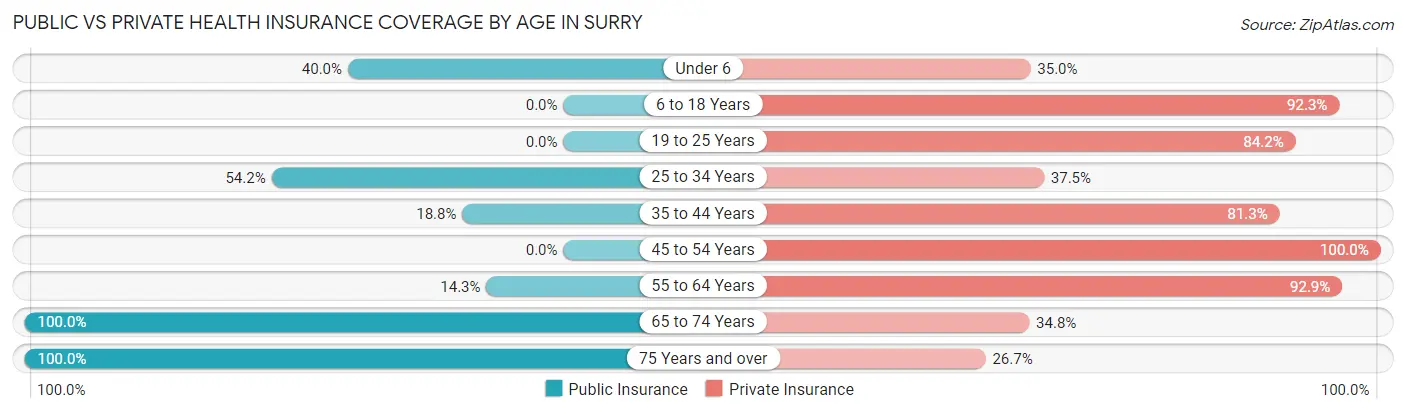
| Age Bracket | Public Insurance | Private Insurance |
| Under 6 | 8 (40.0%) | 7 (35.0%) |
| 6 to 18 Years | 0 (0.0%) | 24 (92.3%) |
| 19 to 25 Years | 0 (0.0%) | 16 (84.2%) |
| 25 to 34 Years | 13 (54.2%) | 9 (37.5%) |
| 35 to 44 Years | 3 (18.8%) | 13 (81.2%) |
| 45 to 54 Years | 0 (0.0%) | 37 (100.0%) |
| 55 to 64 Years | 6 (14.3%) | 39 (92.9%) |
| 65 to 74 Years | 23 (100.0%) | 8 (34.8%) |
| 75 Years and over | 15 (100.0%) | 4 (26.7%) |
| Total | 68 (30.6%) | 157 (70.7%) |
Disability Status by Sex by Age in Surry
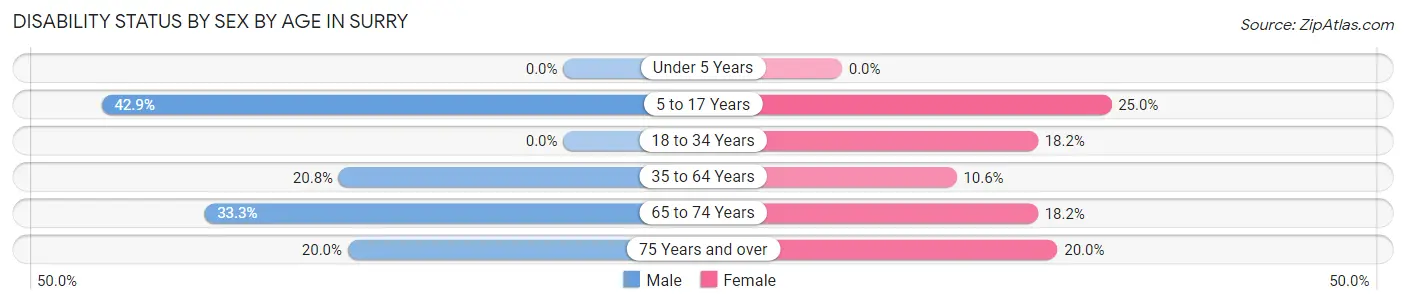
| Age Bracket | Male | Female |
| Under 5 Years | 0 (0.0%) | 0 (0.0%) |
| 5 to 17 Years | 3 (42.9%) | 5 (25.0%) |
| 18 to 34 Years | 0 (0.0%) | 4 (18.2%) |
| 35 to 64 Years | 10 (20.8%) | 5 (10.6%) |
| 65 to 74 Years | 4 (33.3%) | 2 (18.2%) |
| 75 Years and over | 2 (20.0%) | 1 (20.0%) |
Disability Class by Sex by Age in Surry
Disability Class: Hearing Difficulty
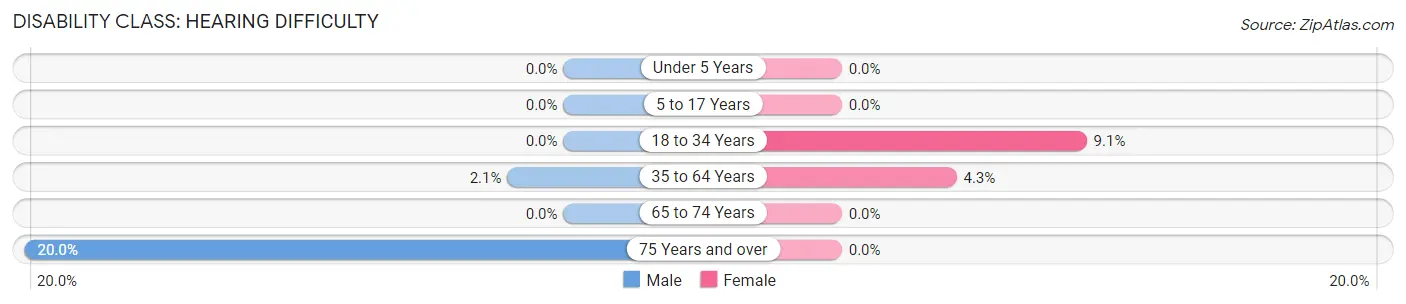
| Age Bracket | Male | Female |
| Under 5 Years | 0 (0.0%) | 0 (0.0%) |
| 5 to 17 Years | 0 (0.0%) | 0 (0.0%) |
| 18 to 34 Years | 0 (0.0%) | 2 (9.1%) |
| 35 to 64 Years | 1 (2.1%) | 2 (4.3%) |
| 65 to 74 Years | 0 (0.0%) | 0 (0.0%) |
| 75 Years and over | 2 (20.0%) | 0 (0.0%) |
Disability Class: Vision Difficulty
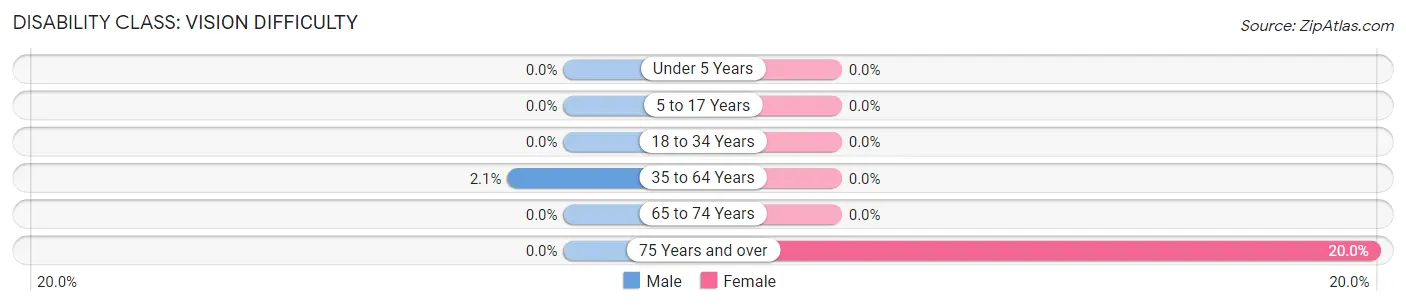
| Age Bracket | Male | Female |
| Under 5 Years | 0 (0.0%) | 0 (0.0%) |
| 5 to 17 Years | 0 (0.0%) | 0 (0.0%) |
| 18 to 34 Years | 0 (0.0%) | 0 (0.0%) |
| 35 to 64 Years | 1 (2.1%) | 0 (0.0%) |
| 65 to 74 Years | 0 (0.0%) | 0 (0.0%) |
| 75 Years and over | 0 (0.0%) | 1 (20.0%) |
Disability Class: Cognitive Difficulty
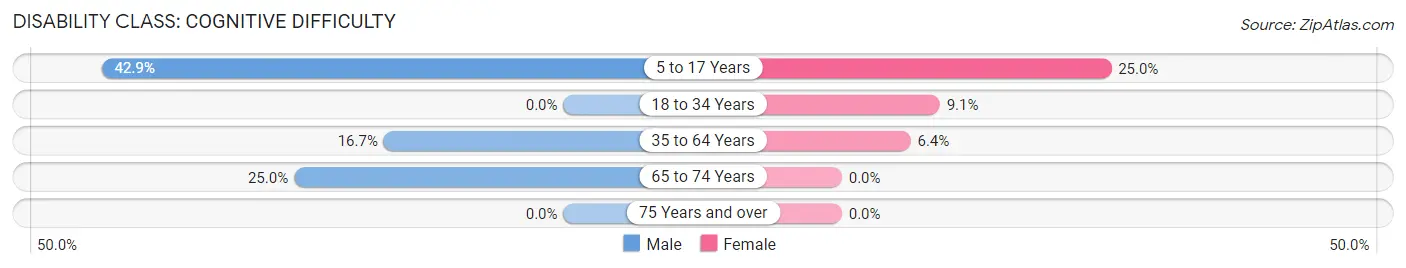
| Age Bracket | Male | Female |
| 5 to 17 Years | 3 (42.9%) | 5 (25.0%) |
| 18 to 34 Years | 0 (0.0%) | 2 (9.1%) |
| 35 to 64 Years | 8 (16.7%) | 3 (6.4%) |
| 65 to 74 Years | 3 (25.0%) | 0 (0.0%) |
| 75 Years and over | 0 (0.0%) | 0 (0.0%) |
Disability Class: Ambulatory Difficulty
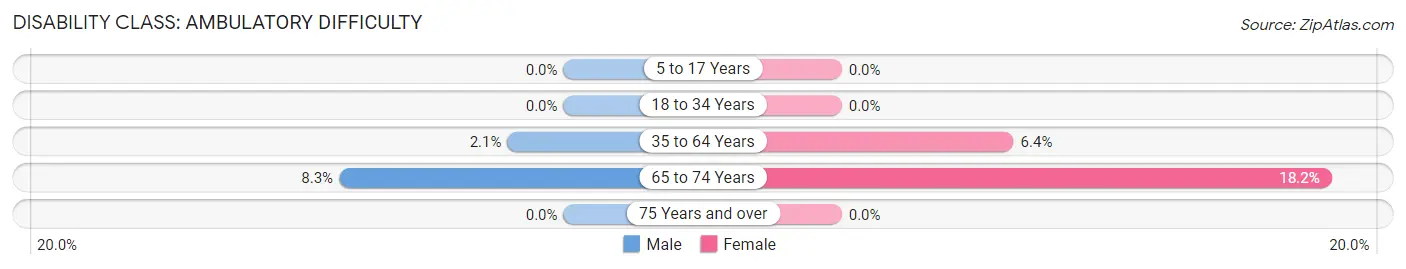
| Age Bracket | Male | Female |
| 5 to 17 Years | 0 (0.0%) | 0 (0.0%) |
| 18 to 34 Years | 0 (0.0%) | 0 (0.0%) |
| 35 to 64 Years | 1 (2.1%) | 3 (6.4%) |
| 65 to 74 Years | 1 (8.3%) | 2 (18.2%) |
| 75 Years and over | 0 (0.0%) | 0 (0.0%) |
Disability Class: Self-Care Difficulty
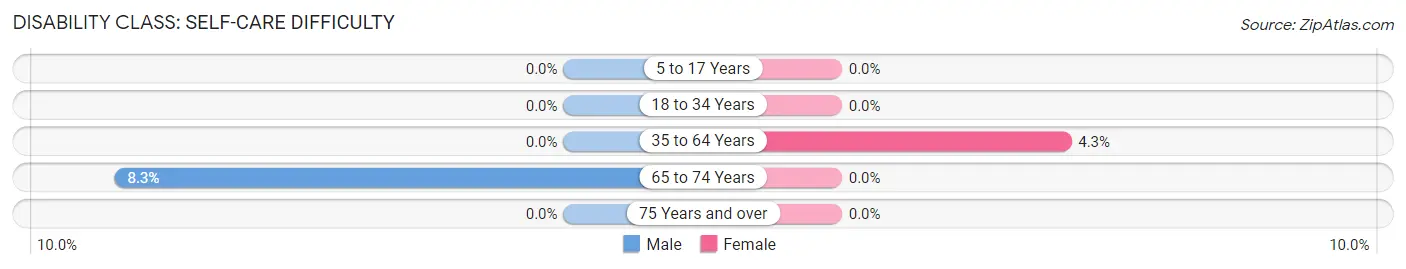
| Age Bracket | Male | Female |
| 5 to 17 Years | 0 (0.0%) | 0 (0.0%) |
| 18 to 34 Years | 0 (0.0%) | 0 (0.0%) |
| 35 to 64 Years | 0 (0.0%) | 2 (4.3%) |
| 65 to 74 Years | 1 (8.3%) | 0 (0.0%) |
| 75 Years and over | 0 (0.0%) | 0 (0.0%) |
Technology Access in Surry
Computing Device Access in Surry
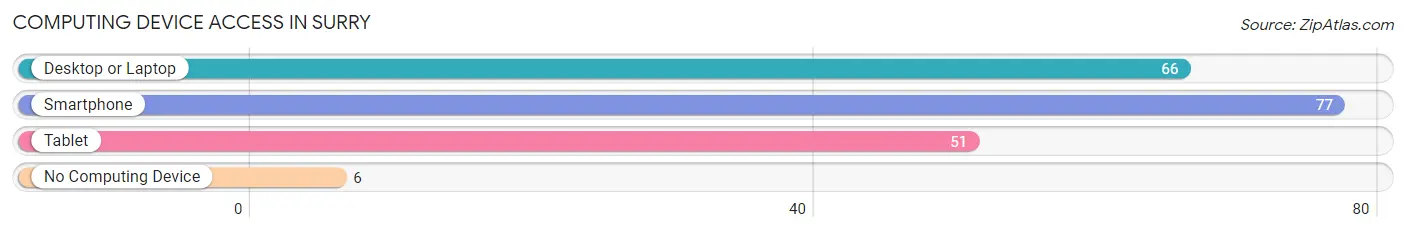
| Device Type | # Households | % Households |
| Desktop or Laptop | 66 | 79.5% |
| Smartphone | 77 | 92.8% |
| Tablet | 51 | 61.5% |
| No Computing Device | 6 | 7.2% |
| Total | 83 | 100.0% |
Internet Access in Surry
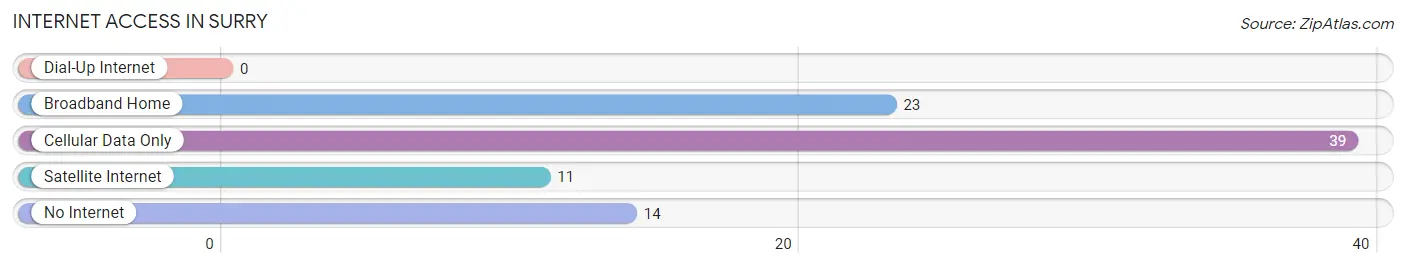
| Internet Type | # Households | % Households |
| Dial-Up Internet | 0 | 0.0% |
| Broadband Home | 23 | 27.7% |
| Cellular Data Only | 39 | 47.0% |
| Satellite Internet | 11 | 13.3% |
| No Internet | 14 | 16.9% |
| Total | 83 | 100.0% |
Surry Summary
Surry, Virginia is a small town located in the southeastern corner of the state, just south of the James River. It is part of the Hampton Roads metropolitan area and is home to a population of just over 7,000 people. The town is known for its rich history, beautiful scenery, and vibrant economy.
History
Surry was first settled in 1652 by English colonists. The town was named after the English county of Surrey, and was originally part of the Virginia Colony. During the American Revolution, Surry was the site of several battles, including the Battle of Great Bridge in 1775. After the war, the town grew and prospered, becoming a major port for the export of tobacco and other goods.
In the 19th century, Surry was a major center of the slave trade. The town was home to several large plantations, and many of the town’s residents were enslaved African Americans. After the Civil War, the town’s economy shifted to focus on agriculture and fishing.
Geography
Surry is located in the southeastern corner of Virginia, just south of the James River. The town is situated on a peninsula, surrounded by the James River to the north and the Pagan River to the south. The town is bordered by the cities of Newport News and Hampton to the east, and Williamsburg to the west.
The town is located in a humid subtropical climate zone, with hot, humid summers and mild winters. The average annual temperature is around 60 degrees Fahrenheit, and the average annual precipitation is around 45 inches.
Economy
Surry’s economy is largely based on agriculture and fishing. The town is home to several large farms, and the surrounding area is known for its production of corn, soybeans, and other crops. The town is also home to several seafood processing plants, which process and export a variety of fish and shellfish.
In addition to agriculture and fishing, Surry is home to several small businesses, including restaurants, retail stores, and service providers. The town is also home to a number of tourist attractions, including the Surry County Historical Society Museum and the Surry County Courthouse.
Demographics
As of the 2010 census, Surry had a population of 7,053 people. The racial makeup of the town was 73.3% White, 22.2% African American, 0.5% Native American, 0.7% Asian, 0.1% Pacific Islander, and 2.2% from other races. The median household income was $41,945, and the median family income was $50,945.
Surry is a small town with a rich history and a vibrant economy. The town is home to a diverse population, and is a great place to live, work, and visit.
Common Questions
What is Per Capita Income in Surry?
Per Capita income in Surry is $39,068.
What is the Median Family Income in Surry?
Median Family Income in Surry is $91,964.
What is the Median Household income in Surry?
Median Household Income in Surry is $87,917.
What is Income or Wage Gap in Surry?
Income or Wage Gap in Surry is 30.2%.
Women in Surry earn 69.8 cents for every dollar earned by a man.
What is Inequality or Gini Index in Surry?
Inequality or Gini Index in Surry is 0.31.
What is the Total Population of Surry?
Total Population of Surry is 222.
What is the Total Male Population of Surry?
Total Male Population of Surry is 107.
What is the Total Female Population of Surry?
Total Female Population of Surry is 115.
What is the Ratio of Males per 100 Females in Surry?
There are 93.04 Males per 100 Females in Surry.
What is the Ratio of Females per 100 Males in Surry?
There are 107.48 Females per 100 Males in Surry.
What is the Median Population Age in Surry?
Median Population Age in Surry is 45.9 Years.
What is the Average Family Size in Surry
Average Family Size in Surry is 3.3 People.
What is the Average Household Size in Surry
Average Household Size in Surry is 2.7 People.
How Large is the Labor Force in Surry?
There are 111 People in the Labor Forcein in Surry.
What is the Percentage of People in the Labor Force in Surry?
62.7% of People are in the Labor Force in Surry.
What is the Unemployment Rate in Surry?
Unemployment Rate in Surry is 1.8%.