Sugar Grove, VA Map & Demographics
Sugar Grove Map
Sugar Grove Overview
$25,499
PER CAPITA INCOME
$75,714
AVG FAMILY INCOME
0.40
INEQUALITY / GINI INDEX
723
TOTAL POPULATION
412
MALE POPULATION
311
FEMALE POPULATION
132.48
MALES / 100 FEMALES
75.49
FEMALES / 100 MALES
42.8
MEDIAN AGE
2.7
AVG FAMILY SIZE
2.3
AVG HOUSEHOLD SIZE
326
LABOR FORCE [ PEOPLE ]
56.3%
PERCENT IN LABOR FORCE
9.8%
UNEMPLOYMENT RATE
Sugar Grove Zip Codes
Sugar Grove Area Codes
Income in Sugar Grove
Income Overview in Sugar Grove
| Characteristic | Number | Measure |
| Per Capita Income | 723 | $25,499 |
| Median Family Income | 220 | $75,714 |
| Mean Family Income | 220 | $69,540 |
| Median Household Income | 319 | $0 |
| Mean Household Income | 319 | $58,161 |
| Income Deficit | 220 | $0 |
| Wage / Income Gap (%) | 723 | 0.00% |
| Wage / Income Gap ($) | 723 | 100.00¢ per $1 |
| Gini / Inequality Index | 723 | 0.40 |
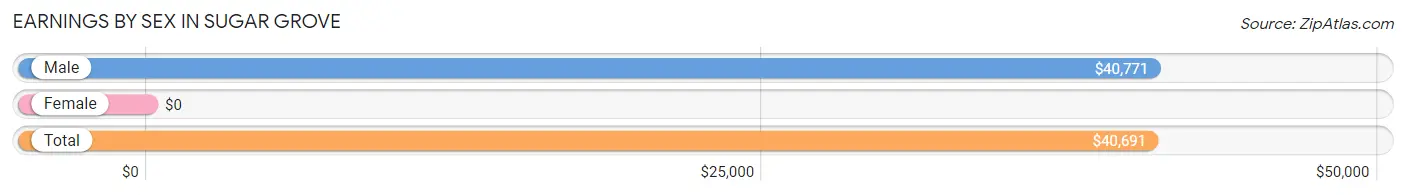
Earnings by Sex in Sugar Grove
| Sex | Number | Average Earnings |
| Male | 191 (65.0%) | $40,771 |
| Female | 103 (35.0%) | $0 |
| Total | 294 (100.0%) | $40,691 |
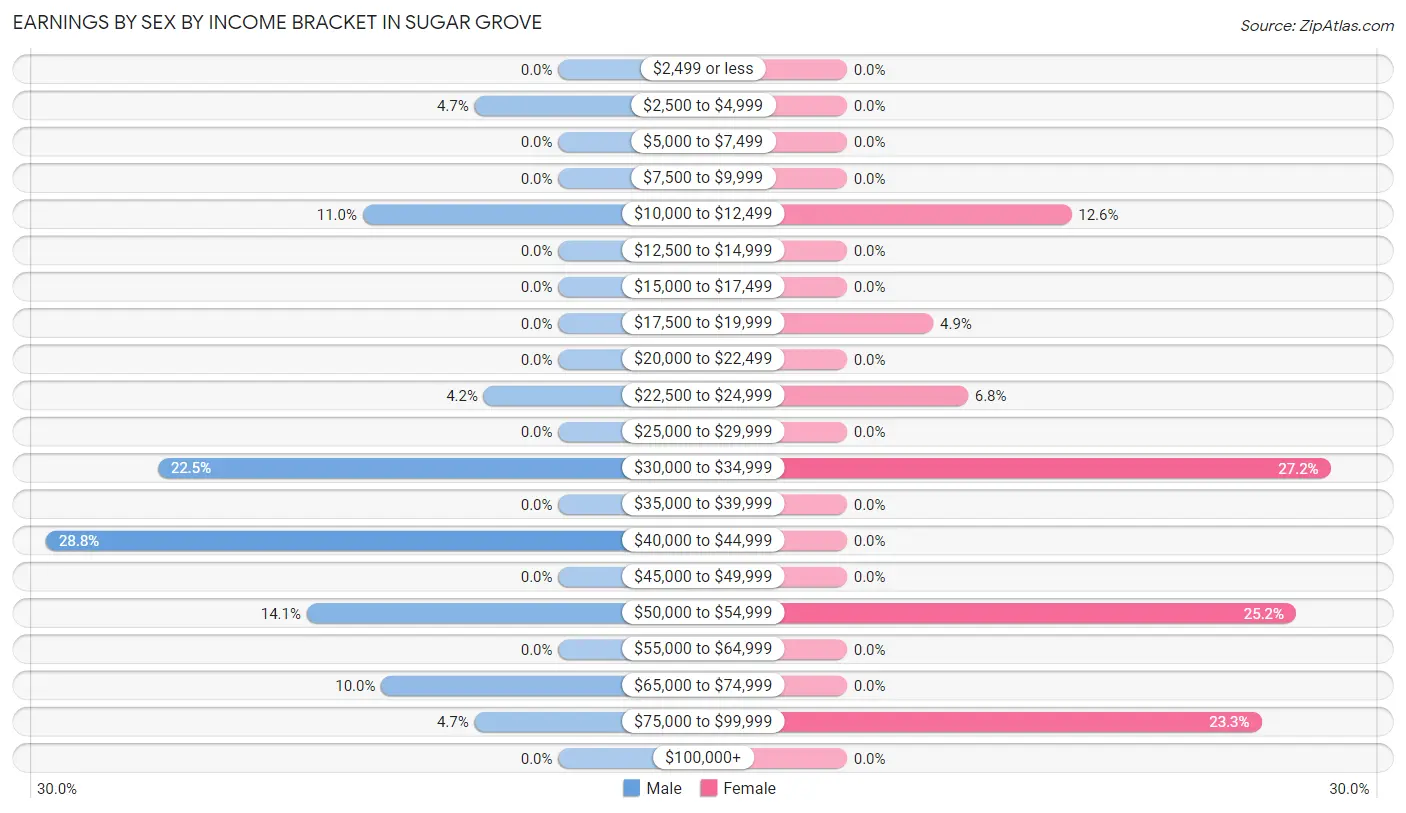
Earnings by Sex by Income Bracket in Sugar Grove
The most common earnings brackets in Sugar Grove are $40,000 to $44,999 for men (55 | 28.8%) and $30,000 to $34,999 for women (28 | 27.2%).
| Income | Male | Female |
| $2,499 or less | 0 (0.0%) | 0 (0.0%) |
| $2,500 to $4,999 | 9 (4.7%) | 0 (0.0%) |
| $5,000 to $7,499 | 0 (0.0%) | 0 (0.0%) |
| $7,500 to $9,999 | 0 (0.0%) | 0 (0.0%) |
| $10,000 to $12,499 | 21 (11.0%) | 13 (12.6%) |
| $12,500 to $14,999 | 0 (0.0%) | 0 (0.0%) |
| $15,000 to $17,499 | 0 (0.0%) | 0 (0.0%) |
| $17,500 to $19,999 | 0 (0.0%) | 5 (4.9%) |
| $20,000 to $22,499 | 0 (0.0%) | 0 (0.0%) |
| $22,500 to $24,999 | 8 (4.2%) | 7 (6.8%) |
| $25,000 to $29,999 | 0 (0.0%) | 0 (0.0%) |
| $30,000 to $34,999 | 43 (22.5%) | 28 (27.2%) |
| $35,000 to $39,999 | 0 (0.0%) | 0 (0.0%) |
| $40,000 to $44,999 | 55 (28.8%) | 0 (0.0%) |
| $45,000 to $49,999 | 0 (0.0%) | 0 (0.0%) |
| $50,000 to $54,999 | 27 (14.1%) | 26 (25.2%) |
| $55,000 to $64,999 | 0 (0.0%) | 0 (0.0%) |
| $65,000 to $74,999 | 19 (10.0%) | 0 (0.0%) |
| $75,000 to $99,999 | 9 (4.7%) | 24 (23.3%) |
| $100,000+ | 0 (0.0%) | 0 (0.0%) |
| Total | 191 (100.0%) | 103 (100.0%) |
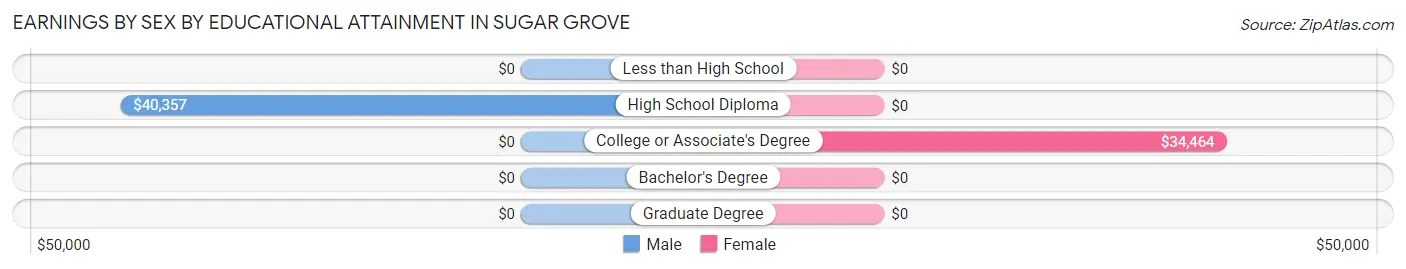
Earnings by Sex by Educational Attainment in Sugar Grove
| Educational Attainment | Male Income | Female Income |
| Less than High School | - | - |
| High School Diploma | $40,357 | $0 |
| College or Associate's Degree | - | - |
| Bachelor's Degree | - | - |
| Graduate Degree | - | - |
| Total | $40,771 | $0 |
Family Income in Sugar Grove
Family Income Brackets in Sugar Grove
According to the Sugar Grove family income data, there are 78 families falling into the $75,000 to $99,999 income range, which is the most common income bracket and makes up 35.4% of all families.
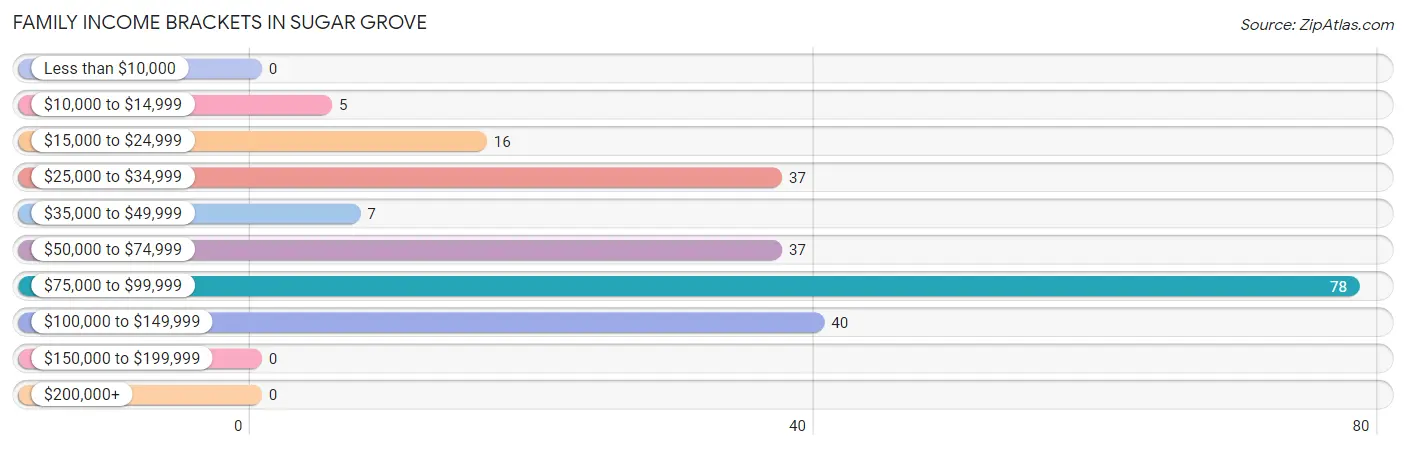
| Income Bracket | # Families | % Families |
| Less than $10,000 | 0 | 0.0% |
| $10,000 to $14,999 | 5 | 2.3% |
| $15,000 to $24,999 | 16 | 7.3% |
| $25,000 to $34,999 | 37 | 16.8% |
| $35,000 to $49,999 | 7 | 3.2% |
| $50,000 to $74,999 | 37 | 16.8% |
| $75,000 to $99,999 | 78 | 35.5% |
| $100,000 to $149,999 | 40 | 18.2% |
| $150,000 to $199,999 | 0 | 0.0% |
| $200,000+ | 0 | 0.0% |
Family Income by Famaliy Size in Sugar Grove
3-person families (62 | 28.2%) account for the highest median family income in Sugar Grove with $74,583 per family, while 2-person families (115 | 52.3%) have the highest median income of $29,812 per family member.
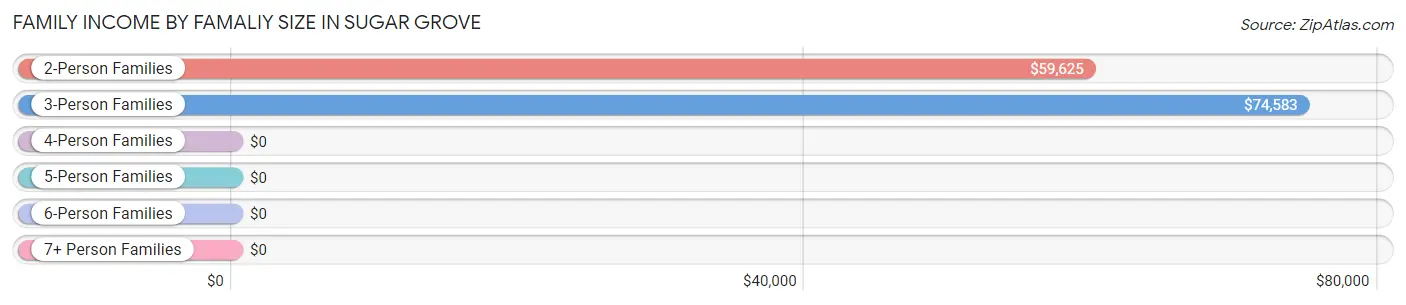
| Income Bracket | # Families | Median Income |
| 2-Person Families | 115 (52.3%) | $59,625 |
| 3-Person Families | 62 (28.2%) | $74,583 |
| 4-Person Families | 19 (8.6%) | $0 |
| 5-Person Families | 24 (10.9%) | $0 |
| 6-Person Families | 0 (0.0%) | $0 |
| 7+ Person Families | 0 (0.0%) | $0 |
| Total | 220 (100.0%) | $75,714 |
Family Income by Number of Earners in Sugar Grove
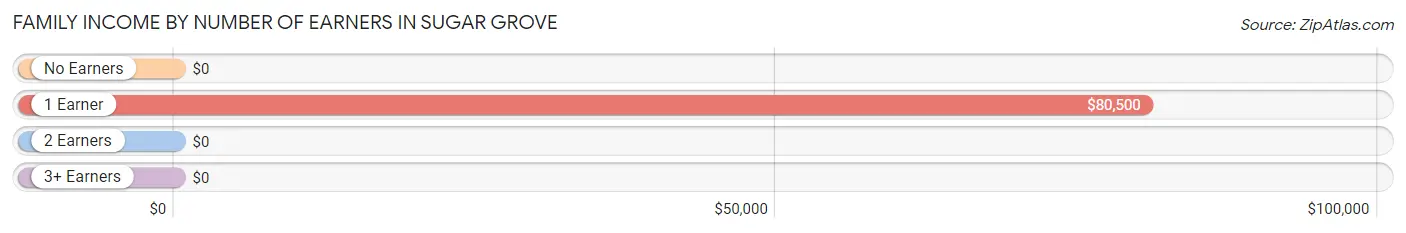
| Number of Earners | # Families | Median Income |
| No Earners | 63 (28.6%) | $0 |
| 1 Earner | 96 (43.6%) | $80,500 |
| 2 Earners | 61 (27.7%) | $0 |
| 3+ Earners | 0 (0.0%) | $0 |
| Total | 220 (100.0%) | $75,714 |
Household Income in Sugar Grove
Household Income Brackets in Sugar Grove
With 64 households falling in the category, the $100,000 to $149,999 income range is the most frequent in Sugar Grove, accounting for 20.1% of all households.
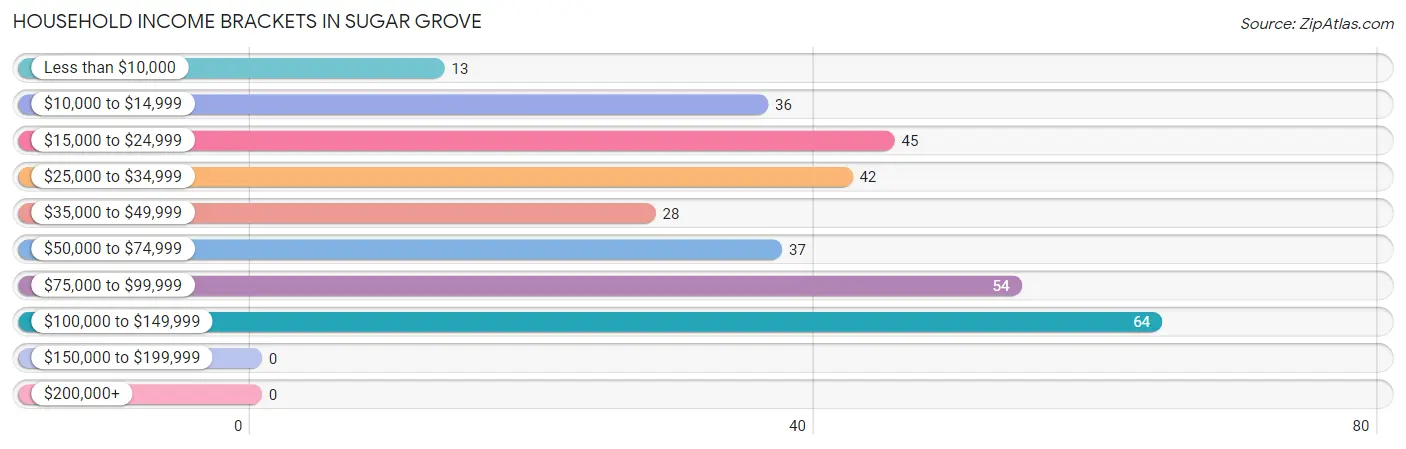
| Income Bracket | # Households | % Households |
| Less than $10,000 | 13 | 4.1% |
| $10,000 to $14,999 | 36 | 11.3% |
| $15,000 to $24,999 | 45 | 14.1% |
| $25,000 to $34,999 | 42 | 13.2% |
| $35,000 to $49,999 | 28 | 8.8% |
| $50,000 to $74,999 | 37 | 11.6% |
| $75,000 to $99,999 | 54 | 16.9% |
| $100,000 to $149,999 | 64 | 20.1% |
| $150,000 to $199,999 | 0 | 0.0% |
| $200,000+ | 0 | 0.0% |
Household Income by Householder Age in Sugar Grove
The median household income in Sugar Grove is $0, with the highest median household income of $81,250 found in the 25 to 44 years age bracket for the primary householder. A total of 76 households (23.8%) fall into this category.
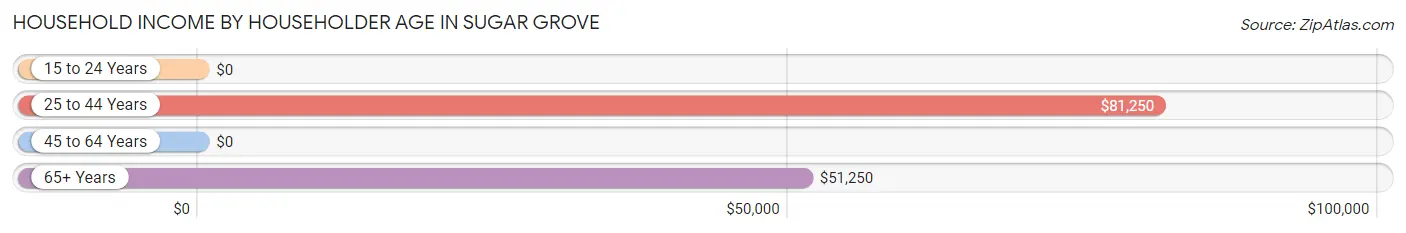
| Income Bracket | # Households | Median Income |
| 15 to 24 Years | 0 (0.0%) | $0 |
| 25 to 44 Years | 76 (23.8%) | $81,250 |
| 45 to 64 Years | 177 (55.5%) | $0 |
| 65+ Years | 66 (20.7%) | $51,250 |
| Total | 319 (100.0%) | $0 |
Poverty in Sugar Grove
Income Below Poverty by Sex and Age in Sugar Grove
With 12.4% poverty level for males and 8.7% for females among the residents of Sugar Grove, 55 to 64 year old males and 55 to 64 year old females are the most vulnerable to poverty, with 43 males (58.9%) and 12 females (25.5%) in their respective age groups living below the poverty level.
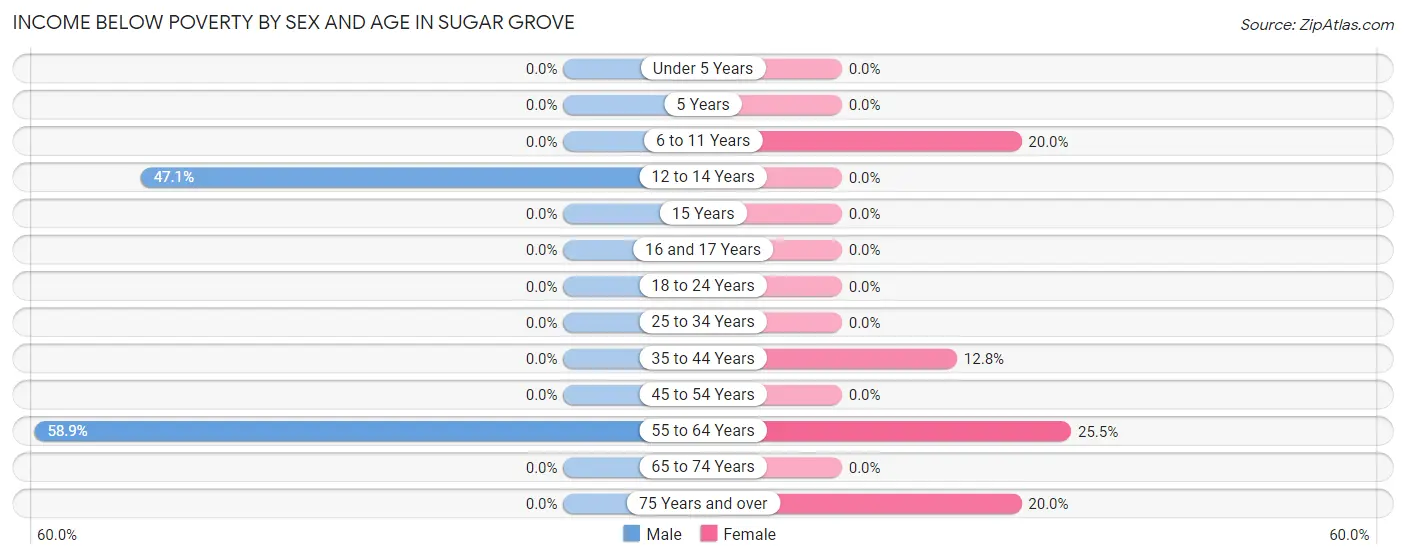
| Age Bracket | Male | Female |
| Under 5 Years | 0 (0.0%) | 0 (0.0%) |
| 5 Years | 0 (0.0%) | 0 (0.0%) |
| 6 to 11 Years | 0 (0.0%) | 4 (20.0%) |
| 12 to 14 Years | 8 (47.1%) | 0 (0.0%) |
| 15 Years | 0 (0.0%) | 0 (0.0%) |
| 16 and 17 Years | 0 (0.0%) | 0 (0.0%) |
| 18 to 24 Years | 0 (0.0%) | 0 (0.0%) |
| 25 to 34 Years | 0 (0.0%) | 0 (0.0%) |
| 35 to 44 Years | 0 (0.0%) | 5 (12.8%) |
| 45 to 54 Years | 0 (0.0%) | 0 (0.0%) |
| 55 to 64 Years | 43 (58.9%) | 12 (25.5%) |
| 65 to 74 Years | 0 (0.0%) | 0 (0.0%) |
| 75 Years and over | 0 (0.0%) | 6 (20.0%) |
| Total | 51 (12.4%) | 27 (8.7%) |
Income Above Poverty by Sex and Age in Sugar Grove
According to the poverty statistics in Sugar Grove, males aged under 5 years and females aged under 5 years are the age groups that are most secure financially, with 100.0% of males and 100.0% of females in these age groups living above the poverty line.
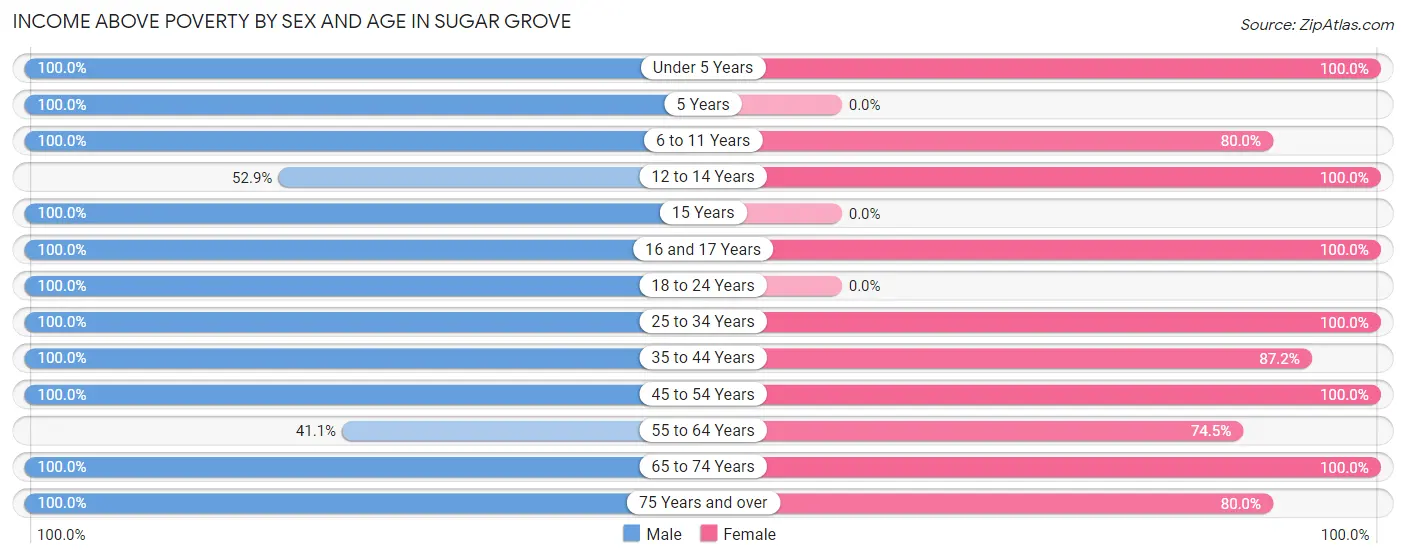
| Age Bracket | Male | Female |
| Under 5 Years | 27 (100.0%) | 15 (100.0%) |
| 5 Years | 21 (100.0%) | 0 (0.0%) |
| 6 to 11 Years | 7 (100.0%) | 16 (80.0%) |
| 12 to 14 Years | 9 (52.9%) | 21 (100.0%) |
| 15 Years | 16 (100.0%) | 0 (0.0%) |
| 16 and 17 Years | 23 (100.0%) | 32 (100.0%) |
| 18 to 24 Years | 36 (100.0%) | 0 (0.0%) |
| 25 to 34 Years | 17 (100.0%) | 13 (100.0%) |
| 35 to 44 Years | 84 (100.0%) | 34 (87.2%) |
| 45 to 54 Years | 60 (100.0%) | 76 (100.0%) |
| 55 to 64 Years | 30 (41.1%) | 35 (74.5%) |
| 65 to 74 Years | 14 (100.0%) | 18 (100.0%) |
| 75 Years and over | 17 (100.0%) | 24 (80.0%) |
| Total | 361 (87.6%) | 284 (91.3%) |
Income Below Poverty Among Married-Couple Families in Sugar Grove
The poverty statistics for married-couple families in Sugar Grove show that 6.9% or 9 of the total 131 families live below the poverty line. Families with 1 or 2 children have the highest poverty rate of 12.2%, comprising of 9 families. On the other hand, families with no children have the lowest poverty rate of 0.0%, which includes 0 families.
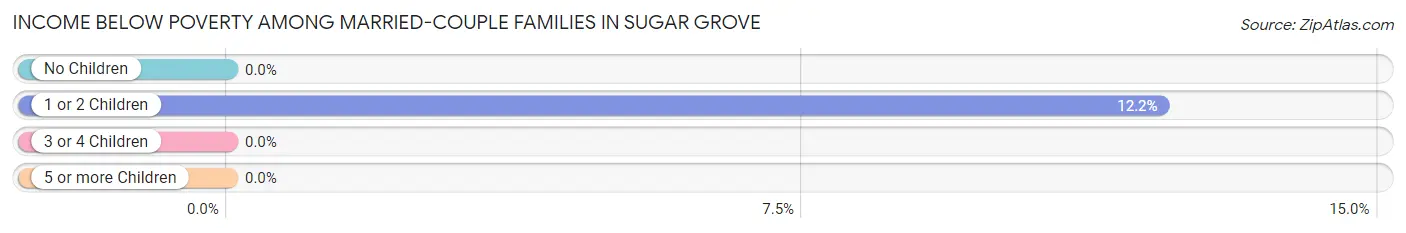
| Children | Above Poverty | Below Poverty |
| No Children | 57 (100.0%) | 0 (0.0%) |
| 1 or 2 Children | 65 (87.8%) | 9 (12.2%) |
| 3 or 4 Children | 0 (0.0%) | 0 (0.0%) |
| 5 or more Children | 0 (0.0%) | 0 (0.0%) |
| Total | 122 (93.1%) | 9 (6.9%) |
Income Below Poverty Among Single-Parent Households in Sugar Grove
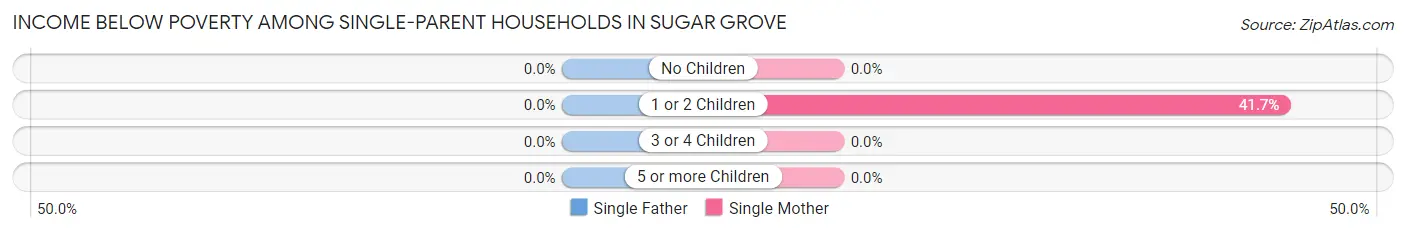
| Children | Single Father | Single Mother |
| No Children | 0 (0.0%) | 0 (0.0%) |
| 1 or 2 Children | 0 (0.0%) | 5 (41.7%) |
| 3 or 4 Children | 0 (0.0%) | 0 (0.0%) |
| 5 or more Children | 0 (0.0%) | 0 (0.0%) |
| Total | 0 (0.0%) | 5 (6.1%) |
Income Below Poverty Among Married-Couple vs Single-Parent Households in Sugar Grove
The poverty data for Sugar Grove shows that 9 of the married-couple family households (6.9%) and 5 of the single-parent households (5.6%) are living below the poverty level. Within the married-couple family households, those with 1 or 2 children have the highest poverty rate, with 9 households (12.2%) falling below the poverty line. Among the single-parent households, those with 1 or 2 children have the highest poverty rate, with 5 household (41.7%) living below poverty.
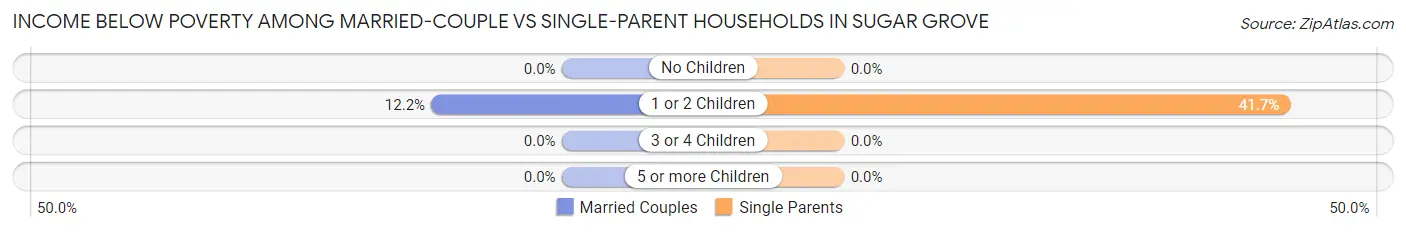
| Children | Married-Couple Families | Single-Parent Households |
| No Children | 0 (0.0%) | 0 (0.0%) |
| 1 or 2 Children | 9 (12.2%) | 5 (41.7%) |
| 3 or 4 Children | 0 (0.0%) | 0 (0.0%) |
| 5 or more Children | 0 (0.0%) | 0 (0.0%) |
| Total | 9 (6.9%) | 5 (5.6%) |
Race in Sugar Grove
The most populous races in Sugar Grove are , and White / Caucasian (723 | 100.0%).
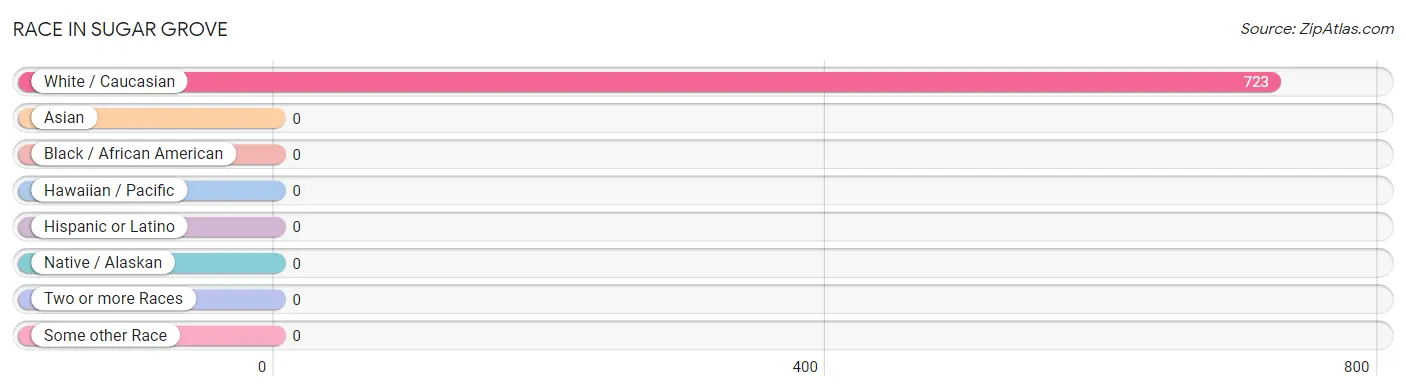
| Race | # Population | % Population |
| Asian | 0 | 0.0% |
| Black / African American | 0 | 0.0% |
| Hawaiian / Pacific | 0 | 0.0% |
| Hispanic or Latino | 0 | 0.0% |
| Native / Alaskan | 0 | 0.0% |
| White / Caucasian | 723 | 100.0% |
| Two or more Races | 0 | 0.0% |
| Some other Race | 0 | 0.0% |
| Total | 723 | 100.0% |
Ancestry in Sugar Grove
The most populous ancestries reported in Sugar Grove are American (269 | 37.2%), English (107 | 14.8%), Irish (15 | 2.1%), Austrian (9 | 1.2%), and British (9 | 1.2%), together accounting for 56.6% of all Sugar Grove residents.
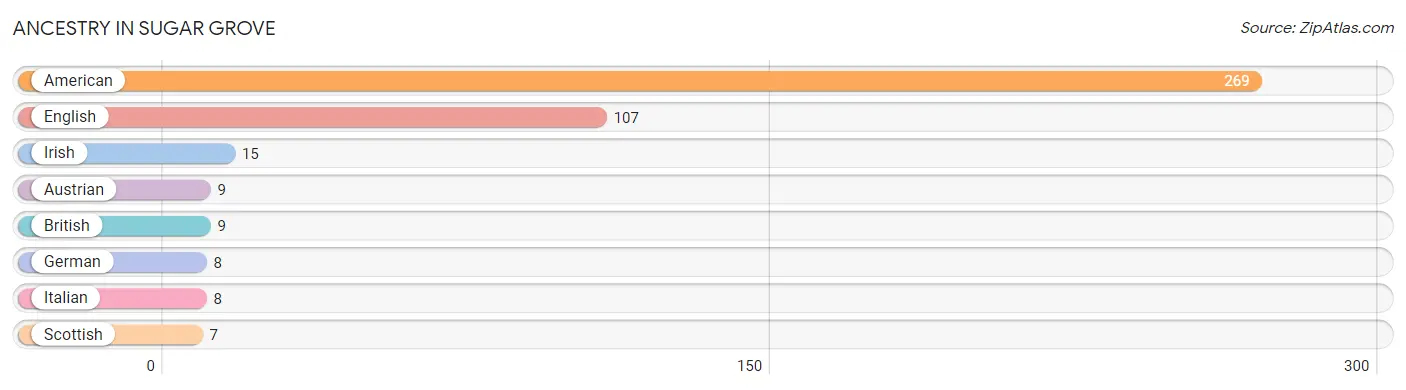
| Ancestry | # Population | % Population |
| American | 269 | 37.2% |
| Austrian | 9 | 1.2% |
| British | 9 | 1.2% |
| English | 107 | 14.8% |
| German | 8 | 1.1% |
| Irish | 15 | 2.1% |
| Italian | 8 | 1.1% |
| Scottish | 7 | 1.0% | View All 8 Rows |
Immigrants in Sugar Grove

| Immigration Origin | # Population | % Population | View All 0 Rows |
Sex and Age in Sugar Grove
Sex and Age in Sugar Grove
The most populous age groups in Sugar Grove are 40 to 44 Years (74 | 18.0%) for men and 45 to 49 Years (76 | 24.4%) for women.
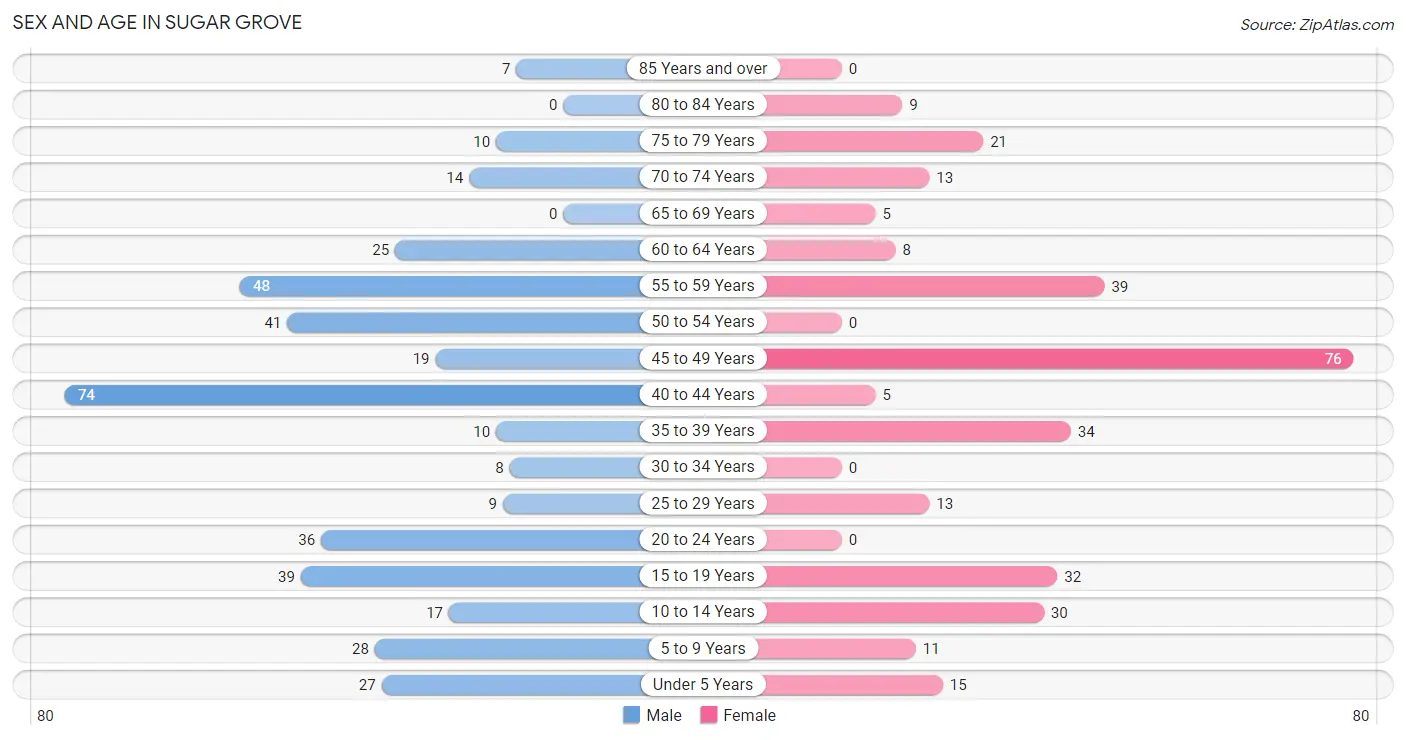
| Age Bracket | Male | Female |
| Under 5 Years | 27 (6.6%) | 15 (4.8%) |
| 5 to 9 Years | 28 (6.8%) | 11 (3.5%) |
| 10 to 14 Years | 17 (4.1%) | 30 (9.7%) |
| 15 to 19 Years | 39 (9.5%) | 32 (10.3%) |
| 20 to 24 Years | 36 (8.7%) | 0 (0.0%) |
| 25 to 29 Years | 9 (2.2%) | 13 (4.2%) |
| 30 to 34 Years | 8 (1.9%) | 0 (0.0%) |
| 35 to 39 Years | 10 (2.4%) | 34 (10.9%) |
| 40 to 44 Years | 74 (18.0%) | 5 (1.6%) |
| 45 to 49 Years | 19 (4.6%) | 76 (24.4%) |
| 50 to 54 Years | 41 (10.0%) | 0 (0.0%) |
| 55 to 59 Years | 48 (11.7%) | 39 (12.5%) |
| 60 to 64 Years | 25 (6.1%) | 8 (2.6%) |
| 65 to 69 Years | 0 (0.0%) | 5 (1.6%) |
| 70 to 74 Years | 14 (3.4%) | 13 (4.2%) |
| 75 to 79 Years | 10 (2.4%) | 21 (6.8%) |
| 80 to 84 Years | 0 (0.0%) | 9 (2.9%) |
| 85 Years and over | 7 (1.7%) | 0 (0.0%) |
| Total | 412 (100.0%) | 311 (100.0%) |
Families and Households in Sugar Grove
Median Family Size in Sugar Grove
The median family size in Sugar Grove is 2.71 persons per family, with single female/mother families (82 | 37.3%) accounting for the largest median family size of 2.99 persons per family. On the other hand, single male/father families (7 | 3.2%) represent the smallest median family size with 2.14 persons per family.
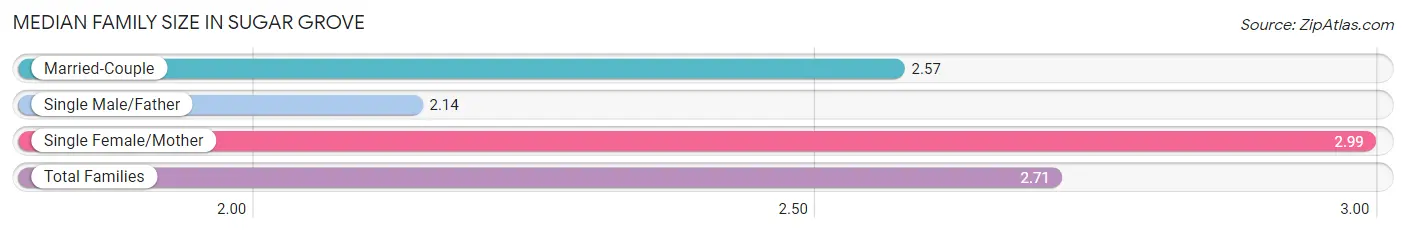
| Family Type | # Families | Family Size |
| Married-Couple | 131 (59.6%) | 2.57 |
| Single Male/Father | 7 (3.2%) | 2.14 |
| Single Female/Mother | 82 (37.3%) | 2.99 |
| Total Families | 220 (100.0%) | 2.71 |
Median Household Size in Sugar Grove
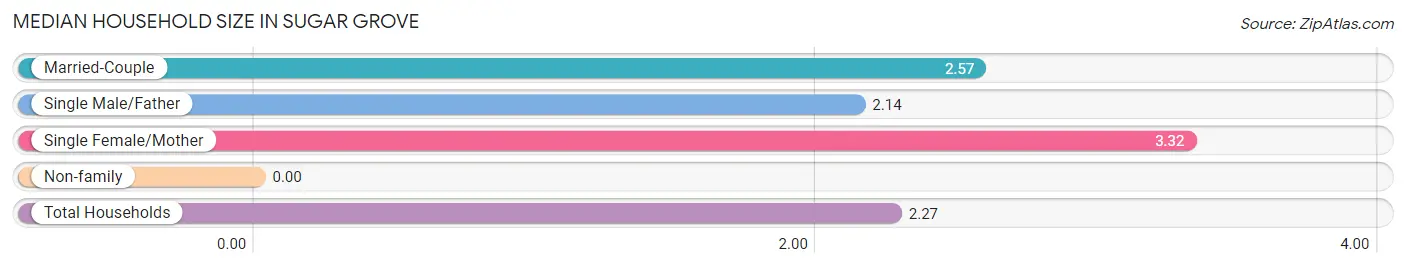
| Household Type | # Households | Household Size |
| Married-Couple | 131 (41.1%) | 2.57 |
| Single Male/Father | 7 (2.2%) | 2.14 |
| Single Female/Mother | 82 (25.7%) | 3.32 |
| Non-family | 99 (31.0%) | - |
| Total Households | 319 (100.0%) | 2.27 |
Household Size by Marriage Status in Sugar Grove
Out of a total of 319 households in Sugar Grove, 220 (69.0%) are family households, while 99 (31.0%) are nonfamily households. The most numerous type of family households are 2-person households, comprising 115, and the most common type of nonfamily households are 1-person households, comprising 99.
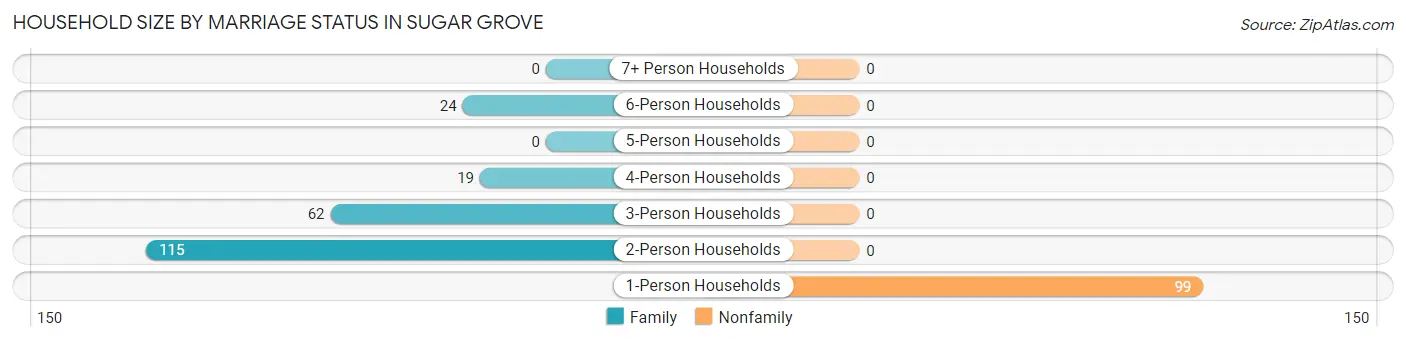
| Household Size | Family Households | Nonfamily Households |
| 1-Person Households | - | 99 (31.0%) |
| 2-Person Households | 115 (36.0%) | 0 (0.0%) |
| 3-Person Households | 62 (19.4%) | 0 (0.0%) |
| 4-Person Households | 19 (6.0%) | 0 (0.0%) |
| 5-Person Households | 0 (0.0%) | 0 (0.0%) |
| 6-Person Households | 24 (7.5%) | 0 (0.0%) |
| 7+ Person Households | 0 (0.0%) | 0 (0.0%) |
| Total | 220 (69.0%) | 99 (31.0%) |
Female Fertility in Sugar Grove
Fertility by Age in Sugar Grove
Average fertility rate in Sugar Grove is 150.0 births per 1,000 women. Women in the age bracket of 35 to 50 years have the highest fertility rate with 209.0 births per 1,000 women. Women in the age bracket of 35 to 50 years acount for 100.0% of all women with births.
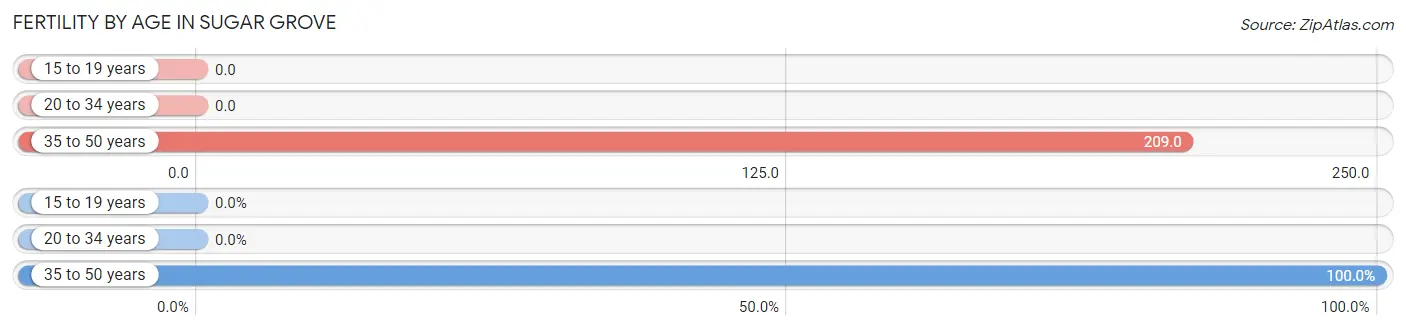
| Age Bracket | Women with Births | Births / 1,000 Women |
| 15 to 19 years | 0 (0.0%) | 0.0 |
| 20 to 34 years | 0 (0.0%) | 0.0 |
| 35 to 50 years | 24 (100.0%) | 209.0 |
| Total | 24 (100.0%) | 150.0 |
Fertility by Age by Marriage Status in Sugar Grove
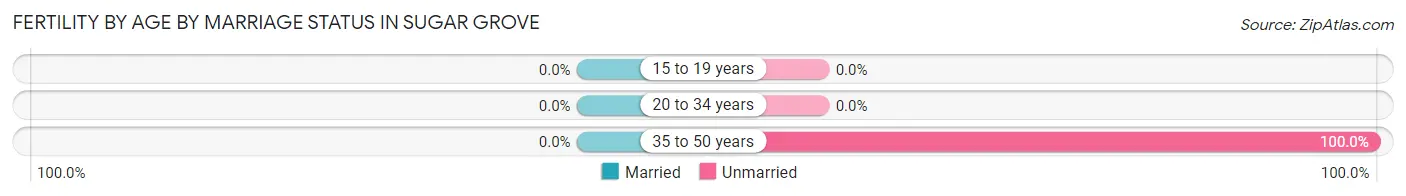
| Age Bracket | Married | Unmarried |
| 15 to 19 years | 0 (0.0%) | 0 (0.0%) |
| 20 to 34 years | 0 (0.0%) | 0 (0.0%) |
| 35 to 50 years | 0 (0.0%) | 24 (100.0%) |
| Total | 0 (0.0%) | 24 (100.0%) |
Fertility by Education in Sugar Grove
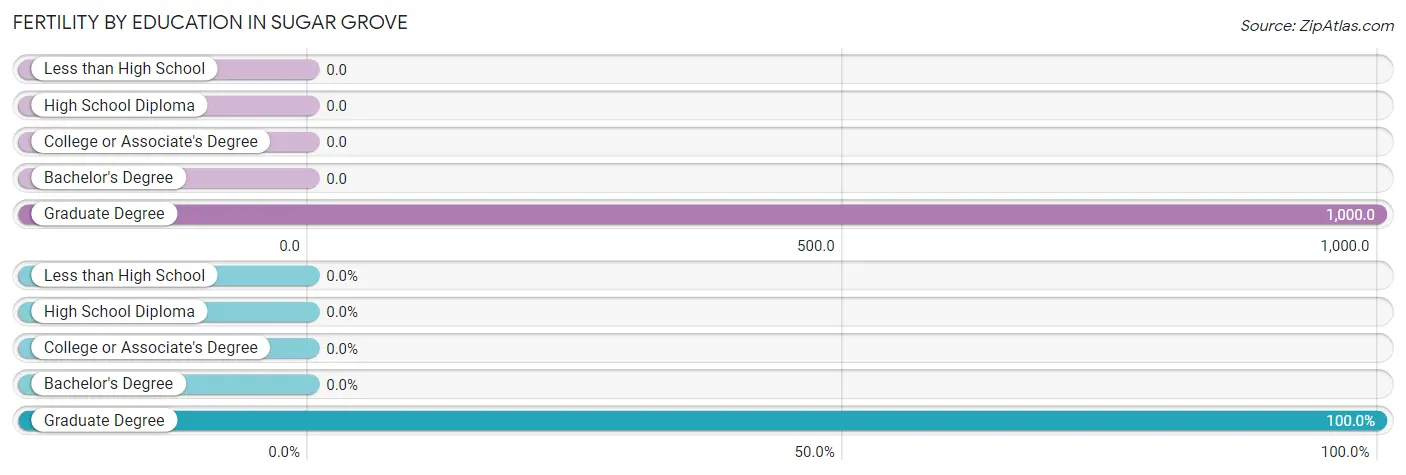
| Educational Attainment | Women with Births | Births / 1,000 Women |
| Less than High School | 0 (0.0%) | 0.0 |
| High School Diploma | 0 (0.0%) | 0.0 |
| College or Associate's Degree | 0 (0.0%) | 0.0 |
| Bachelor's Degree | 0 (0.0%) | 0.0 |
| Graduate Degree | 24 (100.0%) | 1,000.0 |
| Total | 24 (100.0%) | 150.0 |
Fertility by Education by Marriage Status in Sugar Grove
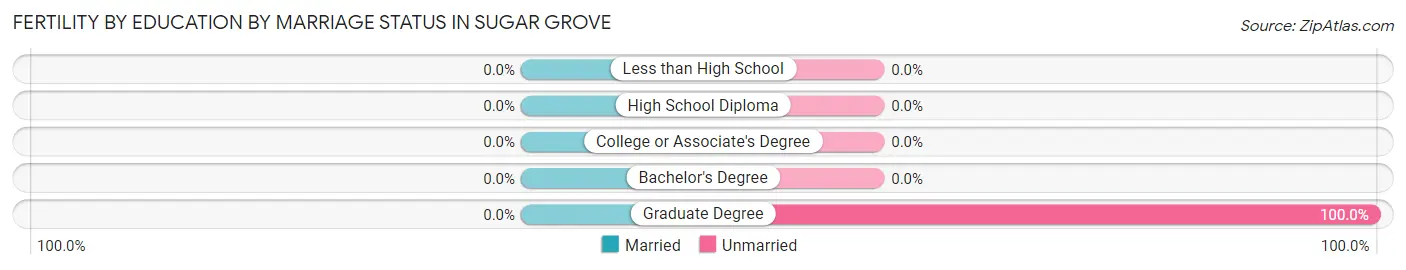
| Educational Attainment | Married | Unmarried |
| Less than High School | 0 (0.0%) | 0 (0.0%) |
| High School Diploma | 0 (0.0%) | 0 (0.0%) |
| College or Associate's Degree | 0 (0.0%) | 0 (0.0%) |
| Bachelor's Degree | 0 (0.0%) | 0 (0.0%) |
| Graduate Degree | 0 (0.0%) | 24 (100.0%) |
| Total | 0 (0.0%) | 24 (100.0%) |
Employment Characteristics in Sugar Grove
Employment by Class of Employer in Sugar Grove
Among the 294 employed individuals in Sugar Grove, private company employees (162 | 55.1%), self-employed (incorporated) (33 | 11.2%), and state government employees (31 | 10.5%) make up the most common classes of employment.
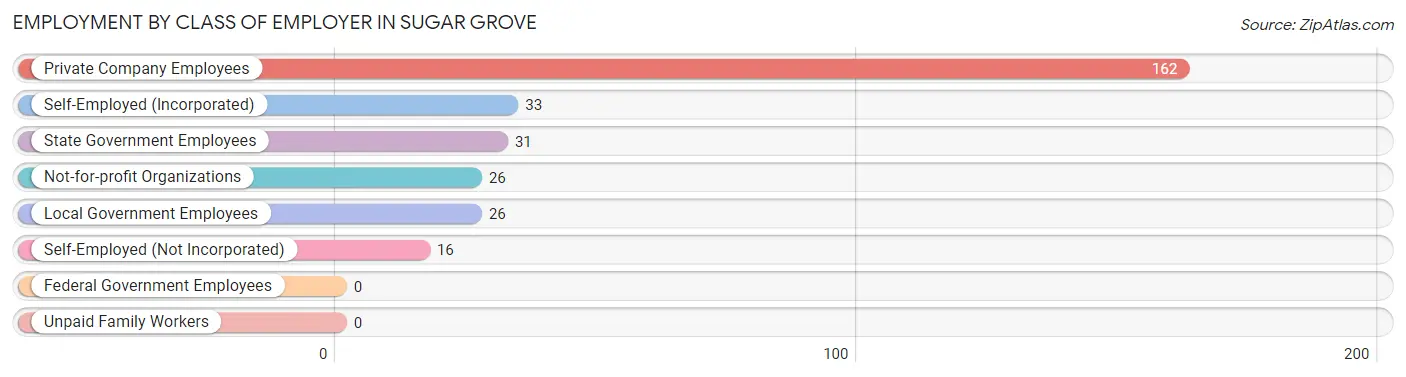
| Employer Class | # Employees | % Employees |
| Private Company Employees | 162 | 55.1% |
| Self-Employed (Incorporated) | 33 | 11.2% |
| Self-Employed (Not Incorporated) | 16 | 5.4% |
| Not-for-profit Organizations | 26 | 8.8% |
| Local Government Employees | 26 | 8.8% |
| State Government Employees | 31 | 10.5% |
| Federal Government Employees | 0 | 0.0% |
| Unpaid Family Workers | 0 | 0.0% |
| Total | 294 | 100.0% |
Employment Status by Age in Sugar Grove
According to the labor force statistics for Sugar Grove, out of the total population over 16 years of age (579), 56.3% or 326 individuals are in the labor force, with 9.8% or 32 of them unemployed. The age group with the highest labor force participation rate is 30 to 34 years, with 100.0% or 8 individuals in the labor force. Within the labor force, the 16 to 19 years age range has the highest percentage of unemployed individuals, with 100.0% or 32 of them being unemployed.
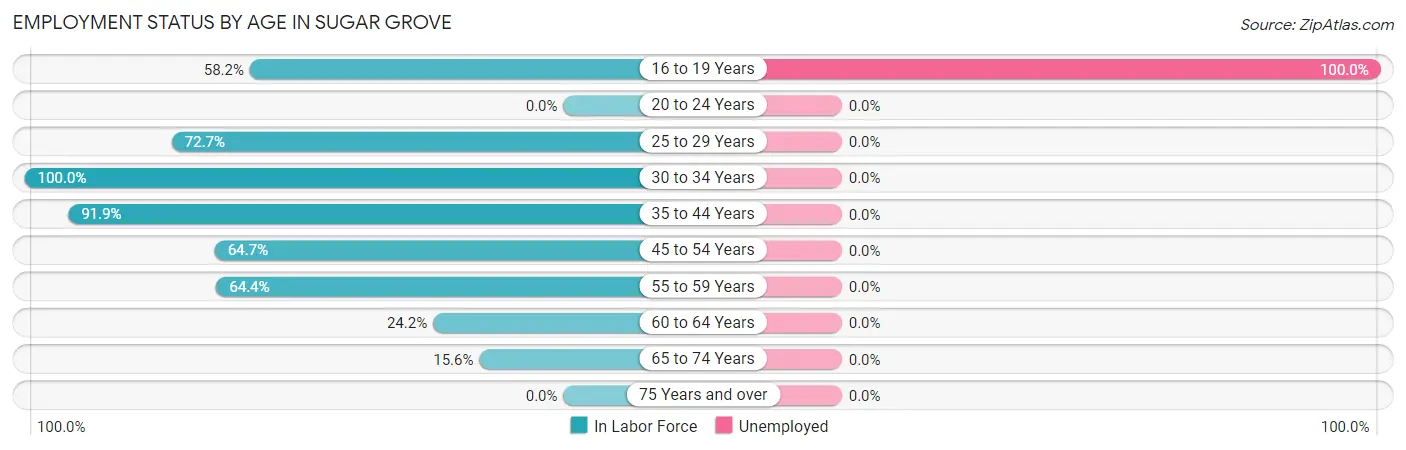
| Age Bracket | In Labor Force | Unemployed |
| 16 to 19 Years | 32 (58.2%) | 32 (100.0%) |
| 20 to 24 Years | 0 (0.0%) | 0 (0.0%) |
| 25 to 29 Years | 16 (72.7%) | 0 (0.0%) |
| 30 to 34 Years | 8 (100.0%) | 0 (0.0%) |
| 35 to 44 Years | 113 (91.9%) | 0 (0.0%) |
| 45 to 54 Years | 88 (64.7%) | 0 (0.0%) |
| 55 to 59 Years | 56 (64.4%) | 0 (0.0%) |
| 60 to 64 Years | 8 (24.2%) | 0 (0.0%) |
| 65 to 74 Years | 5 (15.6%) | 0 (0.0%) |
| 75 Years and over | 0 (0.0%) | 0 (0.0%) |
| Total | 326 (56.3%) | 32 (9.8%) |
Employment Status by Educational Attainment in Sugar Grove
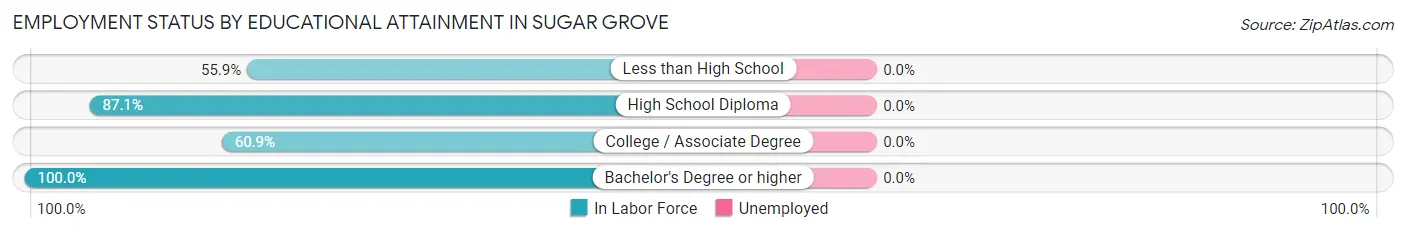
| Educational Attainment | In Labor Force | Unemployed |
| Less than High School | 66 (55.9%) | 0 (0.0%) |
| High School Diploma | 121 (87.1%) | 0 (0.0%) |
| College / Associate Degree | 78 (60.9%) | 0 (0.0%) |
| Bachelor's Degree or higher | 24 (100.0%) | 0 (0.0%) |
| Total | 289 (70.7%) | 0 (0.0%) |
Employment Occupations by Sex in Sugar Grove
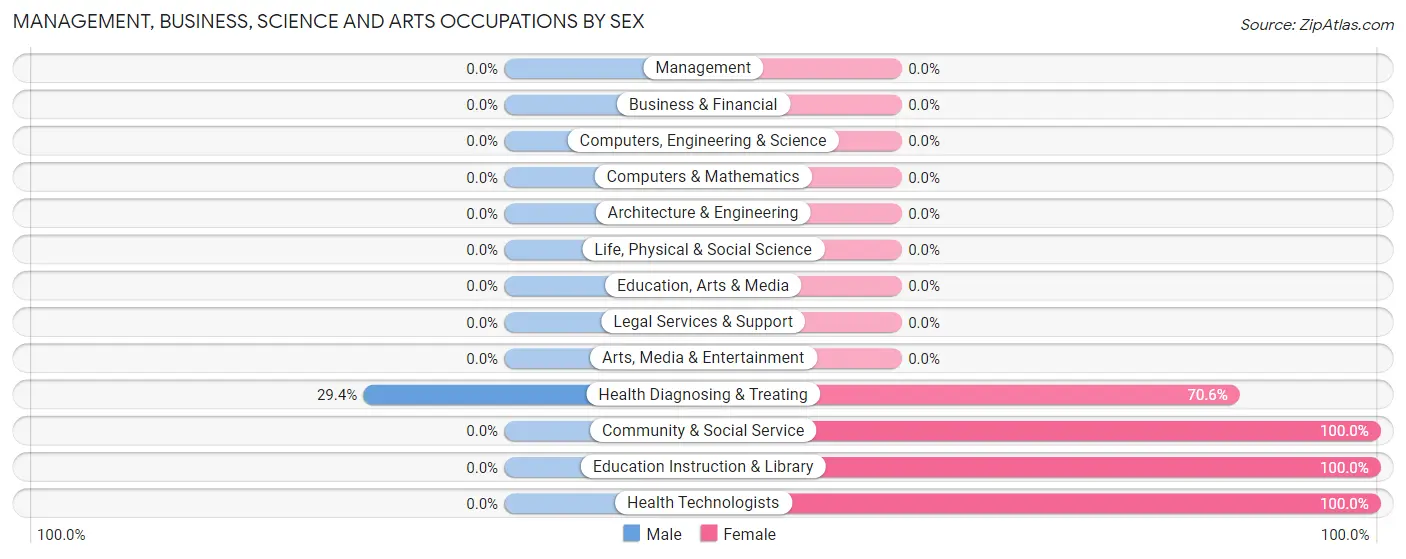
Management, Business, Science and Arts Occupations
The most common Management, Business, Science and Arts occupations in Sugar Grove are Health Diagnosing & Treating (34 | 11.6%), Health Technologists (24 | 8.2%), Community & Social Service (5 | 1.7%), and Education Instruction & Library (5 | 1.7%).
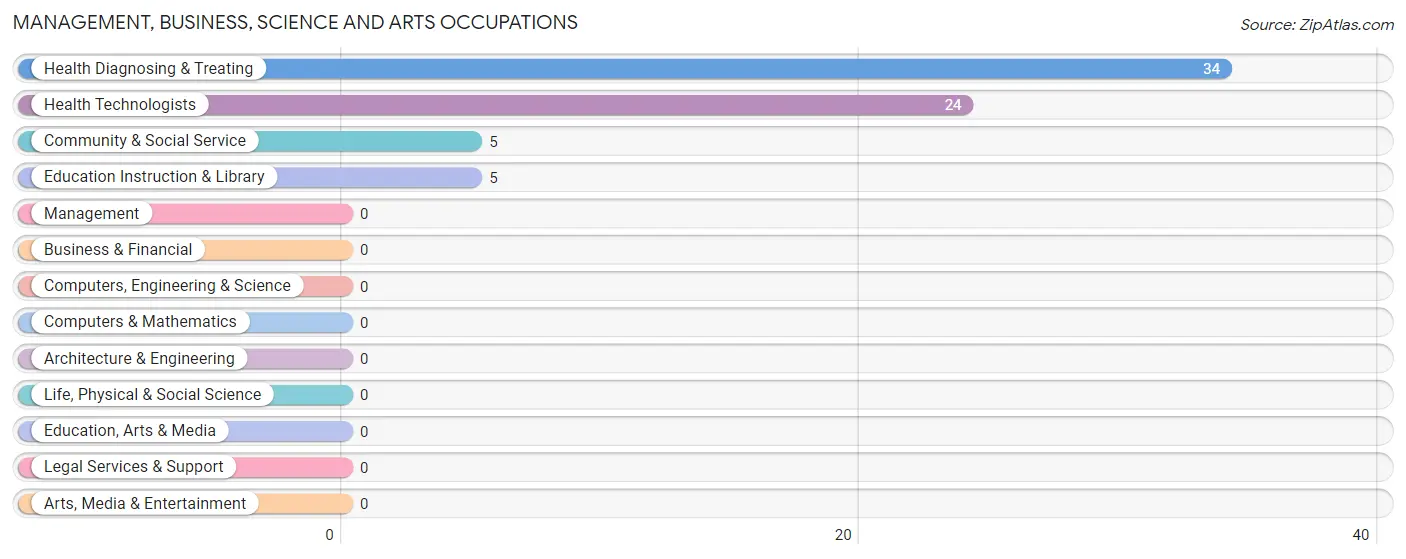
Management, Business, Science and Arts Occupations by Sex
| Occupation | Male | Female |
| Management | 0 (0.0%) | 0 (0.0%) |
| Business & Financial | 0 (0.0%) | 0 (0.0%) |
| Computers, Engineering & Science | 0 (0.0%) | 0 (0.0%) |
| Computers & Mathematics | 0 (0.0%) | 0 (0.0%) |
| Architecture & Engineering | 0 (0.0%) | 0 (0.0%) |
| Life, Physical & Social Science | 0 (0.0%) | 0 (0.0%) |
| Community & Social Service | 0 (0.0%) | 5 (100.0%) |
| Education, Arts & Media | 0 (0.0%) | 0 (0.0%) |
| Legal Services & Support | 0 (0.0%) | 0 (0.0%) |
| Education Instruction & Library | 0 (0.0%) | 5 (100.0%) |
| Arts, Media & Entertainment | 0 (0.0%) | 0 (0.0%) |
| Health Diagnosing & Treating | 10 (29.4%) | 24 (70.6%) |
| Health Technologists | 0 (0.0%) | 24 (100.0%) |
| Total (Category) | 10 (25.6%) | 29 (74.4%) |
| Total (Overall) | 191 (65.0%) | 103 (35.0%) |
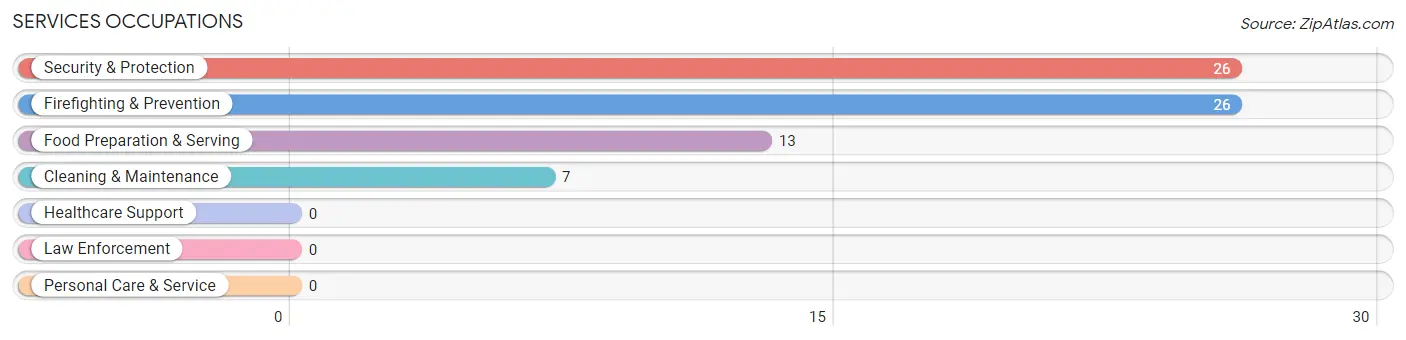
Services Occupations
The most common Services occupations in Sugar Grove are Security & Protection (26 | 8.8%), Firefighting & Prevention (26 | 8.8%), Food Preparation & Serving (13 | 4.4%), and Cleaning & Maintenance (7 | 2.4%).
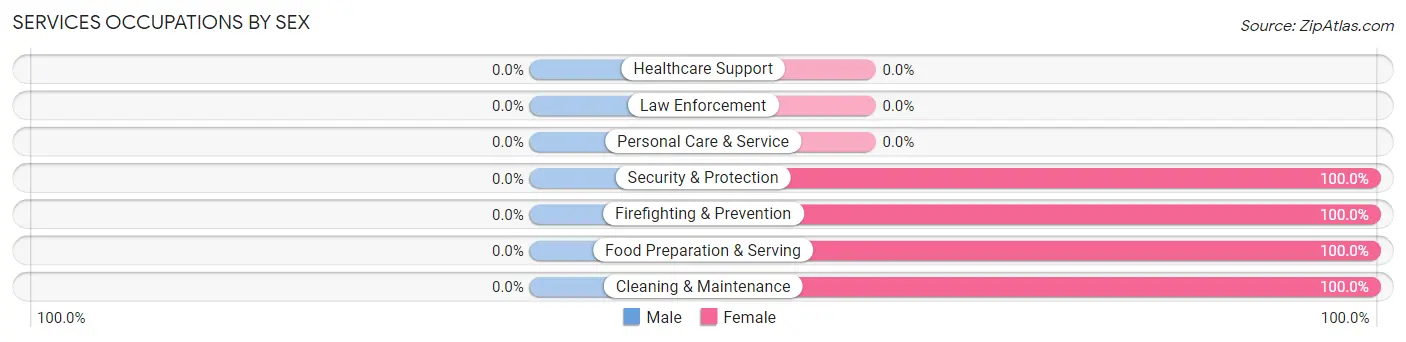
Services Occupations by Sex
| Occupation | Male | Female |
| Healthcare Support | 0 (0.0%) | 0 (0.0%) |
| Security & Protection | 0 (0.0%) | 26 (100.0%) |
| Firefighting & Prevention | 0 (0.0%) | 26 (100.0%) |
| Law Enforcement | 0 (0.0%) | 0 (0.0%) |
| Food Preparation & Serving | 0 (0.0%) | 13 (100.0%) |
| Cleaning & Maintenance | 0 (0.0%) | 7 (100.0%) |
| Personal Care & Service | 0 (0.0%) | 0 (0.0%) |
| Total (Category) | 0 (0.0%) | 46 (100.0%) |
| Total (Overall) | 191 (65.0%) | 103 (35.0%) |
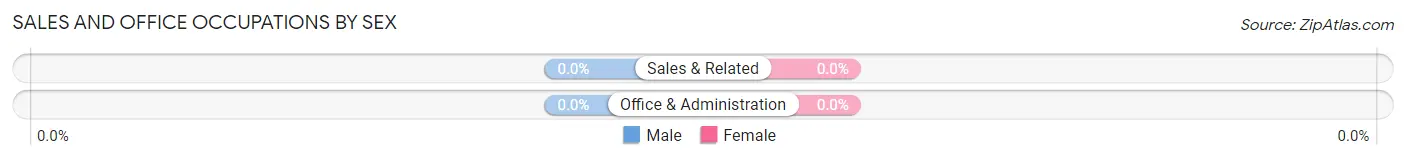
Sales and Office Occupations

Sales and Office Occupations by Sex
| Occupation | Male | Female |
| Sales & Related | 0 (0.0%) | 0 (0.0%) |
| Office & Administration | 0 (0.0%) | 0 (0.0%) |
| Total (Category) | 0 (0.0%) | 0 (0.0%) |
| Total (Overall) | 191 (65.0%) | 103 (35.0%) |
Natural Resources, Construction and Maintenance Occupations
The most common Natural Resources, Construction and Maintenance occupations in Sugar Grove are Farming, Fishing & Forestry (26 | 8.8%), Construction & Extraction (8 | 2.7%), and Installation, Maintenance & Repair (8 | 2.7%).

Natural Resources, Construction and Maintenance Occupations by Sex
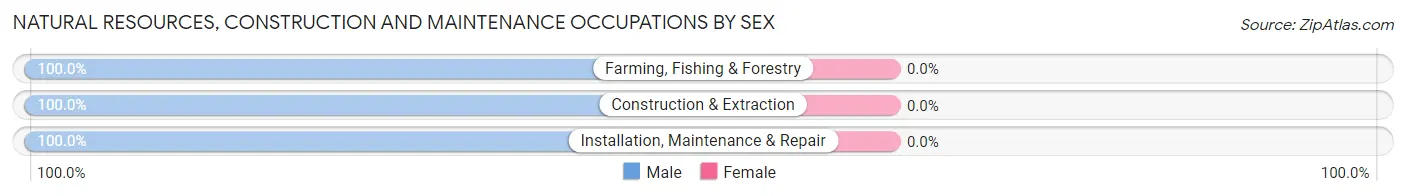
| Occupation | Male | Female |
| Farming, Fishing & Forestry | 26 (100.0%) | 0 (0.0%) |
| Construction & Extraction | 8 (100.0%) | 0 (0.0%) |
| Installation, Maintenance & Repair | 8 (100.0%) | 0 (0.0%) |
| Total (Category) | 42 (100.0%) | 0 (0.0%) |
| Total (Overall) | 191 (65.0%) | 103 (35.0%) |
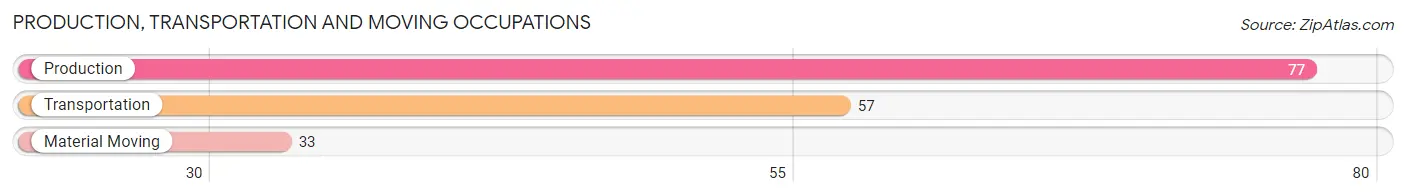
Production, Transportation and Moving Occupations
The most common Production, Transportation and Moving occupations in Sugar Grove are Production (77 | 26.2%), Transportation (57 | 19.4%), and Material Moving (33 | 11.2%).
Production, Transportation and Moving Occupations by Sex
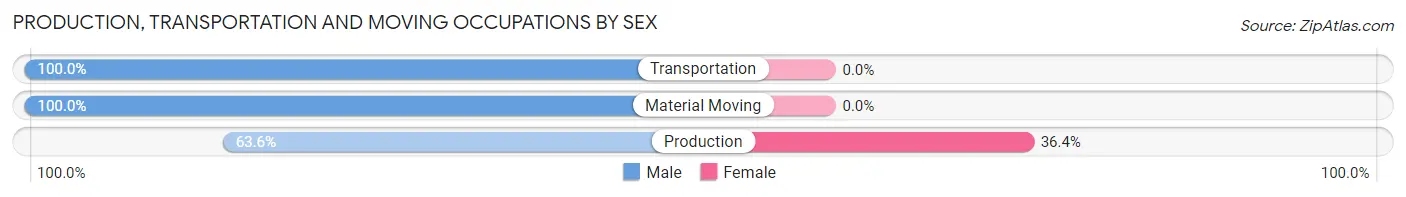
| Occupation | Male | Female |
| Production | 49 (63.6%) | 28 (36.4%) |
| Transportation | 57 (100.0%) | 0 (0.0%) |
| Material Moving | 33 (100.0%) | 0 (0.0%) |
| Total (Category) | 139 (83.2%) | 28 (16.8%) |
| Total (Overall) | 191 (65.0%) | 103 (35.0%) |
Employment Industries by Sex in Sugar Grove
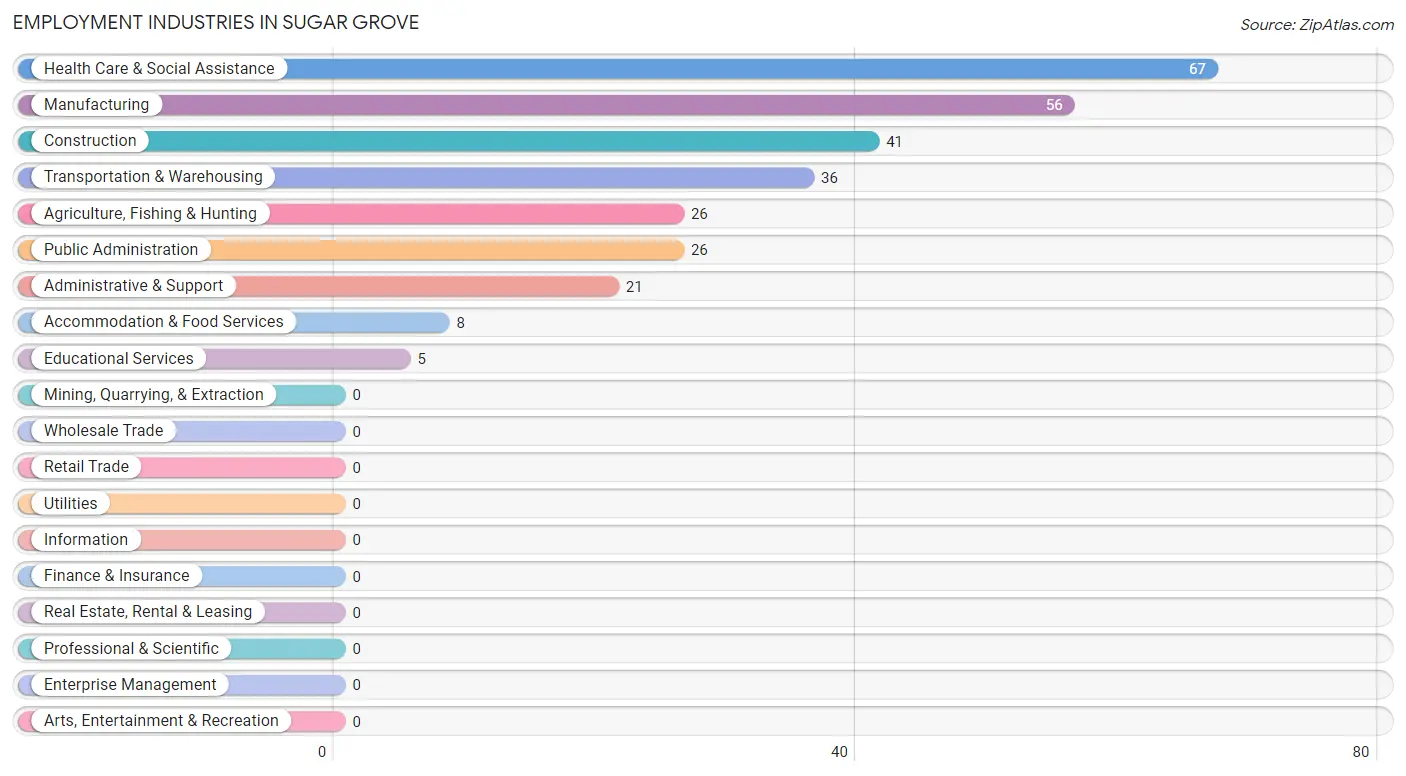
Employment Industries in Sugar Grove
The major employment industries in Sugar Grove include Health Care & Social Assistance (67 | 22.8%), Manufacturing (56 | 19.1%), Construction (41 | 14.0%), Transportation & Warehousing (36 | 12.2%), and Agriculture, Fishing & Hunting (26 | 8.8%).
Employment Industries by Sex in Sugar Grove
The Sugar Grove industries that see more men than women are Agriculture, Fishing & Hunting (100.0%), Construction (100.0%), and Transportation & Warehousing (100.0%), whereas the industries that tend to have a higher number of women are Educational Services (100.0%), Accommodation & Food Services (100.0%), and Public Administration (100.0%).
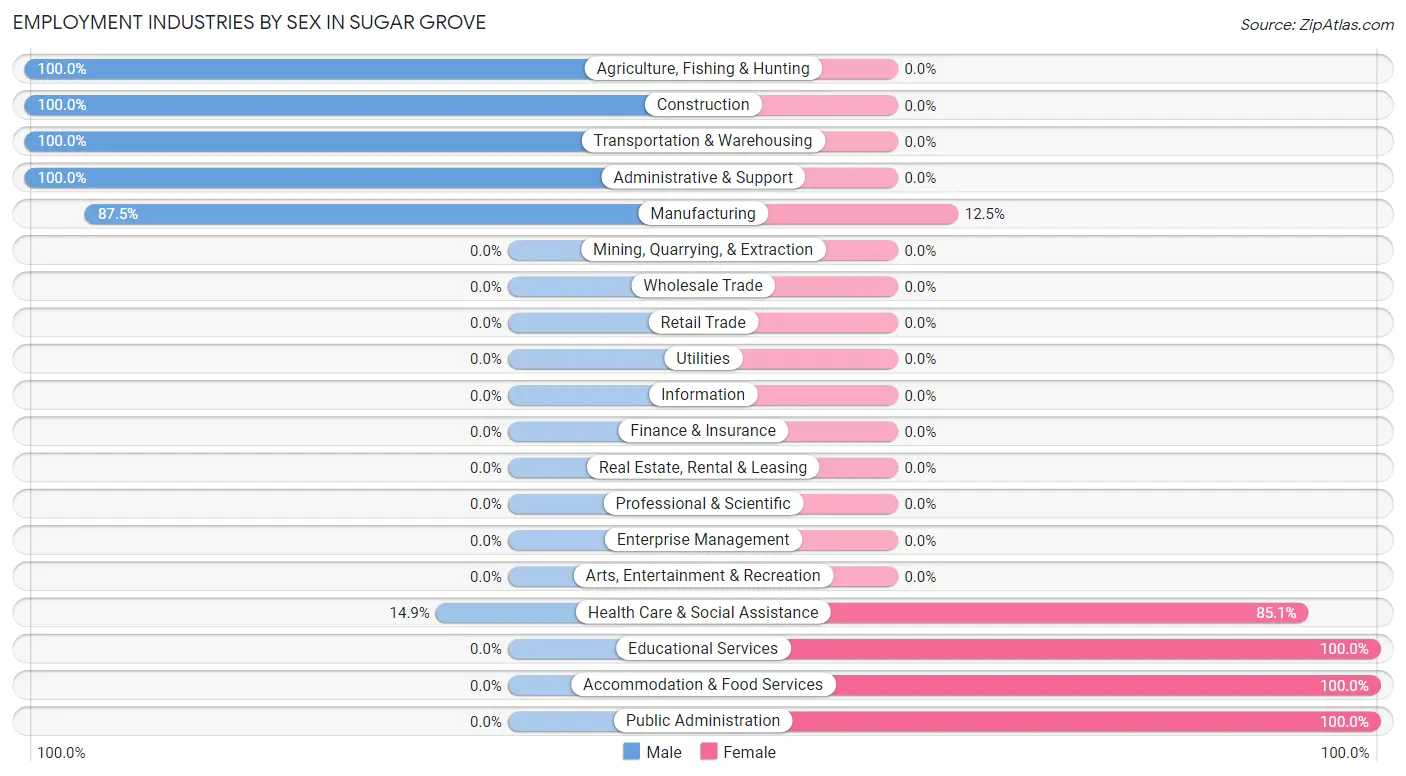
| Industry | Male | Female |
| Agriculture, Fishing & Hunting | 26 (100.0%) | 0 (0.0%) |
| Mining, Quarrying, & Extraction | 0 (0.0%) | 0 (0.0%) |
| Construction | 41 (100.0%) | 0 (0.0%) |
| Manufacturing | 49 (87.5%) | 7 (12.5%) |
| Wholesale Trade | 0 (0.0%) | 0 (0.0%) |
| Retail Trade | 0 (0.0%) | 0 (0.0%) |
| Transportation & Warehousing | 36 (100.0%) | 0 (0.0%) |
| Utilities | 0 (0.0%) | 0 (0.0%) |
| Information | 0 (0.0%) | 0 (0.0%) |
| Finance & Insurance | 0 (0.0%) | 0 (0.0%) |
| Real Estate, Rental & Leasing | 0 (0.0%) | 0 (0.0%) |
| Professional & Scientific | 0 (0.0%) | 0 (0.0%) |
| Enterprise Management | 0 (0.0%) | 0 (0.0%) |
| Administrative & Support | 21 (100.0%) | 0 (0.0%) |
| Educational Services | 0 (0.0%) | 5 (100.0%) |
| Health Care & Social Assistance | 10 (14.9%) | 57 (85.1%) |
| Arts, Entertainment & Recreation | 0 (0.0%) | 0 (0.0%) |
| Accommodation & Food Services | 0 (0.0%) | 8 (100.0%) |
| Public Administration | 0 (0.0%) | 26 (100.0%) |
| Total | 191 (65.0%) | 103 (35.0%) |
Education in Sugar Grove
School Enrollment in Sugar Grove
The most common levels of schooling among the 130 students in Sugar Grove are high school (48 | 36.9%), nursery / preschool (28 | 21.5%), and middle school (26 | 20.0%).
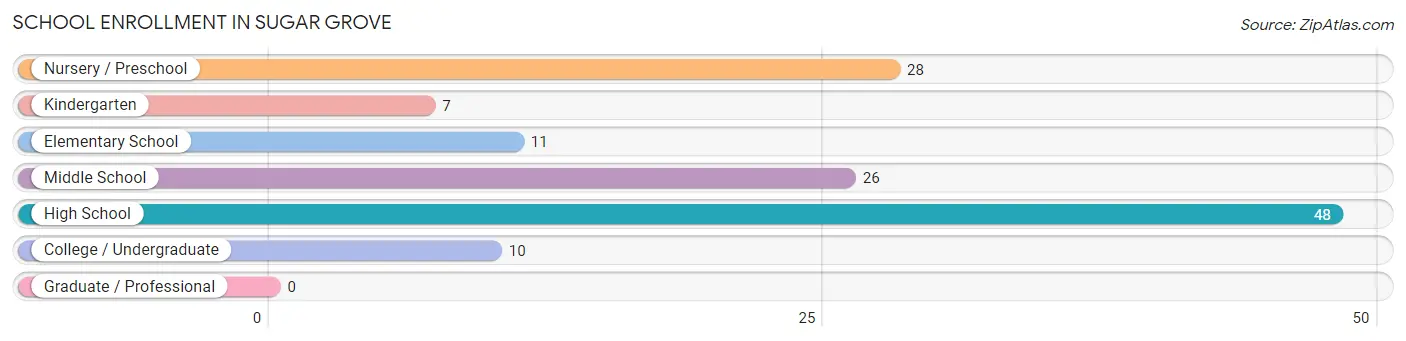
| School Level | # Students | % Students |
| Nursery / Preschool | 28 | 21.5% |
| Kindergarten | 7 | 5.4% |
| Elementary School | 11 | 8.5% |
| Middle School | 26 | 20.0% |
| High School | 48 | 36.9% |
| College / Undergraduate | 10 | 7.7% |
| Graduate / Professional | 0 | 0.0% |
| Total | 130 | 100.0% |
School Enrollment by Age by Funding Source in Sugar Grove
Out of a total of 130 students who are enrolled in schools in Sugar Grove, 17 (13.1%) attend a private institution, while the remaining 113 (86.9%) are enrolled in public schools. The age group of 35 years and over has the highest likelihood of being enrolled in private schools, with 10 (100.0% in the age bracket) enrolled. Conversely, the age group of 3 to 4 year olds has the lowest likelihood of being enrolled in a private school, with 7 (100.0% in the age bracket) attending a public institution.
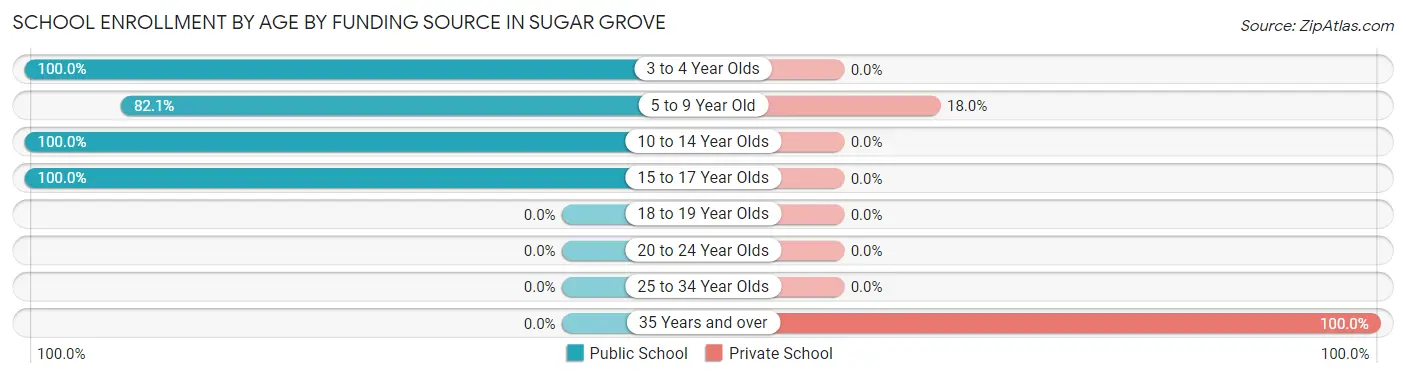
| Age Bracket | Public School | Private School |
| 3 to 4 Year Olds | 7 (100.0%) | 0 (0.0%) |
| 5 to 9 Year Old | 32 (82.1%) | 7 (17.9%) |
| 10 to 14 Year Olds | 26 (100.0%) | 0 (0.0%) |
| 15 to 17 Year Olds | 48 (100.0%) | 0 (0.0%) |
| 18 to 19 Year Olds | 0 (0.0%) | 0 (0.0%) |
| 20 to 24 Year Olds | 0 (0.0%) | 0 (0.0%) |
| 25 to 34 Year Olds | 0 (0.0%) | 0 (0.0%) |
| 35 Years and over | 0 (0.0%) | 10 (100.0%) |
| Total | 113 (86.9%) | 17 (13.1%) |
Educational Attainment by Field of Study in Sugar Grove
Science & technology (24 | 50.0%), and arts & humanities (24 | 50.0%) are the most common fields of study among 48 individuals in Sugar Grove who have obtained a bachelor's degree or higher.
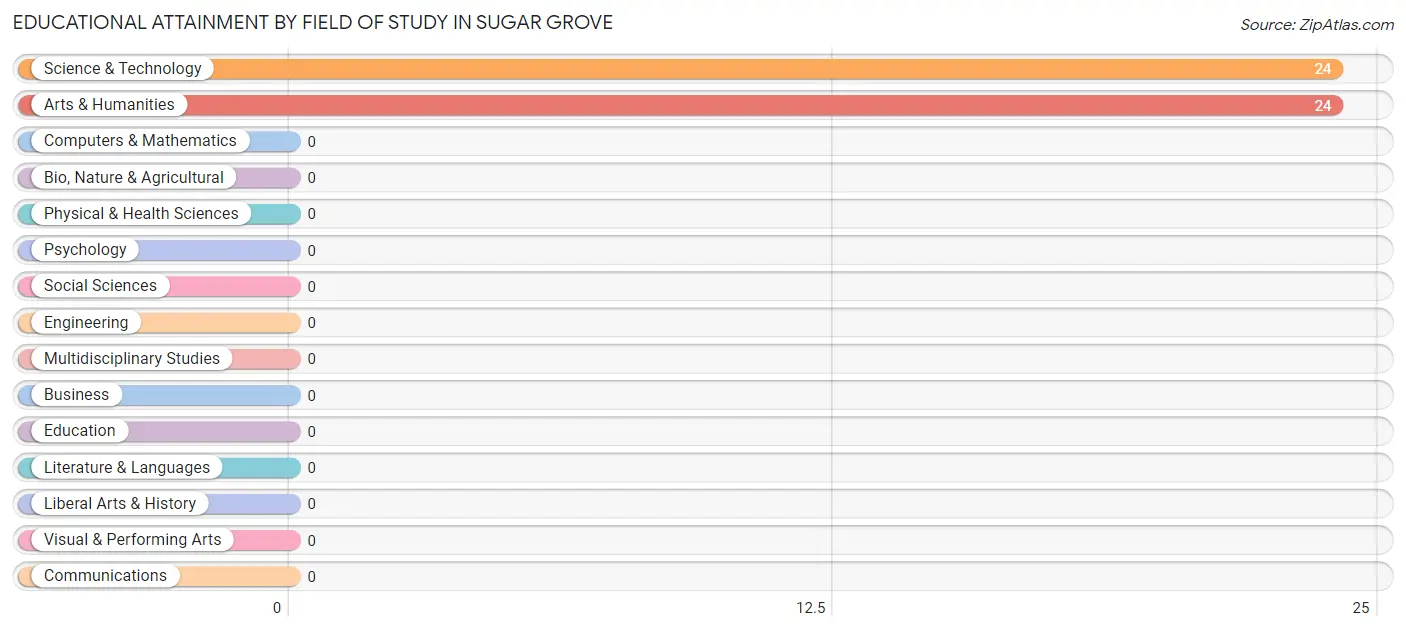
| Field of Study | # Graduates | % Graduates |
| Computers & Mathematics | 0 | 0.0% |
| Bio, Nature & Agricultural | 0 | 0.0% |
| Physical & Health Sciences | 0 | 0.0% |
| Psychology | 0 | 0.0% |
| Social Sciences | 0 | 0.0% |
| Engineering | 0 | 0.0% |
| Multidisciplinary Studies | 0 | 0.0% |
| Science & Technology | 24 | 50.0% |
| Business | 0 | 0.0% |
| Education | 0 | 0.0% |
| Literature & Languages | 0 | 0.0% |
| Liberal Arts & History | 0 | 0.0% |
| Visual & Performing Arts | 0 | 0.0% |
| Communications | 0 | 0.0% |
| Arts & Humanities | 24 | 50.0% |
| Total | 48 | 100.0% |
Transportation & Commute in Sugar Grove
Vehicle Availability by Sex in Sugar Grove
The most prevalent vehicle ownership categories in Sugar Grove are males with 5 or more vehicles (60, accounting for 31.4%) and females with 5 or more vehicles (50, making up 58.3%).
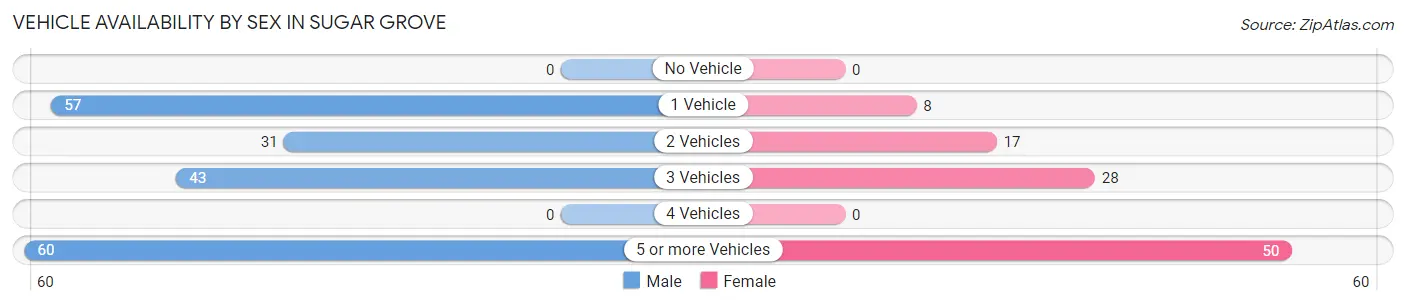
| Vehicles Available | Male | Female |
| No Vehicle | 0 (0.0%) | 0 (0.0%) |
| 1 Vehicle | 57 (29.8%) | 8 (7.8%) |
| 2 Vehicles | 31 (16.2%) | 17 (16.5%) |
| 3 Vehicles | 43 (22.5%) | 28 (27.2%) |
| 4 Vehicles | 0 (0.0%) | 0 (0.0%) |
| 5 or more Vehicles | 60 (31.4%) | 50 (48.5%) |
| Total | 191 (100.0%) | 103 (100.0%) |
Commute Time in Sugar Grove
The most frequently occuring commute durations in Sugar Grove are 40 to 44 minutes (45 commuters, 17.2%), 45 to 59 minutes (44 commuters, 16.9%), and 25 to 29 minutes (40 commuters, 15.3%).
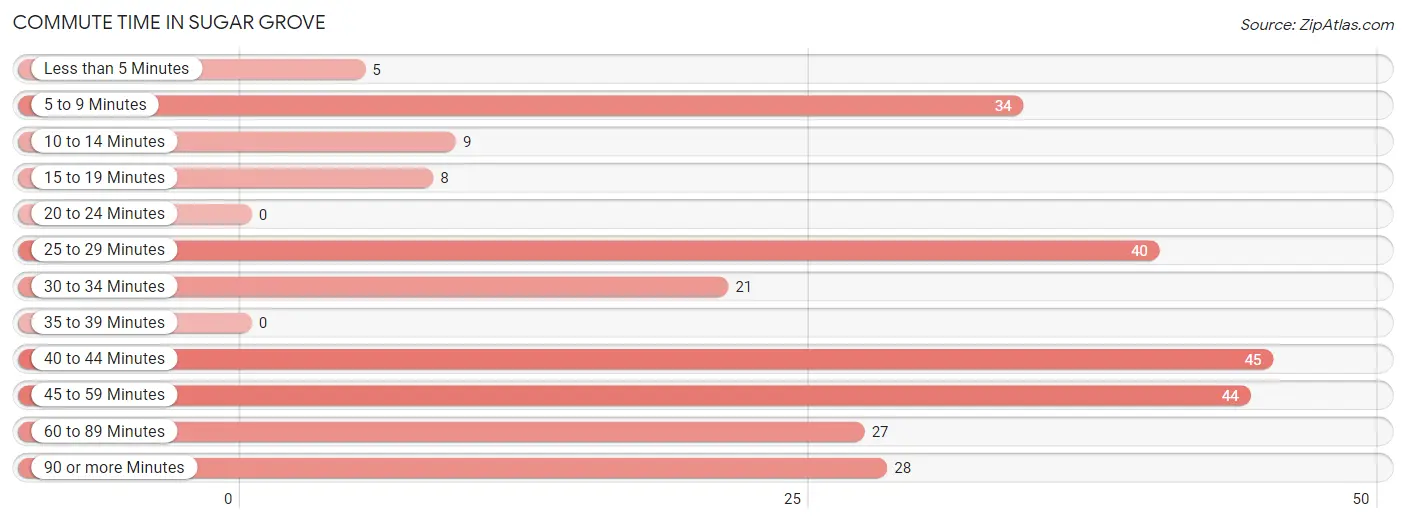
| Commute Time | # Commuters | % Commuters |
| Less than 5 Minutes | 5 | 1.9% |
| 5 to 9 Minutes | 34 | 13.0% |
| 10 to 14 Minutes | 9 | 3.5% |
| 15 to 19 Minutes | 8 | 3.1% |
| 20 to 24 Minutes | 0 | 0.0% |
| 25 to 29 Minutes | 40 | 15.3% |
| 30 to 34 Minutes | 21 | 8.1% |
| 35 to 39 Minutes | 0 | 0.0% |
| 40 to 44 Minutes | 45 | 17.2% |
| 45 to 59 Minutes | 44 | 16.9% |
| 60 to 89 Minutes | 27 | 10.3% |
| 90 or more Minutes | 28 | 10.7% |
Commute Time by Sex in Sugar Grove
The most common commute times in Sugar Grove are 45 to 59 minutes (39 commuters, 24.7%) for males and 25 to 29 minutes (31 commuters, 30.1%) for females.
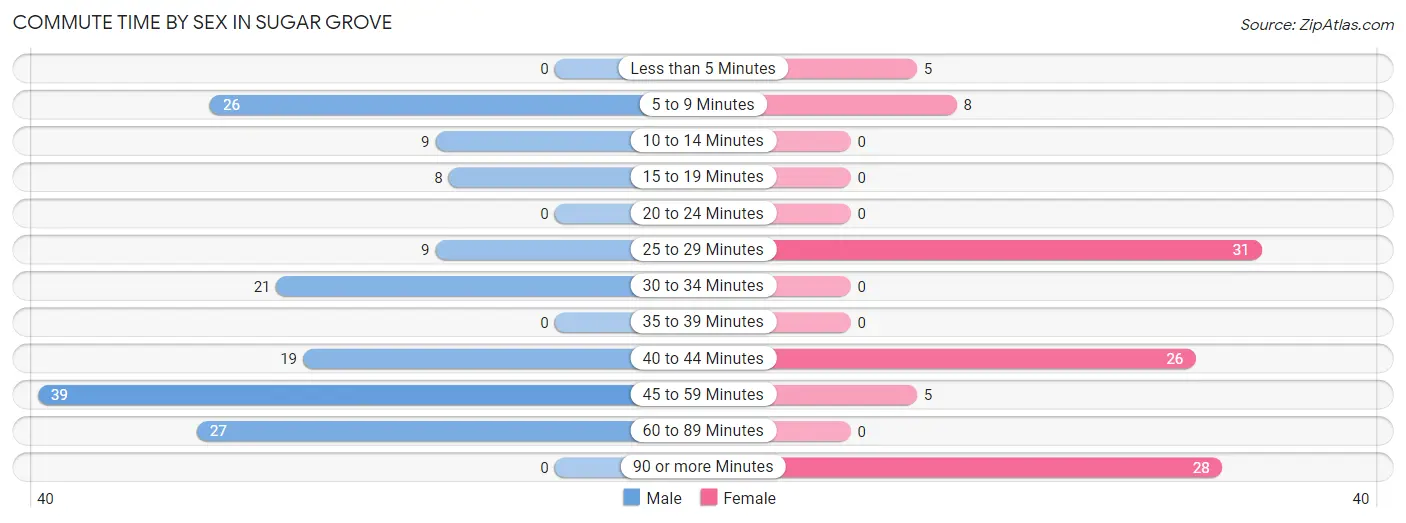
| Commute Time | Male | Female |
| Less than 5 Minutes | 0 (0.0%) | 5 (4.9%) |
| 5 to 9 Minutes | 26 (16.5%) | 8 (7.8%) |
| 10 to 14 Minutes | 9 (5.7%) | 0 (0.0%) |
| 15 to 19 Minutes | 8 (5.1%) | 0 (0.0%) |
| 20 to 24 Minutes | 0 (0.0%) | 0 (0.0%) |
| 25 to 29 Minutes | 9 (5.7%) | 31 (30.1%) |
| 30 to 34 Minutes | 21 (13.3%) | 0 (0.0%) |
| 35 to 39 Minutes | 0 (0.0%) | 0 (0.0%) |
| 40 to 44 Minutes | 19 (12.0%) | 26 (25.2%) |
| 45 to 59 Minutes | 39 (24.7%) | 5 (4.9%) |
| 60 to 89 Minutes | 27 (17.1%) | 0 (0.0%) |
| 90 or more Minutes | 0 (0.0%) | 28 (27.2%) |
Time of Departure to Work by Sex in Sugar Grove
The most frequent times of departure to work in Sugar Grove are 7:00 AM to 7:29 AM (64, 40.5%) for males and 7:00 AM to 7:29 AM (55, 53.4%) for females.
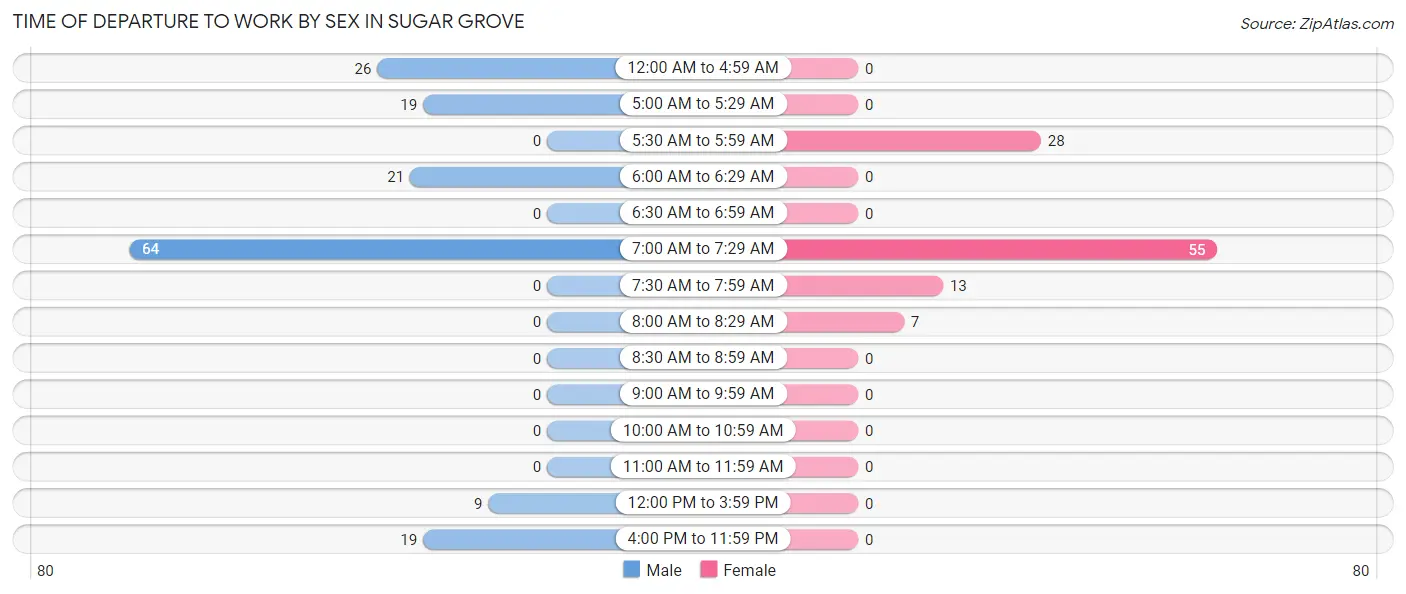
| Time of Departure | Male | Female |
| 12:00 AM to 4:59 AM | 26 (16.5%) | 0 (0.0%) |
| 5:00 AM to 5:29 AM | 19 (12.0%) | 0 (0.0%) |
| 5:30 AM to 5:59 AM | 0 (0.0%) | 28 (27.2%) |
| 6:00 AM to 6:29 AM | 21 (13.3%) | 0 (0.0%) |
| 6:30 AM to 6:59 AM | 0 (0.0%) | 0 (0.0%) |
| 7:00 AM to 7:29 AM | 64 (40.5%) | 55 (53.4%) |
| 7:30 AM to 7:59 AM | 0 (0.0%) | 13 (12.6%) |
| 8:00 AM to 8:29 AM | 0 (0.0%) | 7 (6.8%) |
| 8:30 AM to 8:59 AM | 0 (0.0%) | 0 (0.0%) |
| 9:00 AM to 9:59 AM | 0 (0.0%) | 0 (0.0%) |
| 10:00 AM to 10:59 AM | 0 (0.0%) | 0 (0.0%) |
| 11:00 AM to 11:59 AM | 0 (0.0%) | 0 (0.0%) |
| 12:00 PM to 3:59 PM | 9 (5.7%) | 0 (0.0%) |
| 4:00 PM to 11:59 PM | 19 (12.0%) | 0 (0.0%) |
| Total | 158 (100.0%) | 103 (100.0%) |
Housing Occupancy in Sugar Grove
Occupancy by Ownership in Sugar Grove
Of the total 319 dwellings in Sugar Grove, owner-occupied units account for 241 (75.5%), while renter-occupied units make up 78 (24.4%).
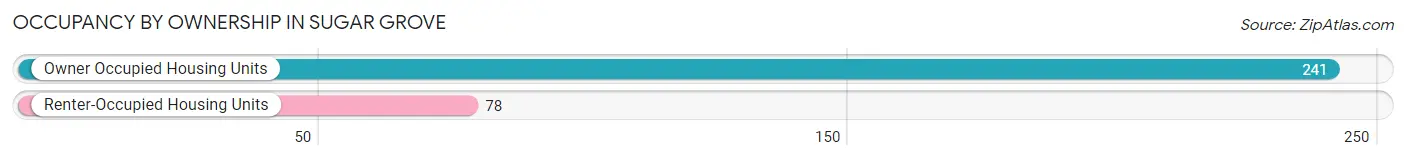
| Occupancy | # Housing Units | % Housing Units |
| Owner Occupied Housing Units | 241 | 75.5% |
| Renter-Occupied Housing Units | 78 | 24.4% |
| Total Occupied Housing Units | 319 | 100.0% |
Occupancy by Household Size in Sugar Grove
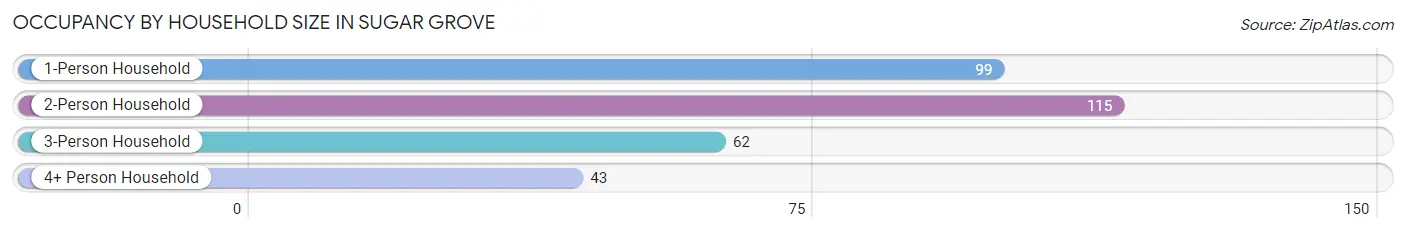
| Household Size | # Housing Units | % Housing Units |
| 1-Person Household | 99 | 31.0% |
| 2-Person Household | 115 | 36.0% |
| 3-Person Household | 62 | 19.4% |
| 4+ Person Household | 43 | 13.5% |
| Total Housing Units | 319 | 100.0% |
Occupancy by Ownership by Household Size in Sugar Grove
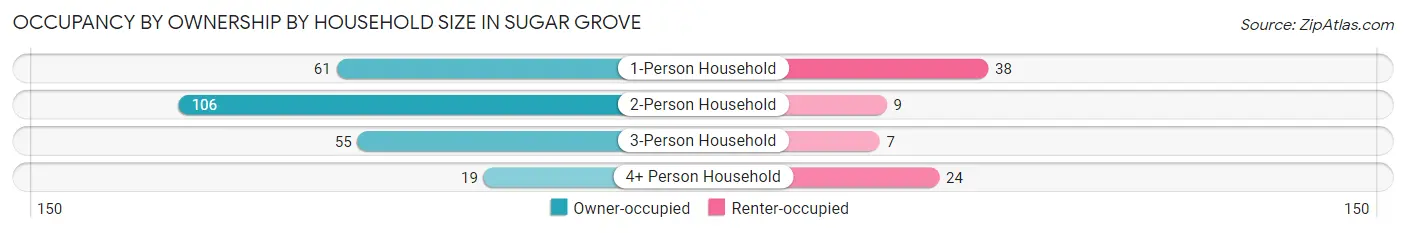
| Household Size | Owner-occupied | Renter-occupied |
| 1-Person Household | 61 (61.6%) | 38 (38.4%) |
| 2-Person Household | 106 (92.2%) | 9 (7.8%) |
| 3-Person Household | 55 (88.7%) | 7 (11.3%) |
| 4+ Person Household | 19 (44.2%) | 24 (55.8%) |
| Total Housing Units | 241 (75.5%) | 78 (24.4%) |
Occupancy by Educational Attainment in Sugar Grove
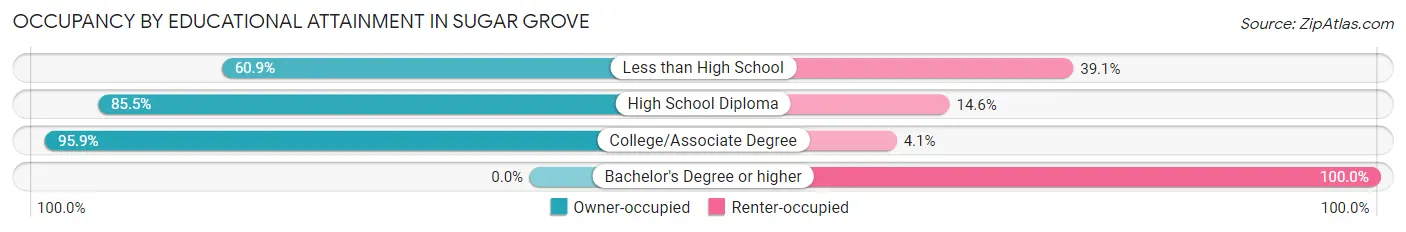
| Household Size | Owner-occupied | Renter-occupied |
| Less than High School | 53 (60.9%) | 34 (39.1%) |
| High School Diploma | 94 (85.5%) | 16 (14.5%) |
| College/Associate Degree | 94 (95.9%) | 4 (4.1%) |
| Bachelor's Degree or higher | 0 (0.0%) | 24 (100.0%) |
Occupancy by Age of Householder in Sugar Grove
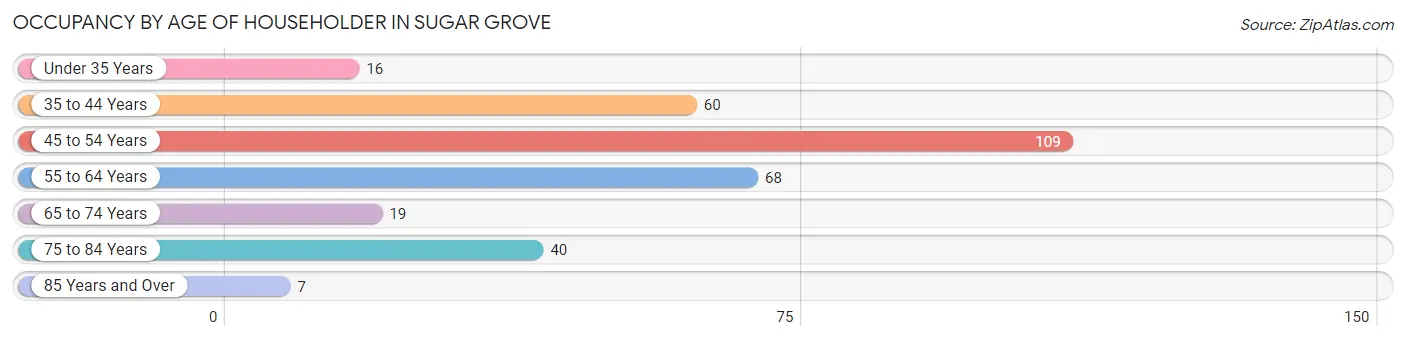
| Age Bracket | # Households | % Households |
| Under 35 Years | 16 | 5.0% |
| 35 to 44 Years | 60 | 18.8% |
| 45 to 54 Years | 109 | 34.2% |
| 55 to 64 Years | 68 | 21.3% |
| 65 to 74 Years | 19 | 6.0% |
| 75 to 84 Years | 40 | 12.5% |
| 85 Years and Over | 7 | 2.2% |
| Total | 319 | 100.0% |
Housing Finances in Sugar Grove
Median Income by Occupancy in Sugar Grove
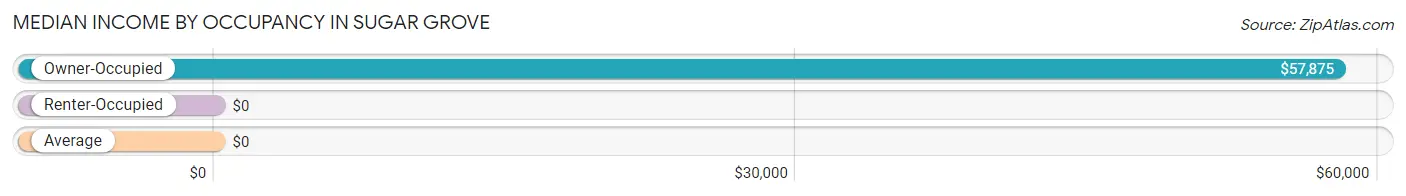
| Occupancy Type | # Households | Median Income |
| Owner-Occupied | 241 (75.5%) | $57,875 |
| Renter-Occupied | 78 (24.4%) | $0 |
| Average | 319 (100.0%) | $0 |
Occupancy by Householder Income Bracket in Sugar Grove
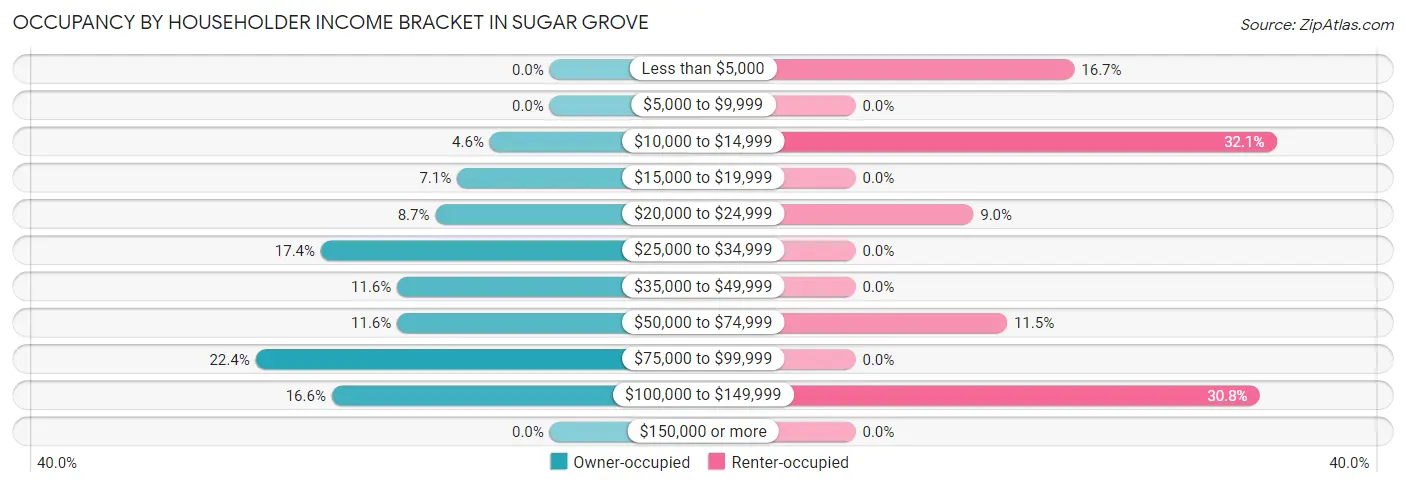
| Income Bracket | Owner-occupied | Renter-occupied |
| Less than $5,000 | 0 (0.0%) | 13 (16.7%) |
| $5,000 to $9,999 | 0 (0.0%) | 0 (0.0%) |
| $10,000 to $14,999 | 11 (4.6%) | 25 (32.1%) |
| $15,000 to $19,999 | 17 (7.0%) | 0 (0.0%) |
| $20,000 to $24,999 | 21 (8.7%) | 7 (9.0%) |
| $25,000 to $34,999 | 42 (17.4%) | 0 (0.0%) |
| $35,000 to $49,999 | 28 (11.6%) | 0 (0.0%) |
| $50,000 to $74,999 | 28 (11.6%) | 9 (11.5%) |
| $75,000 to $99,999 | 54 (22.4%) | 0 (0.0%) |
| $100,000 to $149,999 | 40 (16.6%) | 24 (30.8%) |
| $150,000 or more | 0 (0.0%) | 0 (0.0%) |
| Total | 241 (100.0%) | 78 (100.0%) |
Monthly Housing Cost Tiers in Sugar Grove
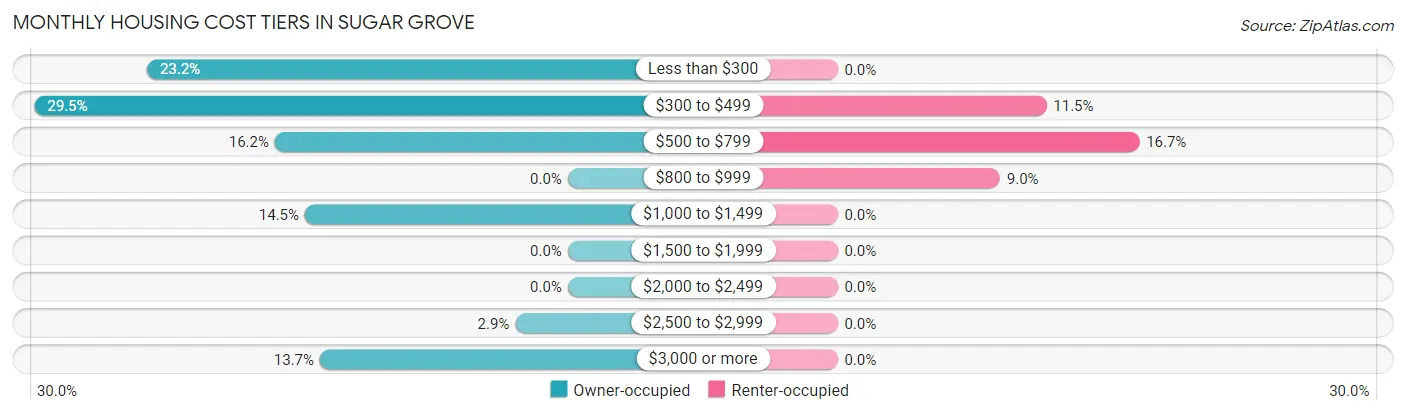
| Monthly Cost | Owner-occupied | Renter-occupied |
| Less than $300 | 56 (23.2%) | 0 (0.0%) |
| $300 to $499 | 71 (29.5%) | 9 (11.5%) |
| $500 to $799 | 39 (16.2%) | 13 (16.7%) |
| $800 to $999 | 0 (0.0%) | 7 (9.0%) |
| $1,000 to $1,499 | 35 (14.5%) | 0 (0.0%) |
| $1,500 to $1,999 | 0 (0.0%) | 0 (0.0%) |
| $2,000 to $2,499 | 0 (0.0%) | 0 (0.0%) |
| $2,500 to $2,999 | 7 (2.9%) | 0 (0.0%) |
| $3,000 or more | 33 (13.7%) | 0 (0.0%) |
| Total | 241 (100.0%) | 78 (100.0%) |
Physical Housing Characteristics in Sugar Grove
Housing Structures in Sugar Grove
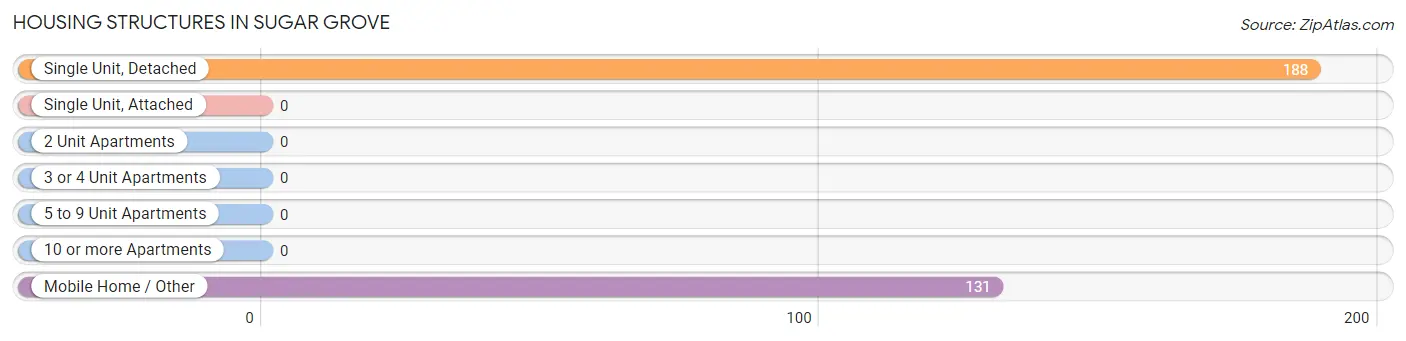
| Structure Type | # Housing Units | % Housing Units |
| Single Unit, Detached | 188 | 58.9% |
| Single Unit, Attached | 0 | 0.0% |
| 2 Unit Apartments | 0 | 0.0% |
| 3 or 4 Unit Apartments | 0 | 0.0% |
| 5 to 9 Unit Apartments | 0 | 0.0% |
| 10 or more Apartments | 0 | 0.0% |
| Mobile Home / Other | 131 | 41.1% |
| Total | 319 | 100.0% |
Housing Structures by Occupancy in Sugar Grove
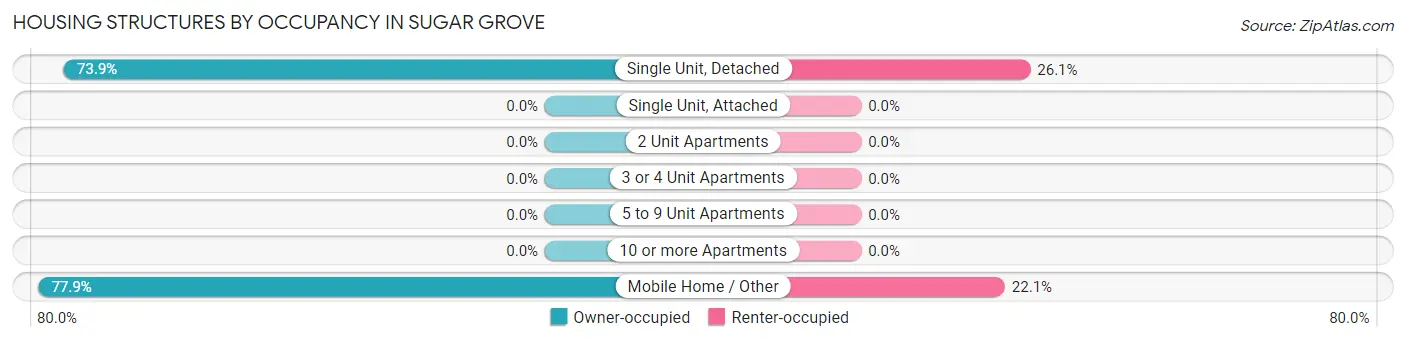
| Structure Type | Owner-occupied | Renter-occupied |
| Single Unit, Detached | 139 (73.9%) | 49 (26.1%) |
| Single Unit, Attached | 0 (0.0%) | 0 (0.0%) |
| 2 Unit Apartments | 0 (0.0%) | 0 (0.0%) |
| 3 or 4 Unit Apartments | 0 (0.0%) | 0 (0.0%) |
| 5 to 9 Unit Apartments | 0 (0.0%) | 0 (0.0%) |
| 10 or more Apartments | 0 (0.0%) | 0 (0.0%) |
| Mobile Home / Other | 102 (77.9%) | 29 (22.1%) |
| Total | 241 (75.5%) | 78 (24.4%) |
Housing Structures by Number of Rooms in Sugar Grove
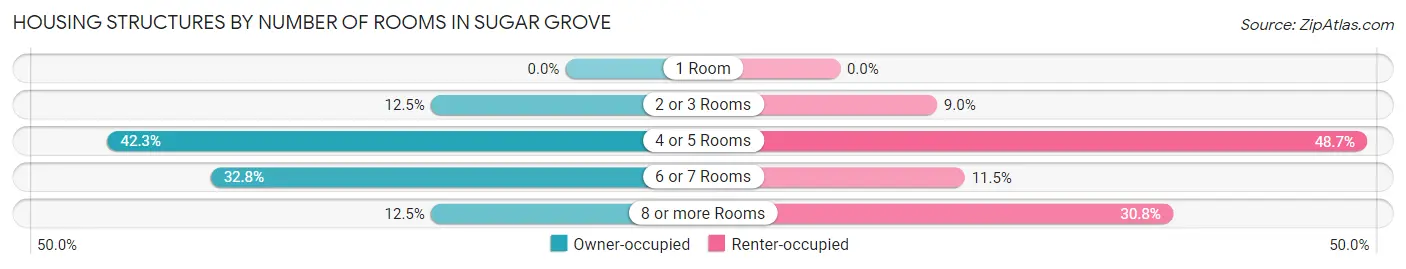
| Number of Rooms | Owner-occupied | Renter-occupied |
| 1 Room | 0 (0.0%) | 0 (0.0%) |
| 2 or 3 Rooms | 30 (12.4%) | 7 (9.0%) |
| 4 or 5 Rooms | 102 (42.3%) | 38 (48.7%) |
| 6 or 7 Rooms | 79 (32.8%) | 9 (11.5%) |
| 8 or more Rooms | 30 (12.4%) | 24 (30.8%) |
| Total | 241 (100.0%) | 78 (100.0%) |
Housing Structure by Heating Type in Sugar Grove
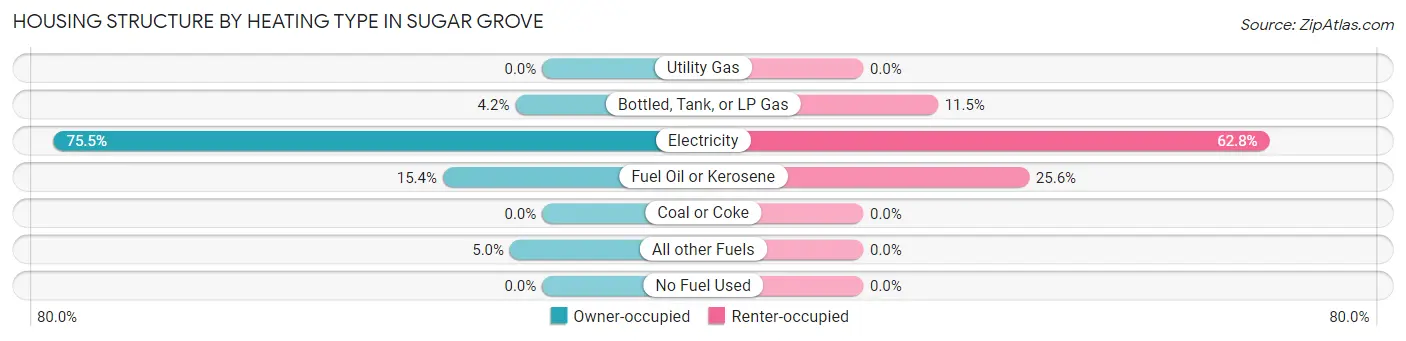
| Heating Type | Owner-occupied | Renter-occupied |
| Utility Gas | 0 (0.0%) | 0 (0.0%) |
| Bottled, Tank, or LP Gas | 10 (4.2%) | 9 (11.5%) |
| Electricity | 182 (75.5%) | 49 (62.8%) |
| Fuel Oil or Kerosene | 37 (15.3%) | 20 (25.6%) |
| Coal or Coke | 0 (0.0%) | 0 (0.0%) |
| All other Fuels | 12 (5.0%) | 0 (0.0%) |
| No Fuel Used | 0 (0.0%) | 0 (0.0%) |
| Total | 241 (100.0%) | 78 (100.0%) |
Household Vehicle Usage in Sugar Grove
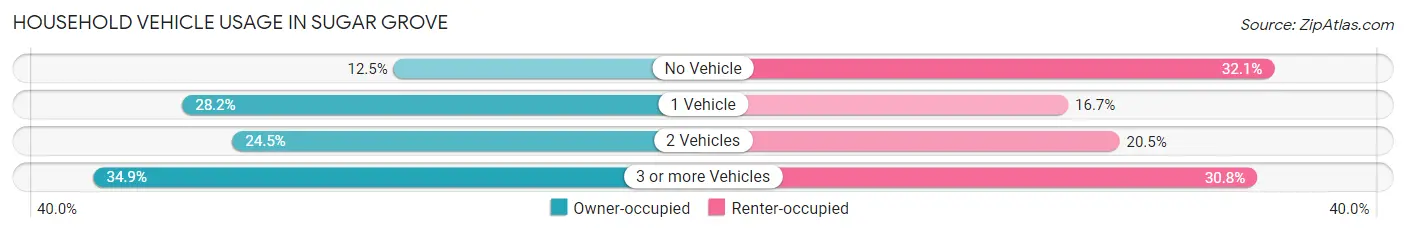
| Vehicles per Household | Owner-occupied | Renter-occupied |
| No Vehicle | 30 (12.4%) | 25 (32.1%) |
| 1 Vehicle | 68 (28.2%) | 13 (16.7%) |
| 2 Vehicles | 59 (24.5%) | 16 (20.5%) |
| 3 or more Vehicles | 84 (34.8%) | 24 (30.8%) |
| Total | 241 (100.0%) | 78 (100.0%) |
Real Estate & Mortgages in Sugar Grove
Real Estate and Mortgage Overview in Sugar Grove
| Characteristic | Without Mortgage | With Mortgage |
| Housing Units | 76 | 165 |
| Median Property Value | - | - |
| Median Household Income | $58,500 | $0 |
| Monthly Housing Costs | $197 | $33 |
| Real Estate Taxes | $397 | $5 |
Property Value by Mortgage Status in Sugar Grove
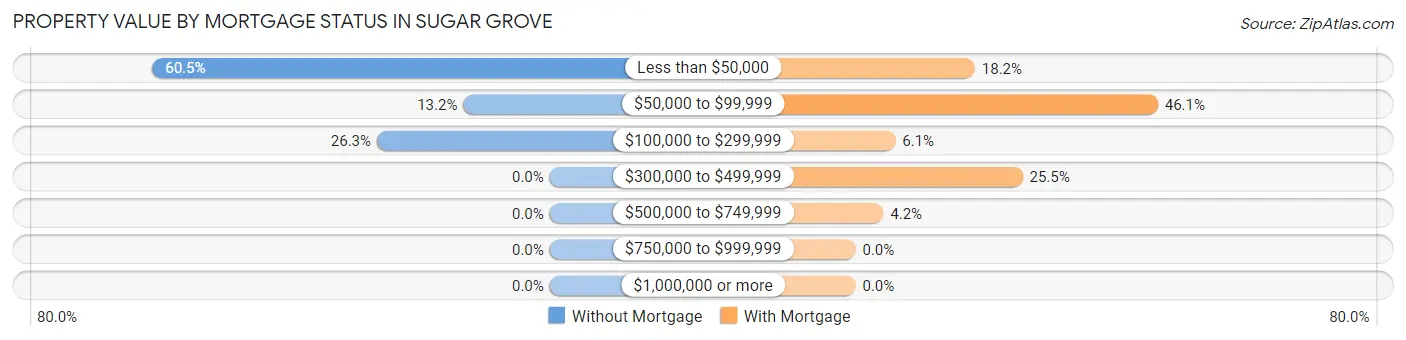
| Property Value | Without Mortgage | With Mortgage |
| Less than $50,000 | 46 (60.5%) | 30 (18.2%) |
| $50,000 to $99,999 | 10 (13.2%) | 76 (46.1%) |
| $100,000 to $299,999 | 20 (26.3%) | 10 (6.1%) |
| $300,000 to $499,999 | 0 (0.0%) | 42 (25.5%) |
| $500,000 to $749,999 | 0 (0.0%) | 7 (4.2%) |
| $750,000 to $999,999 | 0 (0.0%) | 0 (0.0%) |
| $1,000,000 or more | 0 (0.0%) | 0 (0.0%) |
| Total | 76 (100.0%) | 165 (100.0%) |
Household Income by Mortgage Status in Sugar Grove
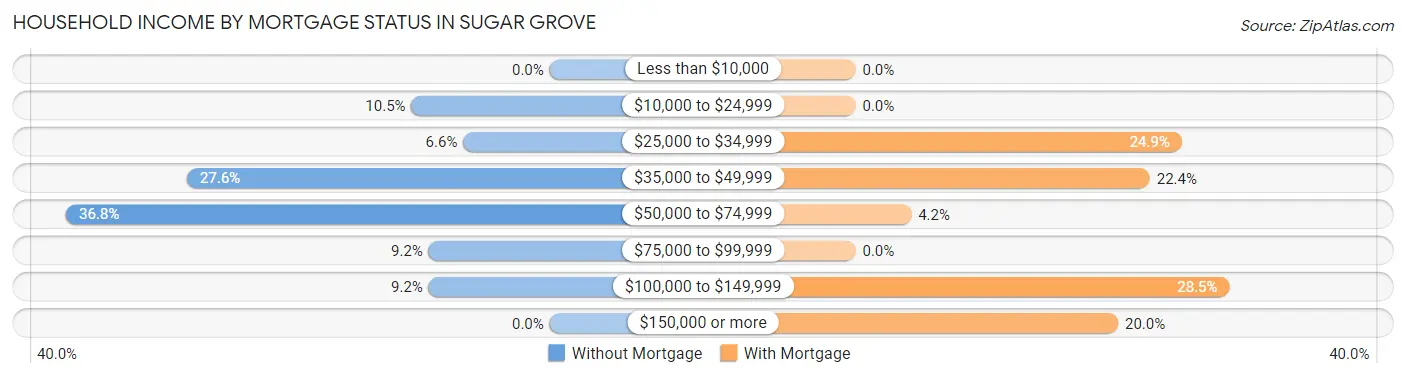
| Household Income | Without Mortgage | With Mortgage |
| Less than $10,000 | 0 (0.0%) | 0 (0.0%) |
| $10,000 to $24,999 | 8 (10.5%) | 0 (0.0%) |
| $25,000 to $34,999 | 5 (6.6%) | 41 (24.8%) |
| $35,000 to $49,999 | 21 (27.6%) | 37 (22.4%) |
| $50,000 to $74,999 | 28 (36.8%) | 7 (4.2%) |
| $75,000 to $99,999 | 7 (9.2%) | 0 (0.0%) |
| $100,000 to $149,999 | 7 (9.2%) | 47 (28.5%) |
| $150,000 or more | 0 (0.0%) | 33 (20.0%) |
| Total | 76 (100.0%) | 165 (100.0%) |
Property Value to Household Income Ratio in Sugar Grove
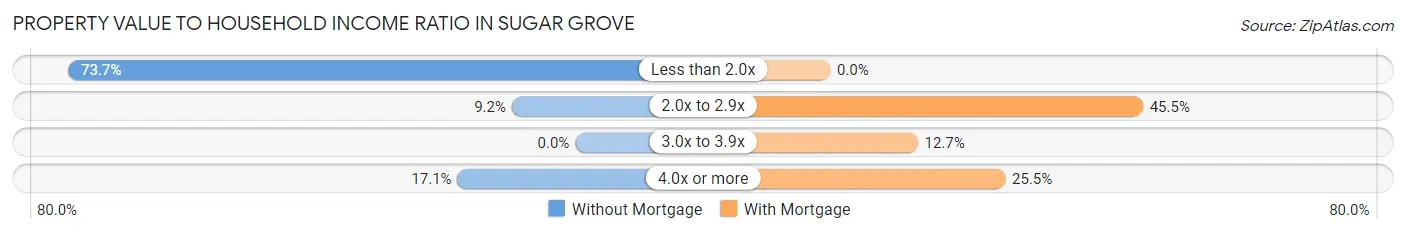
| Value-to-Income Ratio | Without Mortgage | With Mortgage |
| Less than 2.0x | 56 (73.7%) | 0 (0.0%) |
| 2.0x to 2.9x | 7 (9.2%) | 75 (45.5%) |
| 3.0x to 3.9x | 0 (0.0%) | 21 (12.7%) |
| 4.0x or more | 13 (17.1%) | 42 (25.5%) |
| Total | 76 (100.0%) | 165 (100.0%) |
Real Estate Taxes by Mortgage Status in Sugar Grove
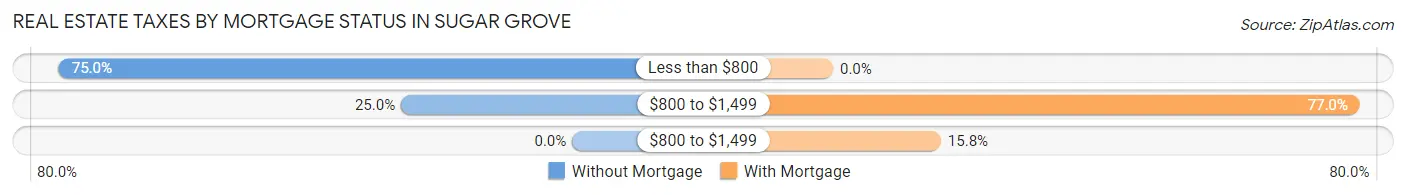
| Property Taxes | Without Mortgage | With Mortgage |
| Less than $800 | 57 (75.0%) | 0 (0.0%) |
| $800 to $1,499 | 19 (25.0%) | 127 (77.0%) |
| $800 to $1,499 | 0 (0.0%) | 26 (15.8%) |
| Total | 76 (100.0%) | 165 (100.0%) |
Health & Disability in Sugar Grove
Health Insurance Coverage by Age in Sugar Grove
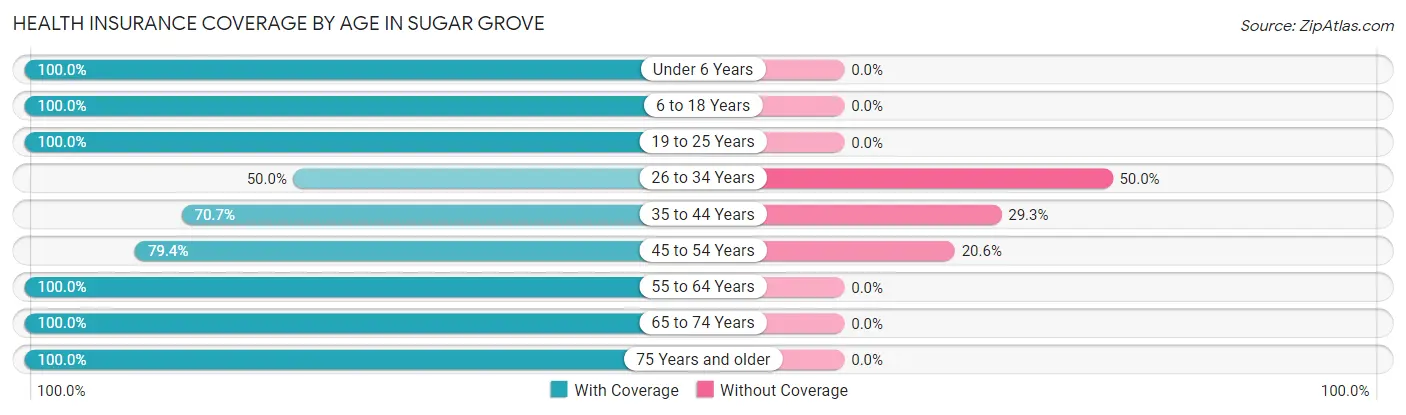
| Age Bracket | With Coverage | Without Coverage |
| Under 6 Years | 63 (100.0%) | 0 (0.0%) |
| 6 to 18 Years | 136 (100.0%) | 0 (0.0%) |
| 19 to 25 Years | 36 (100.0%) | 0 (0.0%) |
| 26 to 34 Years | 15 (50.0%) | 15 (50.0%) |
| 35 to 44 Years | 87 (70.7%) | 36 (29.3%) |
| 45 to 54 Years | 108 (79.4%) | 28 (20.6%) |
| 55 to 64 Years | 120 (100.0%) | 0 (0.0%) |
| 65 to 74 Years | 32 (100.0%) | 0 (0.0%) |
| 75 Years and older | 47 (100.0%) | 0 (0.0%) |
| Total | 644 (89.1%) | 79 (10.9%) |
Health Insurance Coverage by Citizenship Status in Sugar Grove

| Citizenship Status | With Coverage | Without Coverage |
| Native Born | 63 (100.0%) | 0 (0.0%) |
| Foreign Born, Citizen | 136 (100.0%) | 0 (0.0%) |
| Foreign Born, not a Citizen | 36 (100.0%) | 0 (0.0%) |
Health Insurance Coverage by Household Income in Sugar Grove
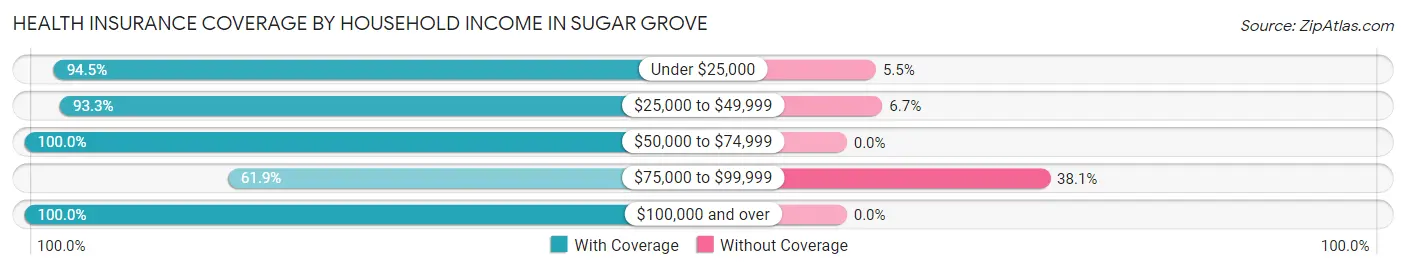
| Household Income | With Coverage | Without Coverage |
| Under $25,000 | 121 (94.5%) | 7 (5.5%) |
| $25,000 to $49,999 | 112 (93.3%) | 8 (6.7%) |
| $50,000 to $74,999 | 90 (100.0%) | 0 (0.0%) |
| $75,000 to $99,999 | 104 (61.9%) | 64 (38.1%) |
| $100,000 and over | 217 (100.0%) | 0 (0.0%) |
Public vs Private Health Insurance Coverage by Age in Sugar Grove
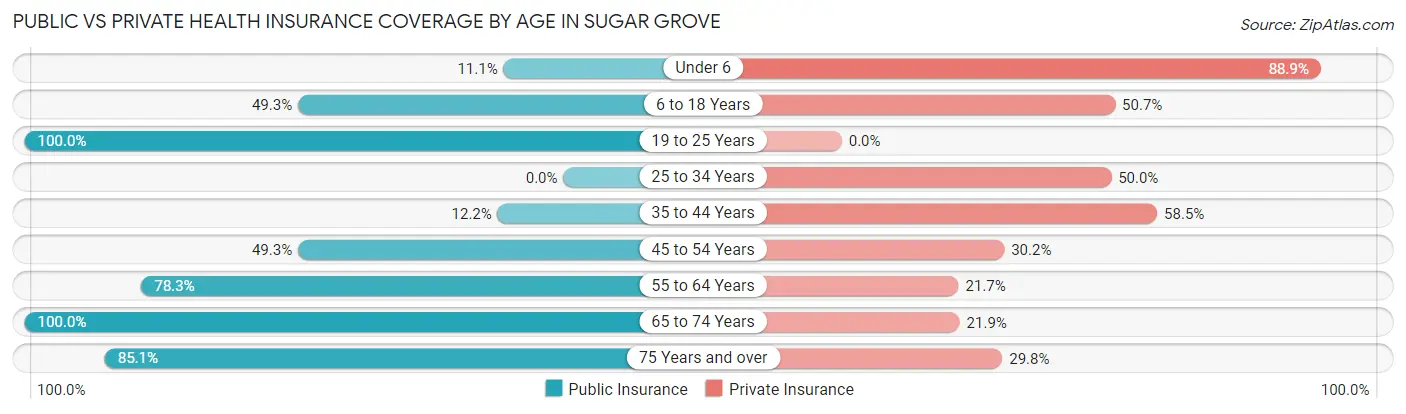
| Age Bracket | Public Insurance | Private Insurance |
| Under 6 | 7 (11.1%) | 56 (88.9%) |
| 6 to 18 Years | 67 (49.3%) | 69 (50.7%) |
| 19 to 25 Years | 36 (100.0%) | 0 (0.0%) |
| 25 to 34 Years | 0 (0.0%) | 15 (50.0%) |
| 35 to 44 Years | 15 (12.2%) | 72 (58.5%) |
| 45 to 54 Years | 67 (49.3%) | 41 (30.1%) |
| 55 to 64 Years | 94 (78.3%) | 26 (21.7%) |
| 65 to 74 Years | 32 (100.0%) | 7 (21.9%) |
| 75 Years and over | 40 (85.1%) | 14 (29.8%) |
| Total | 358 (49.5%) | 300 (41.5%) |
Disability Status by Sex by Age in Sugar Grove
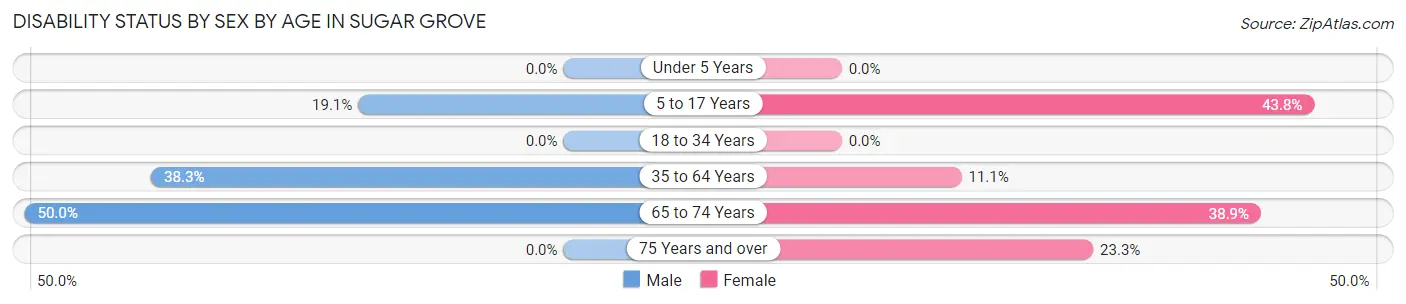
| Age Bracket | Male | Female |
| Under 5 Years | 0 (0.0%) | 0 (0.0%) |
| 5 to 17 Years | 16 (19.1%) | 32 (43.8%) |
| 18 to 34 Years | 0 (0.0%) | 0 (0.0%) |
| 35 to 64 Years | 83 (38.3%) | 18 (11.1%) |
| 65 to 74 Years | 7 (50.0%) | 7 (38.9%) |
| 75 Years and over | 0 (0.0%) | 7 (23.3%) |
Disability Class by Sex by Age in Sugar Grove
Disability Class: Hearing Difficulty
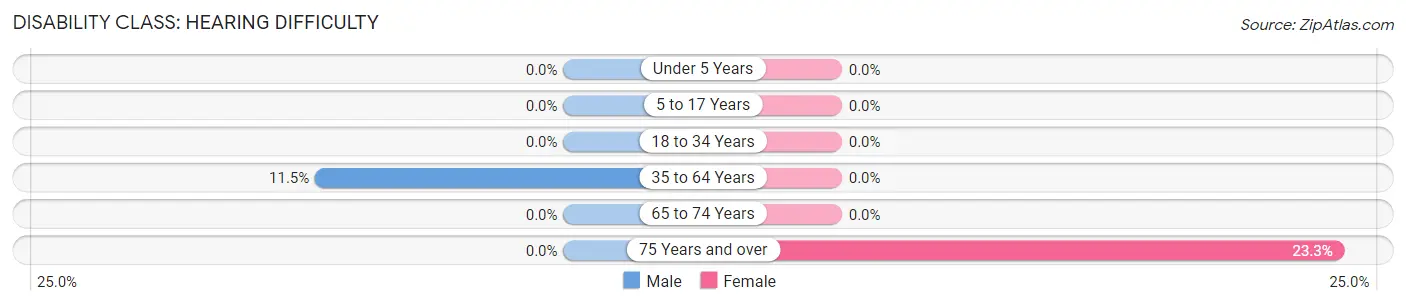
| Age Bracket | Male | Female |
| Under 5 Years | 0 (0.0%) | 0 (0.0%) |
| 5 to 17 Years | 0 (0.0%) | 0 (0.0%) |
| 18 to 34 Years | 0 (0.0%) | 0 (0.0%) |
| 35 to 64 Years | 25 (11.5%) | 0 (0.0%) |
| 65 to 74 Years | 0 (0.0%) | 0 (0.0%) |
| 75 Years and over | 0 (0.0%) | 7 (23.3%) |
Disability Class: Vision Difficulty
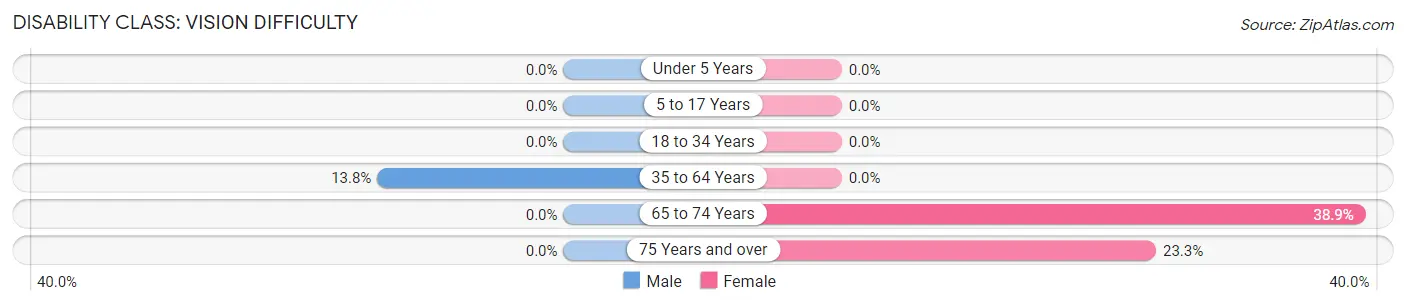
| Age Bracket | Male | Female |
| Under 5 Years | 0 (0.0%) | 0 (0.0%) |
| 5 to 17 Years | 0 (0.0%) | 0 (0.0%) |
| 18 to 34 Years | 0 (0.0%) | 0 (0.0%) |
| 35 to 64 Years | 30 (13.8%) | 0 (0.0%) |
| 65 to 74 Years | 0 (0.0%) | 7 (38.9%) |
| 75 Years and over | 0 (0.0%) | 7 (23.3%) |
Disability Class: Cognitive Difficulty
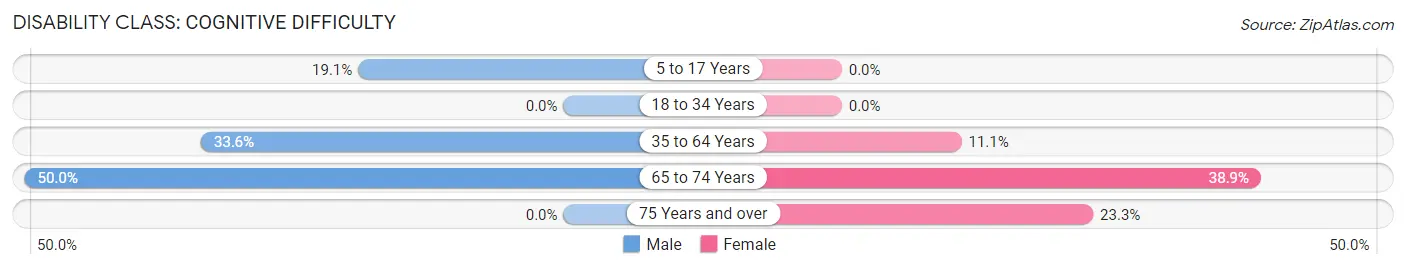
| Age Bracket | Male | Female |
| 5 to 17 Years | 16 (19.1%) | 0 (0.0%) |
| 18 to 34 Years | 0 (0.0%) | 0 (0.0%) |
| 35 to 64 Years | 73 (33.6%) | 18 (11.1%) |
| 65 to 74 Years | 7 (50.0%) | 7 (38.9%) |
| 75 Years and over | 0 (0.0%) | 7 (23.3%) |
Disability Class: Ambulatory Difficulty
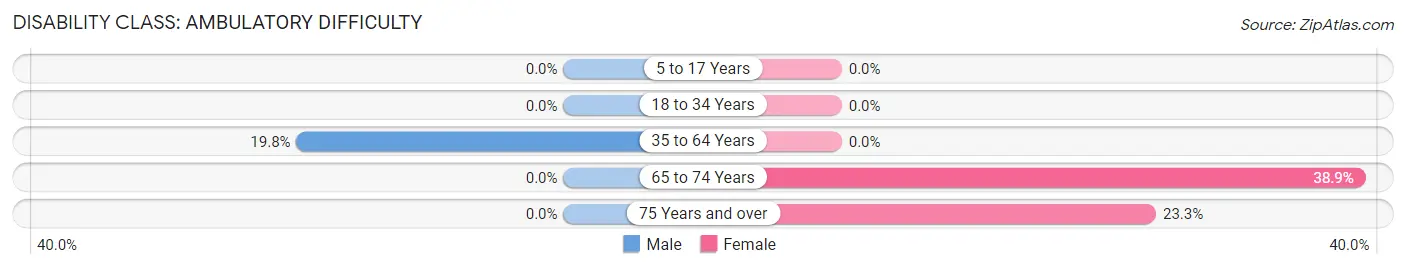
| Age Bracket | Male | Female |
| 5 to 17 Years | 0 (0.0%) | 0 (0.0%) |
| 18 to 34 Years | 0 (0.0%) | 0 (0.0%) |
| 35 to 64 Years | 43 (19.8%) | 0 (0.0%) |
| 65 to 74 Years | 0 (0.0%) | 7 (38.9%) |
| 75 Years and over | 0 (0.0%) | 7 (23.3%) |
Disability Class: Self-Care Difficulty
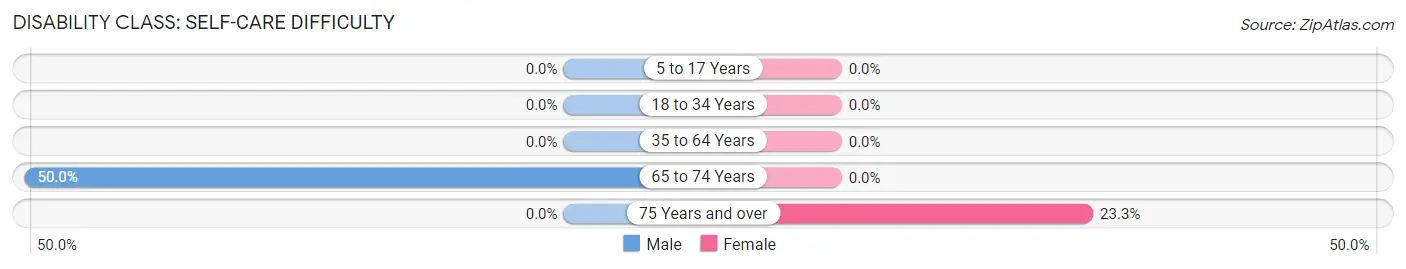
| Age Bracket | Male | Female |
| 5 to 17 Years | 0 (0.0%) | 0 (0.0%) |
| 18 to 34 Years | 0 (0.0%) | 0 (0.0%) |
| 35 to 64 Years | 0 (0.0%) | 0 (0.0%) |
| 65 to 74 Years | 7 (50.0%) | 0 (0.0%) |
| 75 Years and over | 0 (0.0%) | 7 (23.3%) |
Technology Access in Sugar Grove
Computing Device Access in Sugar Grove
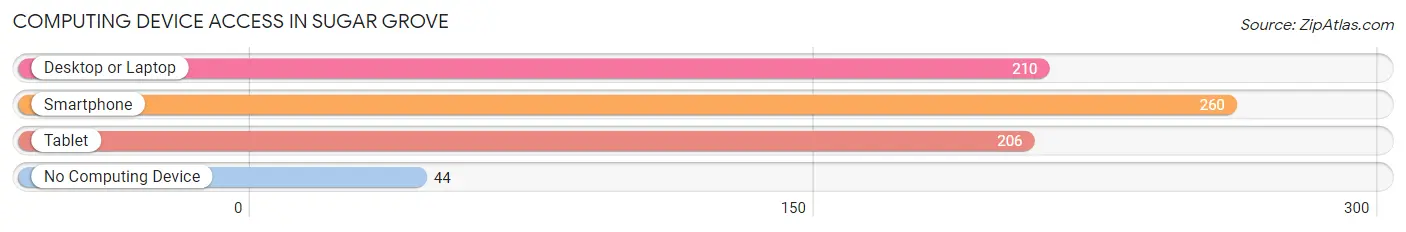
| Device Type | # Households | % Households |
| Desktop or Laptop | 210 | 65.8% |
| Smartphone | 260 | 81.5% |
| Tablet | 206 | 64.6% |
| No Computing Device | 44 | 13.8% |
| Total | 319 | 100.0% |
Internet Access in Sugar Grove
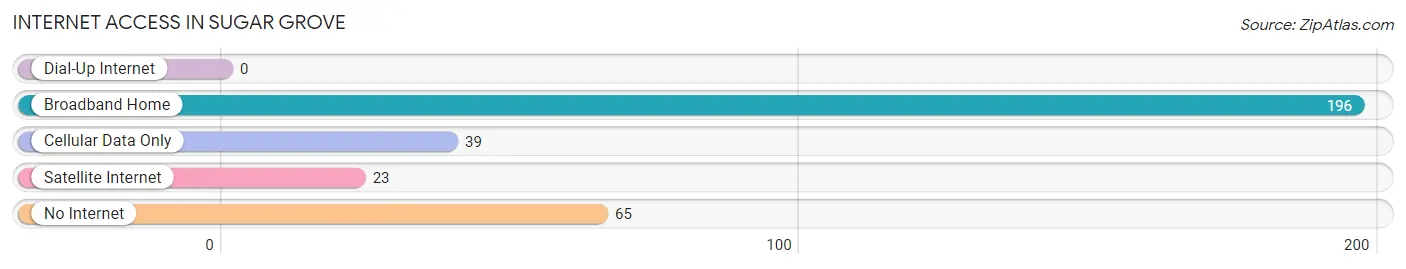
| Internet Type | # Households | % Households |
| Dial-Up Internet | 0 | 0.0% |
| Broadband Home | 196 | 61.4% |
| Cellular Data Only | 39 | 12.2% |
| Satellite Internet | 23 | 7.2% |
| No Internet | 65 | 20.4% |
| Total | 319 | 100.0% |
Sugar Grove Summary
Sugar Grove is a small unincorporated community located in the western part of Warren County, Virginia. It is situated in the foothills of the Blue Ridge Mountains, approximately 10 miles west of Front Royal. The community is home to a population of approximately 1,000 people, and is known for its rural charm and scenic beauty.
History
Sugar Grove was first settled in the late 1700s by a group of German immigrants. The area was originally known as “Sugar Grove” due to the abundance of sugar maple trees in the area. The community was officially established in 1820, when the first post office was opened. The town was named after the nearby Sugar Grove Church, which was built in 1819.
In the late 1800s, the town began to grow and prosper. The railroad arrived in 1891, bringing with it new opportunities for commerce and industry. The town was home to several businesses, including a sawmill, a gristmill, a blacksmith shop, and a general store.
Geography
Sugar Grove is located in the western part of Warren County, Virginia. It is situated in the foothills of the Blue Ridge Mountains, approximately 10 miles west of Front Royal. The town is surrounded by rolling hills and lush forests, and is home to several small streams and creeks. The climate is mild, with temperatures ranging from the mid-30s in the winter to the mid-80s in the summer.
Economy
Sugar Grove’s economy is largely based on agriculture and tourism. The town is home to several farms, which produce a variety of crops, including corn, soybeans, hay, and apples. The town is also home to several wineries, which produce a variety of wines.
Tourism is an important part of the local economy. The town is home to several attractions, including the Sugar Grove Museum, the Sugar Grove Nature Center, and the Sugar Grove Country Store. The town is also home to several bed and breakfasts, as well as a variety of restaurants and shops.
Demographics
As of the 2010 census, the population of Sugar Grove was 1,000. The racial makeup of the town was 95.2% White, 1.2% African American, 0.7% Native American, 0.3% Asian, 0.1% Pacific Islander, and 2.5% from other races. The median household income was $45,000, and the median age was 43.
Sugar Grove is a small, rural community with a rich history and a strong sense of community. The town is home to a diverse population, and is known for its scenic beauty and rural charm. The town is a popular destination for tourists, and is home to several attractions, wineries, and restaurants.
Common Questions
What is Per Capita Income in Sugar Grove?
Per Capita income in Sugar Grove is $25,499.
What is the Median Family Income in Sugar Grove?
Median Family Income in Sugar Grove is $75,714.
What is Inequality or Gini Index in Sugar Grove?
Inequality or Gini Index in Sugar Grove is 0.40.
What is the Total Population of Sugar Grove?
Total Population of Sugar Grove is 723.
What is the Total Male Population of Sugar Grove?
Total Male Population of Sugar Grove is 412.
What is the Total Female Population of Sugar Grove?
Total Female Population of Sugar Grove is 311.
What is the Ratio of Males per 100 Females in Sugar Grove?
There are 132.48 Males per 100 Females in Sugar Grove.
What is the Ratio of Females per 100 Males in Sugar Grove?
There are 75.49 Females per 100 Males in Sugar Grove.
What is the Median Population Age in Sugar Grove?
Median Population Age in Sugar Grove is 42.8 Years.
What is the Average Family Size in Sugar Grove
Average Family Size in Sugar Grove is 2.7 People.
What is the Average Household Size in Sugar Grove
Average Household Size in Sugar Grove is 2.3 People.
How Large is the Labor Force in Sugar Grove?
There are 326 People in the Labor Forcein in Sugar Grove.
What is the Percentage of People in the Labor Force in Sugar Grove?
56.3% of People are in the Labor Force in Sugar Grove.
What is the Unemployment Rate in Sugar Grove?
Unemployment Rate in Sugar Grove is 9.8%.