Zip Codes with the Highest Percentage of Population Employed in Community & Social Service in Sterling, VA

RELATED REPORTS & OPTIONS

Community & Social Service
Population
Families and Households
Female Fertility
Female Fertility (Unmarried)
Race (Community Size)
Race (Percentage)
Ancestry (Community Size)
AfghanAfricanAlbanianAmericanArabArgentineanAustralianAustrianBhutaneseBolivianBrazilianBritishBulgarianBurmeseCanadianCentral AmericanCentral American IndianCherokeeChoctawColombianCosta RicanCroatianCubanCzechDanishDominicanDutchEastern EuropeanEcuadorianEgyptianEnglishEthiopianEuropeanFilipinoFinnishFrenchFrench CanadianGermanGhanaianGreekGuatemalanHonduranHungarianIndian (Asian)IndonesianIranianIraqiIrishIroquoisItalianJamaicanJapaneseJordanianKoreanLaotianLebaneseLiberianLithuanianMacedonianMalaysianMexicanMexican American IndianMongolianNative HawaiianNicaraguanNigerianNorthern EuropeanNorwegianPakistaniPanamanianPeruvianPolishPortuguesePuerto RicanRomanianRussianSalvadoranScandinavianScotch-IrishScottishSlavicSlovakSouth AfricanSouth AmericanSouth American IndianSpaniardSpanishSri LankanSubsaharan AfricanSwedishSwissSyrianThaiTrinidadian and TobagonianTurkishUkrainianUruguayanVenezuelanVietnameseWelshWest Indian
Ancestry (Percentage)
AfghanAfricanAlbanianAmericanArabArgentineanAustralianAustrianBhutaneseBolivianBrazilianBritishBulgarianBurmeseCanadianCentral AmericanCentral American IndianCherokeeChoctawColombianCosta RicanCroatianCubanCzechDanishDominicanDutchEastern EuropeanEcuadorianEgyptianEnglishEthiopianEuropeanFilipinoFinnishFrenchFrench CanadianGermanGhanaianGreekGuatemalanHonduranHungarianIndian (Asian)IndonesianIranianIraqiIrishIroquoisItalianJamaicanJapaneseJordanianKoreanLaotianLebaneseLiberianLithuanianMacedonianMalaysianMexicanMexican American IndianMongolianNative HawaiianNicaraguanNigerianNorthern EuropeanNorwegianPakistaniPanamanianPeruvianPolishPortuguesePuerto RicanRomanianRussianSalvadoranScandinavianScotch-IrishScottishSlavicSlovakSouth AfricanSouth AmericanSouth American IndianSpaniardSpanishSri LankanSubsaharan AfricanSwedishSwissSyrianThaiTrinidadian and TobagonianTurkishUkrainianUruguayanVenezuelanVietnameseWelshWest Indian
Immigrant Origin (Total)
Immigrant Origin (Percentage)
Income
Income (Families)
Income (Households)
Poverty
Poverty (Families)
Unemployment
Employment Occupations
Employment Industries
Employer Class
Commute Time
Commute Means
School Enrollment
Education by Degree Field
Occupancy
Finances
Physical Characteristics
Sterling
Compare Zip Codes
Comparison Subject

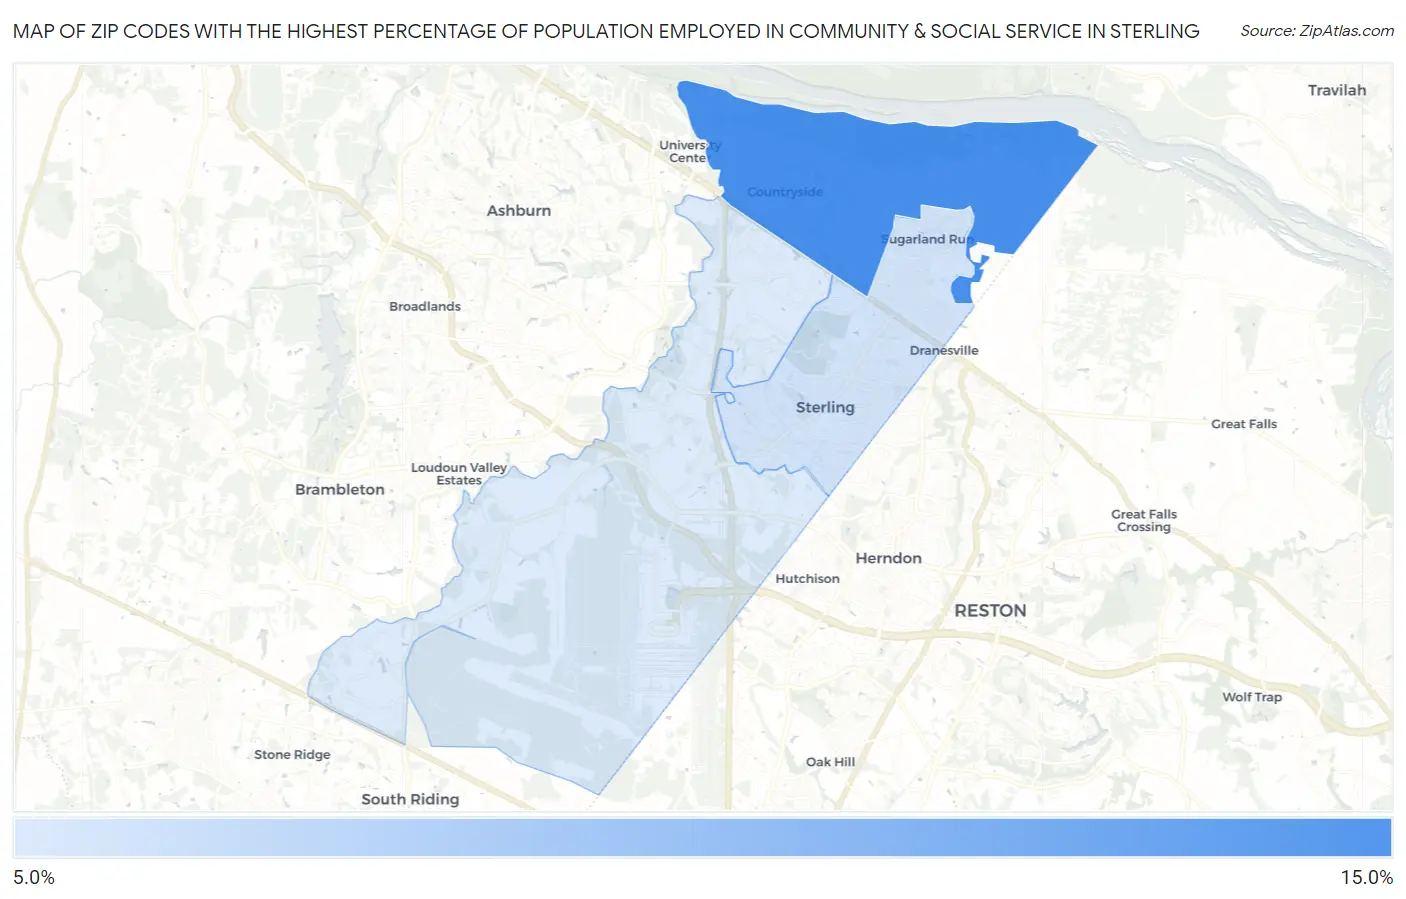
Map of Zip Codes with the Highest Percentage of Population Employed in Community & Social Service in Sterling

0.0%
15.0%
Zip Codes with the Highest Percentage of Population Employed in Community & Social Service  in Sterling Map

Zip Codes with the Highest Percentage of Population Employed in Community & Social Service in Sterling, VA

Zip Code % Employed vs State vs National
1.2016511.6%12.1%(-0.582)#31111.2%(+0.339)#10,340
2.201648.9%12.1%(-3.25)#49611.2%(-2.32)#17,124
3.201668.7%12.1%(-3.48)#51011.2%(-2.56)#17,747

Common Questions

What are the Top Zip Codes with the Highest Percentage of Population Employed in Community & Social Service in Sterling, VA?
Top Zip Codes with the Highest Percentage of Population Employed in Community & Social Service in Sterling, VA are:
#1
11.6%
#2
8.9%
#3
8.7%
What zip code has the Highest Percentage of Population Employed in Community & Social Service in Sterling, VA?
20165 has the Highest Percentage of Population Employed in Community & Social Service in Sterling, VA with 11.6%.
What is the Percentage of Population Employed in Community & Social Service in Sterling, VA?
Percentage of Population Employed in Community & Social Service in Sterling is 8.2%.
What is the Percentage of Population Employed in Community & Social Service in Virginia?
Percentage of Population Employed in Community & Social Service in Virginia is 12.1%.
What is the Percentage of Population Employed in Community & Social Service in the United States?
Percentage of Population Employed in Community & Social Service in the United States is 11.2%.