Shawsville, VA Map & Demographics
Shawsville Map
Shawsville Overview
$32,903
PER CAPITA INCOME
$69,605
AVG FAMILY INCOME
$68,684
AVG HOUSEHOLD INCOME
59.5%
WAGE / INCOME GAP [ % ]
40.5¢/ $1
WAGE / INCOME GAP [ $ ]
0.42
INEQUALITY / GINI INDEX
1,529
TOTAL POPULATION
813
MALE POPULATION
716
FEMALE POPULATION
113.55
MALES / 100 FEMALES
88.07
FEMALES / 100 MALES
35.5
MEDIAN AGE
3.7
AVG FAMILY SIZE
3.0
AVG HOUSEHOLD SIZE
915
LABOR FORCE [ PEOPLE ]
74.5%
PERCENT IN LABOR FORCE
3.5%
UNEMPLOYMENT RATE
Shawsville Zip Codes
Shawsville Area Codes
Income in Shawsville
Income Overview in Shawsville
Per Capita Income in Shawsville is $32,903, while median incomes of families and households are $69,605 and $68,684 respectively.
| Characteristic | Number | Measure |
| Per Capita Income | 1,529 | $32,903 |
| Median Family Income | 314 | $69,605 |
| Mean Family Income | 314 | $113,552 |
| Median Household Income | 518 | $68,684 |
| Mean Household Income | 518 | $86,331 |
| Income Deficit | 314 | $0 |
| Wage / Income Gap (%) | 1,529 | 59.55% |
| Wage / Income Gap ($) | 1,529 | 40.45¢ per $1 |
| Gini / Inequality Index | 1,529 | 0.42 |
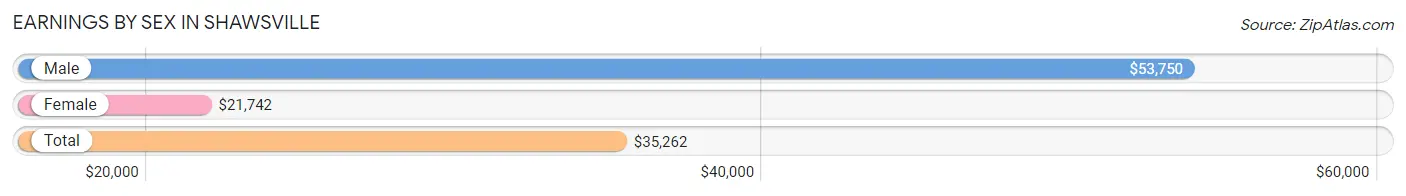
Earnings by Sex in Shawsville
Average Earnings in Shawsville are $35,262, $53,750 for men and $21,742 for women, a difference of 59.6%.
| Sex | Number | Average Earnings |
| Male | 502 (54.7%) | $53,750 |
| Female | 416 (45.3%) | $21,742 |
| Total | 918 (100.0%) | $35,262 |
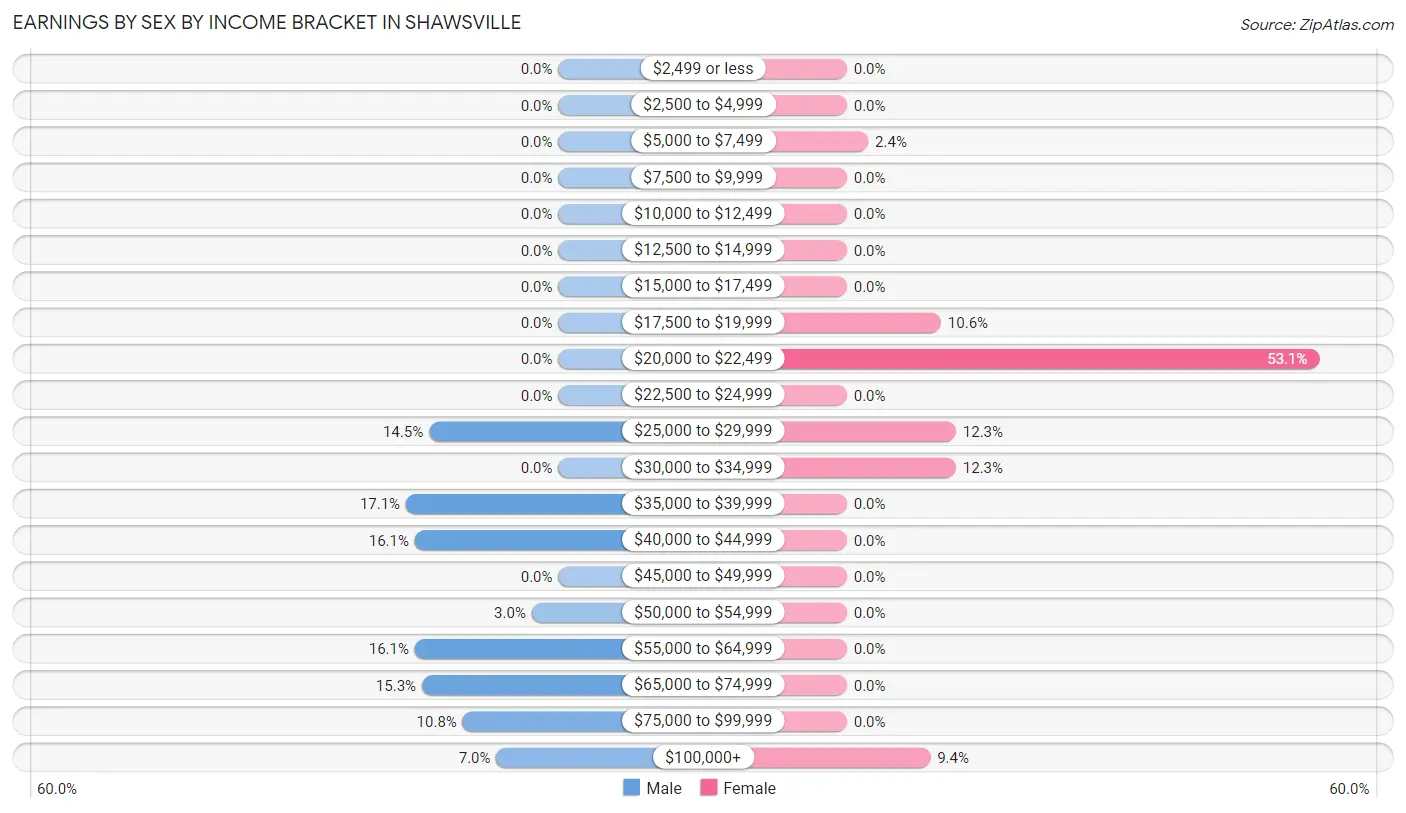
Earnings by Sex by Income Bracket in Shawsville
The most common earnings brackets in Shawsville are $35,000 to $39,999 for men (86 | 17.1%) and $20,000 to $22,499 for women (221 | 53.1%).
| Income | Male | Female |
| $2,499 or less | 0 (0.0%) | 0 (0.0%) |
| $2,500 to $4,999 | 0 (0.0%) | 0 (0.0%) |
| $5,000 to $7,499 | 0 (0.0%) | 10 (2.4%) |
| $7,500 to $9,999 | 0 (0.0%) | 0 (0.0%) |
| $10,000 to $12,499 | 0 (0.0%) | 0 (0.0%) |
| $12,500 to $14,999 | 0 (0.0%) | 0 (0.0%) |
| $15,000 to $17,499 | 0 (0.0%) | 0 (0.0%) |
| $17,500 to $19,999 | 0 (0.0%) | 44 (10.6%) |
| $20,000 to $22,499 | 0 (0.0%) | 221 (53.1%) |
| $22,500 to $24,999 | 0 (0.0%) | 0 (0.0%) |
| $25,000 to $29,999 | 73 (14.5%) | 51 (12.3%) |
| $30,000 to $34,999 | 0 (0.0%) | 51 (12.3%) |
| $35,000 to $39,999 | 86 (17.1%) | 0 (0.0%) |
| $40,000 to $44,999 | 81 (16.1%) | 0 (0.0%) |
| $45,000 to $49,999 | 0 (0.0%) | 0 (0.0%) |
| $50,000 to $54,999 | 15 (3.0%) | 0 (0.0%) |
| $55,000 to $64,999 | 81 (16.1%) | 0 (0.0%) |
| $65,000 to $74,999 | 77 (15.3%) | 0 (0.0%) |
| $75,000 to $99,999 | 54 (10.8%) | 0 (0.0%) |
| $100,000+ | 35 (7.0%) | 39 (9.4%) |
| Total | 502 (100.0%) | 416 (100.0%) |
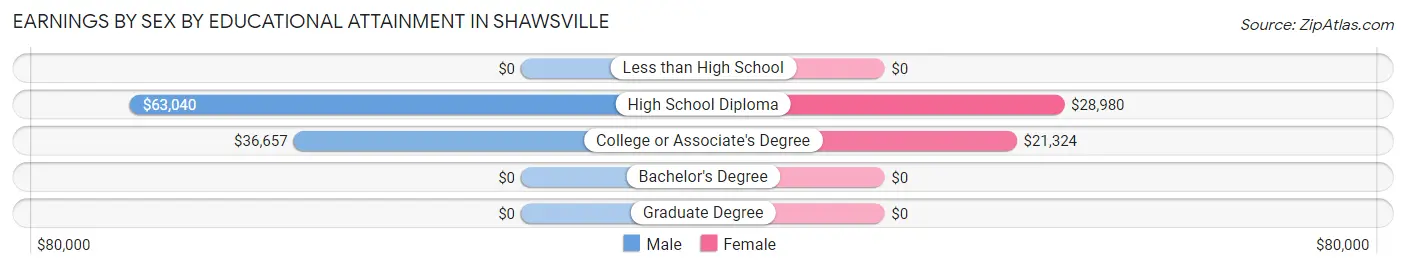
Earnings by Sex by Educational Attainment in Shawsville
Average earnings in Shawsville are $53,750 for men and $21,742 for women, a difference of 59.6%. Men with an educational attainment of high school diploma enjoy the highest average annual earnings of $63,040, while those with college or associate's degree education earn the least with $36,657. Women with an educational attainment of high school diploma earn the most with the average annual earnings of $28,980, while those with college or associate's degree education have the smallest earnings of $21,324.
| Educational Attainment | Male Income | Female Income |
| Less than High School | - | - |
| High School Diploma | $63,040 | $28,980 |
| College or Associate's Degree | $36,657 | $21,324 |
| Bachelor's Degree | - | - |
| Graduate Degree | - | - |
| Total | $53,750 | $21,742 |
Family Income in Shawsville
Family Income Brackets in Shawsville
According to the Shawsville family income data, there are 190 families falling into the $50,000 to $74,999 income range, which is the most common income bracket and makes up 60.5% of all families.
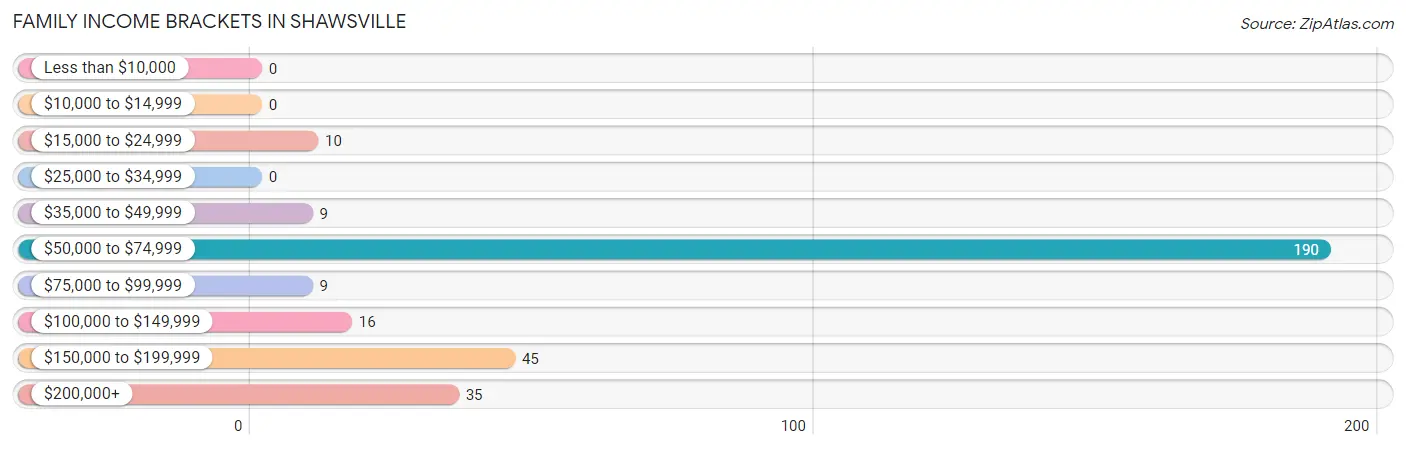
| Income Bracket | # Families | % Families |
| Less than $10,000 | 0 | 0.0% |
| $10,000 to $14,999 | 0 | 0.0% |
| $15,000 to $24,999 | 10 | 3.2% |
| $25,000 to $34,999 | 0 | 0.0% |
| $35,000 to $49,999 | 9 | 2.9% |
| $50,000 to $74,999 | 190 | 60.5% |
| $75,000 to $99,999 | 9 | 2.9% |
| $100,000 to $149,999 | 16 | 5.1% |
| $150,000 to $199,999 | 45 | 14.3% |
| $200,000+ | 35 | 11.1% |
Family Income by Famaliy Size in Shawsville
| Income Bracket | # Families | Median Income |
| 2-Person Families | 84 (26.8%) | $0 |
| 3-Person Families | 114 (36.3%) | $0 |
| 4-Person Families | 97 (30.9%) | $0 |
| 5-Person Families | 19 (6.0%) | $0 |
| 6-Person Families | 0 (0.0%) | $0 |
| 7+ Person Families | 0 (0.0%) | $0 |
| Total | 314 (100.0%) | $69,605 |
Family Income by Number of Earners in Shawsville
| Number of Earners | # Families | Median Income |
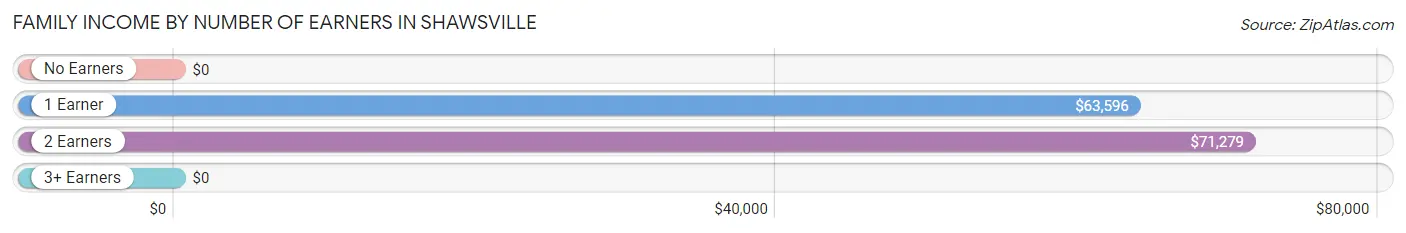
| No Earners | 9 (2.9%) | $0 |
| 1 Earner | 109 (34.7%) | $63,596 |
| 2 Earners | 158 (50.3%) | $71,279 |
| 3+ Earners | 38 (12.1%) | $0 |
| Total | 314 (100.0%) | $69,605 |
Household Income in Shawsville
Household Income Brackets in Shawsville
With 153 households falling in the category, the $50,000 to $74,999 income range is the most frequent in Shawsville, accounting for 29.5% of all households.
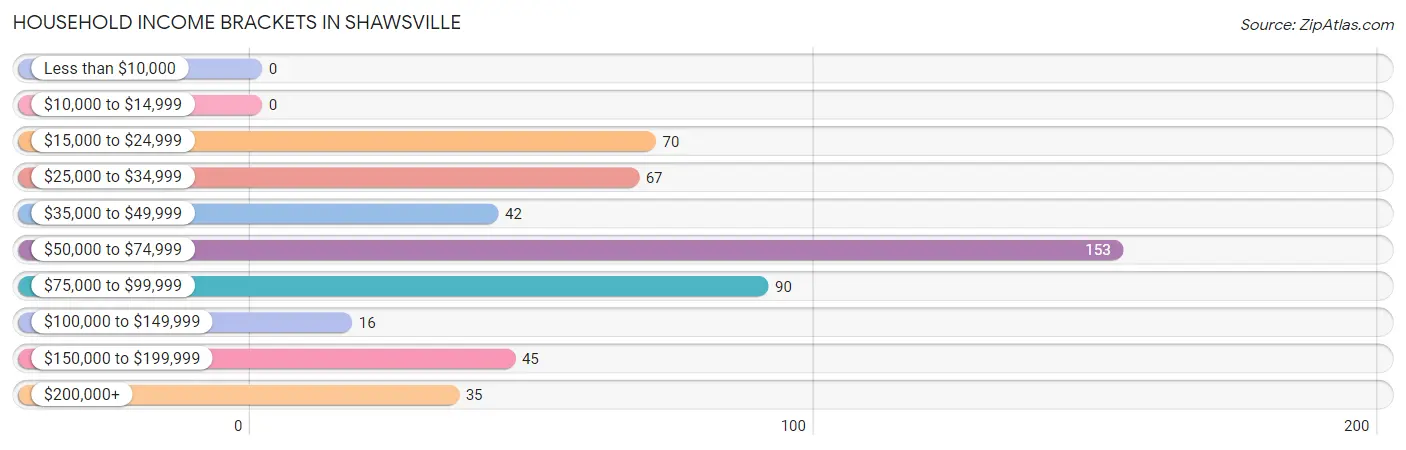
| Income Bracket | # Households | % Households |
| Less than $10,000 | 0 | 0.0% |
| $10,000 to $14,999 | 0 | 0.0% |
| $15,000 to $24,999 | 70 | 13.5% |
| $25,000 to $34,999 | 67 | 12.9% |
| $35,000 to $49,999 | 42 | 8.1% |
| $50,000 to $74,999 | 153 | 29.5% |
| $75,000 to $99,999 | 90 | 17.4% |
| $100,000 to $149,999 | 16 | 3.1% |
| $150,000 to $199,999 | 45 | 8.7% |
| $200,000+ | 35 | 6.8% |
Household Income by Householder Age in Shawsville
The median household income in Shawsville is $68,684, with the highest median household income of $69,364 found in the 45 to 64 years age bracket for the primary householder. A total of 223 households (43.0%) fall into this category.
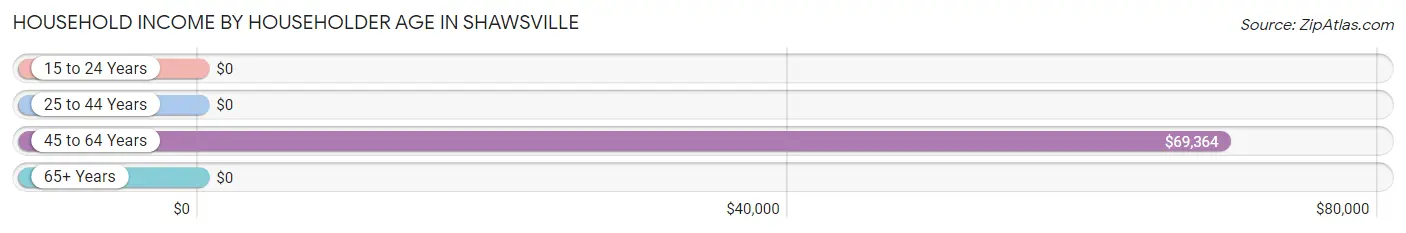
| Income Bracket | # Households | Median Income |
| 15 to 24 Years | 0 (0.0%) | $0 |
| 25 to 44 Years | 252 (48.6%) | $0 |
| 45 to 64 Years | 223 (43.0%) | $69,364 |
| 65+ Years | 43 (8.3%) | $0 |
| Total | 518 (100.0%) | $68,684 |
Poverty in Shawsville
Income Below Poverty by Sex and Age in Shawsville
With 2.8% poverty level for males and 7.3% for females among the residents of Shawsville, 6 to 11 year old males and under 5 year old females are the most vulnerable to poverty, with 11 males (42.3%) and 10 females (43.5%) in their respective age groups living below the poverty level.
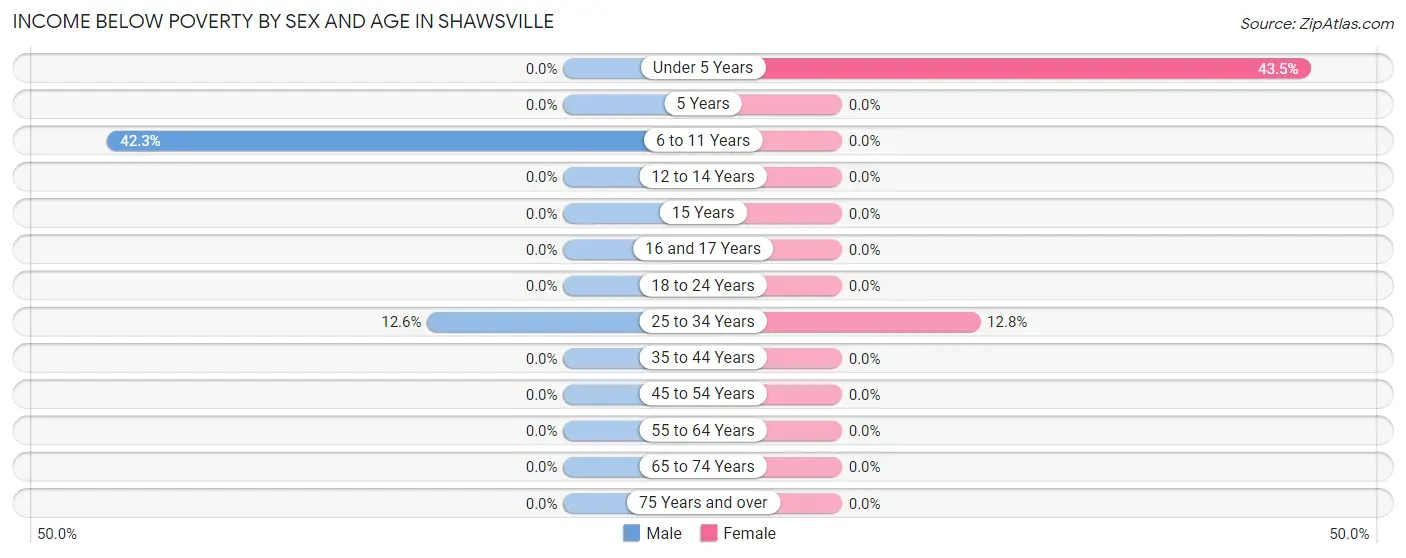
| Age Bracket | Male | Female |
| Under 5 Years | 0 (0.0%) | 10 (43.5%) |
| 5 Years | 0 (0.0%) | 0 (0.0%) |
| 6 to 11 Years | 11 (42.3%) | 0 (0.0%) |
| 12 to 14 Years | 0 (0.0%) | 0 (0.0%) |
| 15 Years | 0 (0.0%) | 0 (0.0%) |
| 16 and 17 Years | 0 (0.0%) | 0 (0.0%) |
| 18 to 24 Years | 0 (0.0%) | 0 (0.0%) |
| 25 to 34 Years | 12 (12.6%) | 42 (12.8%) |
| 35 to 44 Years | 0 (0.0%) | 0 (0.0%) |
| 45 to 54 Years | 0 (0.0%) | 0 (0.0%) |
| 55 to 64 Years | 0 (0.0%) | 0 (0.0%) |
| 65 to 74 Years | 0 (0.0%) | 0 (0.0%) |
| 75 Years and over | 0 (0.0%) | 0 (0.0%) |
| Total | 23 (2.8%) | 52 (7.3%) |
Income Above Poverty by Sex and Age in Shawsville
According to the poverty statistics in Shawsville, males aged under 5 years and females aged 6 to 11 years are the age groups that are most secure financially, with 100.0% of males and 100.0% of females in these age groups living above the poverty line.
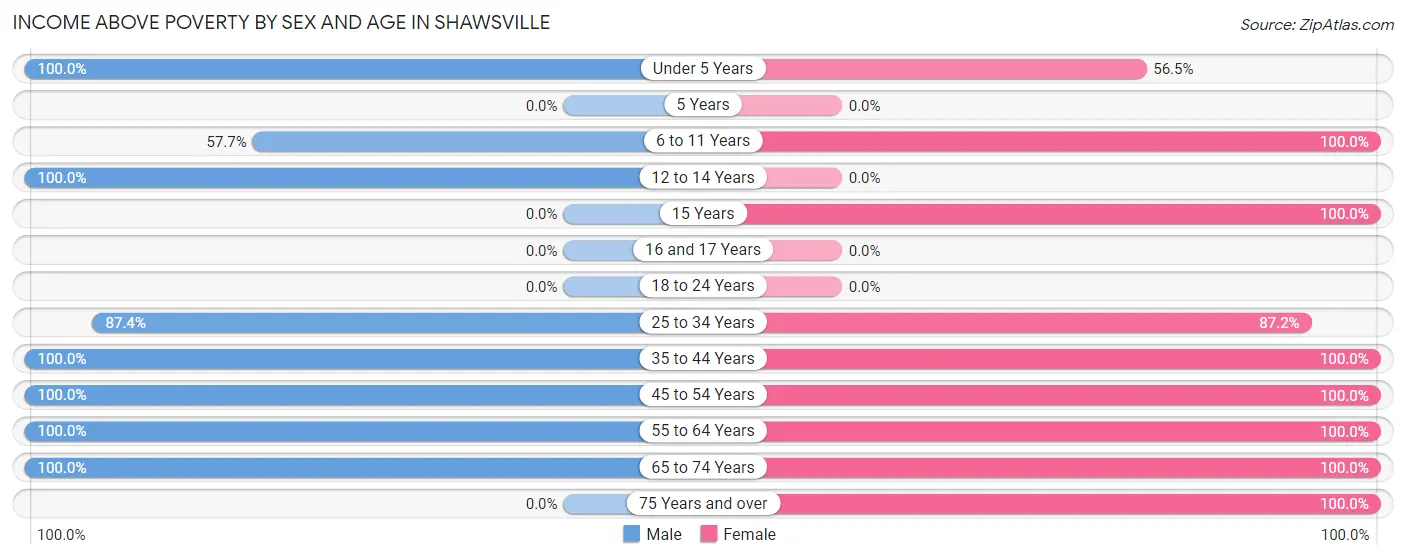
| Age Bracket | Male | Female |
| Under 5 Years | 15 (100.0%) | 13 (56.5%) |
| 5 Years | 0 (0.0%) | 0 (0.0%) |
| 6 to 11 Years | 15 (57.7%) | 15 (100.0%) |
| 12 to 14 Years | 207 (100.0%) | 0 (0.0%) |
| 15 Years | 0 (0.0%) | 15 (100.0%) |
| 16 and 17 Years | 0 (0.0%) | 0 (0.0%) |
| 18 to 24 Years | 0 (0.0%) | 0 (0.0%) |
| 25 to 34 Years | 83 (87.4%) | 285 (87.2%) |
| 35 to 44 Years | 175 (100.0%) | 17 (100.0%) |
| 45 to 54 Years | 149 (100.0%) | 60 (100.0%) |
| 55 to 64 Years | 111 (100.0%) | 217 (100.0%) |
| 65 to 74 Years | 35 (100.0%) | 24 (100.0%) |
| 75 Years and over | 0 (0.0%) | 18 (100.0%) |
| Total | 790 (97.2%) | 664 (92.7%) |
Income Below Poverty Among Married-Couple Families in Shawsville
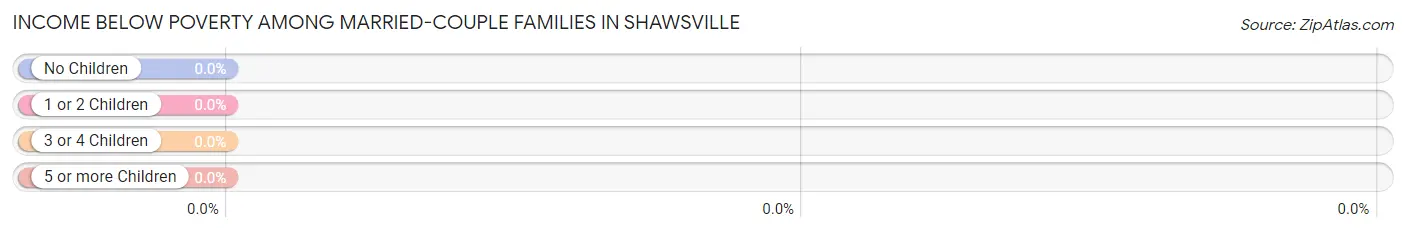
| Children | Above Poverty | Below Poverty |
| No Children | 179 (100.0%) | 0 (0.0%) |
| 1 or 2 Children | 25 (100.0%) | 0 (0.0%) |
| 3 or 4 Children | 19 (100.0%) | 0 (0.0%) |
| 5 or more Children | 0 (0.0%) | 0 (0.0%) |
| Total | 223 (100.0%) | 0 (0.0%) |
Income Below Poverty Among Single-Parent Households in Shawsville
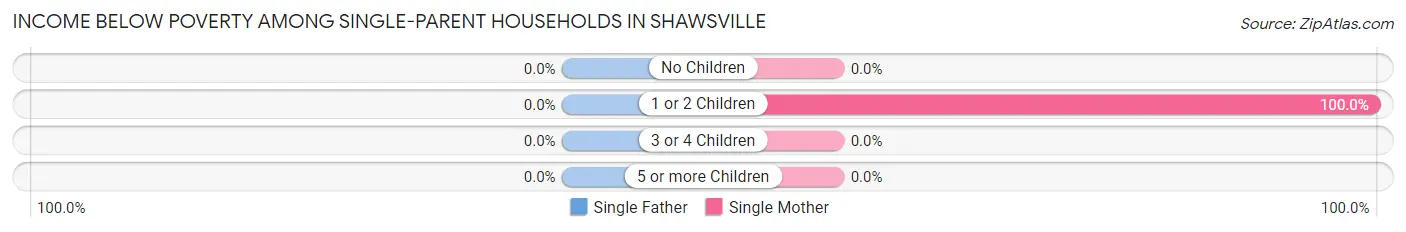
| Children | Single Father | Single Mother |
| No Children | 0 (0.0%) | 0 (0.0%) |
| 1 or 2 Children | 0 (0.0%) | 10 (100.0%) |
| 3 or 4 Children | 0 (0.0%) | 0 (0.0%) |
| 5 or more Children | 0 (0.0%) | 0 (0.0%) |
| Total | 0 (0.0%) | 10 (100.0%) |
Income Below Poverty Among Married-Couple vs Single-Parent Households in Shawsville
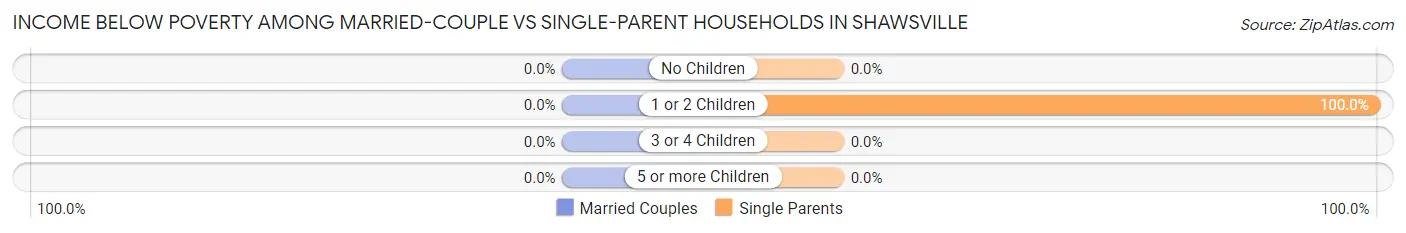
| Children | Married-Couple Families | Single-Parent Households |
| No Children | 0 (0.0%) | 0 (0.0%) |
| 1 or 2 Children | 0 (0.0%) | 10 (100.0%) |
| 3 or 4 Children | 0 (0.0%) | 0 (0.0%) |
| 5 or more Children | 0 (0.0%) | 0 (0.0%) |
| Total | 0 (0.0%) | 10 (11.0%) |
Race in Shawsville
The most populous races in Shawsville are White / Caucasian (1,382 | 90.4%), Black / African American (81 | 5.3%), and Some other Race (66 | 4.3%).
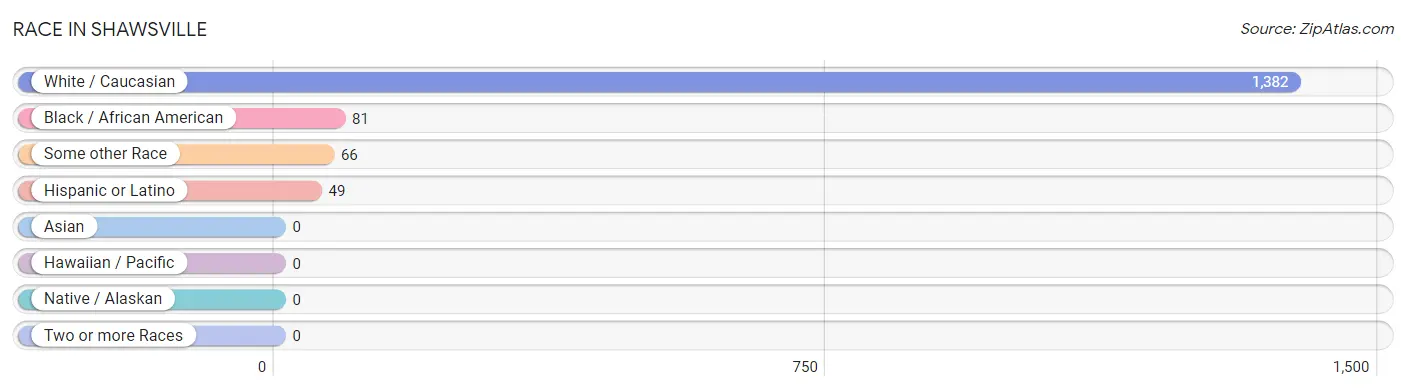
| Race | # Population | % Population |
| Asian | 0 | 0.0% |
| Black / African American | 81 | 5.3% |
| Hawaiian / Pacific | 0 | 0.0% |
| Hispanic or Latino | 49 | 3.2% |
| Native / Alaskan | 0 | 0.0% |
| White / Caucasian | 1,382 | 90.4% |
| Two or more Races | 0 | 0.0% |
| Some other Race | 66 | 4.3% |
| Total | 1,529 | 100.0% |
Ancestry in Shawsville
The most populous ancestries reported in Shawsville are German (397 | 26.0%), Irish (274 | 17.9%), American (221 | 14.4%), Jamaican (150 | 9.8%), and Polish (92 | 6.0%), together accounting for 74.2% of all Shawsville residents.
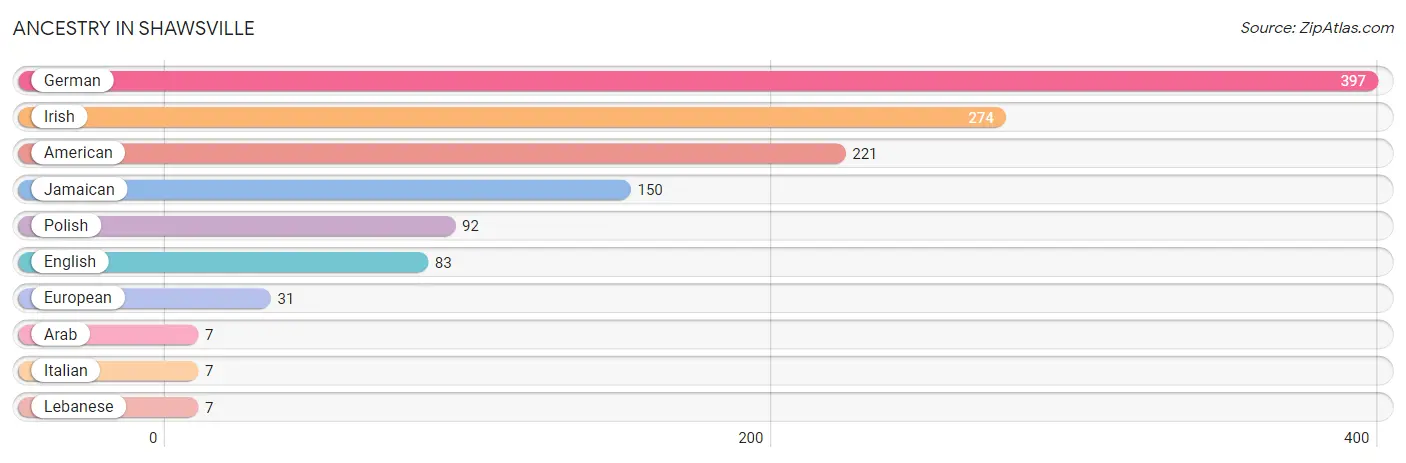
| Ancestry | # Population | % Population |
| American | 221 | 14.4% |
| Arab | 7 | 0.5% |
| English | 83 | 5.4% |
| European | 31 | 2.0% |
| German | 397 | 26.0% |
| Irish | 274 | 17.9% |
| Italian | 7 | 0.5% |
| Jamaican | 150 | 9.8% |
| Lebanese | 7 | 0.5% |
| Polish | 92 | 6.0% | View All 10 Rows |
Immigrants in Shawsville

| Immigration Origin | # Population | % Population | View All 0 Rows |
Sex and Age in Shawsville
Sex and Age in Shawsville
The most populous age groups in Shawsville are 10 to 14 Years (218 | 26.8%) for men and 30 to 34 Years (314 | 43.9%) for women.
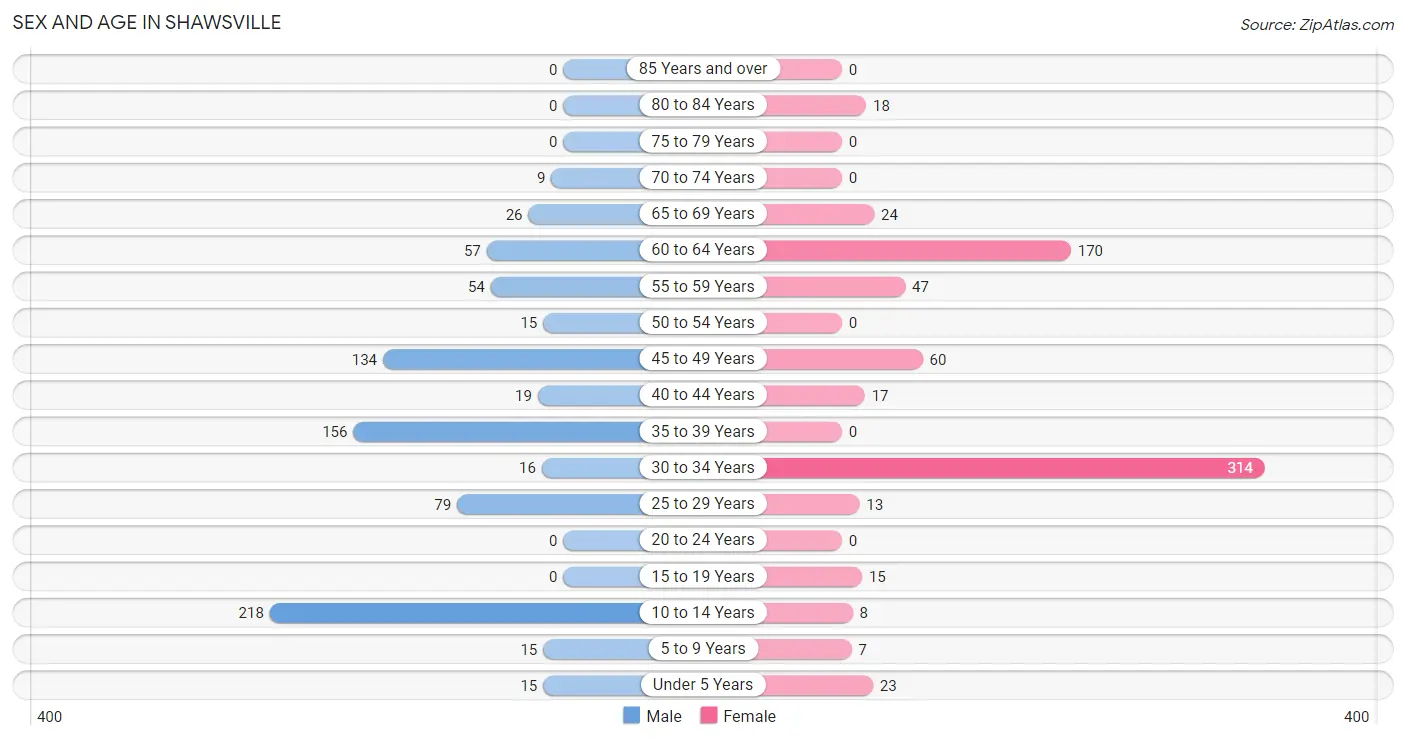
| Age Bracket | Male | Female |
| Under 5 Years | 15 (1.8%) | 23 (3.2%) |
| 5 to 9 Years | 15 (1.8%) | 7 (1.0%) |
| 10 to 14 Years | 218 (26.8%) | 8 (1.1%) |
| 15 to 19 Years | 0 (0.0%) | 15 (2.1%) |
| 20 to 24 Years | 0 (0.0%) | 0 (0.0%) |
| 25 to 29 Years | 79 (9.7%) | 13 (1.8%) |
| 30 to 34 Years | 16 (2.0%) | 314 (43.9%) |
| 35 to 39 Years | 156 (19.2%) | 0 (0.0%) |
| 40 to 44 Years | 19 (2.3%) | 17 (2.4%) |
| 45 to 49 Years | 134 (16.5%) | 60 (8.4%) |
| 50 to 54 Years | 15 (1.8%) | 0 (0.0%) |
| 55 to 59 Years | 54 (6.6%) | 47 (6.6%) |
| 60 to 64 Years | 57 (7.0%) | 170 (23.7%) |
| 65 to 69 Years | 26 (3.2%) | 24 (3.4%) |
| 70 to 74 Years | 9 (1.1%) | 0 (0.0%) |
| 75 to 79 Years | 0 (0.0%) | 0 (0.0%) |
| 80 to 84 Years | 0 (0.0%) | 18 (2.5%) |
| 85 Years and over | 0 (0.0%) | 0 (0.0%) |
| Total | 813 (100.0%) | 716 (100.0%) |
Families and Households in Shawsville
Median Family Size in Shawsville
The median family size in Shawsville is 3.71 persons per family, with married-couple families (223 | 71.0%) accounting for the largest median family size of 3.79 persons per family. On the other hand, single female/mother families (10 | 3.2%) represent the smallest median family size with 3.10 persons per family.
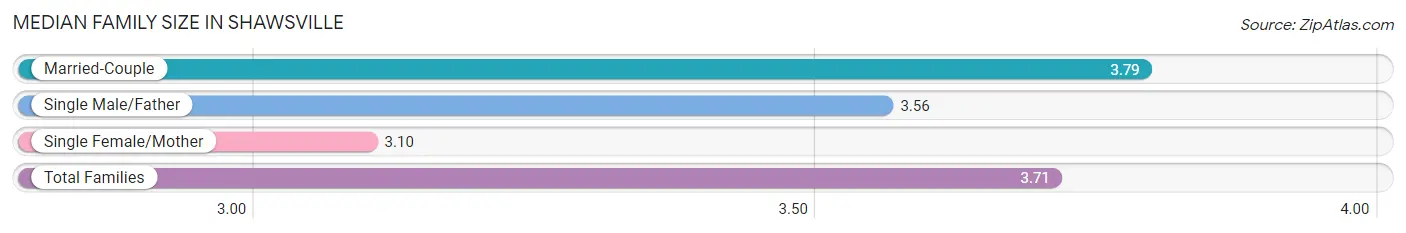
| Family Type | # Families | Family Size |
| Married-Couple | 223 (71.0%) | 3.79 |
| Single Male/Father | 81 (25.8%) | 3.56 |
| Single Female/Mother | 10 (3.2%) | 3.10 |
| Total Families | 314 (100.0%) | 3.71 |
Median Household Size in Shawsville
The median household size in Shawsville is 2.95 persons per household, with single male/father households (81 | 15.6%) accounting for the largest median household size of 4.41 persons per household. non-family households (204 | 39.4%) represent the smallest median household size with 1.39 persons per household.
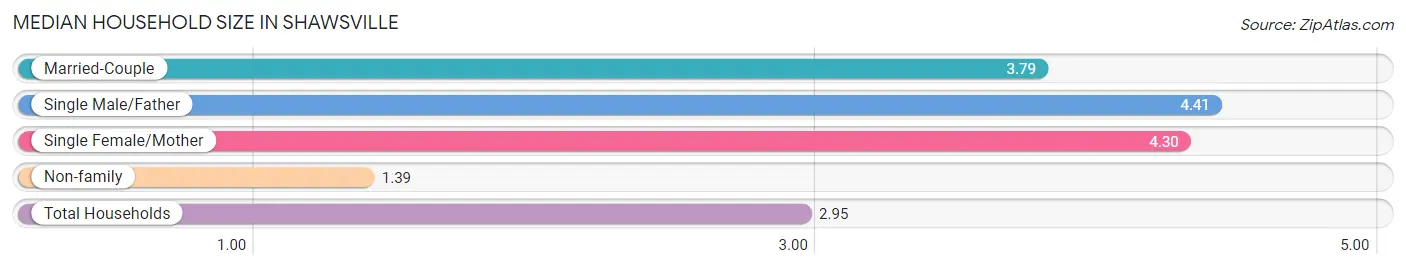
| Household Type | # Households | Household Size |
| Married-Couple | 223 (43.0%) | 3.79 |
| Single Male/Father | 81 (15.6%) | 4.41 |
| Single Female/Mother | 10 (1.9%) | 4.30 |
| Non-family | 204 (39.4%) | 1.39 |
| Total Households | 518 (100.0%) | 2.95 |
Household Size by Marriage Status in Shawsville
Out of a total of 518 households in Shawsville, 314 (60.6%) are family households, while 204 (39.4%) are nonfamily households. The most numerous type of family households are 3-person households, comprising 104, and the most common type of nonfamily households are 1-person households, comprising 127.
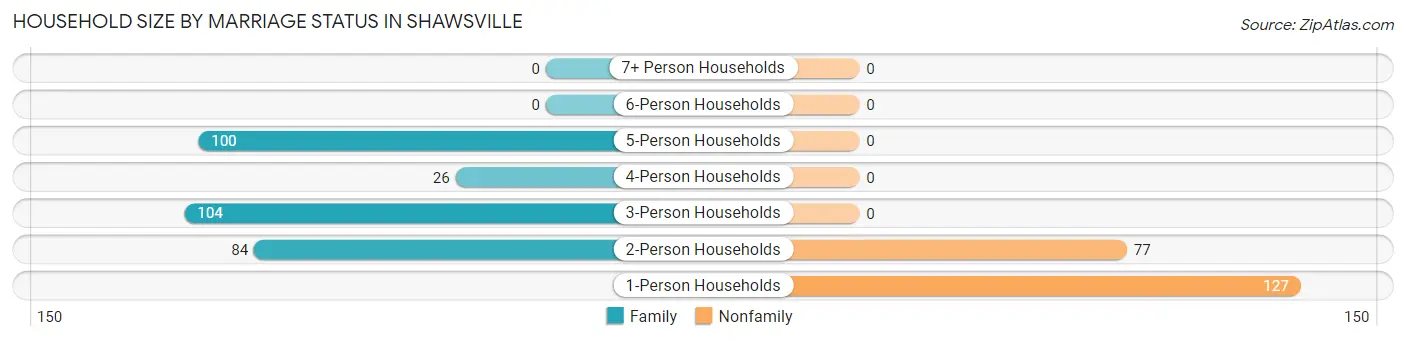
| Household Size | Family Households | Nonfamily Households |
| 1-Person Households | - | 127 (24.5%) |
| 2-Person Households | 84 (16.2%) | 77 (14.9%) |
| 3-Person Households | 104 (20.1%) | 0 (0.0%) |
| 4-Person Households | 26 (5.0%) | 0 (0.0%) |
| 5-Person Households | 100 (19.3%) | 0 (0.0%) |
| 6-Person Households | 0 (0.0%) | 0 (0.0%) |
| 7+ Person Households | 0 (0.0%) | 0 (0.0%) |
| Total | 314 (60.6%) | 204 (39.4%) |
Female Fertility in Shawsville
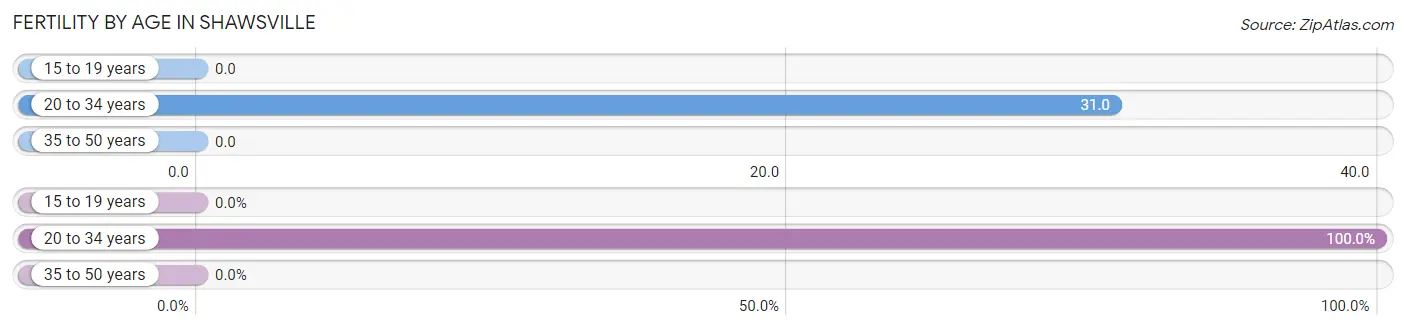
Fertility by Age in Shawsville
Average fertility rate in Shawsville is 24.0 births per 1,000 women. Women in the age bracket of 20 to 34 years have the highest fertility rate with 31.0 births per 1,000 women. Women in the age bracket of 20 to 34 years acount for 100.0% of all women with births.
| Age Bracket | Women with Births | Births / 1,000 Women |
| 15 to 19 years | 0 (0.0%) | 0.0 |
| 20 to 34 years | 10 (100.0%) | 31.0 |
| 35 to 50 years | 0 (0.0%) | 0.0 |
| Total | 10 (100.0%) | 24.0 |
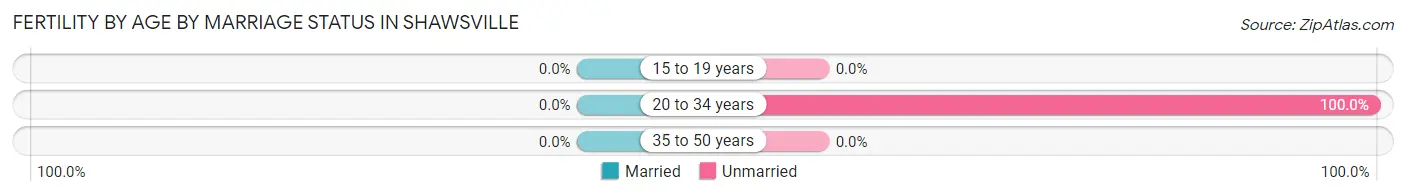
Fertility by Age by Marriage Status in Shawsville
| Age Bracket | Married | Unmarried |
| 15 to 19 years | 0 (0.0%) | 0 (0.0%) |
| 20 to 34 years | 0 (0.0%) | 10 (100.0%) |
| 35 to 50 years | 0 (0.0%) | 0 (0.0%) |
| Total | 0 (0.0%) | 10 (100.0%) |
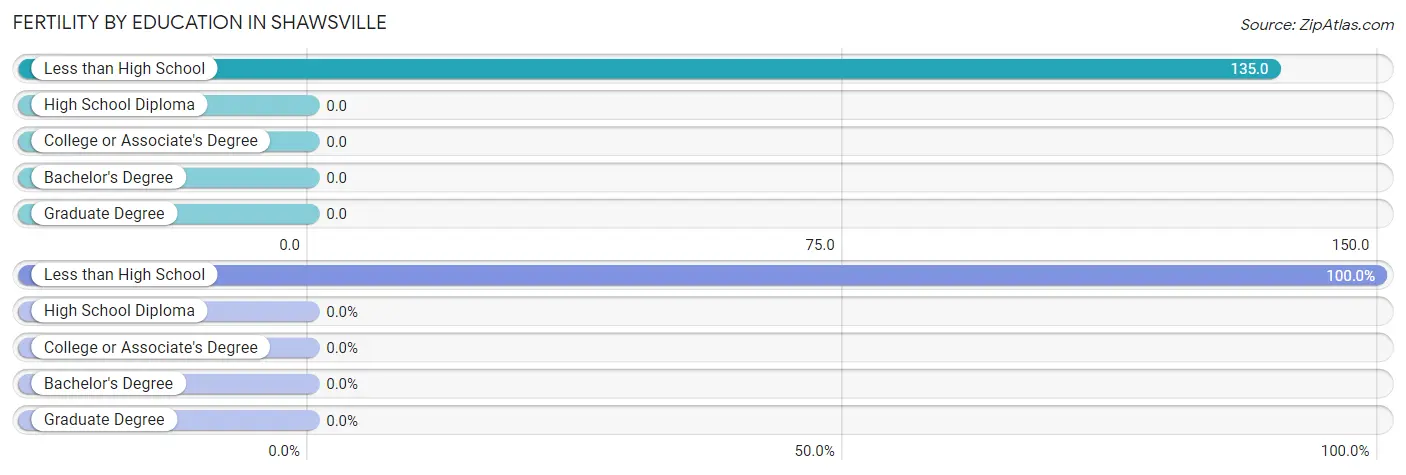
Fertility by Education in Shawsville
| Educational Attainment | Women with Births | Births / 1,000 Women |
| Less than High School | 10 (100.0%) | 135.0 |
| High School Diploma | 0 (0.0%) | 0.0 |
| College or Associate's Degree | 0 (0.0%) | 0.0 |
| Bachelor's Degree | 0 (0.0%) | 0.0 |
| Graduate Degree | 0 (0.0%) | 0.0 |
| Total | 10 (100.0%) | 24.0 |
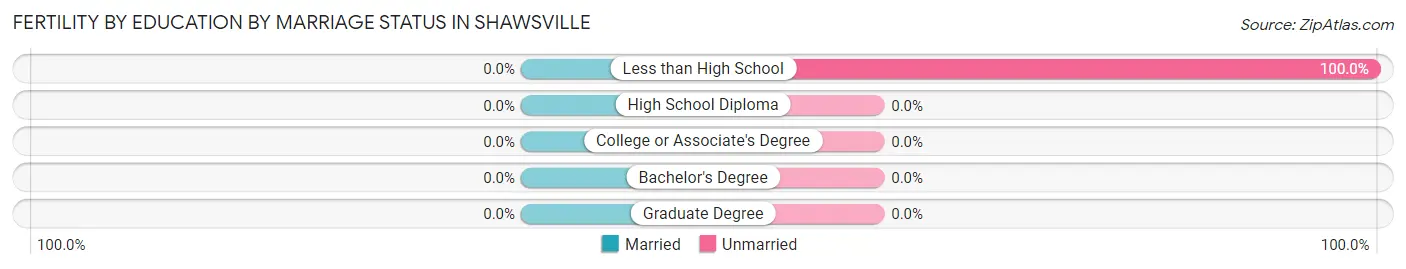
Fertility by Education by Marriage Status in Shawsville
| Educational Attainment | Married | Unmarried |
| Less than High School | 0 (0.0%) | 10 (100.0%) |
| High School Diploma | 0 (0.0%) | 0 (0.0%) |
| College or Associate's Degree | 0 (0.0%) | 0 (0.0%) |
| Bachelor's Degree | 0 (0.0%) | 0 (0.0%) |
| Graduate Degree | 0 (0.0%) | 0 (0.0%) |
| Total | 0 (0.0%) | 10 (100.0%) |
Employment Characteristics in Shawsville
Employment by Class of Employer in Shawsville
Among the 883 employed individuals in Shawsville, private company employees (793 | 89.8%), self-employed (not incorporated) (70 | 7.9%), and local government employees (13 | 1.5%) make up the most common classes of employment.
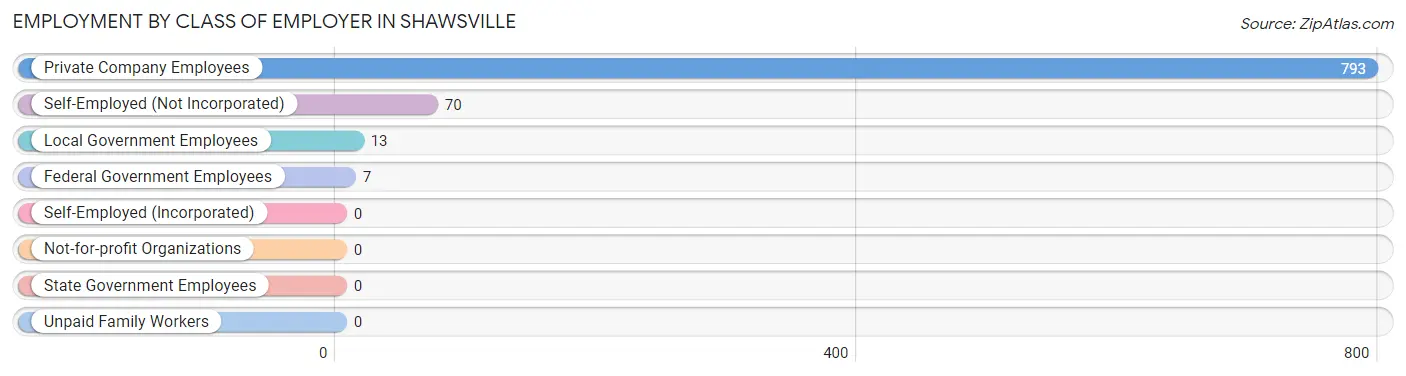
| Employer Class | # Employees | % Employees |
| Private Company Employees | 793 | 89.8% |
| Self-Employed (Incorporated) | 0 | 0.0% |
| Self-Employed (Not Incorporated) | 70 | 7.9% |
| Not-for-profit Organizations | 0 | 0.0% |
| Local Government Employees | 13 | 1.5% |
| State Government Employees | 0 | 0.0% |
| Federal Government Employees | 7 | 0.8% |
| Unpaid Family Workers | 0 | 0.0% |
| Total | 883 | 100.0% |
Employment Status by Age in Shawsville
According to the labor force statistics for Shawsville, out of the total population over 16 years of age (1,228), 74.5% or 915 individuals are in the labor force, with 3.5% or 32 of them unemployed. The age group with the highest labor force participation rate is 30 to 34 years, with 100.0% or 330 individuals in the labor force. Within the labor force, the 30 to 34 years age range has the highest percentage of unemployed individuals, with 9.7% or 32 of them being unemployed.
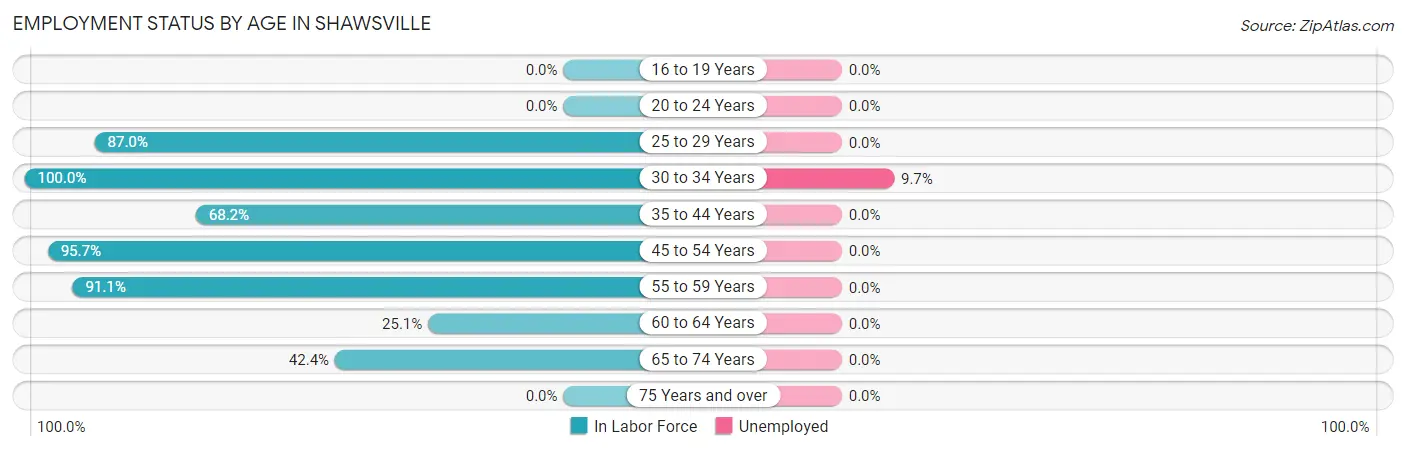
| Age Bracket | In Labor Force | Unemployed |
| 16 to 19 Years | 0 (0.0%) | 0 (0.0%) |
| 20 to 24 Years | 0 (0.0%) | 0 (0.0%) |
| 25 to 29 Years | 80 (87.0%) | 0 (0.0%) |
| 30 to 34 Years | 330 (100.0%) | 32 (9.7%) |
| 35 to 44 Years | 131 (68.2%) | 0 (0.0%) |
| 45 to 54 Years | 200 (95.7%) | 0 (0.0%) |
| 55 to 59 Years | 92 (91.1%) | 0 (0.0%) |
| 60 to 64 Years | 57 (25.1%) | 0 (0.0%) |
| 65 to 74 Years | 25 (42.4%) | 0 (0.0%) |
| 75 Years and over | 0 (0.0%) | 0 (0.0%) |
| Total | 915 (74.5%) | 32 (3.5%) |
Employment Status by Educational Attainment in Shawsville
According to labor force statistics for Shawsville, 77.3% of individuals (890) out of the total population between 25 and 64 years of age (1,151) are in the labor force, with 3.6% or 32 of them being unemployed. The group with the highest labor force participation rate are those with the educational attainment of college / associate degree, with 100.0% or 405 individuals in the labor force. Within the labor force, individuals with less than high school education have the highest percentage of unemployment, with 42.7% or 32 of them being unemployed.
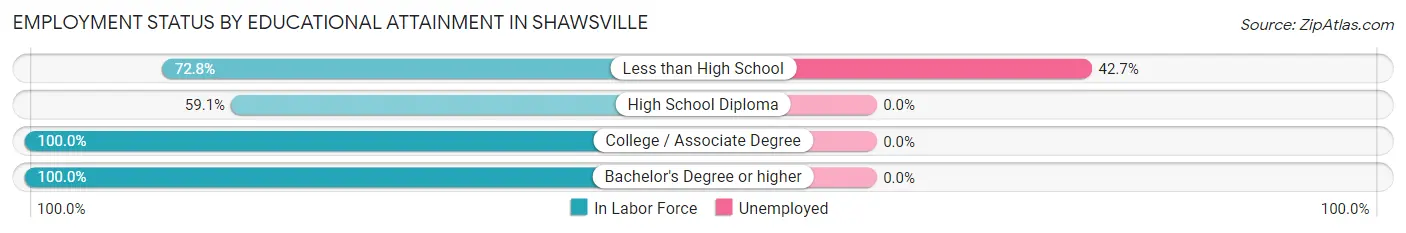
| Educational Attainment | In Labor Force | Unemployed |
| Less than High School | 75 (72.8%) | 44 (42.7%) |
| High School Diploma | 336 (59.1%) | 0 (0.0%) |
| College / Associate Degree | 405 (100.0%) | 0 (0.0%) |
| Bachelor's Degree or higher | 74 (100.0%) | 0 (0.0%) |
| Total | 890 (77.3%) | 41 (3.6%) |
Employment Occupations by Sex in Shawsville
Management, Business, Science and Arts Occupations
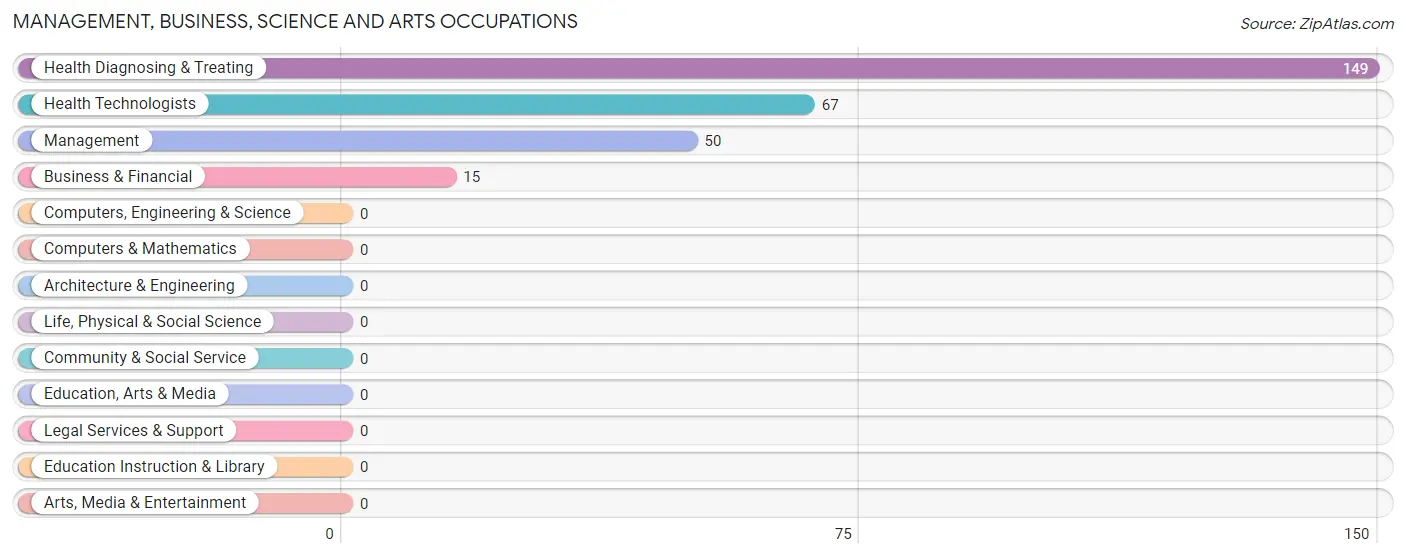
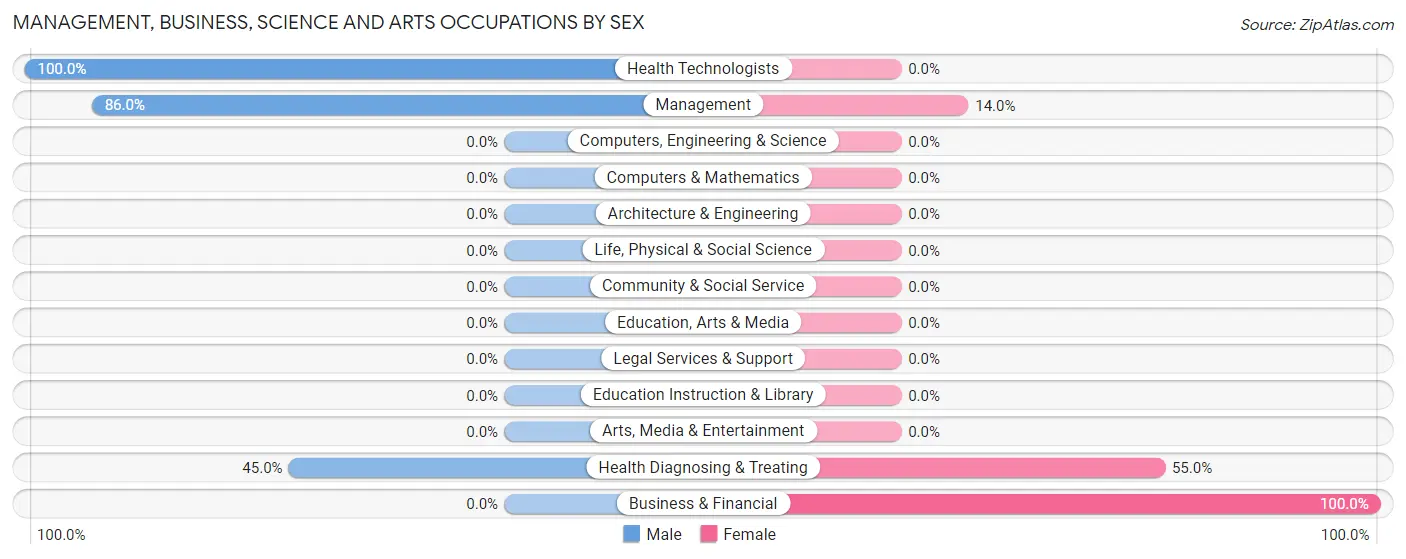
The most common Management, Business, Science and Arts occupations in Shawsville are Health Diagnosing & Treating (149 | 16.9%), Health Technologists (67 | 7.6%), Management (50 | 5.7%), and Business & Financial (15 | 1.7%).
Management, Business, Science and Arts Occupations by Sex
Within the Management, Business, Science and Arts occupations in Shawsville, the most male-oriented occupations are Health Technologists (100.0%), Management (86.0%), and Health Diagnosing & Treating (45.0%), while the most female-oriented occupations are Business & Financial (100.0%), Health Diagnosing & Treating (55.0%), and Management (14.0%).
| Occupation | Male | Female |
| Management | 43 (86.0%) | 7 (14.0%) |
| Business & Financial | 0 (0.0%) | 15 (100.0%) |
| Computers, Engineering & Science | 0 (0.0%) | 0 (0.0%) |
| Computers & Mathematics | 0 (0.0%) | 0 (0.0%) |
| Architecture & Engineering | 0 (0.0%) | 0 (0.0%) |
| Life, Physical & Social Science | 0 (0.0%) | 0 (0.0%) |
| Community & Social Service | 0 (0.0%) | 0 (0.0%) |
| Education, Arts & Media | 0 (0.0%) | 0 (0.0%) |
| Legal Services & Support | 0 (0.0%) | 0 (0.0%) |
| Education Instruction & Library | 0 (0.0%) | 0 (0.0%) |
| Arts, Media & Entertainment | 0 (0.0%) | 0 (0.0%) |
| Health Diagnosing & Treating | 67 (45.0%) | 82 (55.0%) |
| Health Technologists | 67 (100.0%) | 0 (0.0%) |
| Total (Category) | 110 (51.4%) | 104 (48.6%) |
| Total (Overall) | 467 (52.9%) | 416 (47.1%) |
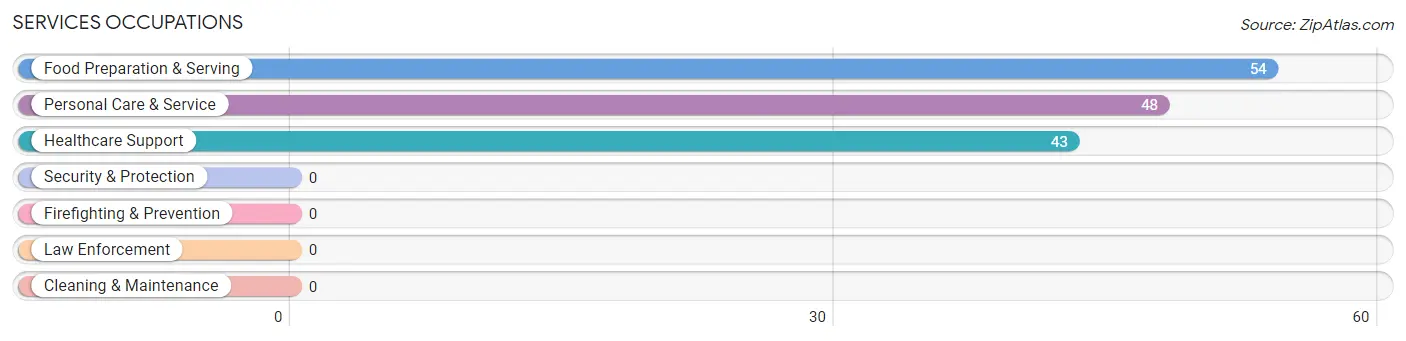
Services Occupations
The most common Services occupations in Shawsville are Food Preparation & Serving (54 | 6.1%), Personal Care & Service (48 | 5.4%), and Healthcare Support (43 | 4.9%).
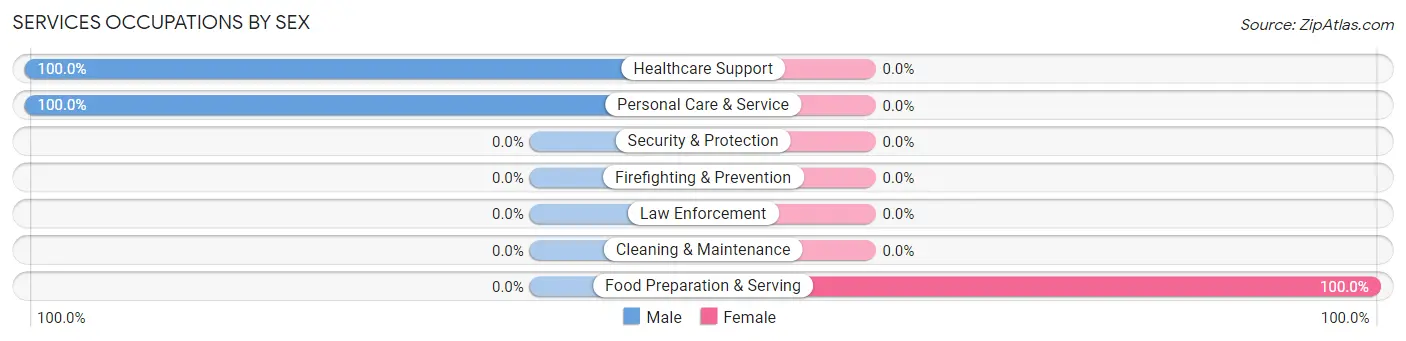
Services Occupations by Sex
| Occupation | Male | Female |
| Healthcare Support | 43 (100.0%) | 0 (0.0%) |
| Security & Protection | 0 (0.0%) | 0 (0.0%) |
| Firefighting & Prevention | 0 (0.0%) | 0 (0.0%) |
| Law Enforcement | 0 (0.0%) | 0 (0.0%) |
| Food Preparation & Serving | 0 (0.0%) | 54 (100.0%) |
| Cleaning & Maintenance | 0 (0.0%) | 0 (0.0%) |
| Personal Care & Service | 48 (100.0%) | 0 (0.0%) |
| Total (Category) | 91 (62.8%) | 54 (37.2%) |
| Total (Overall) | 467 (52.9%) | 416 (47.1%) |
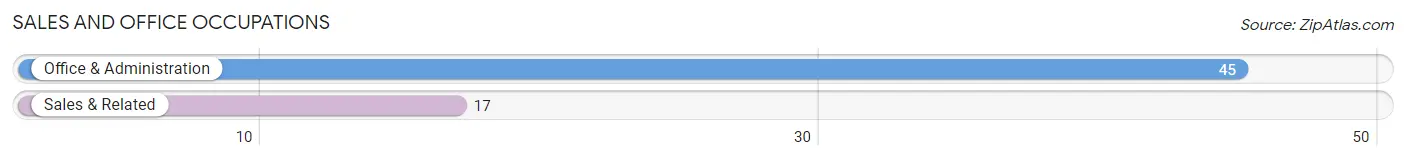
Sales and Office Occupations
The most common Sales and Office occupations in Shawsville are Office & Administration (45 | 5.1%), and Sales & Related (17 | 1.9%).
Sales and Office Occupations by Sex
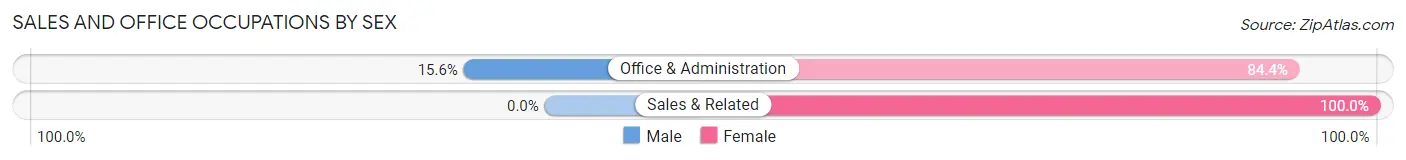
| Occupation | Male | Female |
| Sales & Related | 0 (0.0%) | 17 (100.0%) |
| Office & Administration | 7 (15.6%) | 38 (84.4%) |
| Total (Category) | 7 (11.3%) | 55 (88.7%) |
| Total (Overall) | 467 (52.9%) | 416 (47.1%) |
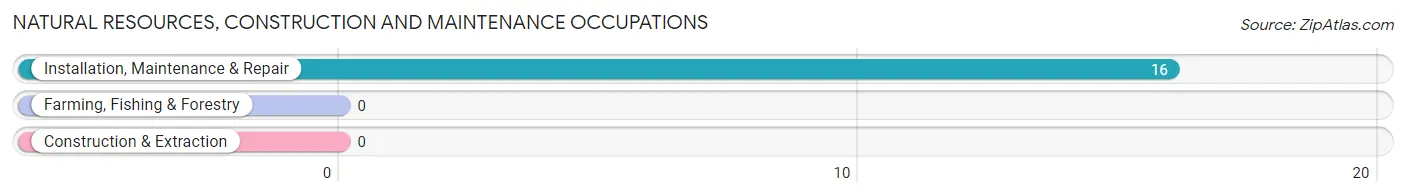
Natural Resources, Construction and Maintenance Occupations
The most common Natural Resources, Construction and Maintenance occupations in Shawsville are , and Installation, Maintenance & Repair (16 | 1.8%).
Natural Resources, Construction and Maintenance Occupations by Sex
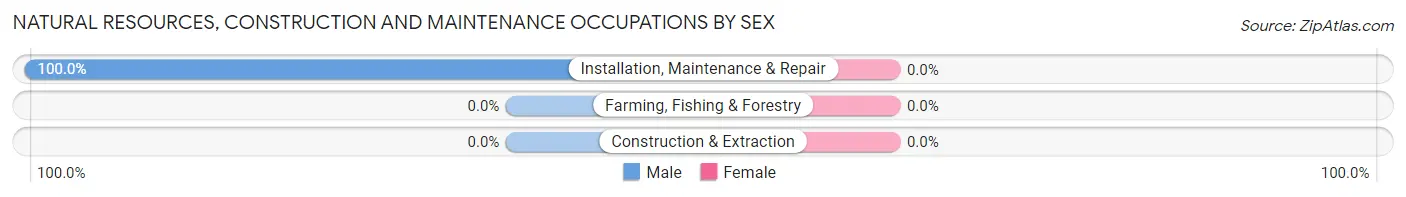
| Occupation | Male | Female |
| Farming, Fishing & Forestry | 0 (0.0%) | 0 (0.0%) |
| Construction & Extraction | 0 (0.0%) | 0 (0.0%) |
| Installation, Maintenance & Repair | 16 (100.0%) | 0 (0.0%) |
| Total (Category) | 16 (100.0%) | 0 (0.0%) |
| Total (Overall) | 467 (52.9%) | 416 (47.1%) |
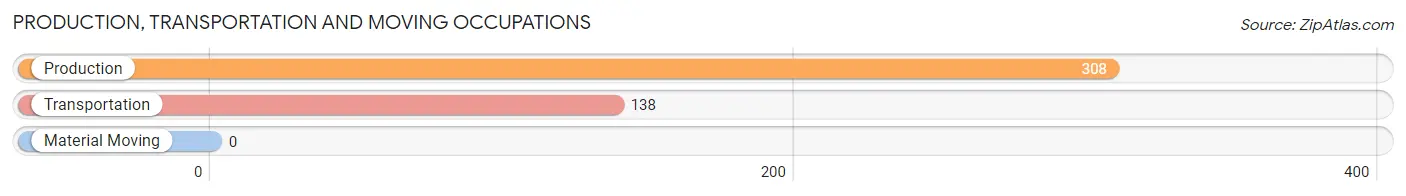
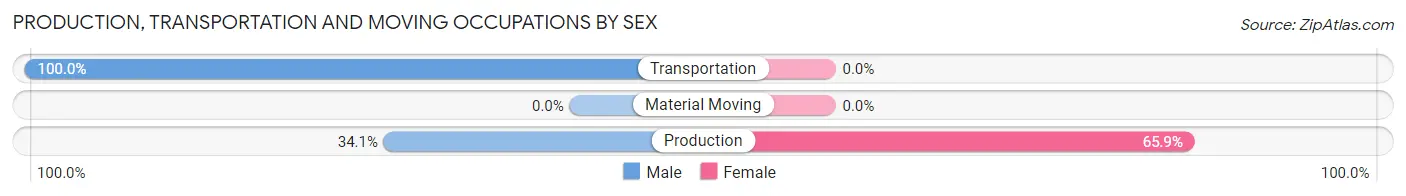
Production, Transportation and Moving Occupations
The most common Production, Transportation and Moving occupations in Shawsville are Production (308 | 34.9%), and Transportation (138 | 15.6%).
Production, Transportation and Moving Occupations by Sex
| Occupation | Male | Female |
| Production | 105 (34.1%) | 203 (65.9%) |
| Transportation | 138 (100.0%) | 0 (0.0%) |
| Material Moving | 0 (0.0%) | 0 (0.0%) |
| Total (Category) | 243 (54.5%) | 203 (45.5%) |
| Total (Overall) | 467 (52.9%) | 416 (47.1%) |
Employment Industries by Sex in Shawsville
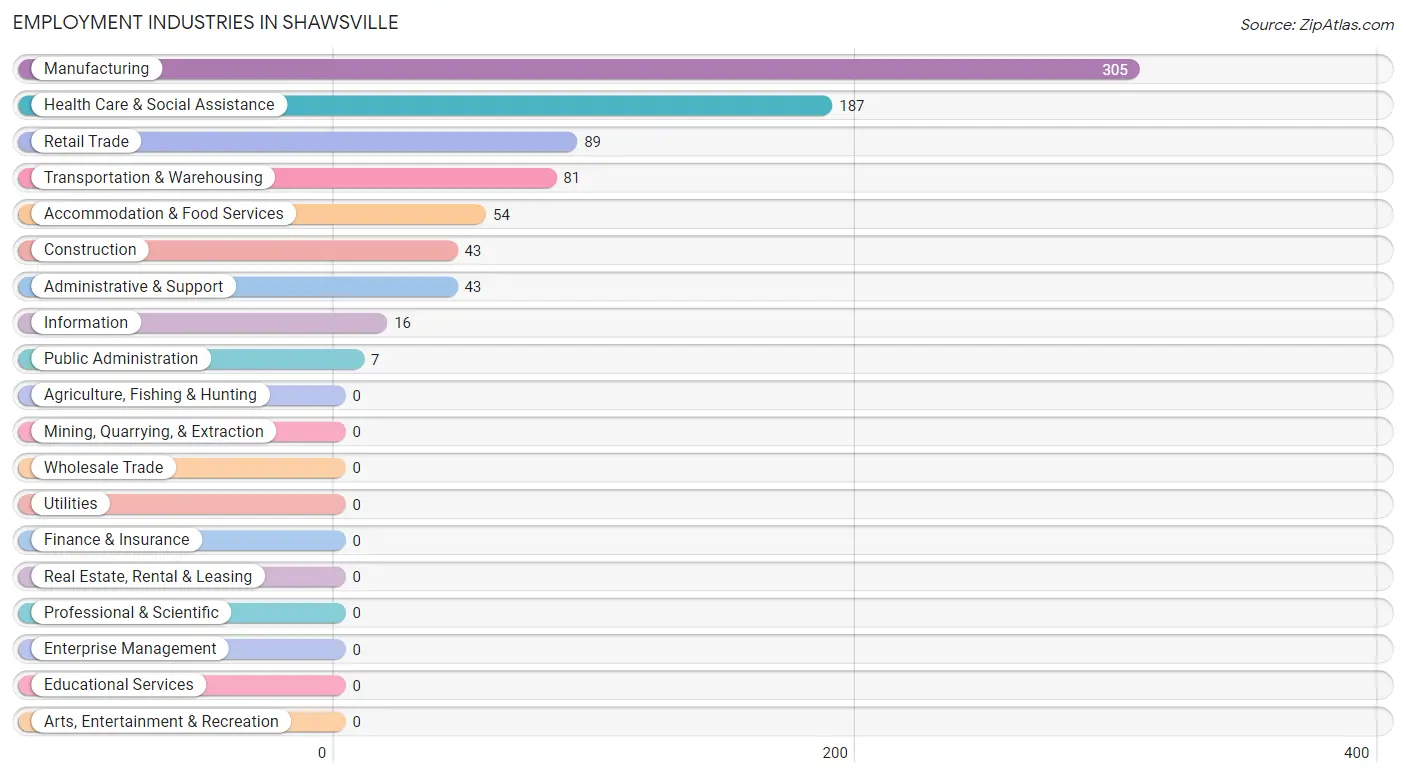
Employment Industries in Shawsville
The major employment industries in Shawsville include Manufacturing (305 | 34.5%), Health Care & Social Assistance (187 | 21.2%), Retail Trade (89 | 10.1%), Transportation & Warehousing (81 | 9.2%), and Accommodation & Food Services (54 | 6.1%).
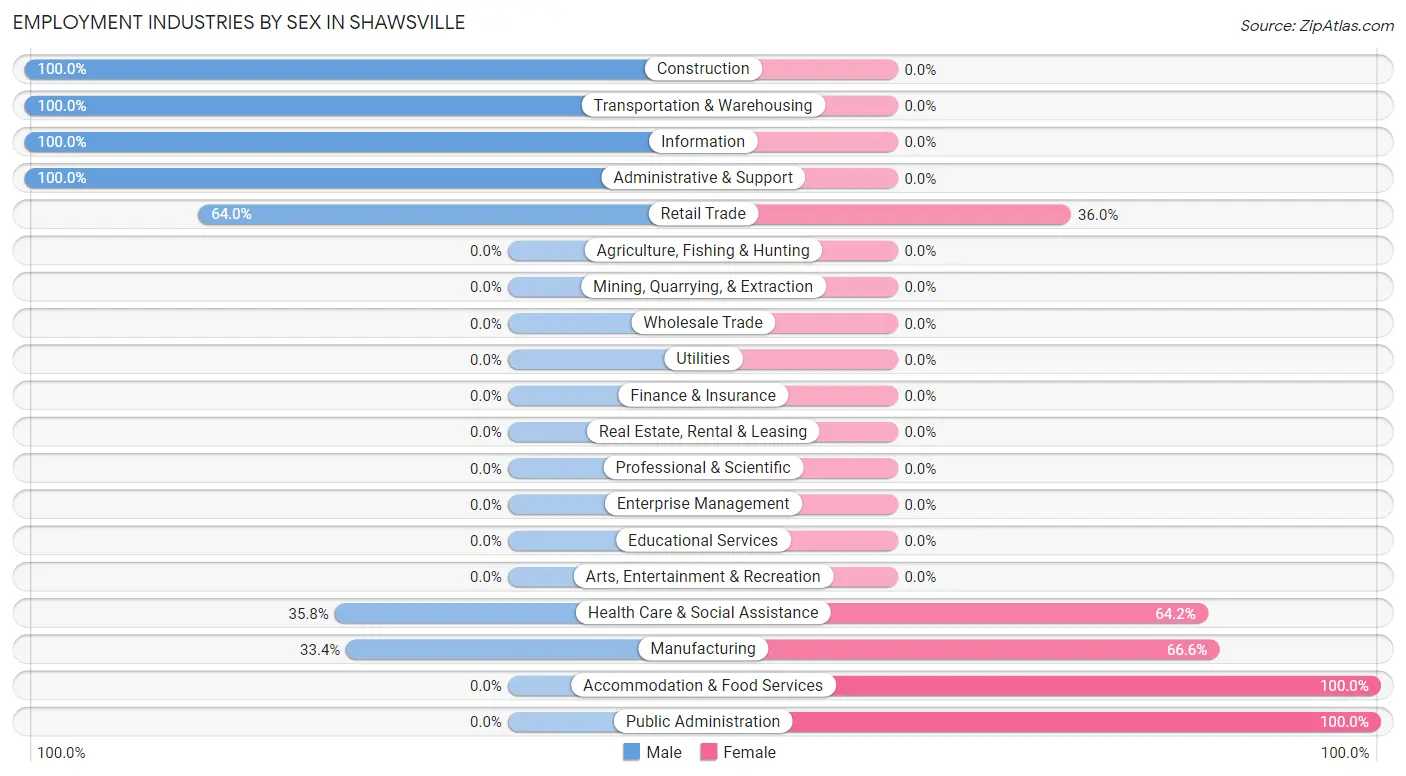
Employment Industries by Sex in Shawsville
The Shawsville industries that see more men than women are Construction (100.0%), Transportation & Warehousing (100.0%), and Information (100.0%), whereas the industries that tend to have a higher number of women are Accommodation & Food Services (100.0%), Public Administration (100.0%), and Manufacturing (66.6%).
| Industry | Male | Female |
| Agriculture, Fishing & Hunting | 0 (0.0%) | 0 (0.0%) |
| Mining, Quarrying, & Extraction | 0 (0.0%) | 0 (0.0%) |
| Construction | 43 (100.0%) | 0 (0.0%) |
| Manufacturing | 102 (33.4%) | 203 (66.6%) |
| Wholesale Trade | 0 (0.0%) | 0 (0.0%) |
| Retail Trade | 57 (64.0%) | 32 (36.0%) |
| Transportation & Warehousing | 81 (100.0%) | 0 (0.0%) |
| Utilities | 0 (0.0%) | 0 (0.0%) |
| Information | 16 (100.0%) | 0 (0.0%) |
| Finance & Insurance | 0 (0.0%) | 0 (0.0%) |
| Real Estate, Rental & Leasing | 0 (0.0%) | 0 (0.0%) |
| Professional & Scientific | 0 (0.0%) | 0 (0.0%) |
| Enterprise Management | 0 (0.0%) | 0 (0.0%) |
| Administrative & Support | 43 (100.0%) | 0 (0.0%) |
| Educational Services | 0 (0.0%) | 0 (0.0%) |
| Health Care & Social Assistance | 67 (35.8%) | 120 (64.2%) |
| Arts, Entertainment & Recreation | 0 (0.0%) | 0 (0.0%) |
| Accommodation & Food Services | 0 (0.0%) | 54 (100.0%) |
| Public Administration | 0 (0.0%) | 7 (100.0%) |
| Total | 467 (52.9%) | 416 (47.1%) |
Education in Shawsville
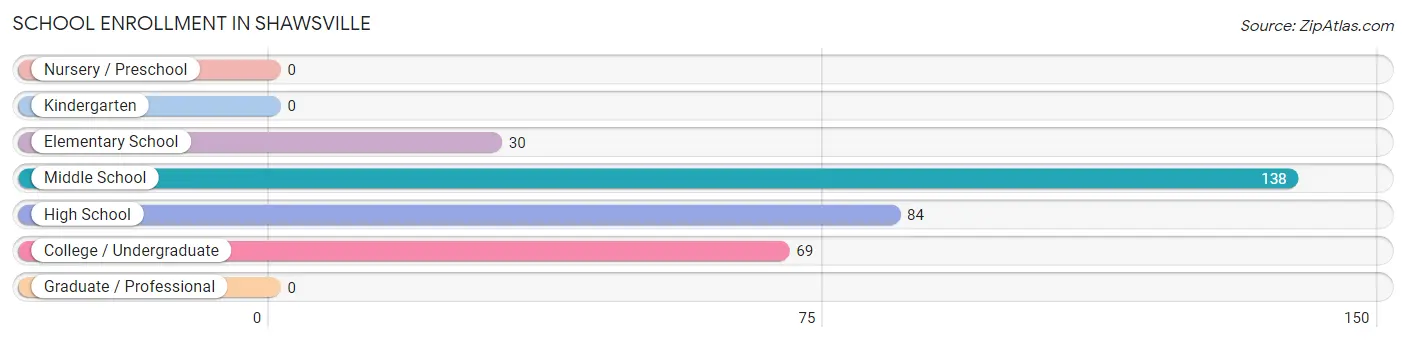
School Enrollment in Shawsville
The most common levels of schooling among the 321 students in Shawsville are middle school (138 | 43.0%), high school (84 | 26.2%), and college / undergraduate (69 | 21.5%).
| School Level | # Students | % Students |
| Nursery / Preschool | 0 | 0.0% |
| Kindergarten | 0 | 0.0% |
| Elementary School | 30 | 9.3% |
| Middle School | 138 | 43.0% |
| High School | 84 | 26.2% |
| College / Undergraduate | 69 | 21.5% |
| Graduate / Professional | 0 | 0.0% |
| Total | 321 | 100.0% |
School Enrollment by Age by Funding Source in Shawsville
Out of a total of 321 students who are enrolled in schools in Shawsville, 30 (9.3%) attend a private institution, while the remaining 291 (90.7%) are enrolled in public schools. The age group of 5 to 9 year old has the highest likelihood of being enrolled in private schools, with 22 (100.0% in the age bracket) enrolled. Conversely, the age group of 15 to 17 year olds has the lowest likelihood of being enrolled in a private school, with 15 (100.0% in the age bracket) attending a public institution.
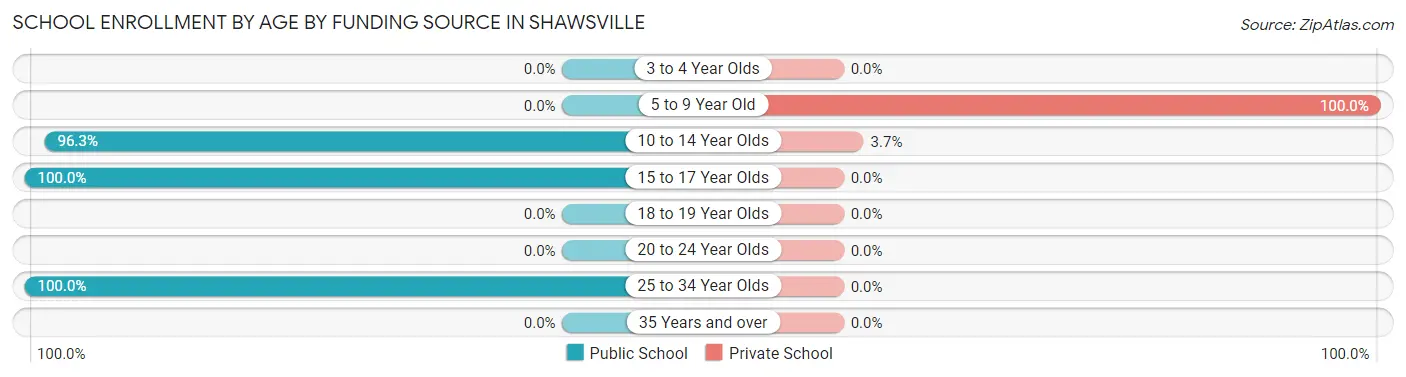
| Age Bracket | Public School | Private School |
| 3 to 4 Year Olds | 0 (0.0%) | 0 (0.0%) |
| 5 to 9 Year Old | 0 (0.0%) | 22 (100.0%) |
| 10 to 14 Year Olds | 207 (96.3%) | 8 (3.7%) |
| 15 to 17 Year Olds | 15 (100.0%) | 0 (0.0%) |
| 18 to 19 Year Olds | 0 (0.0%) | 0 (0.0%) |
| 20 to 24 Year Olds | 0 (0.0%) | 0 (0.0%) |
| 25 to 34 Year Olds | 69 (100.0%) | 0 (0.0%) |
| 35 Years and over | 0 (0.0%) | 0 (0.0%) |
| Total | 291 (90.7%) | 30 (9.3%) |
Educational Attainment by Field of Study in Shawsville
Science & technology (67 | 63.8%), education (31 | 29.5%), and psychology (7 | 6.7%) are the most common fields of study among 105 individuals in Shawsville who have obtained a bachelor's degree or higher.
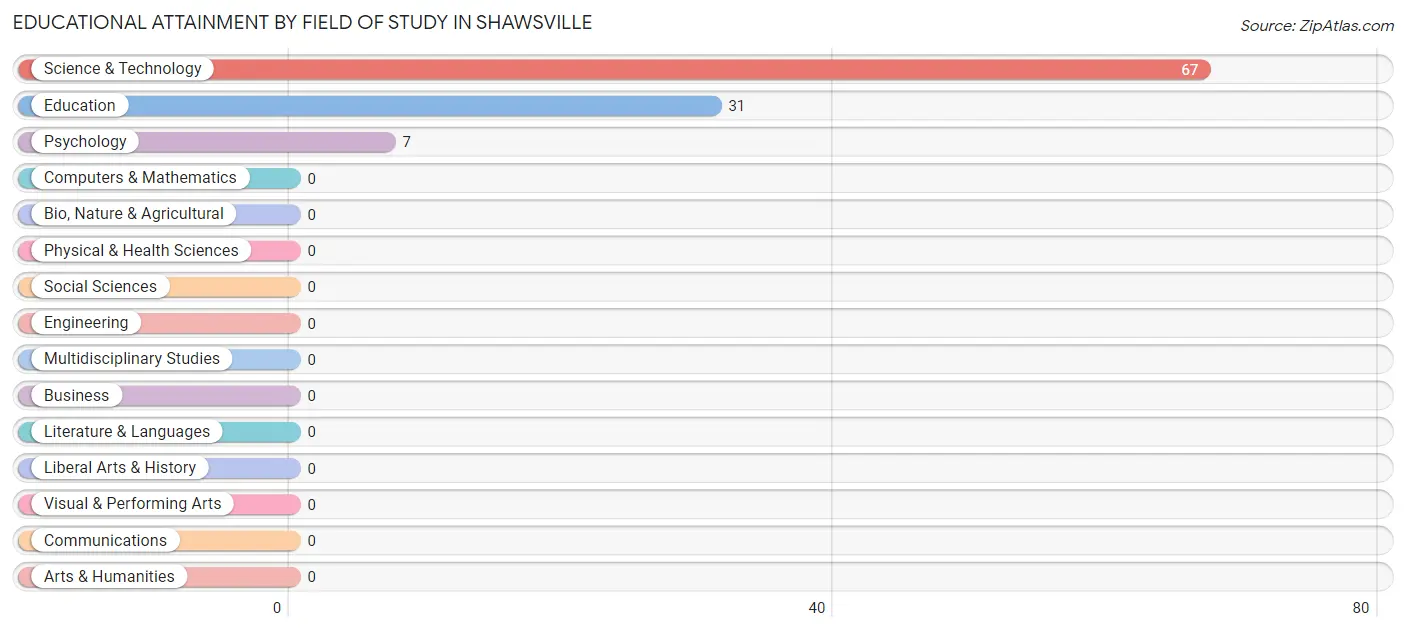
| Field of Study | # Graduates | % Graduates |
| Computers & Mathematics | 0 | 0.0% |
| Bio, Nature & Agricultural | 0 | 0.0% |
| Physical & Health Sciences | 0 | 0.0% |
| Psychology | 7 | 6.7% |
| Social Sciences | 0 | 0.0% |
| Engineering | 0 | 0.0% |
| Multidisciplinary Studies | 0 | 0.0% |
| Science & Technology | 67 | 63.8% |
| Business | 0 | 0.0% |
| Education | 31 | 29.5% |
| Literature & Languages | 0 | 0.0% |
| Liberal Arts & History | 0 | 0.0% |
| Visual & Performing Arts | 0 | 0.0% |
| Communications | 0 | 0.0% |
| Arts & Humanities | 0 | 0.0% |
| Total | 105 | 100.0% |
Transportation & Commute in Shawsville
Vehicle Availability by Sex in Shawsville
The most prevalent vehicle ownership categories in Shawsville are males with 2 vehicles (242, accounting for 51.8%) and females with 2 vehicles (295, making up 58.2%).
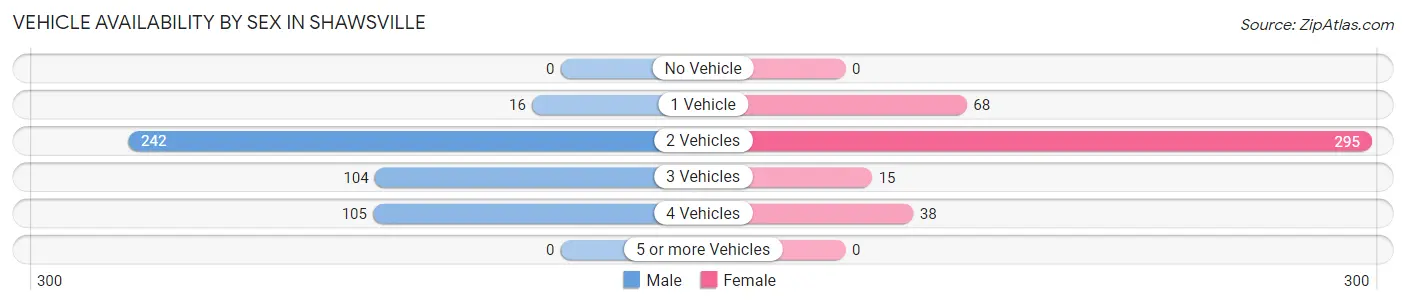
| Vehicles Available | Male | Female |
| No Vehicle | 0 (0.0%) | 0 (0.0%) |
| 1 Vehicle | 16 (3.4%) | 68 (16.4%) |
| 2 Vehicles | 242 (51.8%) | 295 (70.9%) |
| 3 Vehicles | 104 (22.3%) | 15 (3.6%) |
| 4 Vehicles | 105 (22.5%) | 38 (9.1%) |
| 5 or more Vehicles | 0 (0.0%) | 0 (0.0%) |
| Total | 467 (100.0%) | 416 (100.0%) |
Commute Time in Shawsville
The most frequently occuring commute durations in Shawsville are 25 to 29 minutes (221 commuters, 25.5%), 20 to 24 minutes (179 commuters, 20.7%), and 15 to 19 minutes (152 commuters, 17.5%).
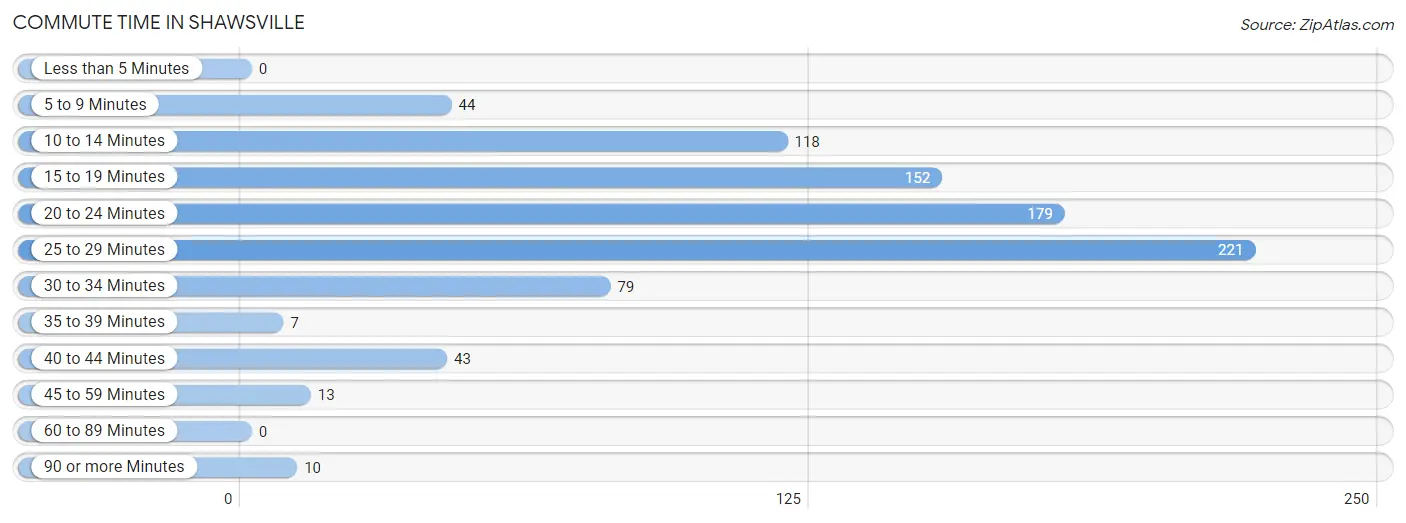
| Commute Time | # Commuters | % Commuters |
| Less than 5 Minutes | 0 | 0.0% |
| 5 to 9 Minutes | 44 | 5.1% |
| 10 to 14 Minutes | 118 | 13.6% |
| 15 to 19 Minutes | 152 | 17.5% |
| 20 to 24 Minutes | 179 | 20.7% |
| 25 to 29 Minutes | 221 | 25.5% |
| 30 to 34 Minutes | 79 | 9.1% |
| 35 to 39 Minutes | 7 | 0.8% |
| 40 to 44 Minutes | 43 | 5.0% |
| 45 to 59 Minutes | 13 | 1.5% |
| 60 to 89 Minutes | 0 | 0.0% |
| 90 or more Minutes | 10 | 1.1% |
Commute Time by Sex in Shawsville
The most common commute times in Shawsville are 20 to 24 minutes (164 commuters, 35.1%) for males and 25 to 29 minutes (221 commuters, 55.4%) for females.
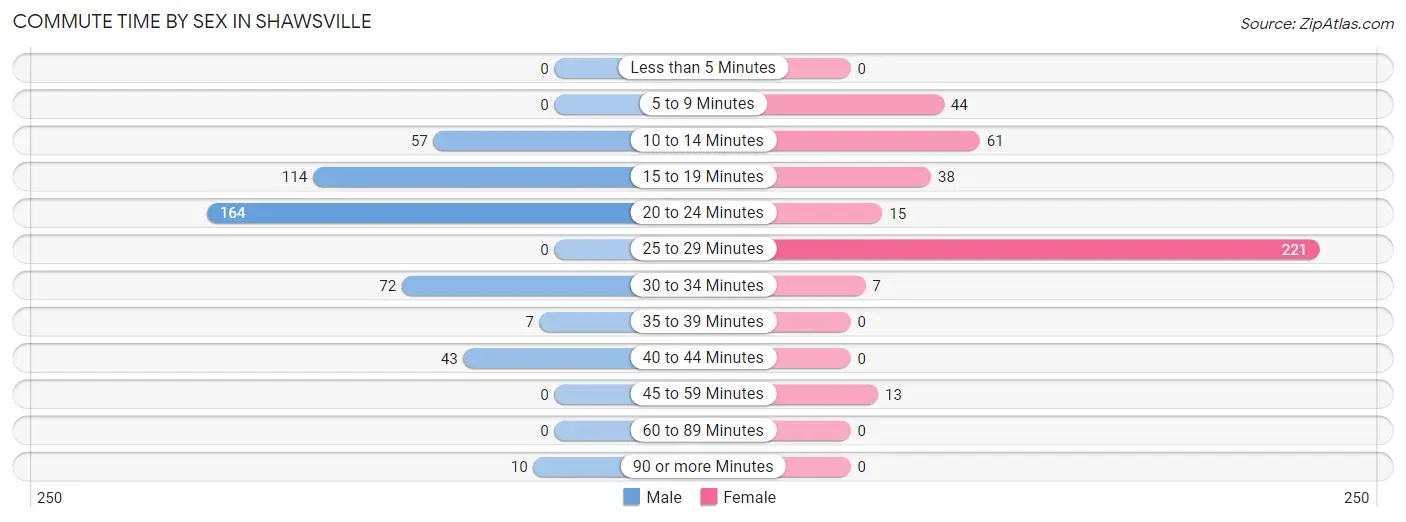
| Commute Time | Male | Female |
| Less than 5 Minutes | 0 (0.0%) | 0 (0.0%) |
| 5 to 9 Minutes | 0 (0.0%) | 44 (11.0%) |
| 10 to 14 Minutes | 57 (12.2%) | 61 (15.3%) |
| 15 to 19 Minutes | 114 (24.4%) | 38 (9.5%) |
| 20 to 24 Minutes | 164 (35.1%) | 15 (3.8%) |
| 25 to 29 Minutes | 0 (0.0%) | 221 (55.4%) |
| 30 to 34 Minutes | 72 (15.4%) | 7 (1.8%) |
| 35 to 39 Minutes | 7 (1.5%) | 0 (0.0%) |
| 40 to 44 Minutes | 43 (9.2%) | 0 (0.0%) |
| 45 to 59 Minutes | 0 (0.0%) | 13 (3.3%) |
| 60 to 89 Minutes | 0 (0.0%) | 0 (0.0%) |
| 90 or more Minutes | 10 (2.1%) | 0 (0.0%) |
Time of Departure to Work by Sex in Shawsville
The most frequent times of departure to work in Shawsville are 7:00 AM to 7:29 AM (148, 31.7%) for males and 7:00 AM to 7:29 AM (210, 52.6%) for females.
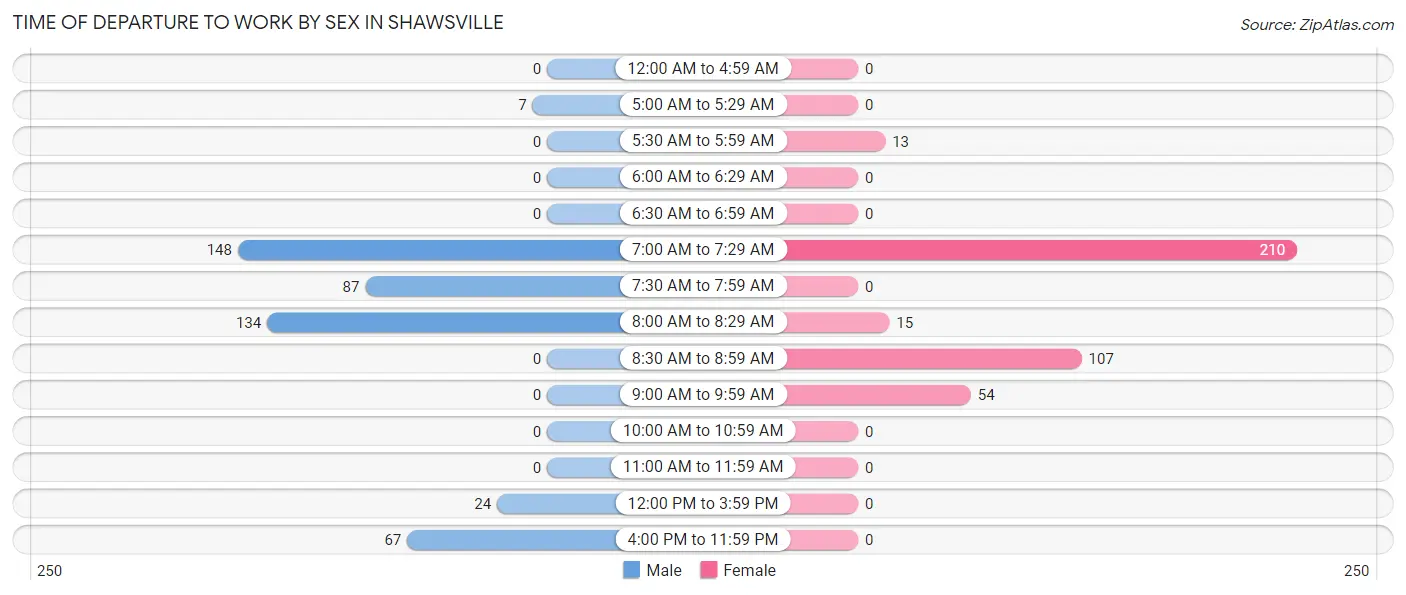
| Time of Departure | Male | Female |
| 12:00 AM to 4:59 AM | 0 (0.0%) | 0 (0.0%) |
| 5:00 AM to 5:29 AM | 7 (1.5%) | 0 (0.0%) |
| 5:30 AM to 5:59 AM | 0 (0.0%) | 13 (3.3%) |
| 6:00 AM to 6:29 AM | 0 (0.0%) | 0 (0.0%) |
| 6:30 AM to 6:59 AM | 0 (0.0%) | 0 (0.0%) |
| 7:00 AM to 7:29 AM | 148 (31.7%) | 210 (52.6%) |
| 7:30 AM to 7:59 AM | 87 (18.6%) | 0 (0.0%) |
| 8:00 AM to 8:29 AM | 134 (28.7%) | 15 (3.8%) |
| 8:30 AM to 8:59 AM | 0 (0.0%) | 107 (26.8%) |
| 9:00 AM to 9:59 AM | 0 (0.0%) | 54 (13.5%) |
| 10:00 AM to 10:59 AM | 0 (0.0%) | 0 (0.0%) |
| 11:00 AM to 11:59 AM | 0 (0.0%) | 0 (0.0%) |
| 12:00 PM to 3:59 PM | 24 (5.1%) | 0 (0.0%) |
| 4:00 PM to 11:59 PM | 67 (14.3%) | 0 (0.0%) |
| Total | 467 (100.0%) | 399 (100.0%) |
Housing Occupancy in Shawsville
Occupancy by Ownership in Shawsville
Of the total 518 dwellings in Shawsville, owner-occupied units account for 451 (87.1%), while renter-occupied units make up 67 (12.9%).
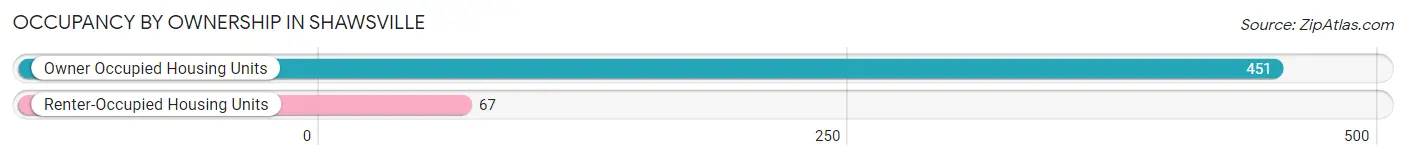
| Occupancy | # Housing Units | % Housing Units |
| Owner Occupied Housing Units | 451 | 87.1% |
| Renter-Occupied Housing Units | 67 | 12.9% |
| Total Occupied Housing Units | 518 | 100.0% |
Occupancy by Household Size in Shawsville
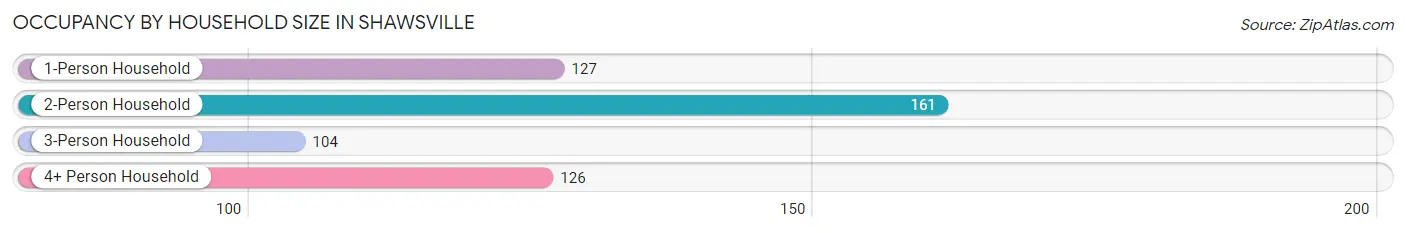
| Household Size | # Housing Units | % Housing Units |
| 1-Person Household | 127 | 24.5% |
| 2-Person Household | 161 | 31.1% |
| 3-Person Household | 104 | 20.1% |
| 4+ Person Household | 126 | 24.3% |
| Total Housing Units | 518 | 100.0% |
Occupancy by Ownership by Household Size in Shawsville
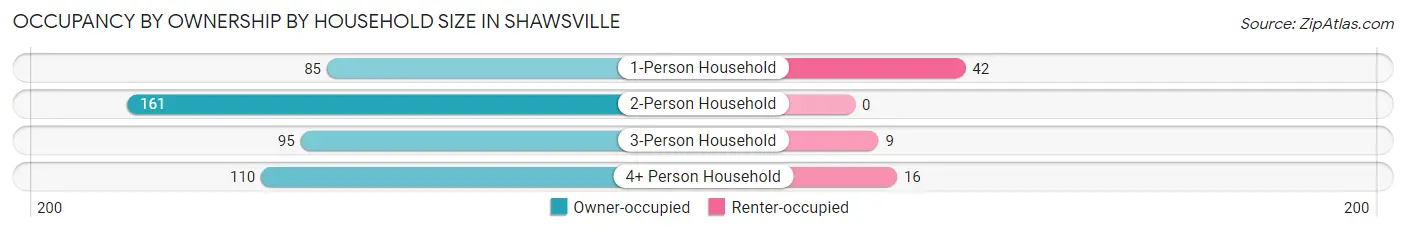
| Household Size | Owner-occupied | Renter-occupied |
| 1-Person Household | 85 (66.9%) | 42 (33.1%) |
| 2-Person Household | 161 (100.0%) | 0 (0.0%) |
| 3-Person Household | 95 (91.3%) | 9 (8.6%) |
| 4+ Person Household | 110 (87.3%) | 16 (12.7%) |
| Total Housing Units | 451 (87.1%) | 67 (12.9%) |
Occupancy by Educational Attainment in Shawsville
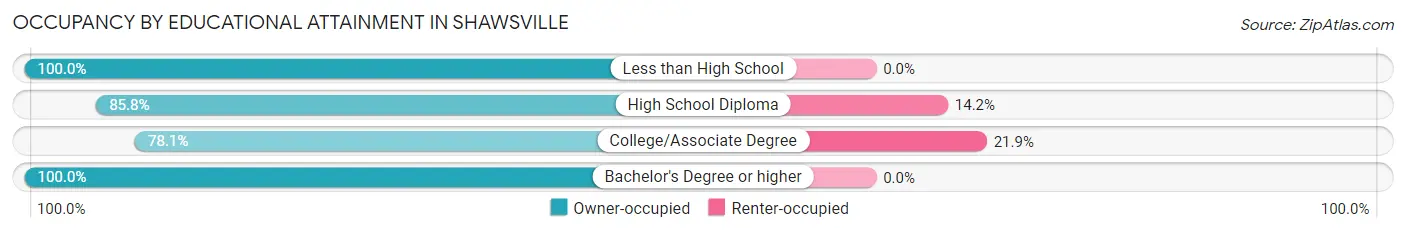
| Household Size | Owner-occupied | Renter-occupied |
| Less than High School | 63 (100.0%) | 0 (0.0%) |
| High School Diploma | 308 (85.8%) | 51 (14.2%) |
| College/Associate Degree | 57 (78.1%) | 16 (21.9%) |
| Bachelor's Degree or higher | 23 (100.0%) | 0 (0.0%) |
Occupancy by Age of Householder in Shawsville
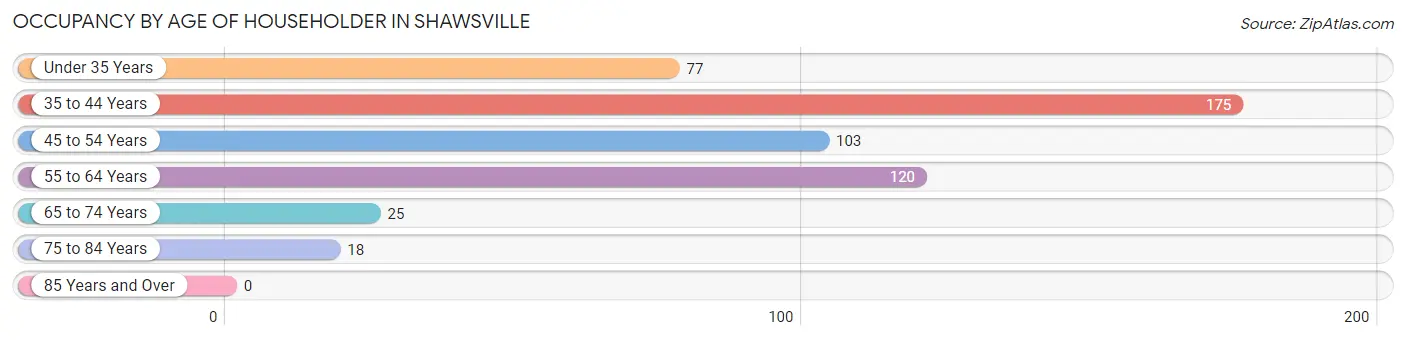
| Age Bracket | # Households | % Households |
| Under 35 Years | 77 | 14.9% |
| 35 to 44 Years | 175 | 33.8% |
| 45 to 54 Years | 103 | 19.9% |
| 55 to 64 Years | 120 | 23.2% |
| 65 to 74 Years | 25 | 4.8% |
| 75 to 84 Years | 18 | 3.5% |
| 85 Years and Over | 0 | 0.0% |
| Total | 518 | 100.0% |
Housing Finances in Shawsville
Median Income by Occupancy in Shawsville
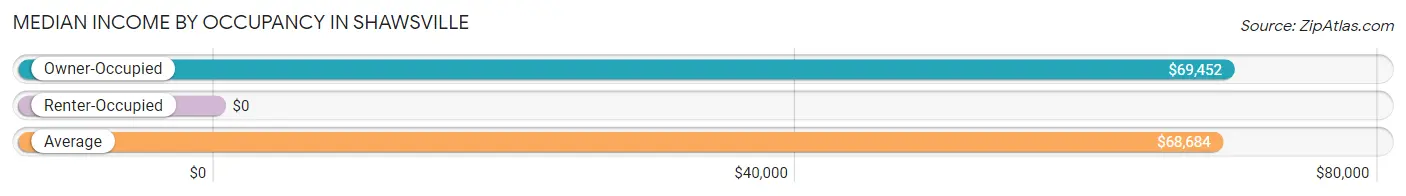
| Occupancy Type | # Households | Median Income |
| Owner-Occupied | 451 (87.1%) | $69,452 |
| Renter-Occupied | 67 (12.9%) | $0 |
| Average | 518 (100.0%) | $68,684 |
Occupancy by Householder Income Bracket in Shawsville
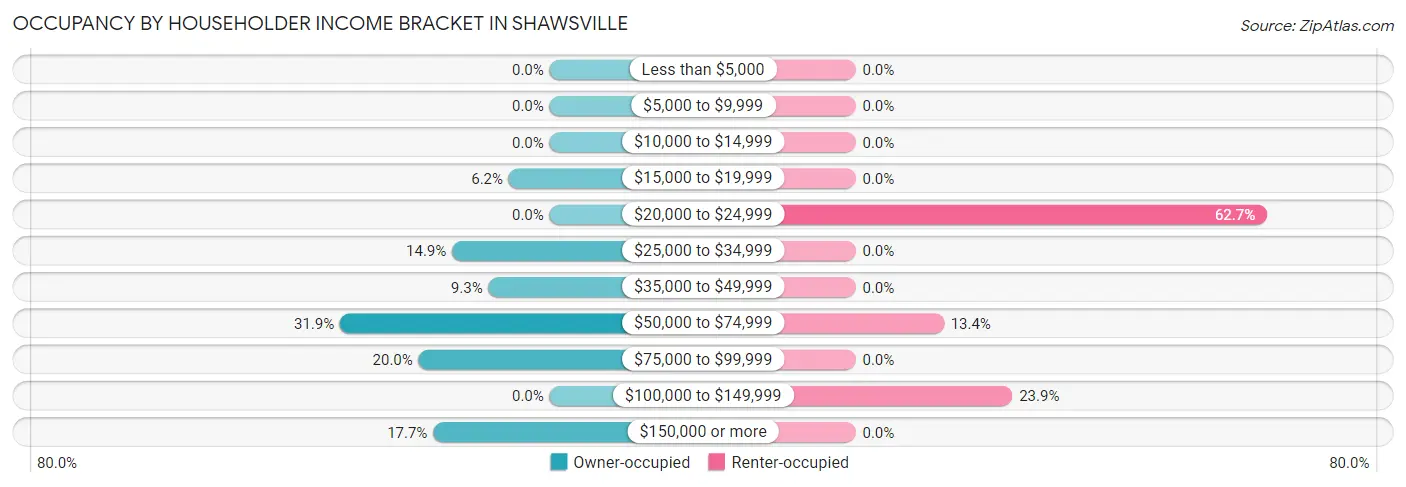
| Income Bracket | Owner-occupied | Renter-occupied |
| Less than $5,000 | 0 (0.0%) | 0 (0.0%) |
| $5,000 to $9,999 | 0 (0.0%) | 0 (0.0%) |
| $10,000 to $14,999 | 0 (0.0%) | 0 (0.0%) |
| $15,000 to $19,999 | 28 (6.2%) | 0 (0.0%) |
| $20,000 to $24,999 | 0 (0.0%) | 42 (62.7%) |
| $25,000 to $34,999 | 67 (14.9%) | 0 (0.0%) |
| $35,000 to $49,999 | 42 (9.3%) | 0 (0.0%) |
| $50,000 to $74,999 | 144 (31.9%) | 9 (13.4%) |
| $75,000 to $99,999 | 90 (20.0%) | 0 (0.0%) |
| $100,000 to $149,999 | 0 (0.0%) | 16 (23.9%) |
| $150,000 or more | 80 (17.7%) | 0 (0.0%) |
| Total | 451 (100.0%) | 67 (100.0%) |
Monthly Housing Cost Tiers in Shawsville
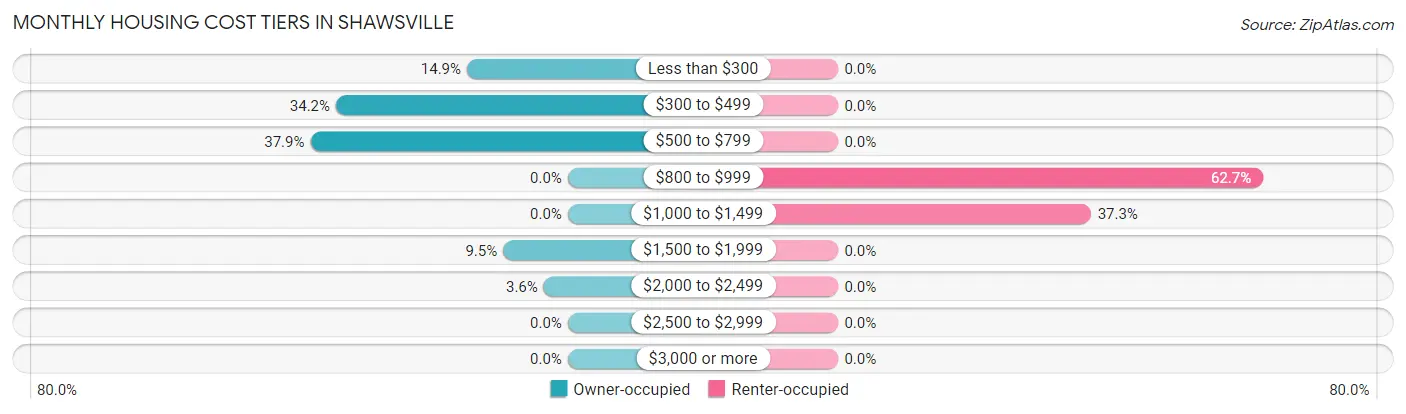
| Monthly Cost | Owner-occupied | Renter-occupied |
| Less than $300 | 67 (14.9%) | 0 (0.0%) |
| $300 to $499 | 154 (34.2%) | 0 (0.0%) |
| $500 to $799 | 171 (37.9%) | 0 (0.0%) |
| $800 to $999 | 0 (0.0%) | 42 (62.7%) |
| $1,000 to $1,499 | 0 (0.0%) | 25 (37.3%) |
| $1,500 to $1,999 | 43 (9.5%) | 0 (0.0%) |
| $2,000 to $2,499 | 16 (3.5%) | 0 (0.0%) |
| $2,500 to $2,999 | 0 (0.0%) | 0 (0.0%) |
| $3,000 or more | 0 (0.0%) | 0 (0.0%) |
| Total | 451 (100.0%) | 67 (100.0%) |
Physical Housing Characteristics in Shawsville
Housing Structures in Shawsville
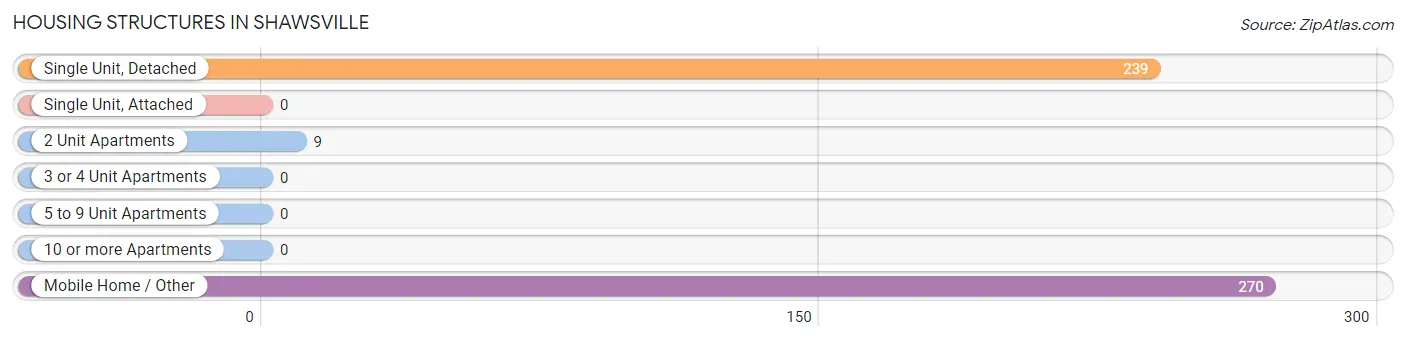
| Structure Type | # Housing Units | % Housing Units |
| Single Unit, Detached | 239 | 46.1% |
| Single Unit, Attached | 0 | 0.0% |
| 2 Unit Apartments | 9 | 1.7% |
| 3 or 4 Unit Apartments | 0 | 0.0% |
| 5 to 9 Unit Apartments | 0 | 0.0% |
| 10 or more Apartments | 0 | 0.0% |
| Mobile Home / Other | 270 | 52.1% |
| Total | 518 | 100.0% |
Housing Structures by Occupancy in Shawsville
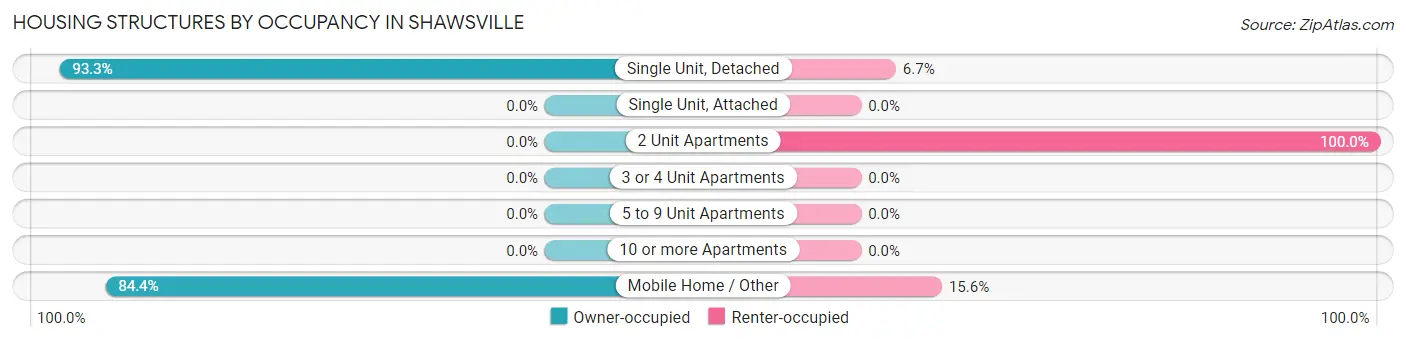
| Structure Type | Owner-occupied | Renter-occupied |
| Single Unit, Detached | 223 (93.3%) | 16 (6.7%) |
| Single Unit, Attached | 0 (0.0%) | 0 (0.0%) |
| 2 Unit Apartments | 0 (0.0%) | 9 (100.0%) |
| 3 or 4 Unit Apartments | 0 (0.0%) | 0 (0.0%) |
| 5 to 9 Unit Apartments | 0 (0.0%) | 0 (0.0%) |
| 10 or more Apartments | 0 (0.0%) | 0 (0.0%) |
| Mobile Home / Other | 228 (84.4%) | 42 (15.6%) |
| Total | 451 (87.1%) | 67 (12.9%) |
Housing Structures by Number of Rooms in Shawsville
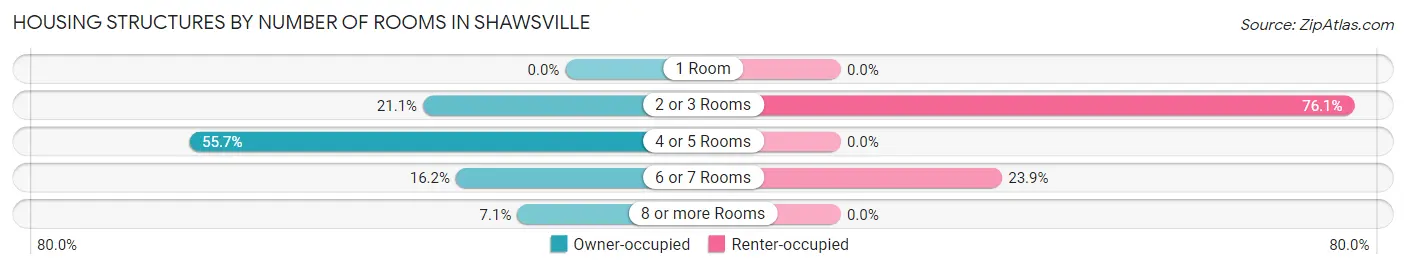
| Number of Rooms | Owner-occupied | Renter-occupied |
| 1 Room | 0 (0.0%) | 0 (0.0%) |
| 2 or 3 Rooms | 95 (21.1%) | 51 (76.1%) |
| 4 or 5 Rooms | 251 (55.6%) | 0 (0.0%) |
| 6 or 7 Rooms | 73 (16.2%) | 16 (23.9%) |
| 8 or more Rooms | 32 (7.1%) | 0 (0.0%) |
| Total | 451 (100.0%) | 67 (100.0%) |
Housing Structure by Heating Type in Shawsville
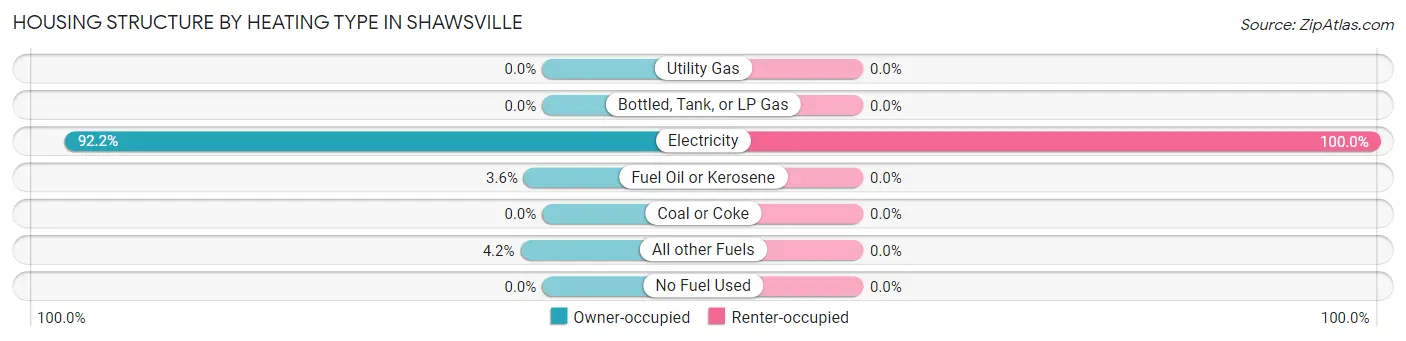
| Heating Type | Owner-occupied | Renter-occupied |
| Utility Gas | 0 (0.0%) | 0 (0.0%) |
| Bottled, Tank, or LP Gas | 0 (0.0%) | 0 (0.0%) |
| Electricity | 416 (92.2%) | 67 (100.0%) |
| Fuel Oil or Kerosene | 16 (3.5%) | 0 (0.0%) |
| Coal or Coke | 0 (0.0%) | 0 (0.0%) |
| All other Fuels | 19 (4.2%) | 0 (0.0%) |
| No Fuel Used | 0 (0.0%) | 0 (0.0%) |
| Total | 451 (100.0%) | 67 (100.0%) |
Household Vehicle Usage in Shawsville
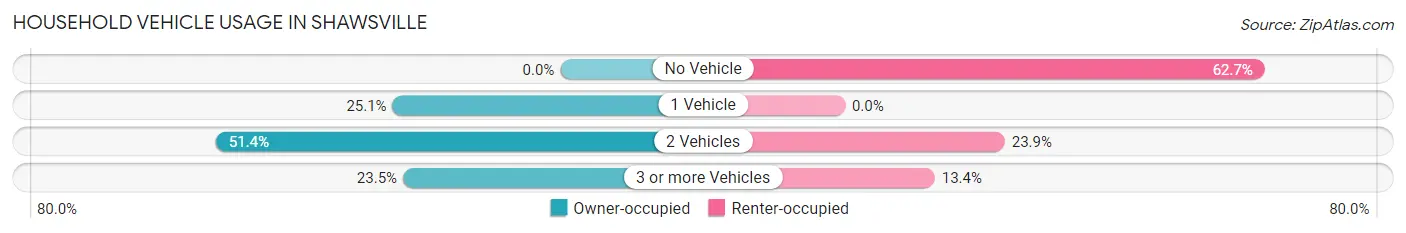
| Vehicles per Household | Owner-occupied | Renter-occupied |
| No Vehicle | 0 (0.0%) | 42 (62.7%) |
| 1 Vehicle | 113 (25.1%) | 0 (0.0%) |
| 2 Vehicles | 232 (51.4%) | 16 (23.9%) |
| 3 or more Vehicles | 106 (23.5%) | 9 (13.4%) |
| Total | 451 (100.0%) | 67 (100.0%) |
Real Estate & Mortgages in Shawsville
Real Estate and Mortgage Overview in Shawsville
| Characteristic | Without Mortgage | With Mortgage |
| Housing Units | 265 | 186 |
| Median Property Value | - | - |
| Median Household Income | $60,767 | $35 |
| Monthly Housing Costs | $365 | $0 |
| Real Estate Taxes | $1,092 | $19 |
Property Value by Mortgage Status in Shawsville
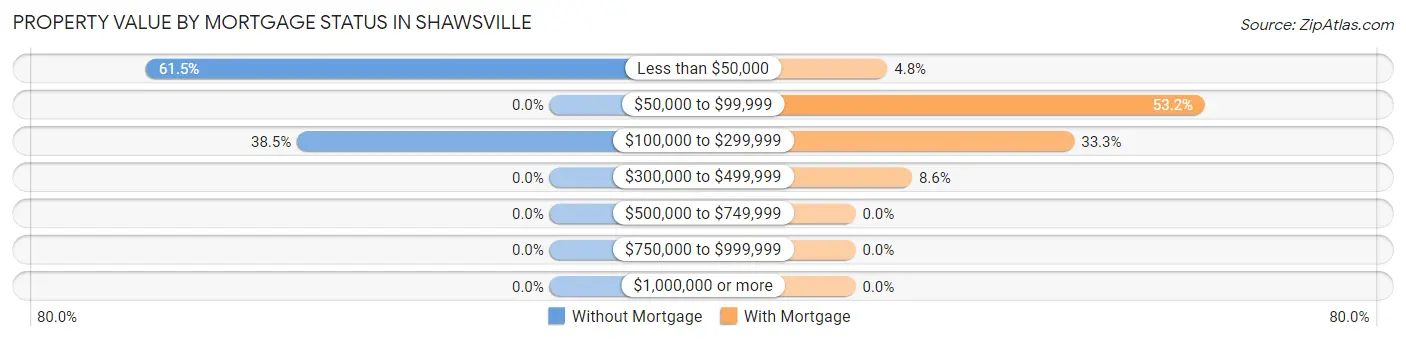
| Property Value | Without Mortgage | With Mortgage |
| Less than $50,000 | 163 (61.5%) | 9 (4.8%) |
| $50,000 to $99,999 | 0 (0.0%) | 99 (53.2%) |
| $100,000 to $299,999 | 102 (38.5%) | 62 (33.3%) |
| $300,000 to $499,999 | 0 (0.0%) | 16 (8.6%) |
| $500,000 to $749,999 | 0 (0.0%) | 0 (0.0%) |
| $750,000 to $999,999 | 0 (0.0%) | 0 (0.0%) |
| $1,000,000 or more | 0 (0.0%) | 0 (0.0%) |
| Total | 265 (100.0%) | 186 (100.0%) |
Household Income by Mortgage Status in Shawsville
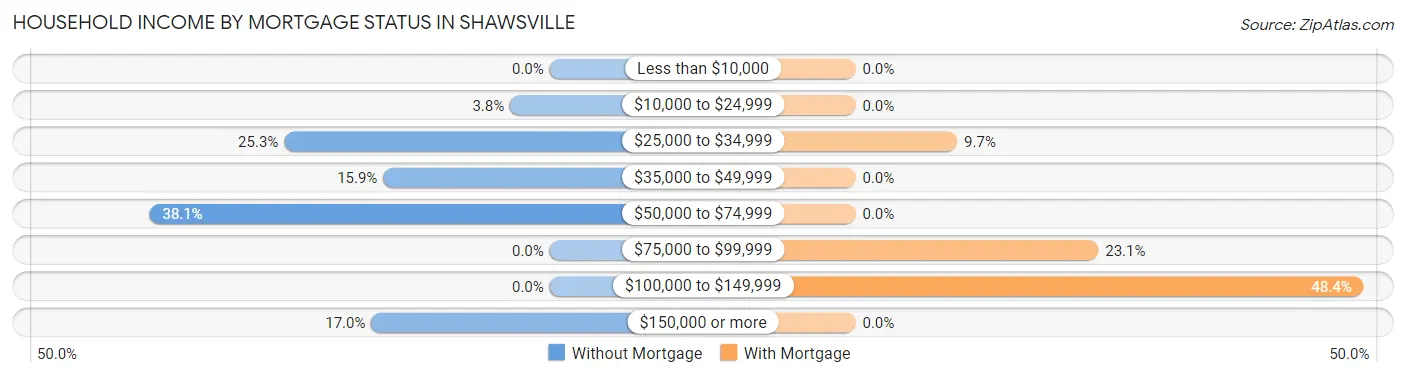
| Household Income | Without Mortgage | With Mortgage |
| Less than $10,000 | 0 (0.0%) | 0 (0.0%) |
| $10,000 to $24,999 | 10 (3.8%) | 0 (0.0%) |
| $25,000 to $34,999 | 67 (25.3%) | 18 (9.7%) |
| $35,000 to $49,999 | 42 (15.9%) | 0 (0.0%) |
| $50,000 to $74,999 | 101 (38.1%) | 0 (0.0%) |
| $75,000 to $99,999 | 0 (0.0%) | 43 (23.1%) |
| $100,000 to $149,999 | 0 (0.0%) | 90 (48.4%) |
| $150,000 or more | 45 (17.0%) | 0 (0.0%) |
| Total | 265 (100.0%) | 186 (100.0%) |
Property Value to Household Income Ratio in Shawsville
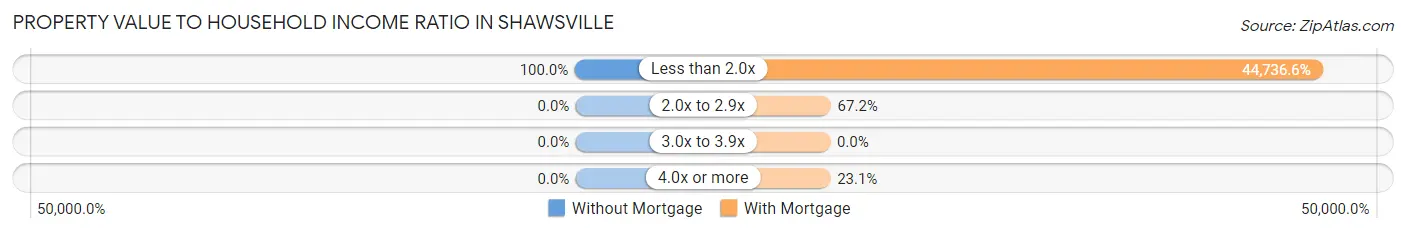
| Value-to-Income Ratio | Without Mortgage | With Mortgage |
| Less than 2.0x | 265 (100.0%) | 83,210 (44,736.6%) |
| 2.0x to 2.9x | 0 (0.0%) | 125 (67.2%) |
| 3.0x to 3.9x | 0 (0.0%) | 0 (0.0%) |
| 4.0x or more | 0 (0.0%) | 43 (23.1%) |
| Total | 265 (100.0%) | 186 (100.0%) |
Real Estate Taxes by Mortgage Status in Shawsville
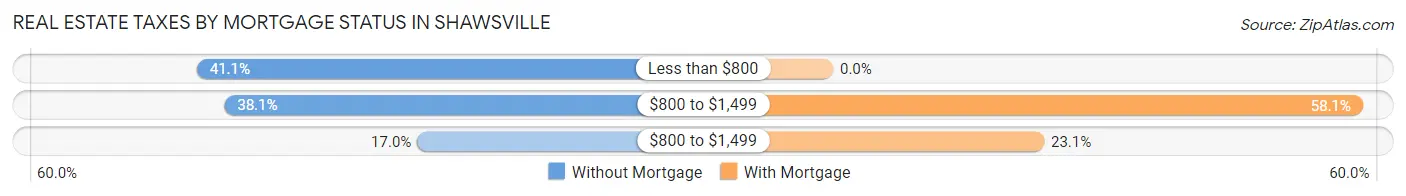
| Property Taxes | Without Mortgage | With Mortgage |
| Less than $800 | 109 (41.1%) | 0 (0.0%) |
| $800 to $1,499 | 101 (38.1%) | 108 (58.1%) |
| $800 to $1,499 | 45 (17.0%) | 43 (23.1%) |
| Total | 265 (100.0%) | 186 (100.0%) |
Health & Disability in Shawsville
Health Insurance Coverage by Age in Shawsville
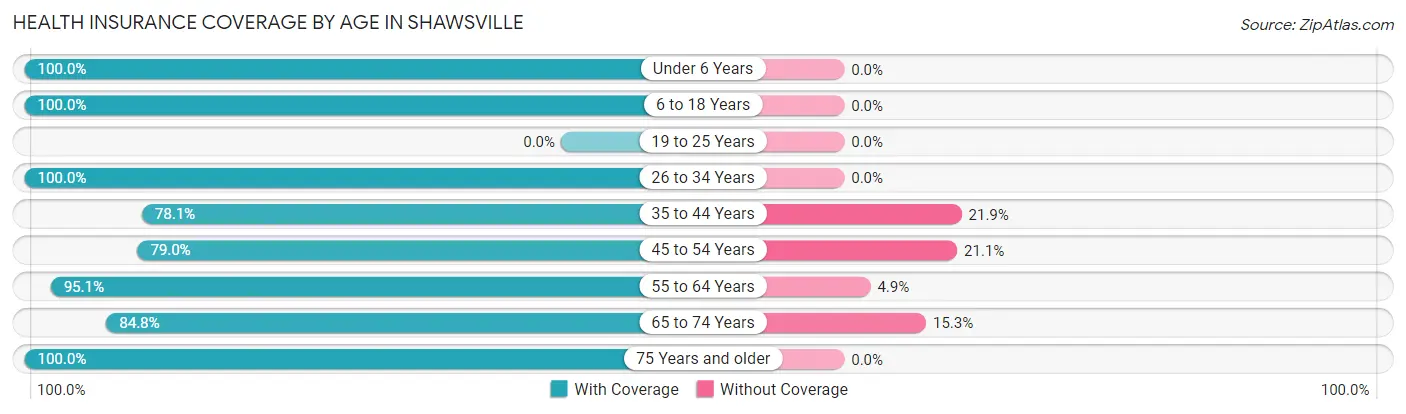
| Age Bracket | With Coverage | Without Coverage |
| Under 6 Years | 38 (100.0%) | 0 (0.0%) |
| 6 to 18 Years | 263 (100.0%) | 0 (0.0%) |
| 19 to 25 Years | 0 (0.0%) | 0 (0.0%) |
| 26 to 34 Years | 422 (100.0%) | 0 (0.0%) |
| 35 to 44 Years | 150 (78.1%) | 42 (21.9%) |
| 45 to 54 Years | 165 (78.9%) | 44 (21.0%) |
| 55 to 64 Years | 312 (95.1%) | 16 (4.9%) |
| 65 to 74 Years | 50 (84.8%) | 9 (15.2%) |
| 75 Years and older | 18 (100.0%) | 0 (0.0%) |
| Total | 1,418 (92.7%) | 111 (7.3%) |
Health Insurance Coverage by Citizenship Status in Shawsville
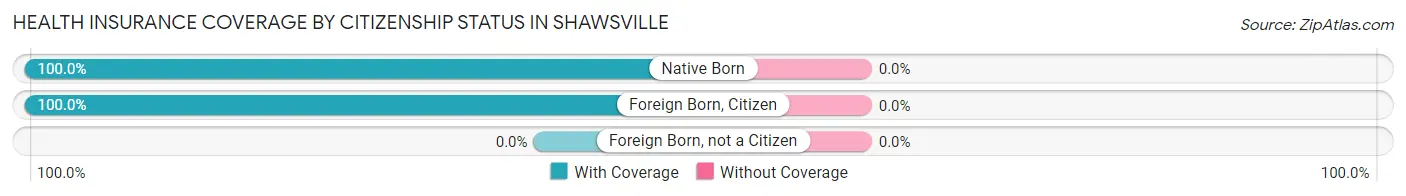
| Citizenship Status | With Coverage | Without Coverage |
| Native Born | 38 (100.0%) | 0 (0.0%) |
| Foreign Born, Citizen | 263 (100.0%) | 0 (0.0%) |
| Foreign Born, not a Citizen | 0 (0.0%) | 0 (0.0%) |
Health Insurance Coverage by Household Income in Shawsville
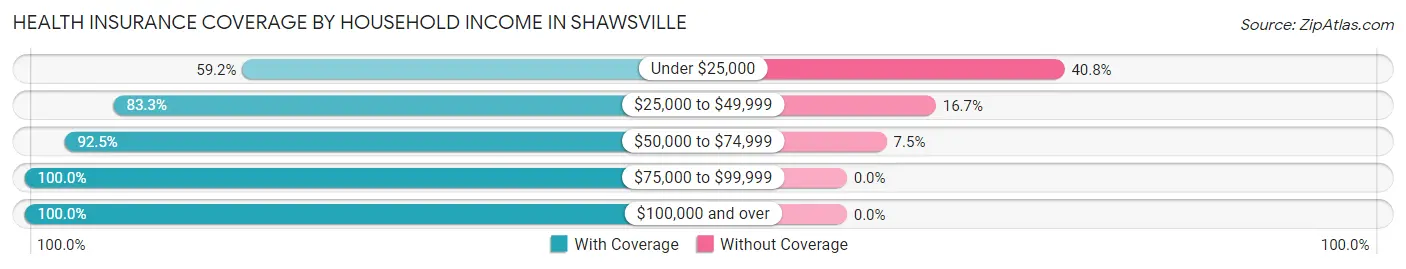
| Household Income | With Coverage | Without Coverage |
| Under $25,000 | 61 (59.2%) | 42 (40.8%) |
| $25,000 to $49,999 | 125 (83.3%) | 25 (16.7%) |
| $50,000 to $74,999 | 545 (92.5%) | 44 (7.5%) |
| $75,000 to $99,999 | 376 (100.0%) | 0 (0.0%) |
| $100,000 and over | 311 (100.0%) | 0 (0.0%) |
Public vs Private Health Insurance Coverage by Age in Shawsville
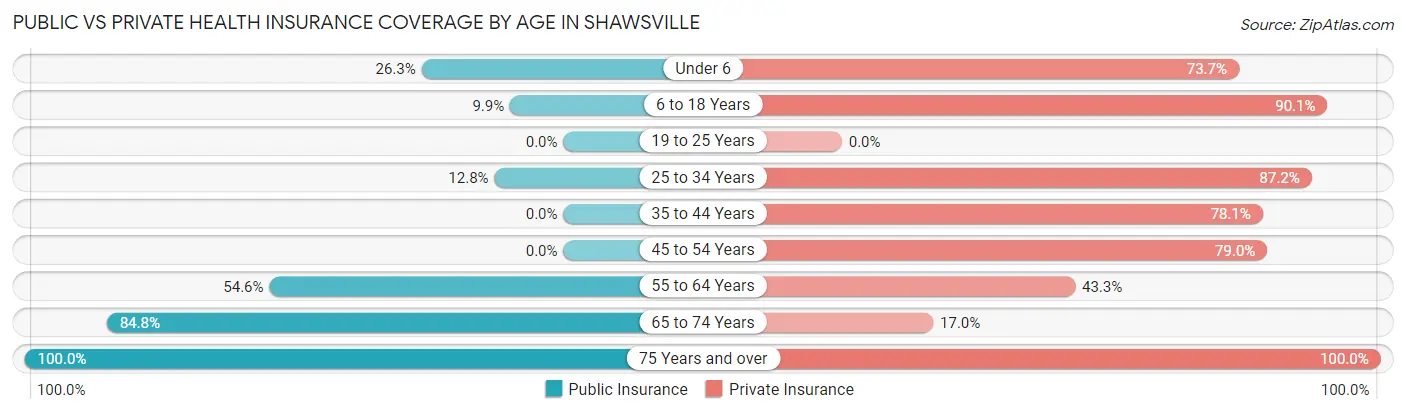
| Age Bracket | Public Insurance | Private Insurance |
| Under 6 | 10 (26.3%) | 28 (73.7%) |
| 6 to 18 Years | 26 (9.9%) | 237 (90.1%) |
| 19 to 25 Years | 0 (0.0%) | 0 (0.0%) |
| 25 to 34 Years | 54 (12.8%) | 368 (87.2%) |
| 35 to 44 Years | 0 (0.0%) | 150 (78.1%) |
| 45 to 54 Years | 0 (0.0%) | 165 (78.9%) |
| 55 to 64 Years | 179 (54.6%) | 142 (43.3%) |
| 65 to 74 Years | 50 (84.8%) | 10 (17.0%) |
| 75 Years and over | 18 (100.0%) | 18 (100.0%) |
| Total | 337 (22.0%) | 1,118 (73.1%) |
Disability Status by Sex by Age in Shawsville
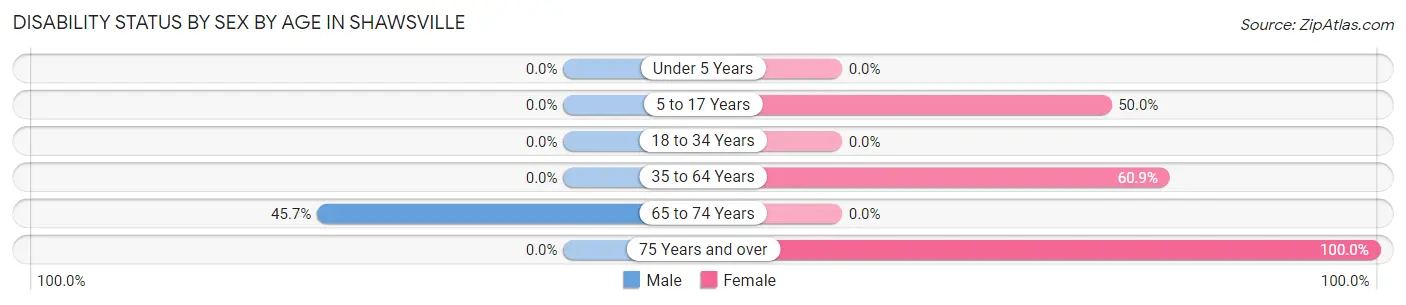
| Age Bracket | Male | Female |
| Under 5 Years | 0 (0.0%) | 0 (0.0%) |
| 5 to 17 Years | 0 (0.0%) | 15 (50.0%) |
| 18 to 34 Years | 0 (0.0%) | 0 (0.0%) |
| 35 to 64 Years | 0 (0.0%) | 179 (60.9%) |
| 65 to 74 Years | 16 (45.7%) | 0 (0.0%) |
| 75 Years and over | 0 (0.0%) | 18 (100.0%) |
Disability Class by Sex by Age in Shawsville
Disability Class: Hearing Difficulty
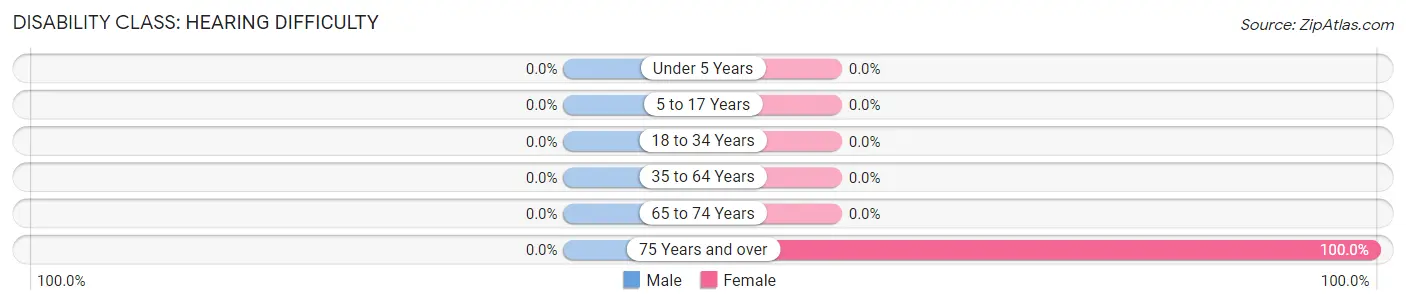
| Age Bracket | Male | Female |
| Under 5 Years | 0 (0.0%) | 0 (0.0%) |
| 5 to 17 Years | 0 (0.0%) | 0 (0.0%) |
| 18 to 34 Years | 0 (0.0%) | 0 (0.0%) |
| 35 to 64 Years | 0 (0.0%) | 0 (0.0%) |
| 65 to 74 Years | 0 (0.0%) | 0 (0.0%) |
| 75 Years and over | 0 (0.0%) | 18 (100.0%) |
Disability Class: Vision Difficulty
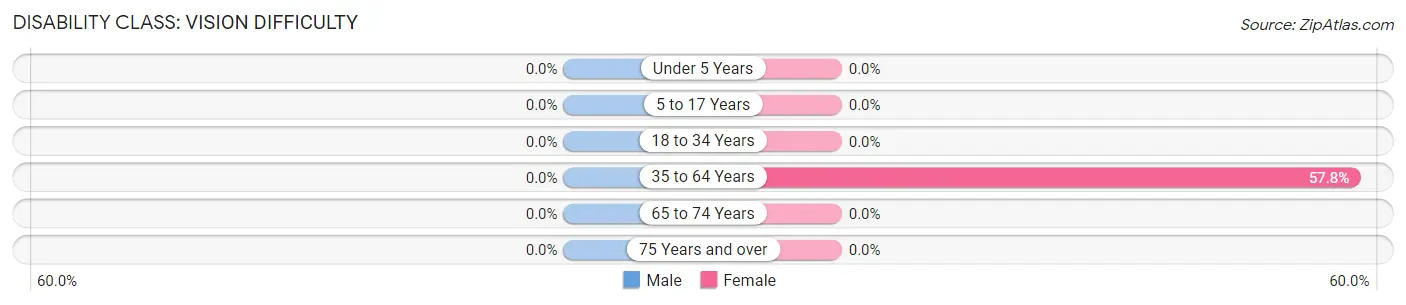
| Age Bracket | Male | Female |
| Under 5 Years | 0 (0.0%) | 0 (0.0%) |
| 5 to 17 Years | 0 (0.0%) | 0 (0.0%) |
| 18 to 34 Years | 0 (0.0%) | 0 (0.0%) |
| 35 to 64 Years | 0 (0.0%) | 170 (57.8%) |
| 65 to 74 Years | 0 (0.0%) | 0 (0.0%) |
| 75 Years and over | 0 (0.0%) | 0 (0.0%) |
Disability Class: Cognitive Difficulty
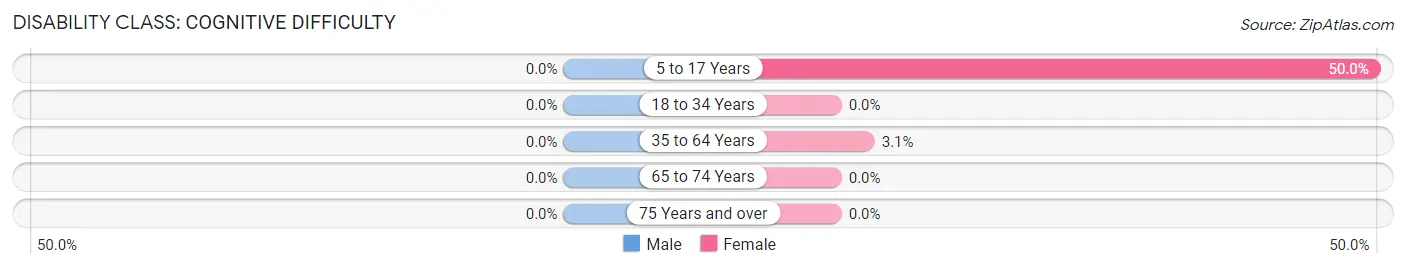
| Age Bracket | Male | Female |
| 5 to 17 Years | 0 (0.0%) | 15 (50.0%) |
| 18 to 34 Years | 0 (0.0%) | 0 (0.0%) |
| 35 to 64 Years | 0 (0.0%) | 9 (3.1%) |
| 65 to 74 Years | 0 (0.0%) | 0 (0.0%) |
| 75 Years and over | 0 (0.0%) | 0 (0.0%) |
Disability Class: Ambulatory Difficulty
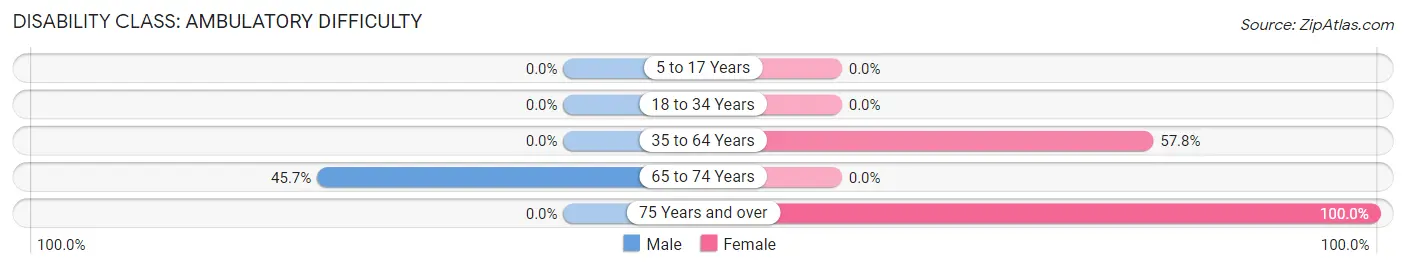
| Age Bracket | Male | Female |
| 5 to 17 Years | 0 (0.0%) | 0 (0.0%) |
| 18 to 34 Years | 0 (0.0%) | 0 (0.0%) |
| 35 to 64 Years | 0 (0.0%) | 170 (57.8%) |
| 65 to 74 Years | 16 (45.7%) | 0 (0.0%) |
| 75 Years and over | 0 (0.0%) | 18 (100.0%) |
Disability Class: Self-Care Difficulty
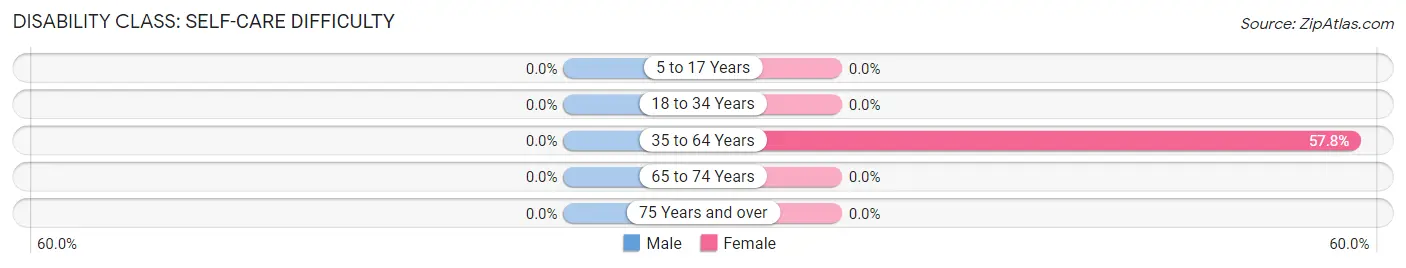
| Age Bracket | Male | Female |
| 5 to 17 Years | 0 (0.0%) | 0 (0.0%) |
| 18 to 34 Years | 0 (0.0%) | 0 (0.0%) |
| 35 to 64 Years | 0 (0.0%) | 170 (57.8%) |
| 65 to 74 Years | 0 (0.0%) | 0 (0.0%) |
| 75 Years and over | 0 (0.0%) | 0 (0.0%) |
Technology Access in Shawsville
Computing Device Access in Shawsville
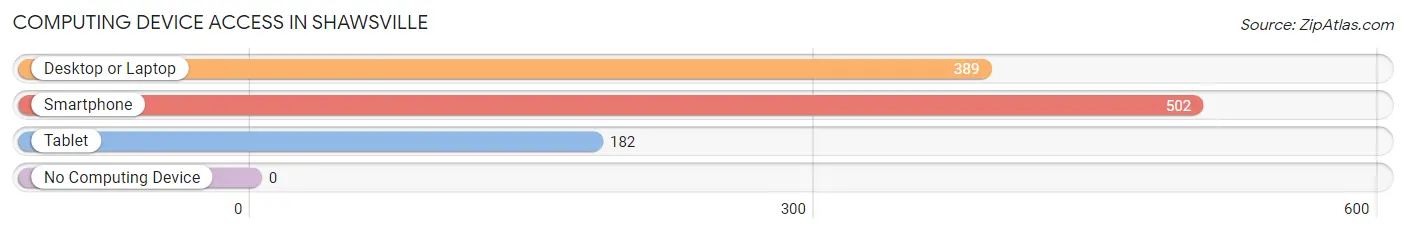
| Device Type | # Households | % Households |
| Desktop or Laptop | 389 | 75.1% |
| Smartphone | 502 | 96.9% |
| Tablet | 182 | 35.1% |
| No Computing Device | 0 | 0.0% |
| Total | 518 | 100.0% |
Internet Access in Shawsville
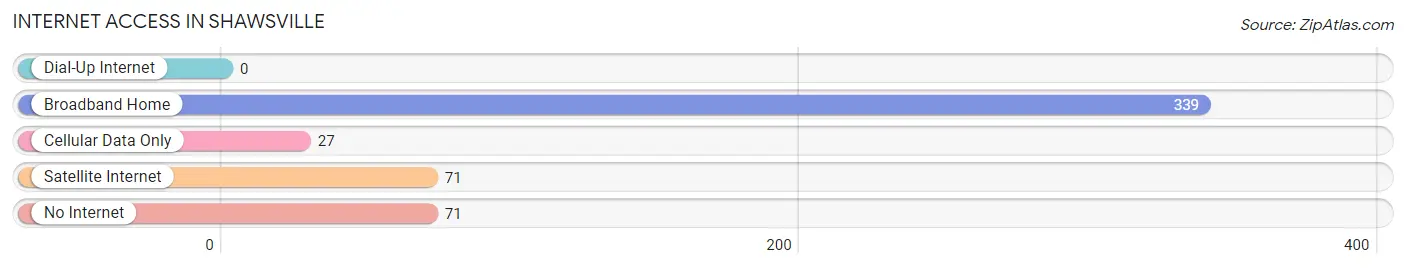
| Internet Type | # Households | % Households |
| Dial-Up Internet | 0 | 0.0% |
| Broadband Home | 339 | 65.4% |
| Cellular Data Only | 27 | 5.2% |
| Satellite Internet | 71 | 13.7% |
| No Internet | 71 | 13.7% |
| Total | 518 | 100.0% |
Shawsville Summary
Shawsville is a small unincorporated community located in Montgomery County, Virginia. It is situated in the Roanoke Valley, approximately 10 miles north of the city of Roanoke. The population of Shawsville was estimated to be 1,845 in 2019.
History
Shawsville was first settled in the late 1700s by the Shaws family, who were among the first settlers in the area. The town was named after the family and was officially established in 1820. The town was originally a farming community, but in the late 1800s, the railroad came through and the town began to grow. The railroad brought new businesses and industries to the area, and the town began to thrive.
In the early 1900s, Shawsville was a bustling small town with a variety of businesses, including a bank, a hotel, a general store, a post office, and a variety of other stores. The town also had a school, a church, and a movie theater.
In the 1950s, the town began to decline as the railroad industry began to decline. The town's population began to decline as well, and by the 1970s, the town was mostly abandoned. In the 1980s, the town began to experience a resurgence as new businesses began to move into the area.
Geography
Shawsville is located in the Roanoke Valley in the Appalachian Mountains. The town is situated at the intersection of US Route 11 and Virginia State Route 645. The town is surrounded by the towns of Christiansburg, Blacksburg, and Elliston. The town is located approximately 10 miles north of the city of Roanoke.
The town is situated in a valley surrounded by hills and mountains. The town is located at an elevation of 1,400 feet above sea level. The climate in Shawsville is mild, with temperatures ranging from the mid-30s in the winter to the mid-80s in the summer.
Economy
Shawsville's economy is largely based on agriculture and tourism. The town is home to several farms, which produce a variety of crops, including corn, soybeans, wheat, and hay. The town is also home to several wineries, which produce a variety of wines.
The town is also home to several small businesses, including restaurants, shops, and a variety of other businesses. The town is also home to a variety of tourist attractions, including the Shawsville Museum, the Shawsville Historic District, and the Shawsville Railroad Museum.
Demographics
As of 2019, the population of Shawsville was estimated to be 1,845. The town is predominantly white, with approximately 95% of the population being white. The median household income in Shawsville is $45,000, and the median home value is $150,000. The town has a low unemployment rate, with only 4.2% of the population being unemployed.
Shawsville is a small, rural community with a strong sense of community and a rich history. The town is home to a variety of businesses and attractions, and is a popular destination for tourists. The town is also home to a variety of farms and wineries, which provide a unique experience for visitors.
Common Questions
What is Per Capita Income in Shawsville?
Per Capita income in Shawsville is $32,903.
What is the Median Family Income in Shawsville?
Median Family Income in Shawsville is $69,605.
What is the Median Household income in Shawsville?
Median Household Income in Shawsville is $68,684.
What is Income or Wage Gap in Shawsville?
Income or Wage Gap in Shawsville is 59.5%.
Women in Shawsville earn 40.5 cents for every dollar earned by a man.
What is Inequality or Gini Index in Shawsville?
Inequality or Gini Index in Shawsville is 0.42.
What is the Total Population of Shawsville?
Total Population of Shawsville is 1,529.
What is the Total Male Population of Shawsville?
Total Male Population of Shawsville is 813.
What is the Total Female Population of Shawsville?
Total Female Population of Shawsville is 716.
What is the Ratio of Males per 100 Females in Shawsville?
There are 113.55 Males per 100 Females in Shawsville.
What is the Ratio of Females per 100 Males in Shawsville?
There are 88.07 Females per 100 Males in Shawsville.
What is the Median Population Age in Shawsville?
Median Population Age in Shawsville is 35.5 Years.
What is the Average Family Size in Shawsville
Average Family Size in Shawsville is 3.7 People.
What is the Average Household Size in Shawsville
Average Household Size in Shawsville is 3.0 People.
How Large is the Labor Force in Shawsville?
There are 915 People in the Labor Forcein in Shawsville.
What is the Percentage of People in the Labor Force in Shawsville?
74.5% of People are in the Labor Force in Shawsville.
What is the Unemployment Rate in Shawsville?
Unemployment Rate in Shawsville is 3.5%.