Sandston, VA Map & Demographics
Sandston Map
Sandston Overview
$30,916
PER CAPITA INCOME
$72,527
AVG FAMILY INCOME
$61,384
AVG HOUSEHOLD INCOME
0.6%
WAGE / INCOME GAP [ % ]
99.4¢/ $1
WAGE / INCOME GAP [ $ ]
0.37
INEQUALITY / GINI INDEX
7,152
TOTAL POPULATION
3,362
MALE POPULATION
3,790
FEMALE POPULATION
88.71
MALES / 100 FEMALES
112.73
FEMALES / 100 MALES
37.9
MEDIAN AGE
3.2
AVG FAMILY SIZE
2.4
AVG HOUSEHOLD SIZE
4,403
LABOR FORCE [ PEOPLE ]
74.5%
PERCENT IN LABOR FORCE
6.3%
UNEMPLOYMENT RATE
Sandston Zip Codes
Sandston Area Codes
Income in Sandston
Income Overview in Sandston
Per Capita Income in Sandston is $30,916, while median incomes of families and households are $72,527 and $61,384 respectively.
| Characteristic | Number | Measure |
| Per Capita Income | 7,152 | $30,916 |
| Median Family Income | 1,746 | $72,527 |
| Mean Family Income | 1,746 | $81,251 |
| Median Household Income | 3,003 | $61,384 |
| Mean Household Income | 3,003 | $70,898 |
| Income Deficit | 1,746 | $0 |
| Wage / Income Gap (%) | 7,152 | 0.62% |
| Wage / Income Gap ($) | 7,152 | 99.38¢ per $1 |
| Gini / Inequality Index | 7,152 | 0.37 |
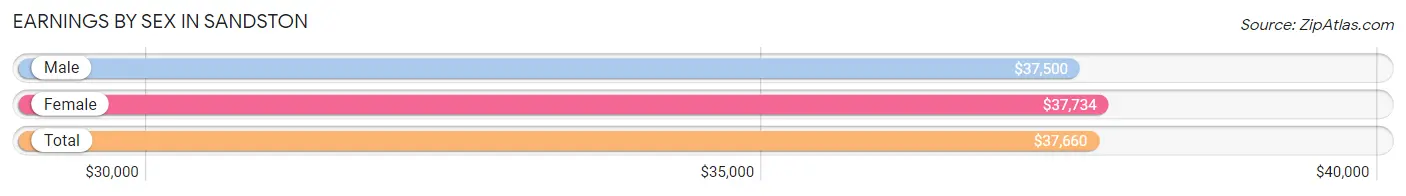
Earnings by Sex in Sandston
Average Earnings in Sandston are $37,660, $37,500 for men and $37,734 for women, a difference of 0.6%.
| Sex | Number | Average Earnings |
| Male | 2,200 (50.3%) | $37,500 |
| Female | 2,170 (49.7%) | $37,734 |
| Total | 4,370 (100.0%) | $37,660 |
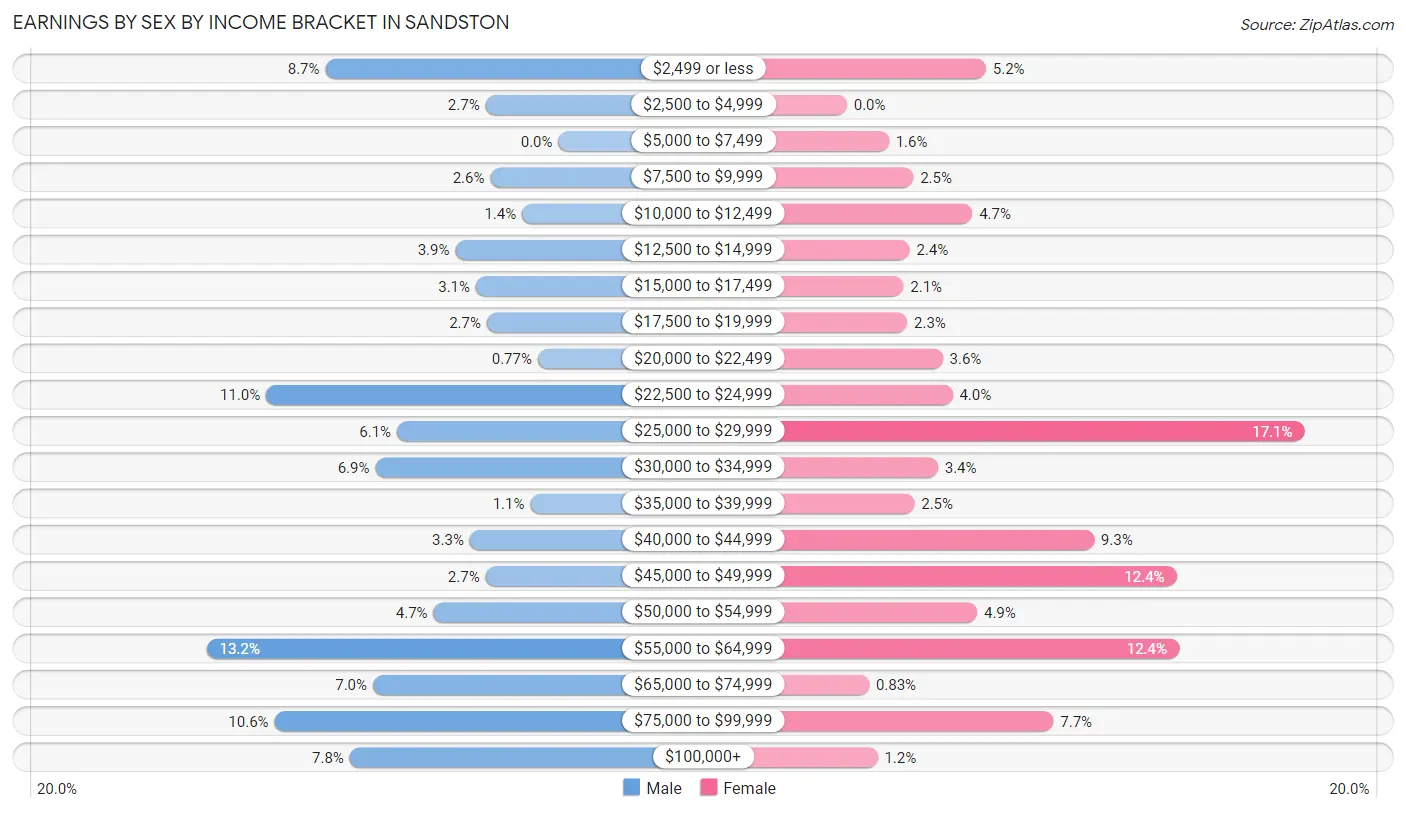
Earnings by Sex by Income Bracket in Sandston
The most common earnings brackets in Sandston are $55,000 to $64,999 for men (290 | 13.2%) and $25,000 to $29,999 for women (372 | 17.1%).
| Income | Male | Female |
| $2,499 or less | 192 (8.7%) | 113 (5.2%) |
| $2,500 to $4,999 | 60 (2.7%) | 0 (0.0%) |
| $5,000 to $7,499 | 0 (0.0%) | 34 (1.6%) |
| $7,500 to $9,999 | 56 (2.5%) | 54 (2.5%) |
| $10,000 to $12,499 | 30 (1.4%) | 102 (4.7%) |
| $12,500 to $14,999 | 85 (3.9%) | 51 (2.4%) |
| $15,000 to $17,499 | 68 (3.1%) | 46 (2.1%) |
| $17,500 to $19,999 | 59 (2.7%) | 49 (2.3%) |
| $20,000 to $22,499 | 17 (0.8%) | 78 (3.6%) |
| $22,500 to $24,999 | 241 (11.0%) | 86 (4.0%) |
| $25,000 to $29,999 | 133 (6.0%) | 372 (17.1%) |
| $30,000 to $34,999 | 151 (6.9%) | 74 (3.4%) |
| $35,000 to $39,999 | 23 (1.1%) | 55 (2.5%) |
| $40,000 to $44,999 | 73 (3.3%) | 201 (9.3%) |
| $45,000 to $49,999 | 60 (2.7%) | 268 (12.3%) |
| $50,000 to $54,999 | 103 (4.7%) | 106 (4.9%) |
| $55,000 to $64,999 | 290 (13.2%) | 270 (12.4%) |
| $65,000 to $74,999 | 153 (7.0%) | 18 (0.8%) |
| $75,000 to $99,999 | 234 (10.6%) | 168 (7.7%) |
| $100,000+ | 172 (7.8%) | 25 (1.1%) |
| Total | 2,200 (100.0%) | 2,170 (100.0%) |
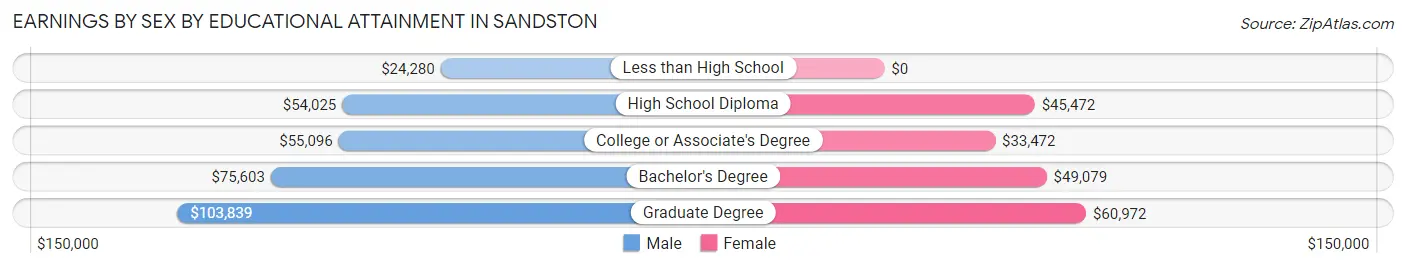
Earnings by Sex by Educational Attainment in Sandston
Average earnings in Sandston are $52,125 for men and $41,794 for women, a difference of 19.8%. Men with an educational attainment of graduate degree enjoy the highest average annual earnings of $103,839, while those with less than high school education earn the least with $24,280. Women with an educational attainment of graduate degree earn the most with the average annual earnings of $60,972, while those with college or associate's degree education have the smallest earnings of $33,472.
| Educational Attainment | Male Income | Female Income |
| Less than High School | $24,280 | $0 |
| High School Diploma | $54,025 | $45,472 |
| College or Associate's Degree | $55,096 | $33,472 |
| Bachelor's Degree | $75,603 | $49,079 |
| Graduate Degree | $103,839 | $60,972 |
| Total | $52,125 | $41,794 |
Family Income in Sandston
Family Income Brackets in Sandston
According to the Sandston family income data, there are 416 families falling into the $50,000 to $74,999 income range, which is the most common income bracket and makes up 23.8% of all families. Conversely, the $10,000 to $14,999 income bracket is the least frequent group with only 17 families (1.0%) belonging to this category.
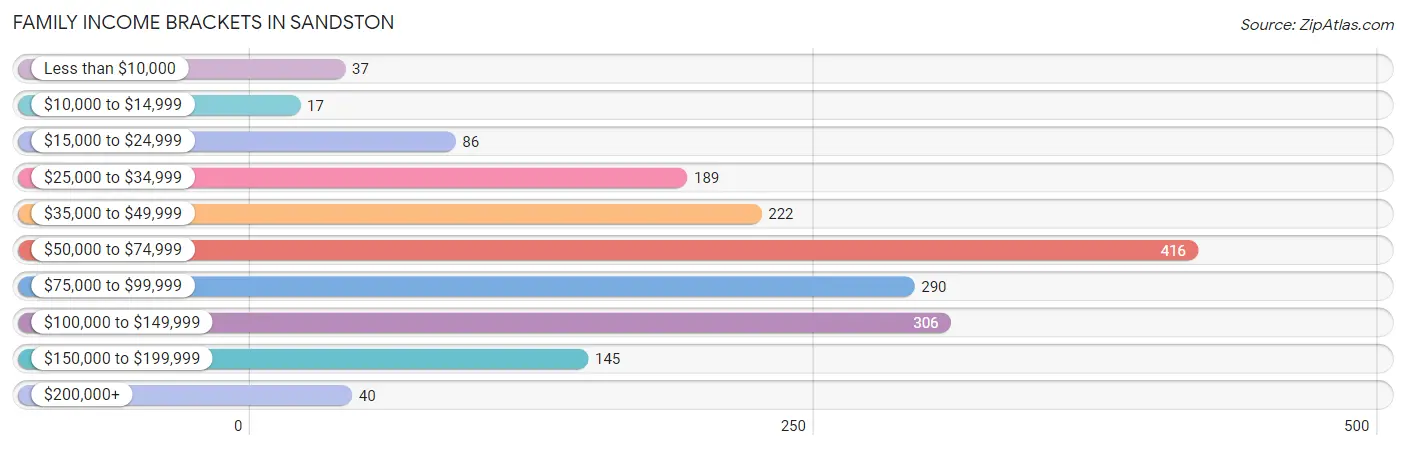
| Income Bracket | # Families | % Families |
| Less than $10,000 | 37 | 2.1% |
| $10,000 to $14,999 | 17 | 1.0% |
| $15,000 to $24,999 | 86 | 4.9% |
| $25,000 to $34,999 | 189 | 10.8% |
| $35,000 to $49,999 | 222 | 12.7% |
| $50,000 to $74,999 | 416 | 23.8% |
| $75,000 to $99,999 | 290 | 16.6% |
| $100,000 to $149,999 | 306 | 17.5% |
| $150,000 to $199,999 | 145 | 8.3% |
| $200,000+ | 40 | 2.3% |
Family Income by Famaliy Size in Sandston
5-person families (251 | 14.4%) account for the highest median family income in Sandston with $94,979 per family, while 2-person families (846 | 48.4%) have the highest median income of $26,644 per family member.
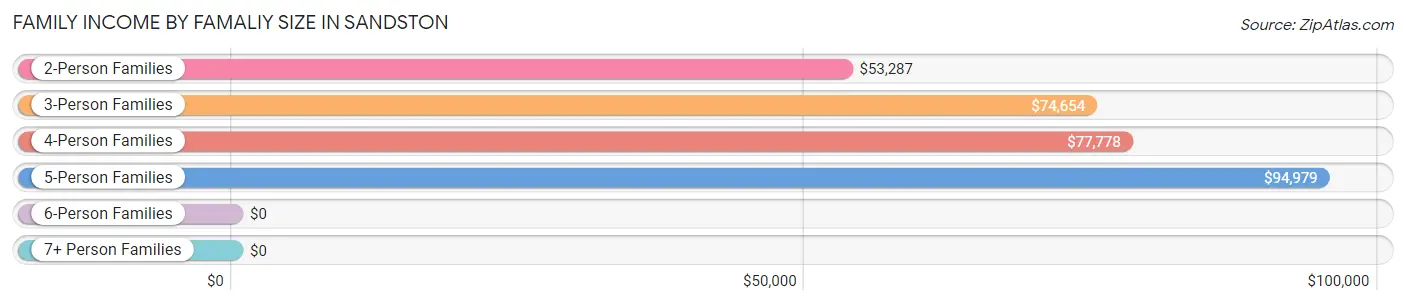
| Income Bracket | # Families | Median Income |
| 2-Person Families | 846 (48.4%) | $53,287 |
| 3-Person Families | 386 (22.1%) | $74,654 |
| 4-Person Families | 258 (14.8%) | $77,778 |
| 5-Person Families | 251 (14.4%) | $94,979 |
| 6-Person Families | 5 (0.3%) | $0 |
| 7+ Person Families | 0 (0.0%) | $0 |
| Total | 1,746 (100.0%) | $72,527 |
Family Income by Number of Earners in Sandston
The median family income in Sandston is $72,527, with families comprising 3+ earners (317) having the highest median family income of $103,463, while families with no earners (160) have the lowest median family income of $40,714, accounting for 18.2% and 9.2% of families, respectively.
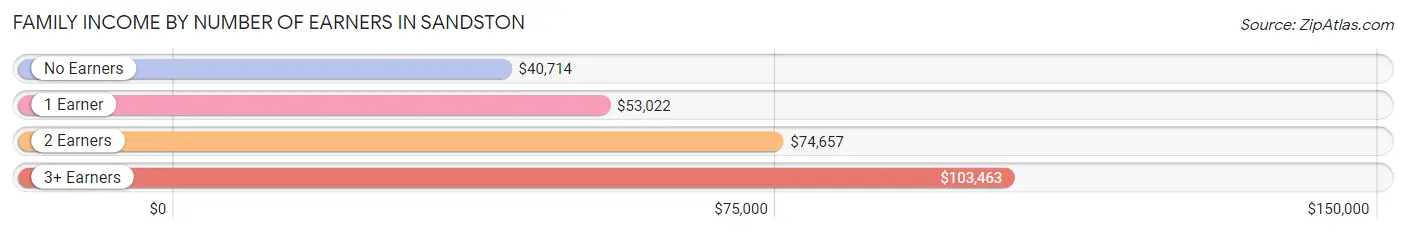
| Number of Earners | # Families | Median Income |
| No Earners | 160 (9.2%) | $40,714 |
| 1 Earner | 602 (34.5%) | $53,022 |
| 2 Earners | 667 (38.2%) | $74,657 |
| 3+ Earners | 317 (18.2%) | $103,463 |
| Total | 1,746 (100.0%) | $72,527 |
Household Income in Sandston
Household Income Brackets in Sandston
With 715 households falling in the category, the $50,000 to $74,999 income range is the most frequent in Sandston, accounting for 23.8% of all households. In contrast, only 48 households (1.6%) fall into the $200,000+ income bracket, making it the least populous group.
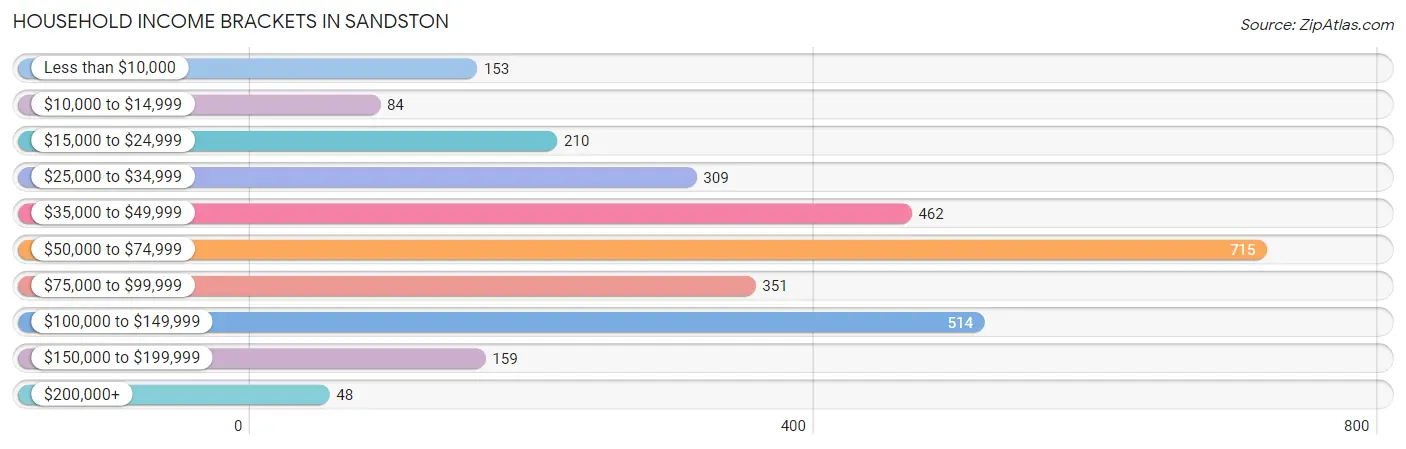
| Income Bracket | # Households | % Households |
| Less than $10,000 | 153 | 5.1% |
| $10,000 to $14,999 | 84 | 2.8% |
| $15,000 to $24,999 | 210 | 7.0% |
| $25,000 to $34,999 | 309 | 10.3% |
| $35,000 to $49,999 | 462 | 15.4% |
| $50,000 to $74,999 | 715 | 23.8% |
| $75,000 to $99,999 | 351 | 11.7% |
| $100,000 to $149,999 | 514 | 17.1% |
| $150,000 to $199,999 | 159 | 5.3% |
| $200,000+ | 48 | 1.6% |
Household Income by Householder Age in Sandston
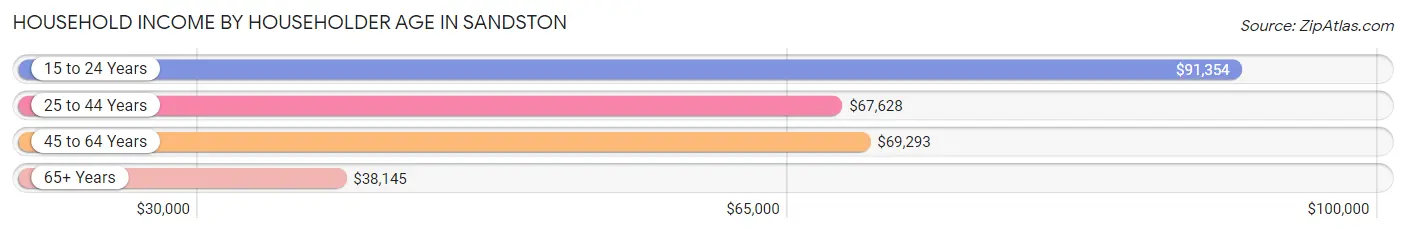
The median household income in Sandston is $61,384, with the highest median household income of $91,354 found in the 15 to 24 years age bracket for the primary householder. A total of 50 households (1.7%) fall into this category. Meanwhile, the 65+ years age bracket for the primary householder has the lowest median household income of $38,145, with 600 households (20.0%) in this group.
| Income Bracket | # Households | Median Income |
| 15 to 24 Years | 50 (1.7%) | $91,354 |
| 25 to 44 Years | 1,113 (37.1%) | $67,628 |
| 45 to 64 Years | 1,240 (41.3%) | $69,293 |
| 65+ Years | 600 (20.0%) | $38,145 |
| Total | 3,003 (100.0%) | $61,384 |
Poverty in Sandston
Income Below Poverty by Sex and Age in Sandston
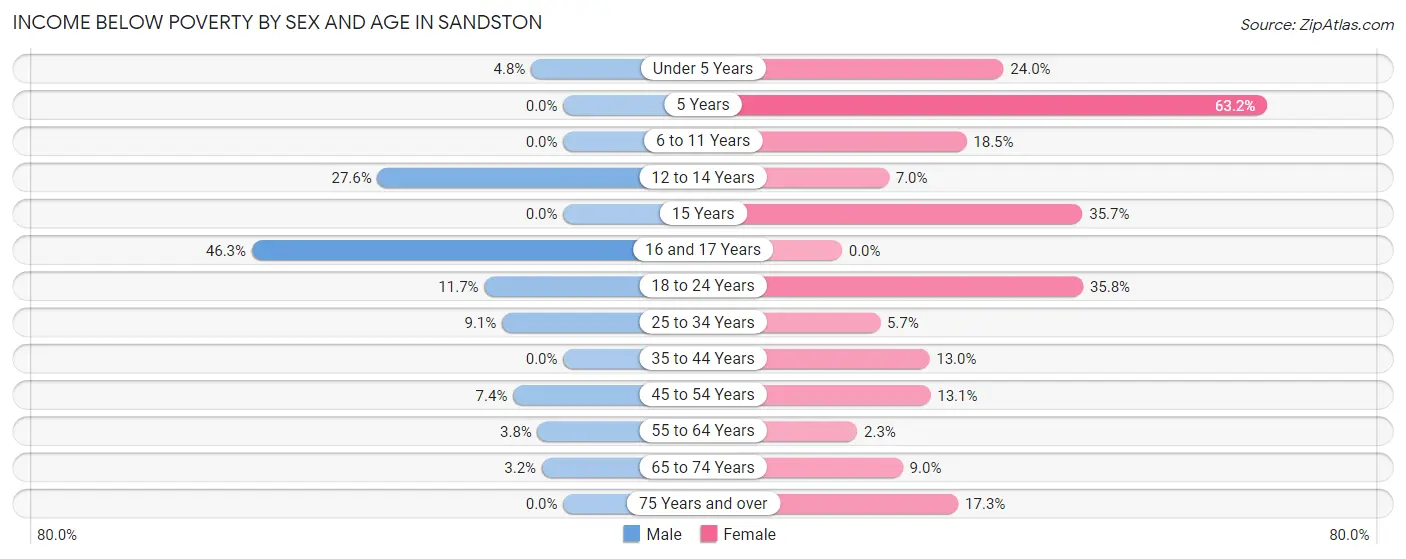
With 6.8% poverty level for males and 15.6% for females among the residents of Sandston, 16 and 17 year old males and 5 year old females are the most vulnerable to poverty, with 37 males (46.3%) and 48 females (63.2%) in their respective age groups living below the poverty level.
| Age Bracket | Male | Female |
| Under 5 Years | 10 (4.8%) | 18 (24.0%) |
| 5 Years | 0 (0.0%) | 48 (63.2%) |
| 6 to 11 Years | 0 (0.0%) | 32 (18.5%) |
| 12 to 14 Years | 32 (27.6%) | 9 (7.0%) |
| 15 Years | 0 (0.0%) | 65 (35.7%) |
| 16 and 17 Years | 37 (46.3%) | 0 (0.0%) |
| 18 to 24 Years | 45 (11.7%) | 140 (35.8%) |
| 25 to 34 Years | 48 (9.1%) | 32 (5.7%) |
| 35 to 44 Years | 0 (0.0%) | 70 (13.0%) |
| 45 to 54 Years | 36 (7.4%) | 87 (13.1%) |
| 55 to 64 Years | 15 (3.8%) | 9 (2.3%) |
| 65 to 74 Years | 7 (3.2%) | 15 (9.0%) |
| 75 Years and over | 0 (0.0%) | 66 (17.3%) |
| Total | 230 (6.8%) | 591 (15.6%) |
Income Above Poverty by Sex and Age in Sandston
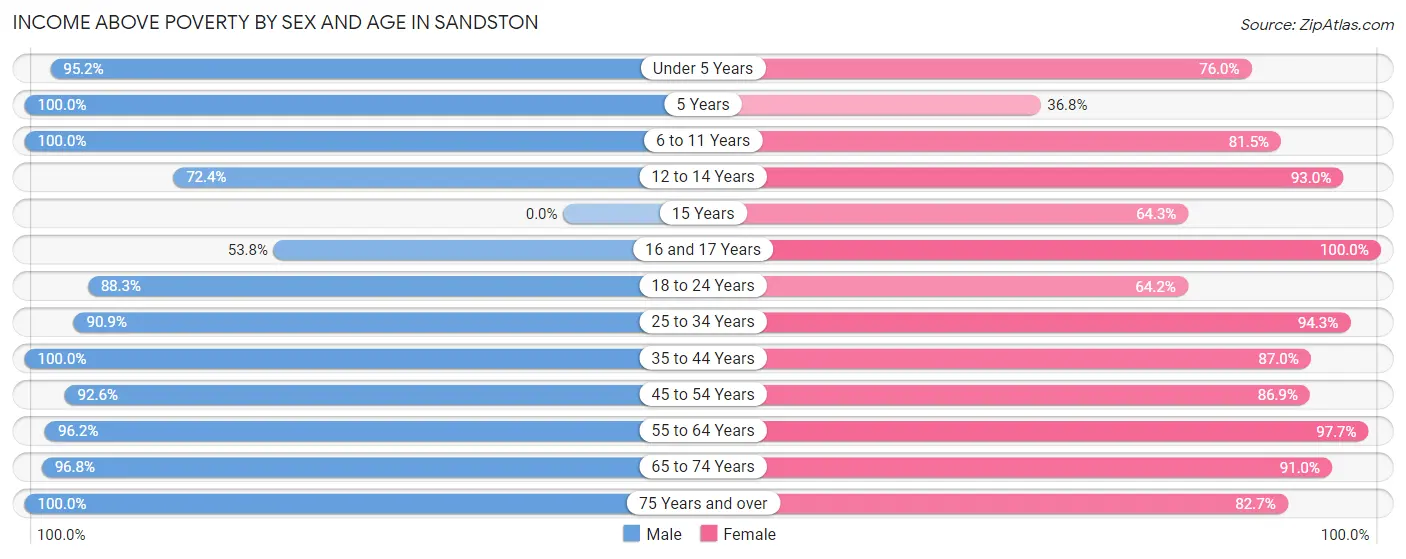
According to the poverty statistics in Sandston, males aged 5 years and females aged 16 and 17 years are the age groups that are most secure financially, with 100.0% of males and 100.0% of females in these age groups living above the poverty line.
| Age Bracket | Male | Female |
| Under 5 Years | 199 (95.2%) | 57 (76.0%) |
| 5 Years | 33 (100.0%) | 28 (36.8%) |
| 6 to 11 Years | 249 (100.0%) | 141 (81.5%) |
| 12 to 14 Years | 84 (72.4%) | 120 (93.0%) |
| 15 Years | 0 (0.0%) | 117 (64.3%) |
| 16 and 17 Years | 43 (53.7%) | 54 (100.0%) |
| 18 to 24 Years | 339 (88.3%) | 251 (64.2%) |
| 25 to 34 Years | 480 (90.9%) | 532 (94.3%) |
| 35 to 44 Years | 515 (100.0%) | 469 (87.0%) |
| 45 to 54 Years | 448 (92.6%) | 575 (86.9%) |
| 55 to 64 Years | 379 (96.2%) | 388 (97.7%) |
| 65 to 74 Years | 213 (96.8%) | 151 (91.0%) |
| 75 Years and over | 150 (100.0%) | 316 (82.7%) |
| Total | 3,132 (93.2%) | 3,199 (84.4%) |
Income Below Poverty Among Married-Couple Families in Sandston
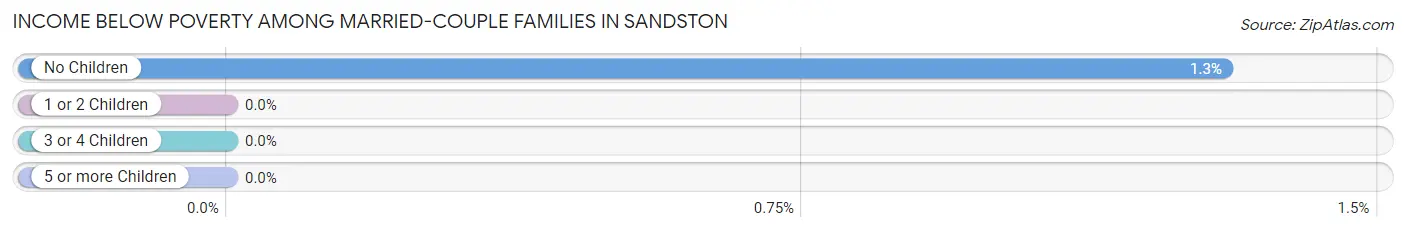
The poverty statistics for married-couple families in Sandston show that 0.7% or 7 of the total 1,001 families live below the poverty line. Families with no children have the highest poverty rate of 1.3%, comprising of 7 families. On the other hand, families with 1 or 2 children have the lowest poverty rate of 0.0%, which includes 0 families.
| Children | Above Poverty | Below Poverty |
| No Children | 531 (98.7%) | 7 (1.3%) |
| 1 or 2 Children | 445 (100.0%) | 0 (0.0%) |
| 3 or 4 Children | 18 (100.0%) | 0 (0.0%) |
| 5 or more Children | 0 (0.0%) | 0 (0.0%) |
| Total | 994 (99.3%) | 7 (0.7%) |
Income Below Poverty Among Single-Parent Households in Sandston
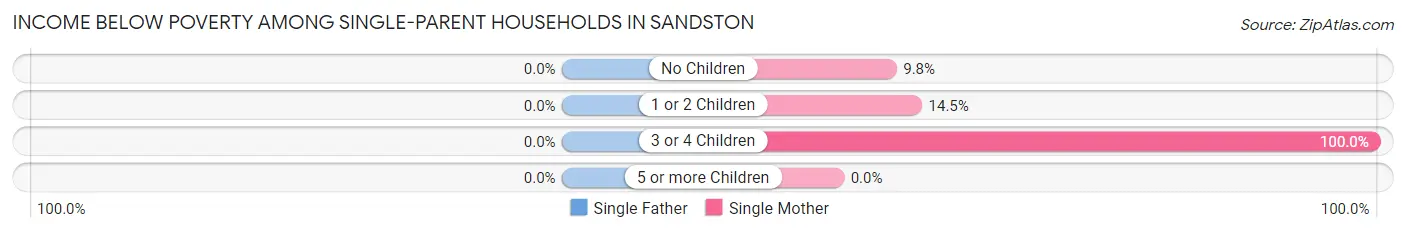
| Children | Single Father | Single Mother |
| No Children | 0 (0.0%) | 24 (9.8%) |
| 1 or 2 Children | 0 (0.0%) | 54 (14.5%) |
| 3 or 4 Children | 0 (0.0%) | 54 (100.0%) |
| 5 or more Children | 0 (0.0%) | 0 (0.0%) |
| Total | 0 (0.0%) | 132 (19.7%) |
Income Below Poverty Among Married-Couple vs Single-Parent Households in Sandston
The poverty data for Sandston shows that 7 of the married-couple family households (0.7%) and 132 of the single-parent households (17.7%) are living below the poverty level. Within the married-couple family households, those with no children have the highest poverty rate, with 7 households (1.3%) falling below the poverty line. Among the single-parent households, those with 3 or 4 children have the highest poverty rate, with 54 household (100.0%) living below poverty.
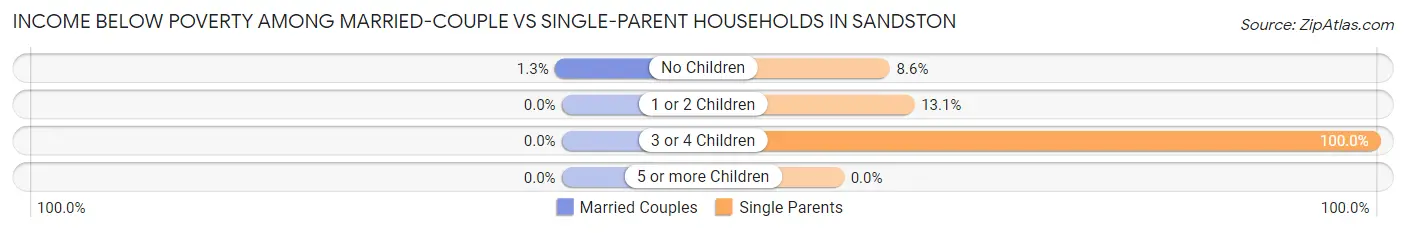
| Children | Married-Couple Families | Single-Parent Households |
| No Children | 7 (1.3%) | 24 (8.6%) |
| 1 or 2 Children | 0 (0.0%) | 54 (13.1%) |
| 3 or 4 Children | 0 (0.0%) | 54 (100.0%) |
| 5 or more Children | 0 (0.0%) | 0 (0.0%) |
| Total | 7 (0.7%) | 132 (17.7%) |
Race in Sandston
The most populous races in Sandston are White / Caucasian (3,471 | 48.5%), Black / African American (2,799 | 39.1%), and Two or more Races (665 | 9.3%).
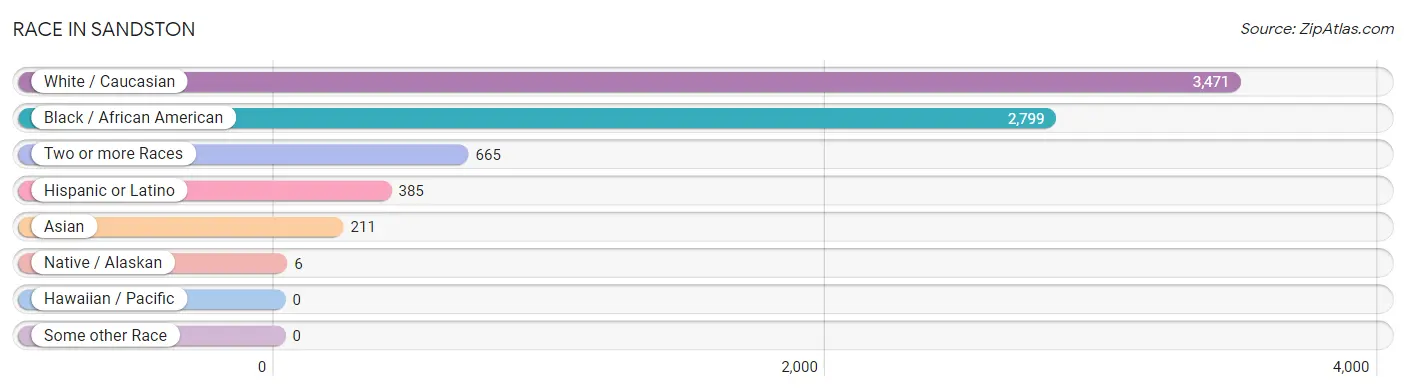
| Race | # Population | % Population |
| Asian | 211 | 2.9% |
| Black / African American | 2,799 | 39.1% |
| Hawaiian / Pacific | 0 | 0.0% |
| Hispanic or Latino | 385 | 5.4% |
| Native / Alaskan | 6 | 0.1% |
| White / Caucasian | 3,471 | 48.5% |
| Two or more Races | 665 | 9.3% |
| Some other Race | 0 | 0.0% |
| Total | 7,152 | 100.0% |
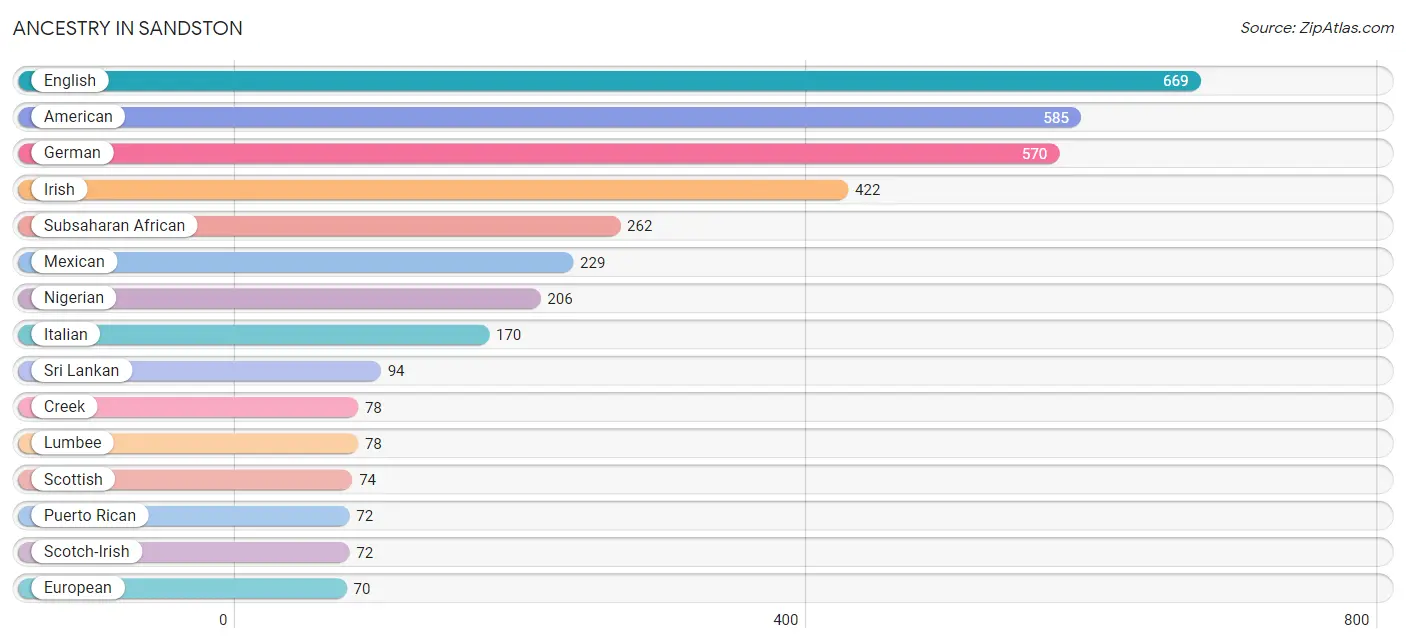
Ancestry in Sandston
The most populous ancestries reported in Sandston are English (669 | 9.3%), American (585 | 8.2%), German (570 | 8.0%), Irish (422 | 5.9%), and Subsaharan African (262 | 3.7%), together accounting for 35.1% of all Sandston residents.
| Ancestry | # Population | % Population |
| African | 56 | 0.8% |
| American | 585 | 8.2% |
| Apache | 4 | 0.1% |
| Blackfeet | 15 | 0.2% |
| British | 59 | 0.8% |
| Burmese | 22 | 0.3% |
| Canadian | 6 | 0.1% |
| Central American | 49 | 0.7% |
| Cherokee | 20 | 0.3% |
| Colombian | 13 | 0.2% |
| Creek | 78 | 1.1% |
| Eastern European | 21 | 0.3% |
| English | 669 | 9.3% |
| European | 70 | 1.0% |
| French | 48 | 0.7% |
| French Canadian | 52 | 0.7% |
| German | 570 | 8.0% |
| Guatemalan | 49 | 0.7% |
| Irish | 422 | 5.9% |
| Italian | 170 | 2.4% |
| Jamaican | 24 | 0.3% |
| Korean | 69 | 1.0% |
| Lumbee | 78 | 1.1% |
| Mexican | 229 | 3.2% |
| Nigerian | 206 | 2.9% |
| Polish | 45 | 0.6% |
| Puerto Rican | 72 | 1.0% |
| Scandinavian | 9 | 0.1% |
| Scotch-Irish | 72 | 1.0% |
| Scottish | 74 | 1.0% |
| South American | 13 | 0.2% |
| Spanish | 22 | 0.3% |
| Sri Lankan | 94 | 1.3% |
| Subsaharan African | 262 | 3.7% |
| Swedish | 25 | 0.4% |
| Swiss | 16 | 0.2% |
| Thai | 56 | 0.8% |
| Ukrainian | 9 | 0.1% |
| Welsh | 39 | 0.5% | View All 39 Rows |
Immigrants in Sandston
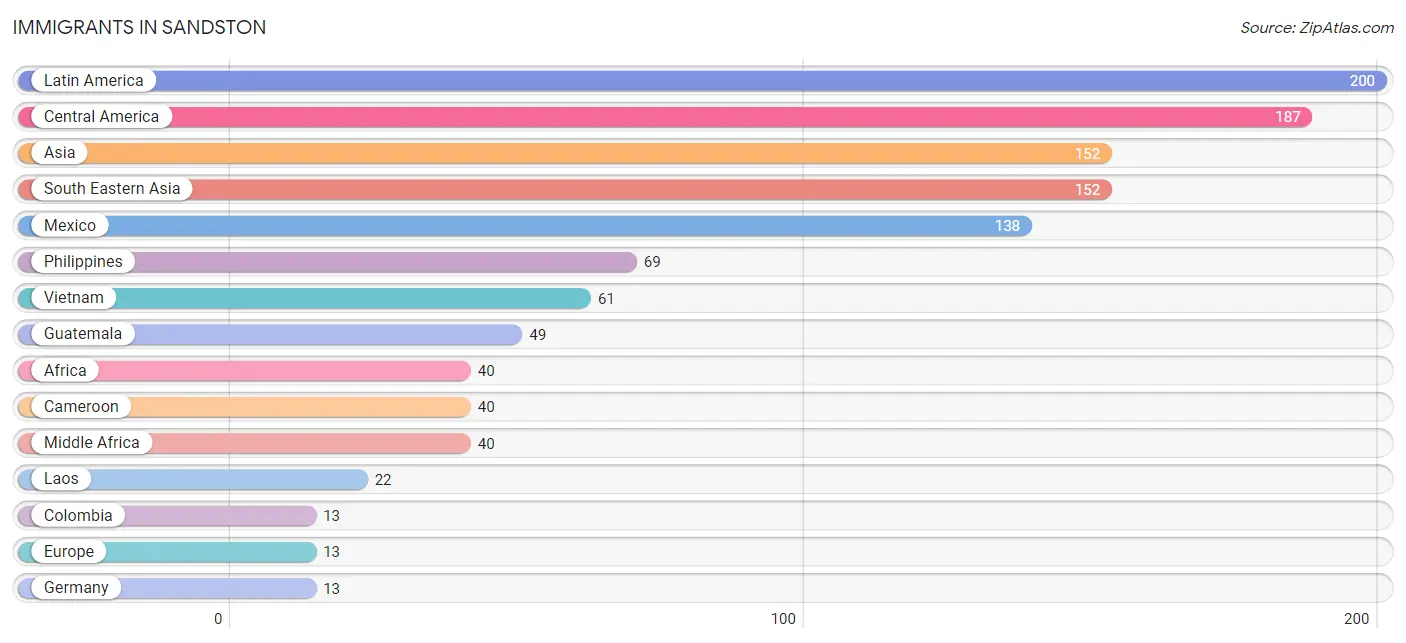
The most numerous immigrant groups reported in Sandston came from Latin America (200 | 2.8%), Central America (187 | 2.6%), Asia (152 | 2.1%), South Eastern Asia (152 | 2.1%), and Mexico (138 | 1.9%), together accounting for 11.6% of all Sandston residents.
| Immigration Origin | # Population | % Population |
| Africa | 40 | 0.6% |
| Asia | 152 | 2.1% |
| Cameroon | 40 | 0.6% |
| Central America | 187 | 2.6% |
| Colombia | 13 | 0.2% |
| Europe | 13 | 0.2% |
| Germany | 13 | 0.2% |
| Guatemala | 49 | 0.7% |
| Laos | 22 | 0.3% |
| Latin America | 200 | 2.8% |
| Mexico | 138 | 1.9% |
| Middle Africa | 40 | 0.6% |
| Philippines | 69 | 1.0% |
| South America | 13 | 0.2% |
| South Eastern Asia | 152 | 2.1% |
| Vietnam | 61 | 0.9% |
| Western Europe | 13 | 0.2% | View All 17 Rows |
Sex and Age in Sandston
Sex and Age in Sandston
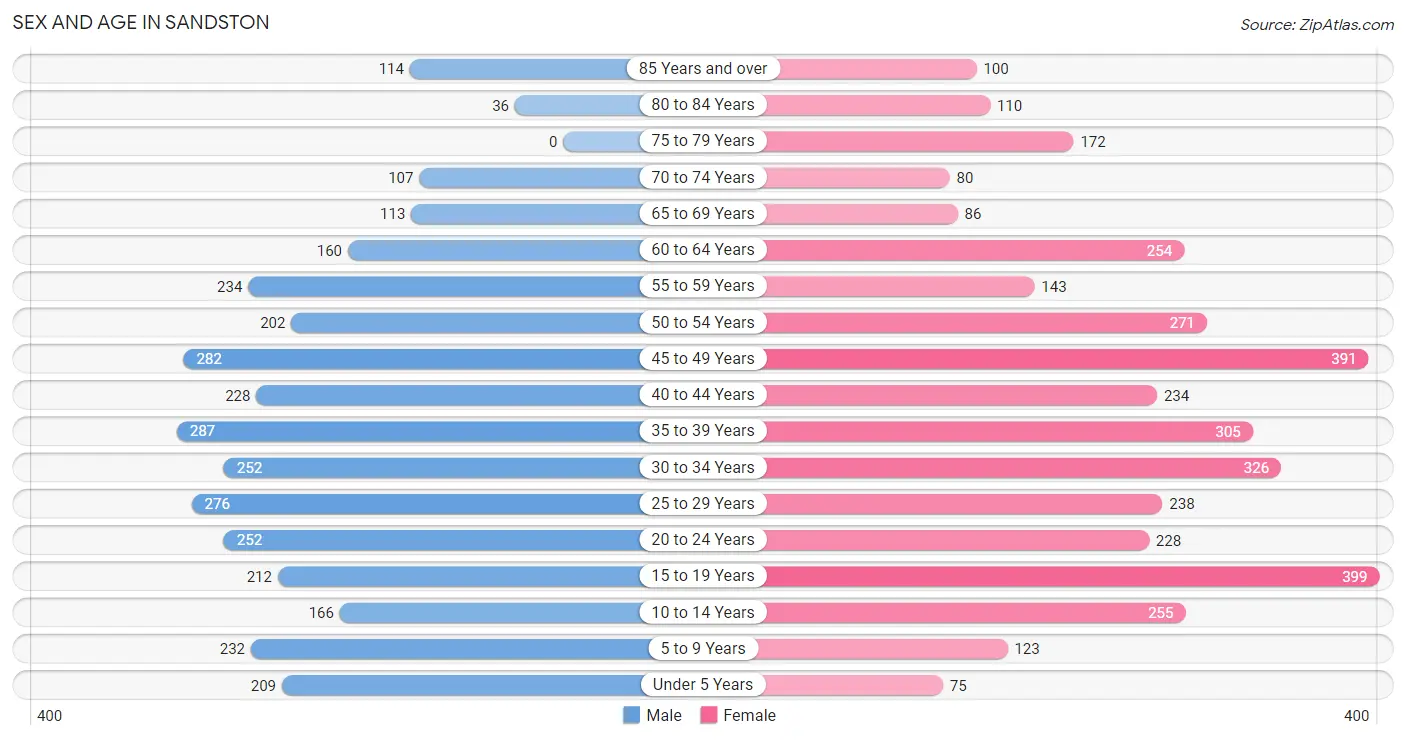
The most populous age groups in Sandston are 35 to 39 Years (287 | 8.5%) for men and 15 to 19 Years (399 | 10.5%) for women.
| Age Bracket | Male | Female |
| Under 5 Years | 209 (6.2%) | 75 (2.0%) |
| 5 to 9 Years | 232 (6.9%) | 123 (3.3%) |
| 10 to 14 Years | 166 (4.9%) | 255 (6.7%) |
| 15 to 19 Years | 212 (6.3%) | 399 (10.5%) |
| 20 to 24 Years | 252 (7.5%) | 228 (6.0%) |
| 25 to 29 Years | 276 (8.2%) | 238 (6.3%) |
| 30 to 34 Years | 252 (7.5%) | 326 (8.6%) |
| 35 to 39 Years | 287 (8.5%) | 305 (8.1%) |
| 40 to 44 Years | 228 (6.8%) | 234 (6.2%) |
| 45 to 49 Years | 282 (8.4%) | 391 (10.3%) |
| 50 to 54 Years | 202 (6.0%) | 271 (7.1%) |
| 55 to 59 Years | 234 (7.0%) | 143 (3.8%) |
| 60 to 64 Years | 160 (4.8%) | 254 (6.7%) |
| 65 to 69 Years | 113 (3.4%) | 86 (2.3%) |
| 70 to 74 Years | 107 (3.2%) | 80 (2.1%) |
| 75 to 79 Years | 0 (0.0%) | 172 (4.5%) |
| 80 to 84 Years | 36 (1.1%) | 110 (2.9%) |
| 85 Years and over | 114 (3.4%) | 100 (2.6%) |
| Total | 3,362 (100.0%) | 3,790 (100.0%) |
Families and Households in Sandston
Median Family Size in Sandston
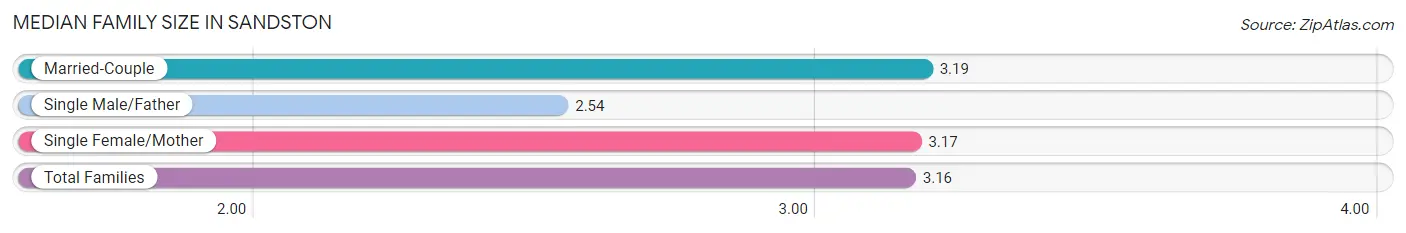
The median family size in Sandston is 3.16 persons per family, with married-couple families (1,001 | 57.3%) accounting for the largest median family size of 3.19 persons per family. On the other hand, single male/father families (74 | 4.2%) represent the smallest median family size with 2.54 persons per family.
| Family Type | # Families | Family Size |
| Married-Couple | 1,001 (57.3%) | 3.19 |
| Single Male/Father | 74 (4.2%) | 2.54 |
| Single Female/Mother | 671 (38.4%) | 3.17 |
| Total Families | 1,746 (100.0%) | 3.16 |
Median Household Size in Sandston
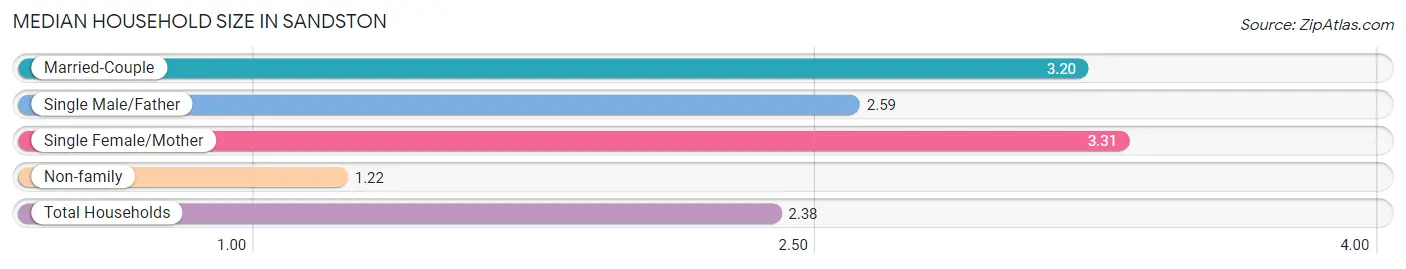
The median household size in Sandston is 2.38 persons per household, with single female/mother households (671 | 22.3%) accounting for the largest median household size of 3.31 persons per household. non-family households (1,257 | 41.9%) represent the smallest median household size with 1.22 persons per household.
| Household Type | # Households | Household Size |
| Married-Couple | 1,001 (33.3%) | 3.20 |
| Single Male/Father | 74 (2.5%) | 2.59 |
| Single Female/Mother | 671 (22.3%) | 3.31 |
| Non-family | 1,257 (41.9%) | 1.22 |
| Total Households | 3,003 (100.0%) | 2.38 |
Household Size by Marriage Status in Sandston
Out of a total of 3,003 households in Sandston, 1,746 (58.1%) are family households, while 1,257 (41.9%) are nonfamily households. The most numerous type of family households are 2-person households, comprising 821, and the most common type of nonfamily households are 1-person households, comprising 1,034.
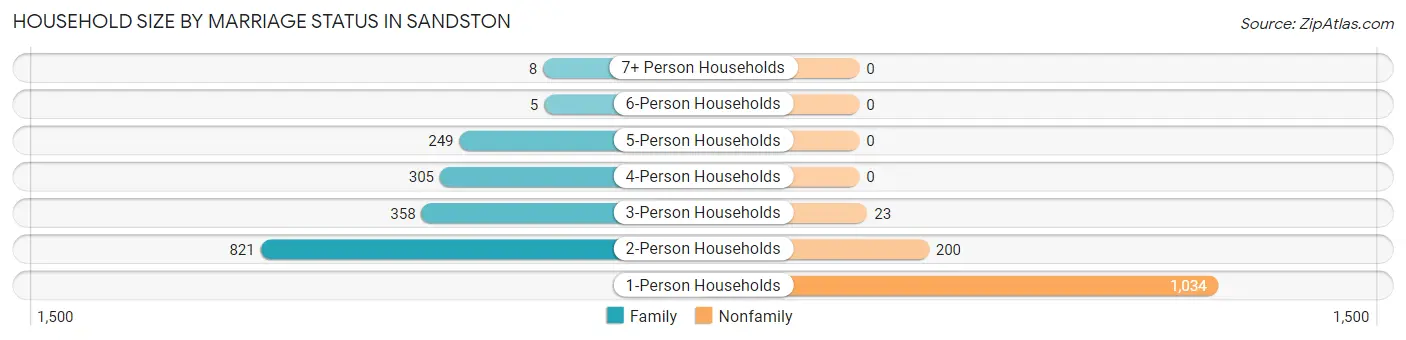
| Household Size | Family Households | Nonfamily Households |
| 1-Person Households | - | 1,034 (34.4%) |
| 2-Person Households | 821 (27.3%) | 200 (6.7%) |
| 3-Person Households | 358 (11.9%) | 23 (0.8%) |
| 4-Person Households | 305 (10.2%) | 0 (0.0%) |
| 5-Person Households | 249 (8.3%) | 0 (0.0%) |
| 6-Person Households | 5 (0.2%) | 0 (0.0%) |
| 7+ Person Households | 8 (0.3%) | 0 (0.0%) |
| Total | 1,746 (58.1%) | 1,257 (41.9%) |
Female Fertility in Sandston
Fertility by Age in Sandston
Average fertility rate in Sandston is 15.0 births per 1,000 women. Women in the age bracket of 15 to 19 years have the highest fertility rate with 30.0 births per 1,000 women. Women in the age bracket of 35 to 50 years acount for 62.5% of all women with births.
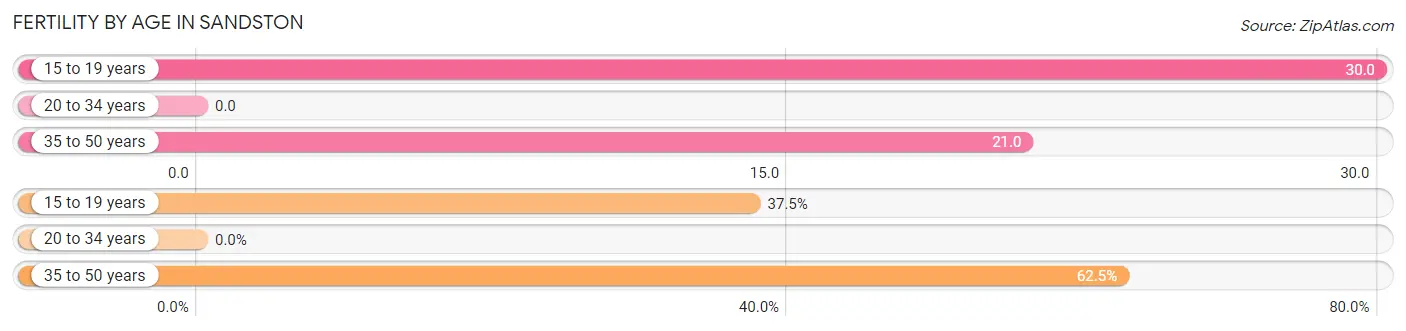
| Age Bracket | Women with Births | Births / 1,000 Women |
| 15 to 19 years | 12 (37.5%) | 30.0 |
| 20 to 34 years | 0 (0.0%) | 0.0 |
| 35 to 50 years | 20 (62.5%) | 21.0 |
| Total | 32 (100.0%) | 15.0 |
Fertility by Age by Marriage Status in Sandston
62.5% of women with births (32) in Sandston are married. The highest percentage of unmarried women with births falls into 15 to 19 years age bracket with 100.0% of them unmarried at the time of birth, while the lowest percentage of unmarried women with births belong to 35 to 50 years age bracket with 0.0% of them unmarried.
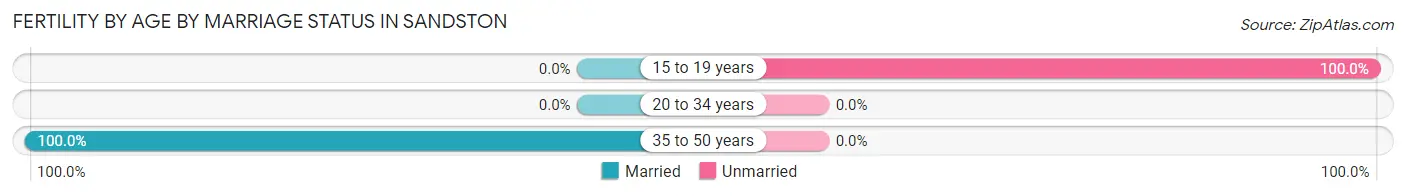
| Age Bracket | Married | Unmarried |
| 15 to 19 years | 0 (0.0%) | 12 (100.0%) |
| 20 to 34 years | 0 (0.0%) | 0 (0.0%) |
| 35 to 50 years | 20 (100.0%) | 0 (0.0%) |
| Total | 20 (62.5%) | 12 (37.5%) |
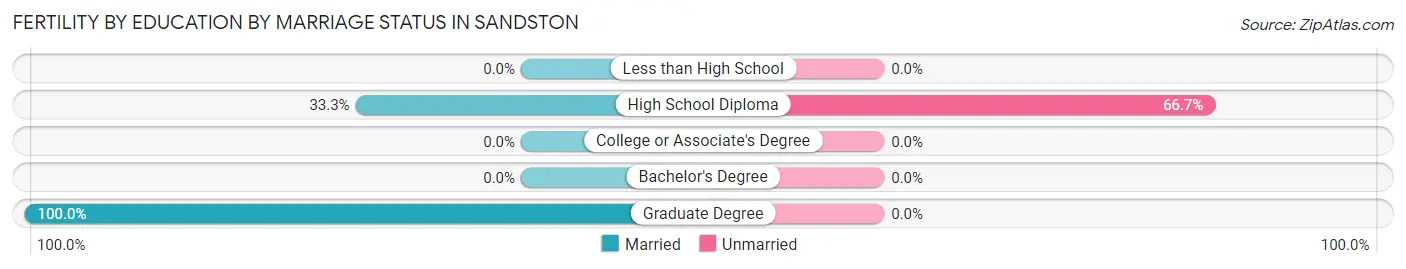
Fertility by Education in Sandston
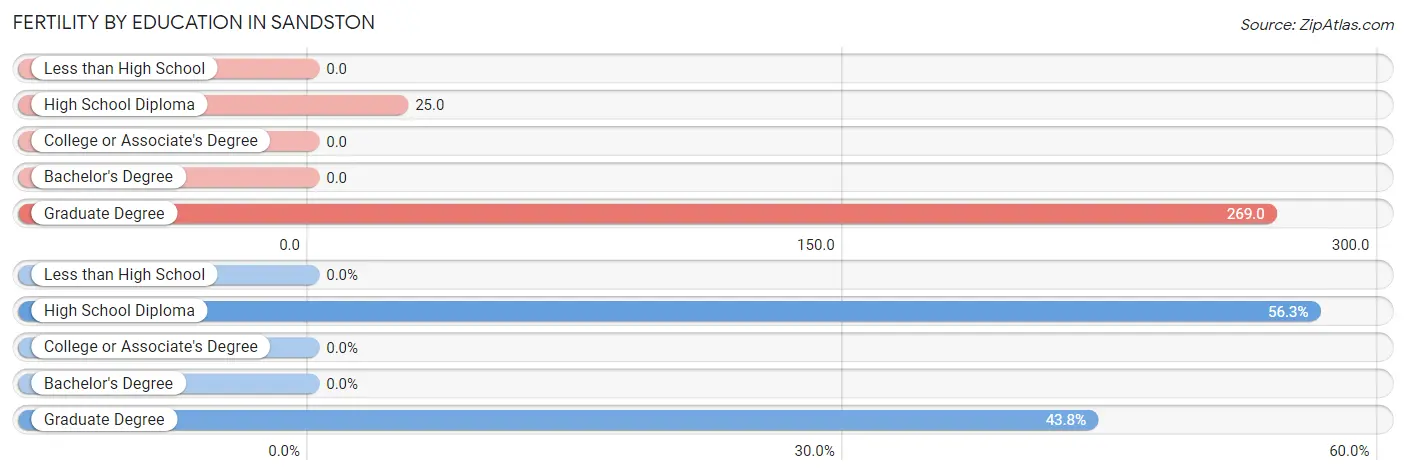
| Educational Attainment | Women with Births | Births / 1,000 Women |
| Less than High School | 0 (0.0%) | 0.0 |
| High School Diploma | 18 (56.2%) | 25.0 |
| College or Associate's Degree | 0 (0.0%) | 0.0 |
| Bachelor's Degree | 0 (0.0%) | 0.0 |
| Graduate Degree | 14 (43.8%) | 269.0 |
| Total | 32 (100.0%) | 15.0 |
Fertility by Education by Marriage Status in Sandston
37.5% of women with births in Sandston are unmarried. Women with the educational attainment of graduate degree are most likely to be married with 100.0% of them married at childbirth, while women with the educational attainment of high school diploma are least likely to be married with 66.7% of them unmarried at childbirth.
| Educational Attainment | Married | Unmarried |
| Less than High School | 0 (0.0%) | 0 (0.0%) |
| High School Diploma | 6 (33.3%) | 12 (66.7%) |
| College or Associate's Degree | 0 (0.0%) | 0 (0.0%) |
| Bachelor's Degree | 0 (0.0%) | 0 (0.0%) |
| Graduate Degree | 14 (100.0%) | 0 (0.0%) |
| Total | 20 (62.5%) | 12 (37.5%) |
Employment Characteristics in Sandston
Employment by Class of Employer in Sandston
Among the 4,083 employed individuals in Sandston, private company employees (3,049 | 74.7%), not-for-profit organizations (290 | 7.1%), and federal government employees (259 | 6.3%) make up the most common classes of employment.
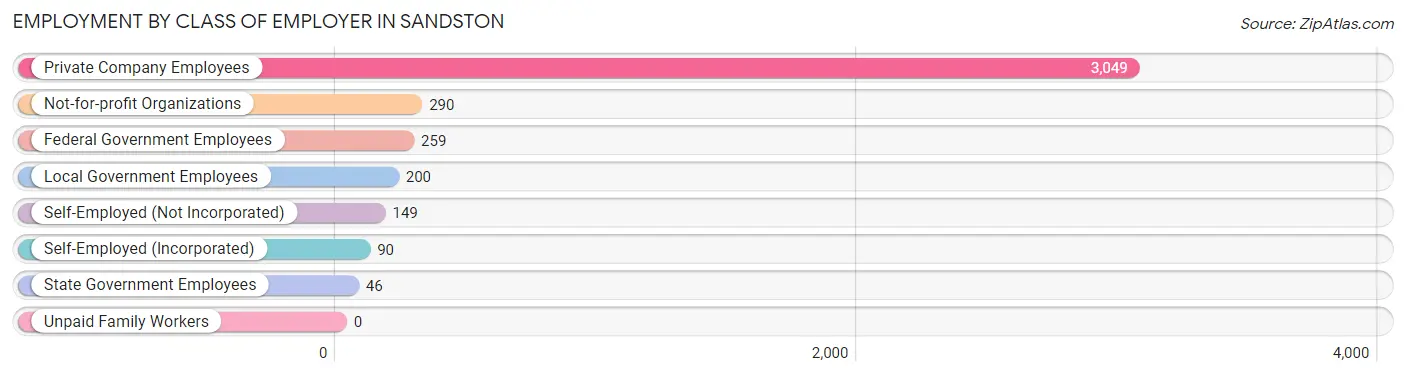
| Employer Class | # Employees | % Employees |
| Private Company Employees | 3,049 | 74.7% |
| Self-Employed (Incorporated) | 90 | 2.2% |
| Self-Employed (Not Incorporated) | 149 | 3.6% |
| Not-for-profit Organizations | 290 | 7.1% |
| Local Government Employees | 200 | 4.9% |
| State Government Employees | 46 | 1.1% |
| Federal Government Employees | 259 | 6.3% |
| Unpaid Family Workers | 0 | 0.0% |
| Total | 4,083 | 100.0% |
Employment Status by Age in Sandston
According to the labor force statistics for Sandston, out of the total population over 16 years of age (5,910), 74.5% or 4,403 individuals are in the labor force, with 6.3% or 277 of them unemployed. The age group with the highest labor force participation rate is 25 to 29 years, with 100.0% or 514 individuals in the labor force. Within the labor force, the 16 to 19 years age range has the highest percentage of unemployed individuals, with 26.1% or 59 of them being unemployed.
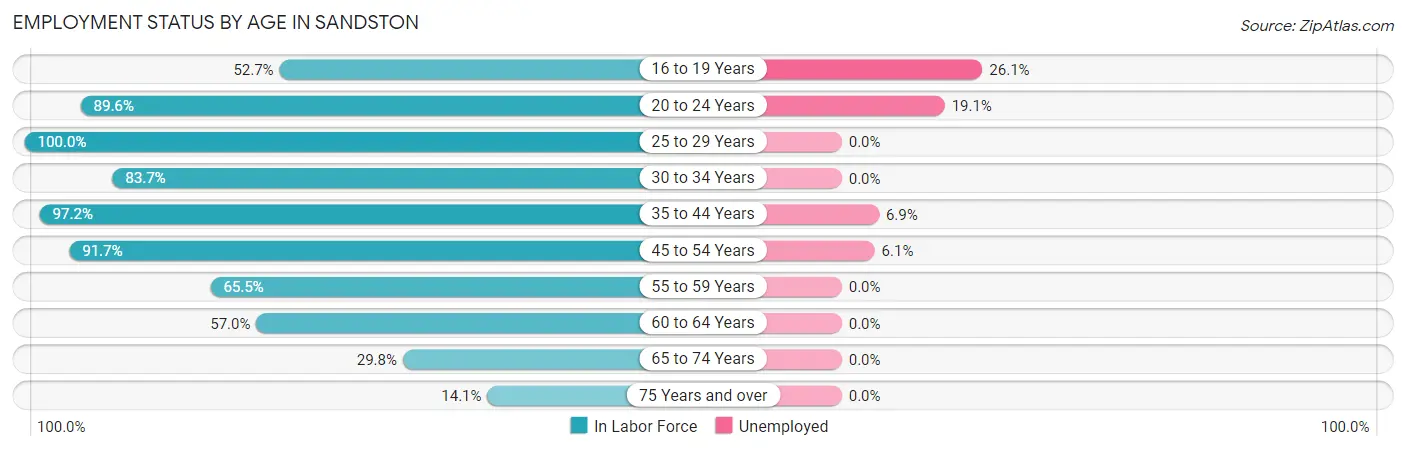
| Age Bracket | In Labor Force | Unemployed |
| 16 to 19 Years | 226 (52.7%) | 59 (26.1%) |
| 20 to 24 Years | 430 (89.6%) | 82 (19.1%) |
| 25 to 29 Years | 514 (100.0%) | 0 (0.0%) |
| 30 to 34 Years | 484 (83.7%) | 0 (0.0%) |
| 35 to 44 Years | 1,024 (97.2%) | 71 (6.9%) |
| 45 to 54 Years | 1,051 (91.7%) | 64 (6.1%) |
| 55 to 59 Years | 247 (65.5%) | 0 (0.0%) |
| 60 to 64 Years | 236 (57.0%) | 0 (0.0%) |
| 65 to 74 Years | 115 (29.8%) | 0 (0.0%) |
| 75 Years and over | 75 (14.1%) | 0 (0.0%) |
| Total | 4,403 (74.5%) | 277 (6.3%) |
Employment Status by Educational Attainment in Sandston
According to labor force statistics for Sandston, 87.1% of individuals (3,556) out of the total population between 25 and 64 years of age (4,083) are in the labor force, with 3.8% or 135 of them being unemployed. The group with the highest labor force participation rate are those with the educational attainment of college / associate degree, with 95.9% or 1,133 individuals in the labor force. Within the labor force, individuals with less than high school education have the highest percentage of unemployment, with 8.0% or 34 of them being unemployed.
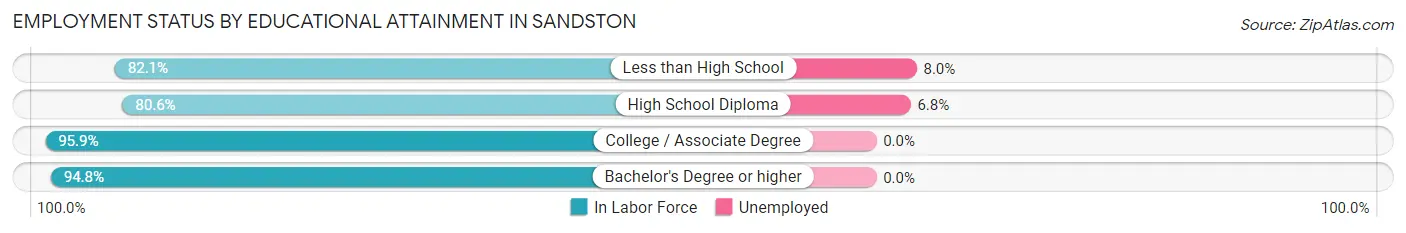
| Educational Attainment | In Labor Force | Unemployed |
| Less than High School | 423 (82.1%) | 41 (8.0%) |
| High School Diploma | 1,478 (80.6%) | 125 (6.8%) |
| College / Associate Degree | 1,133 (95.9%) | 0 (0.0%) |
| Bachelor's Degree or higher | 524 (94.8%) | 0 (0.0%) |
| Total | 3,556 (87.1%) | 155 (3.8%) |
Employment Occupations by Sex in Sandston
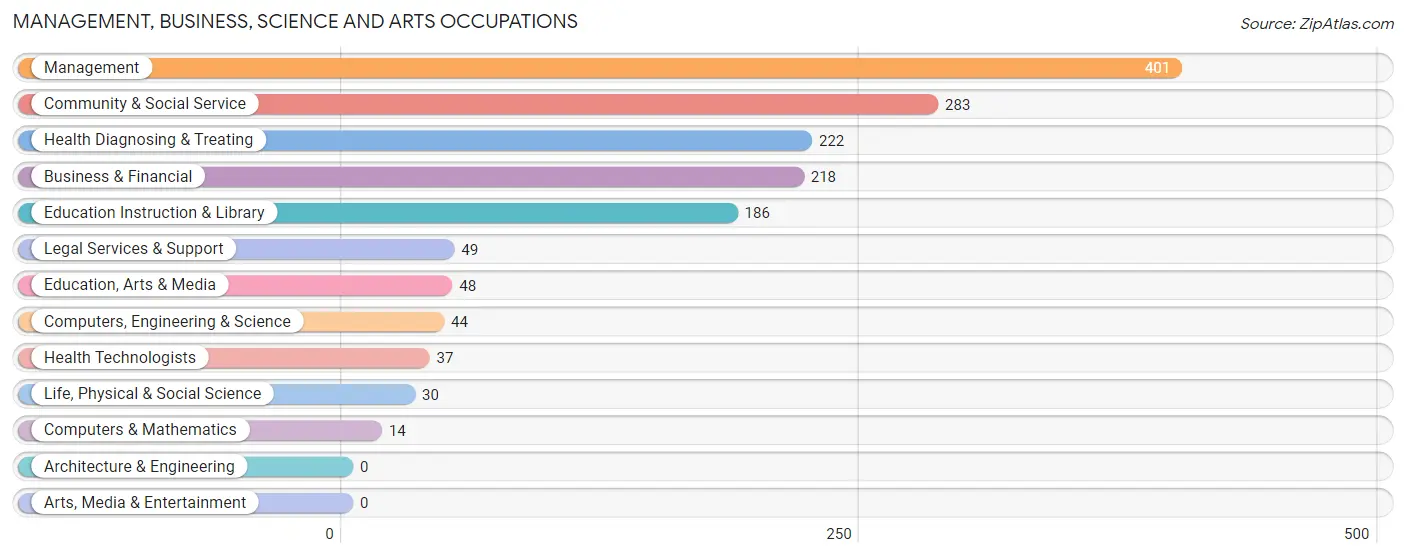
Management, Business, Science and Arts Occupations
The most common Management, Business, Science and Arts occupations in Sandston are Management (401 | 9.7%), Community & Social Service (283 | 6.9%), Health Diagnosing & Treating (222 | 5.4%), Business & Financial (218 | 5.3%), and Education Instruction & Library (186 | 4.5%).
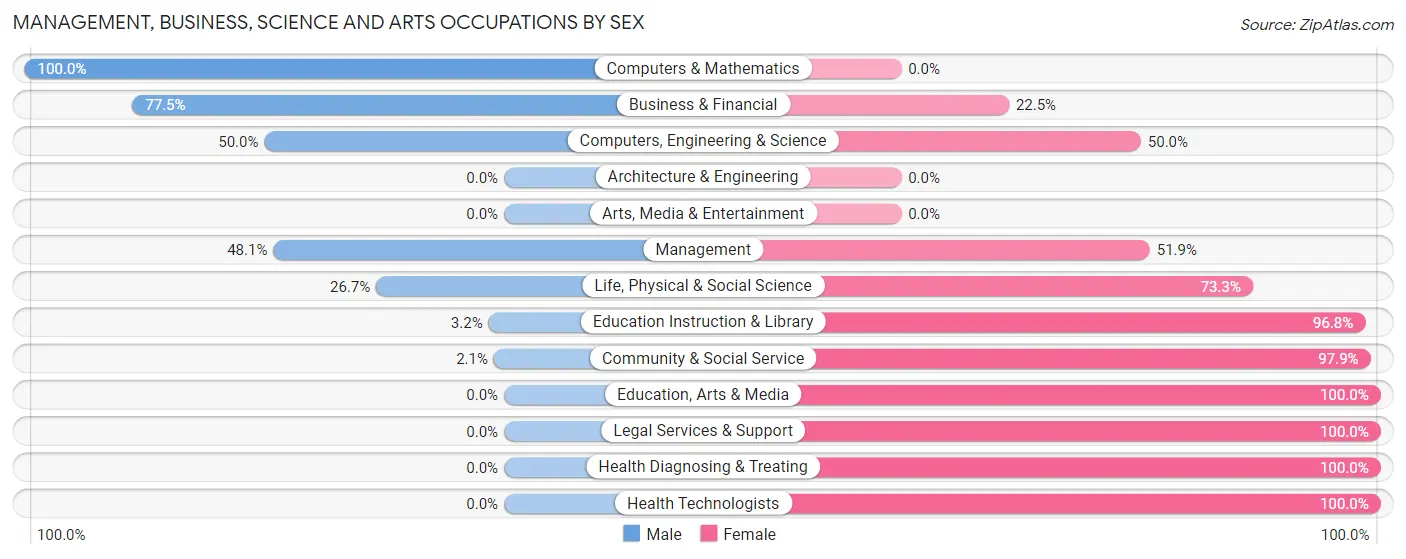
Management, Business, Science and Arts Occupations by Sex
Within the Management, Business, Science and Arts occupations in Sandston, the most male-oriented occupations are Computers & Mathematics (100.0%), Business & Financial (77.5%), and Computers, Engineering & Science (50.0%), while the most female-oriented occupations are Education, Arts & Media (100.0%), Legal Services & Support (100.0%), and Health Diagnosing & Treating (100.0%).
| Occupation | Male | Female |
| Management | 193 (48.1%) | 208 (51.9%) |
| Business & Financial | 169 (77.5%) | 49 (22.5%) |
| Computers, Engineering & Science | 22 (50.0%) | 22 (50.0%) |
| Computers & Mathematics | 14 (100.0%) | 0 (0.0%) |
| Architecture & Engineering | 0 (0.0%) | 0 (0.0%) |
| Life, Physical & Social Science | 8 (26.7%) | 22 (73.3%) |
| Community & Social Service | 6 (2.1%) | 277 (97.9%) |
| Education, Arts & Media | 0 (0.0%) | 48 (100.0%) |
| Legal Services & Support | 0 (0.0%) | 49 (100.0%) |
| Education Instruction & Library | 6 (3.2%) | 180 (96.8%) |
| Arts, Media & Entertainment | 0 (0.0%) | 0 (0.0%) |
| Health Diagnosing & Treating | 0 (0.0%) | 222 (100.0%) |
| Health Technologists | 0 (0.0%) | 37 (100.0%) |
| Total (Category) | 390 (33.4%) | 778 (66.6%) |
| Total (Overall) | 1,984 (48.1%) | 2,143 (51.9%) |
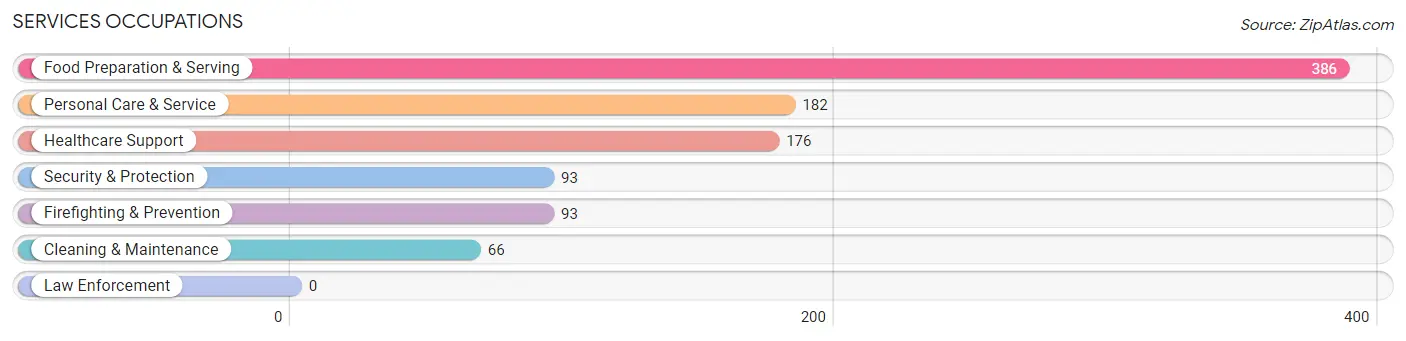
Services Occupations
The most common Services occupations in Sandston are Food Preparation & Serving (386 | 9.3%), Personal Care & Service (182 | 4.4%), Healthcare Support (176 | 4.3%), Security & Protection (93 | 2.2%), and Firefighting & Prevention (93 | 2.2%).
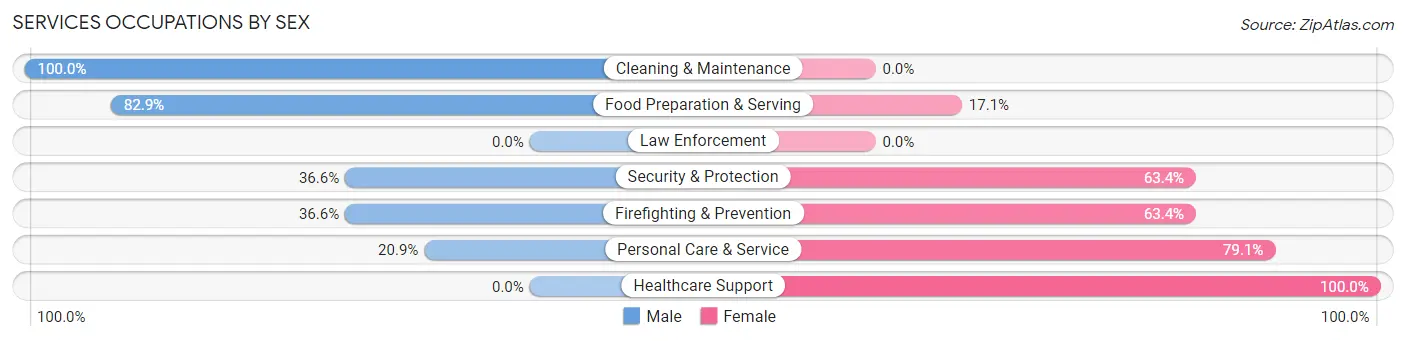
Services Occupations by Sex
Within the Services occupations in Sandston, the most male-oriented occupations are Cleaning & Maintenance (100.0%), Food Preparation & Serving (82.9%), and Security & Protection (36.6%), while the most female-oriented occupations are Healthcare Support (100.0%), Personal Care & Service (79.1%), and Security & Protection (63.4%).
| Occupation | Male | Female |
| Healthcare Support | 0 (0.0%) | 176 (100.0%) |
| Security & Protection | 34 (36.6%) | 59 (63.4%) |
| Firefighting & Prevention | 34 (36.6%) | 59 (63.4%) |
| Law Enforcement | 0 (0.0%) | 0 (0.0%) |
| Food Preparation & Serving | 320 (82.9%) | 66 (17.1%) |
| Cleaning & Maintenance | 66 (100.0%) | 0 (0.0%) |
| Personal Care & Service | 38 (20.9%) | 144 (79.1%) |
| Total (Category) | 458 (50.7%) | 445 (49.3%) |
| Total (Overall) | 1,984 (48.1%) | 2,143 (51.9%) |
Sales and Office Occupations
The most common Sales and Office occupations in Sandston are Office & Administration (872 | 21.1%), and Sales & Related (155 | 3.8%).
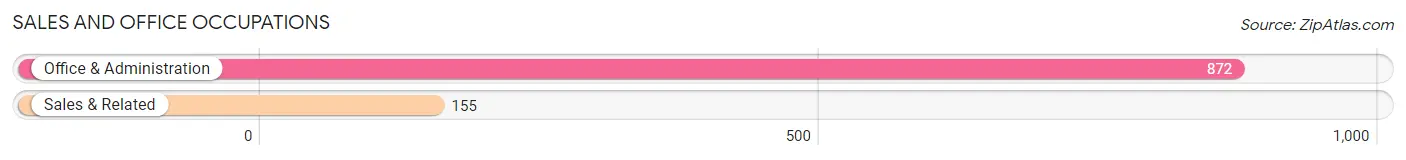
Sales and Office Occupations by Sex
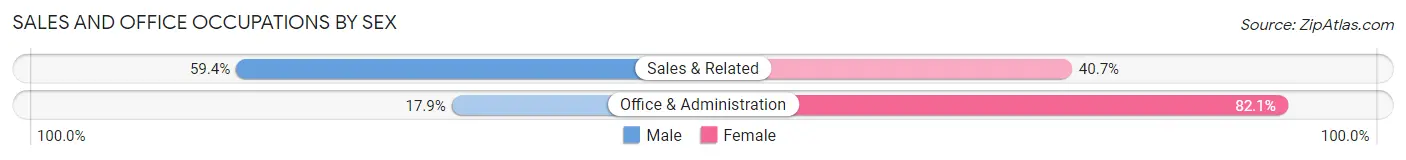
| Occupation | Male | Female |
| Sales & Related | 92 (59.4%) | 63 (40.6%) |
| Office & Administration | 156 (17.9%) | 716 (82.1%) |
| Total (Category) | 248 (24.1%) | 779 (75.8%) |
| Total (Overall) | 1,984 (48.1%) | 2,143 (51.9%) |
Natural Resources, Construction and Maintenance Occupations
The most common Natural Resources, Construction and Maintenance occupations in Sandston are Construction & Extraction (230 | 5.6%), and Installation, Maintenance & Repair (103 | 2.5%).
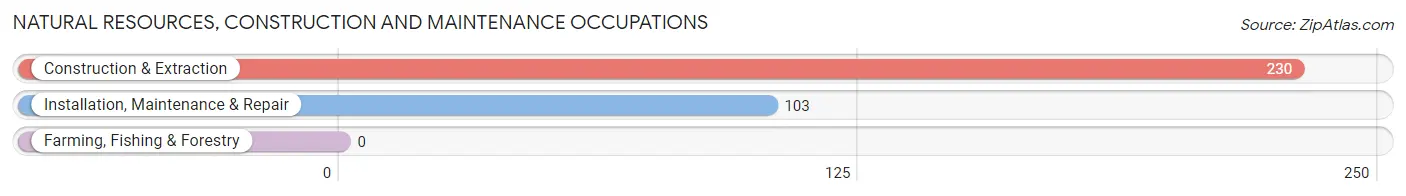
Natural Resources, Construction and Maintenance Occupations by Sex
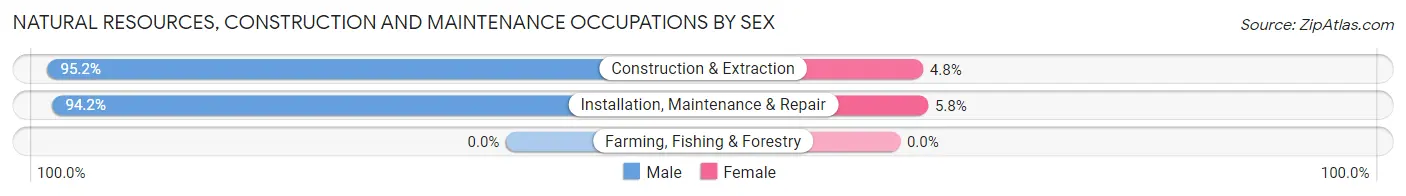
| Occupation | Male | Female |
| Farming, Fishing & Forestry | 0 (0.0%) | 0 (0.0%) |
| Construction & Extraction | 219 (95.2%) | 11 (4.8%) |
| Installation, Maintenance & Repair | 97 (94.2%) | 6 (5.8%) |
| Total (Category) | 316 (94.9%) | 17 (5.1%) |
| Total (Overall) | 1,984 (48.1%) | 2,143 (51.9%) |
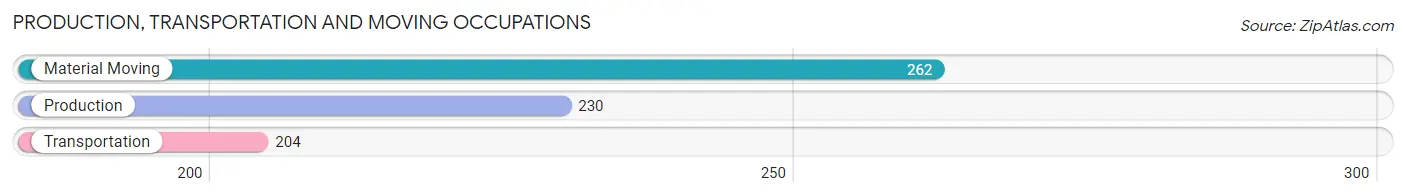
Production, Transportation and Moving Occupations
The most common Production, Transportation and Moving occupations in Sandston are Material Moving (262 | 6.4%), Production (230 | 5.6%), and Transportation (204 | 4.9%).
Production, Transportation and Moving Occupations by Sex
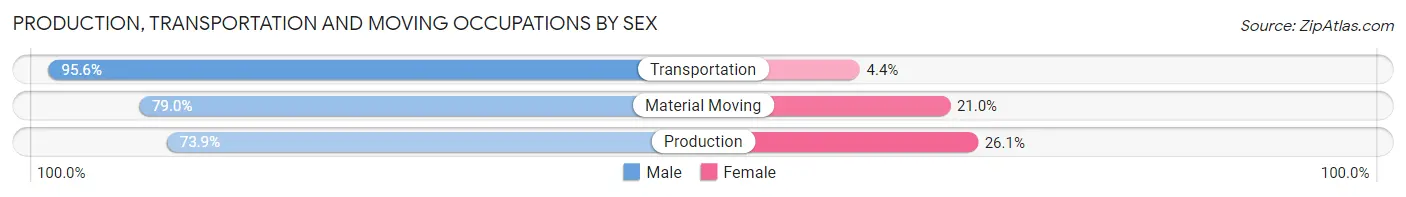
| Occupation | Male | Female |
| Production | 170 (73.9%) | 60 (26.1%) |
| Transportation | 195 (95.6%) | 9 (4.4%) |
| Material Moving | 207 (79.0%) | 55 (21.0%) |
| Total (Category) | 572 (82.2%) | 124 (17.8%) |
| Total (Overall) | 1,984 (48.1%) | 2,143 (51.9%) |
Employment Industries by Sex in Sandston
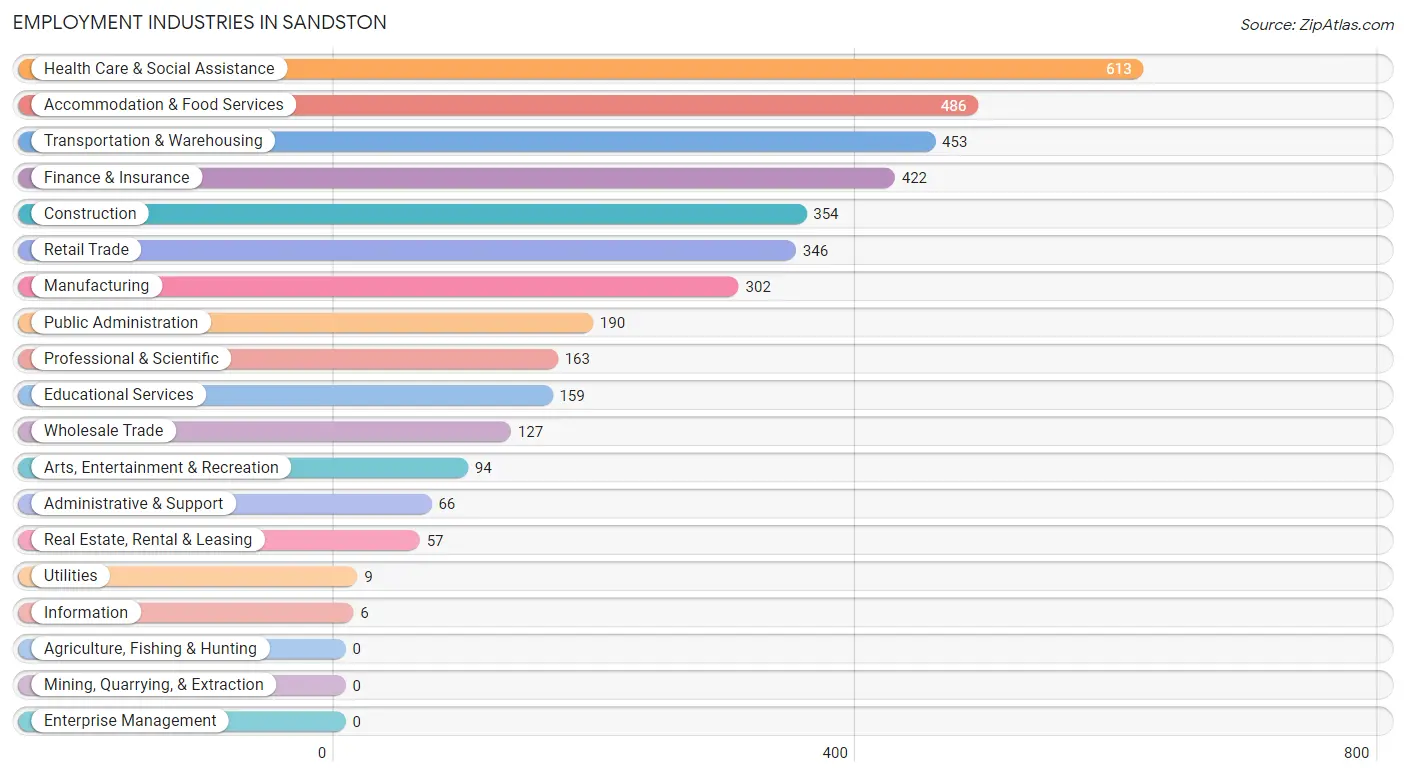
Employment Industries in Sandston
The major employment industries in Sandston include Health Care & Social Assistance (613 | 14.8%), Accommodation & Food Services (486 | 11.8%), Transportation & Warehousing (453 | 11.0%), Finance & Insurance (422 | 10.2%), and Construction (354 | 8.6%).
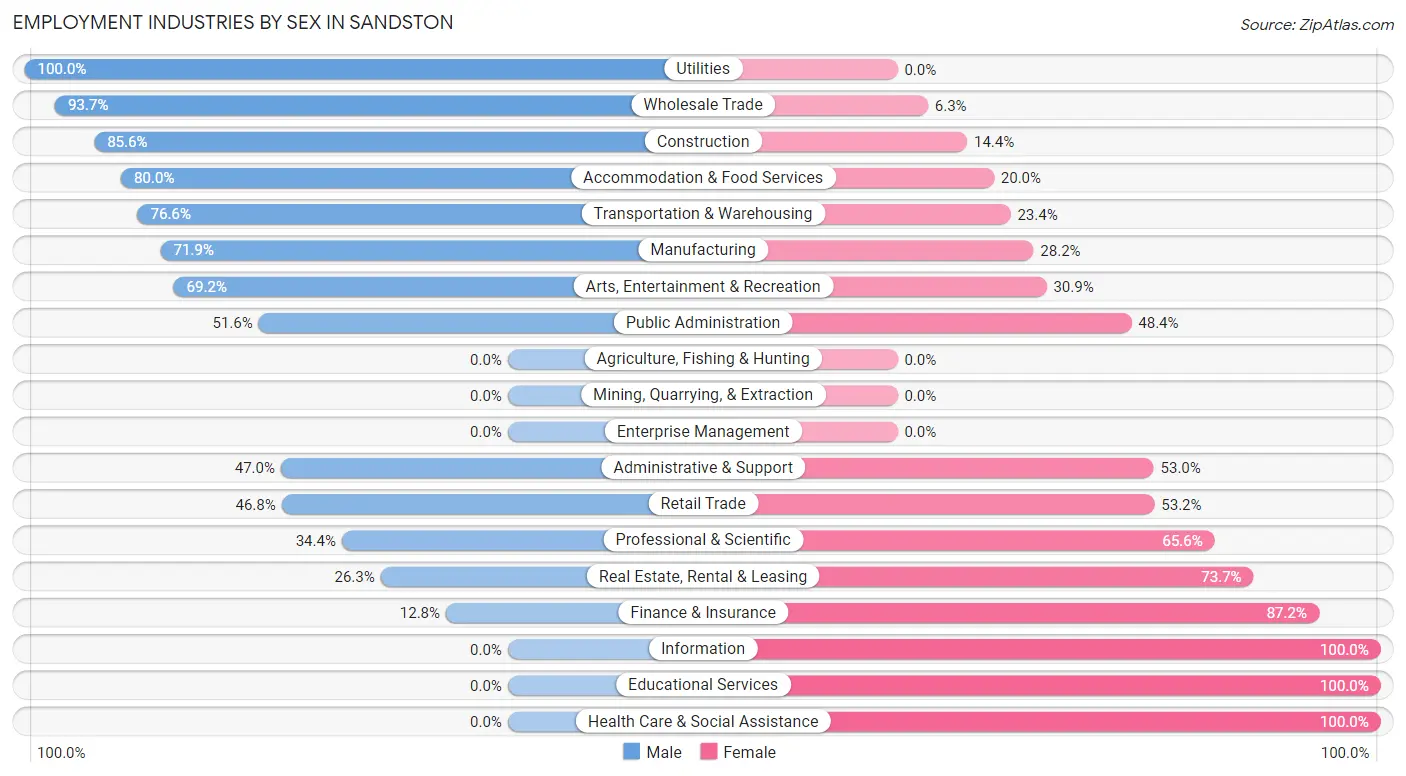
Employment Industries by Sex in Sandston
The Sandston industries that see more men than women are Utilities (100.0%), Wholesale Trade (93.7%), and Construction (85.6%), whereas the industries that tend to have a higher number of women are Information (100.0%), Educational Services (100.0%), and Health Care & Social Assistance (100.0%).
| Industry | Male | Female |
| Agriculture, Fishing & Hunting | 0 (0.0%) | 0 (0.0%) |
| Mining, Quarrying, & Extraction | 0 (0.0%) | 0 (0.0%) |
| Construction | 303 (85.6%) | 51 (14.4%) |
| Manufacturing | 217 (71.9%) | 85 (28.1%) |
| Wholesale Trade | 119 (93.7%) | 8 (6.3%) |
| Retail Trade | 162 (46.8%) | 184 (53.2%) |
| Transportation & Warehousing | 347 (76.6%) | 106 (23.4%) |
| Utilities | 9 (100.0%) | 0 (0.0%) |
| Information | 0 (0.0%) | 6 (100.0%) |
| Finance & Insurance | 54 (12.8%) | 368 (87.2%) |
| Real Estate, Rental & Leasing | 15 (26.3%) | 42 (73.7%) |
| Professional & Scientific | 56 (34.4%) | 107 (65.6%) |
| Enterprise Management | 0 (0.0%) | 0 (0.0%) |
| Administrative & Support | 31 (47.0%) | 35 (53.0%) |
| Educational Services | 0 (0.0%) | 159 (100.0%) |
| Health Care & Social Assistance | 0 (0.0%) | 613 (100.0%) |
| Arts, Entertainment & Recreation | 65 (69.2%) | 29 (30.8%) |
| Accommodation & Food Services | 389 (80.0%) | 97 (20.0%) |
| Public Administration | 98 (51.6%) | 92 (48.4%) |
| Total | 1,984 (48.1%) | 2,143 (51.9%) |
Education in Sandston
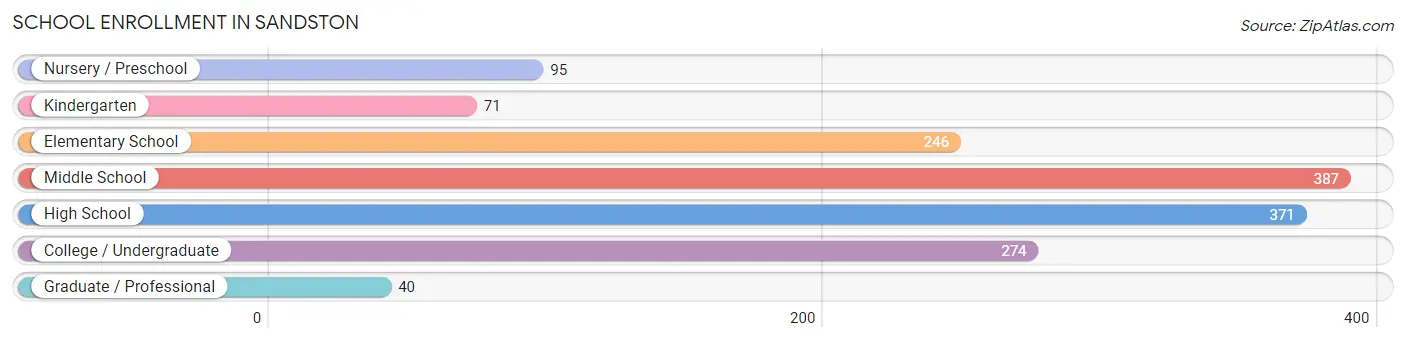
School Enrollment in Sandston
The most common levels of schooling among the 1,484 students in Sandston are middle school (387 | 26.1%), high school (371 | 25.0%), and college / undergraduate (274 | 18.5%).
| School Level | # Students | % Students |
| Nursery / Preschool | 95 | 6.4% |
| Kindergarten | 71 | 4.8% |
| Elementary School | 246 | 16.6% |
| Middle School | 387 | 26.1% |
| High School | 371 | 25.0% |
| College / Undergraduate | 274 | 18.5% |
| Graduate / Professional | 40 | 2.7% |
| Total | 1,484 | 100.0% |
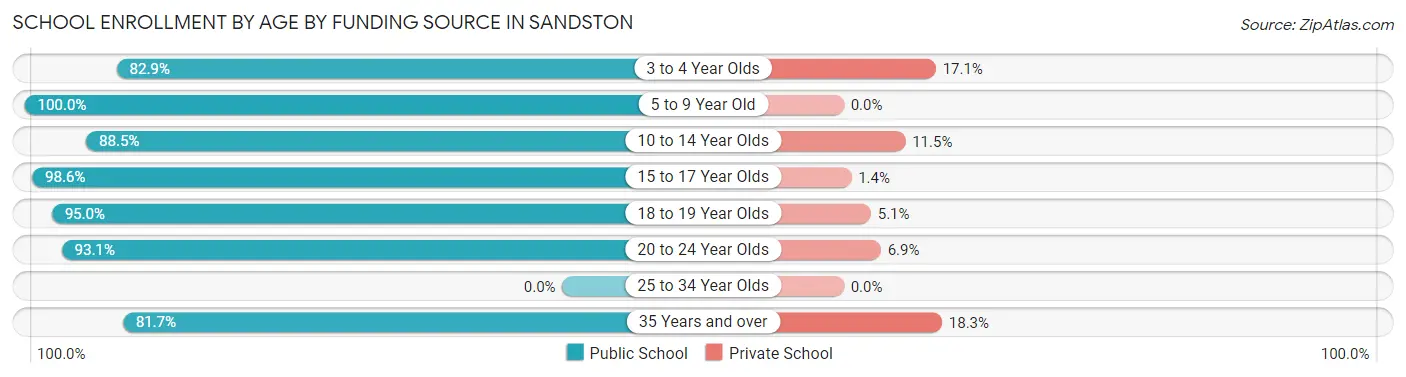
School Enrollment by Age by Funding Source in Sandston
Out of a total of 1,484 students who are enrolled in schools in Sandston, 93 (6.3%) attend a private institution, while the remaining 1,391 (93.7%) are enrolled in public schools. The age group of 35 years and over has the highest likelihood of being enrolled in private schools, with 15 (18.3% in the age bracket) enrolled. Conversely, the age group of 5 to 9 year old has the lowest likelihood of being enrolled in a private school, with 342 (100.0% in the age bracket) attending a public institution.
| Age Bracket | Public School | Private School |
| 3 to 4 Year Olds | 58 (82.9%) | 12 (17.1%) |
| 5 to 9 Year Old | 342 (100.0%) | 0 (0.0%) |
| 10 to 14 Year Olds | 355 (88.5%) | 46 (11.5%) |
| 15 to 17 Year Olds | 280 (98.6%) | 4 (1.4%) |
| 18 to 19 Year Olds | 207 (95.0%) | 11 (5.1%) |
| 20 to 24 Year Olds | 81 (93.1%) | 6 (6.9%) |
| 25 to 34 Year Olds | 0 (0.0%) | 0 (0.0%) |
| 35 Years and over | 67 (81.7%) | 15 (18.3%) |
| Total | 1,391 (93.7%) | 93 (6.3%) |
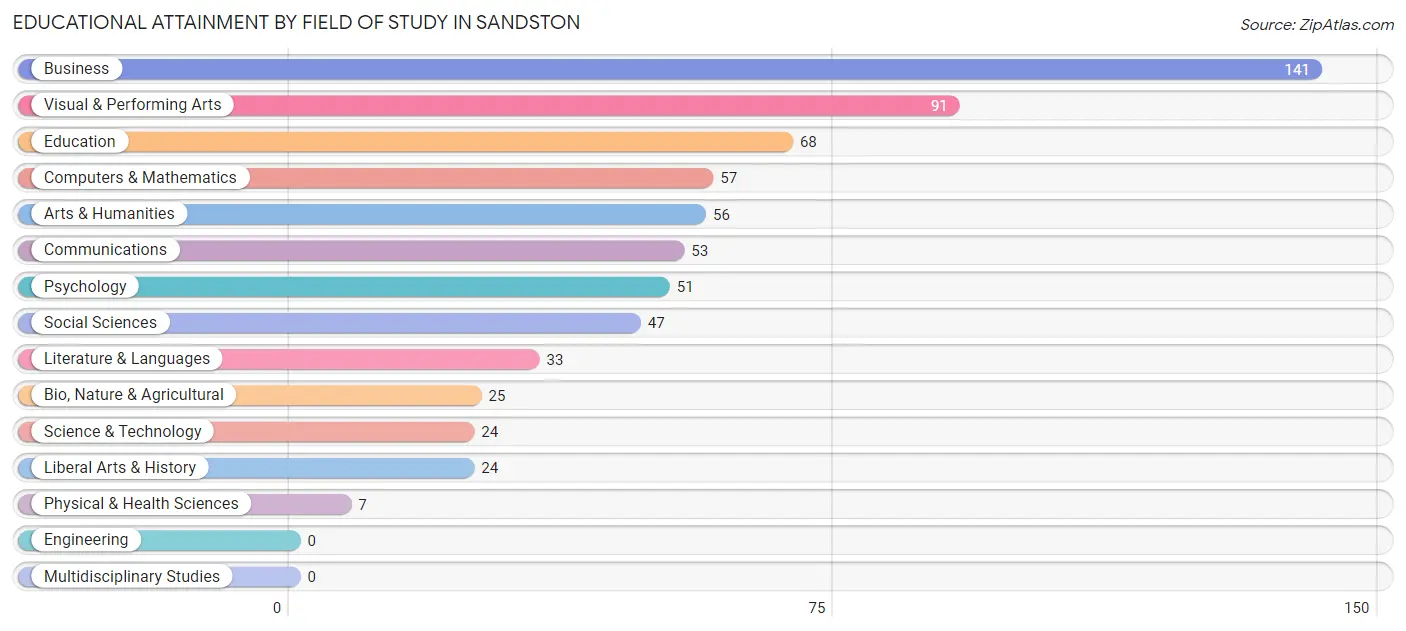
Educational Attainment by Field of Study in Sandston
Business (141 | 20.8%), visual & performing arts (91 | 13.4%), education (68 | 10.0%), computers & mathematics (57 | 8.4%), and arts & humanities (56 | 8.3%) are the most common fields of study among 677 individuals in Sandston who have obtained a bachelor's degree or higher.
| Field of Study | # Graduates | % Graduates |
| Computers & Mathematics | 57 | 8.4% |
| Bio, Nature & Agricultural | 25 | 3.7% |
| Physical & Health Sciences | 7 | 1.0% |
| Psychology | 51 | 7.5% |
| Social Sciences | 47 | 6.9% |
| Engineering | 0 | 0.0% |
| Multidisciplinary Studies | 0 | 0.0% |
| Science & Technology | 24 | 3.5% |
| Business | 141 | 20.8% |
| Education | 68 | 10.0% |
| Literature & Languages | 33 | 4.9% |
| Liberal Arts & History | 24 | 3.5% |
| Visual & Performing Arts | 91 | 13.4% |
| Communications | 53 | 7.8% |
| Arts & Humanities | 56 | 8.3% |
| Total | 677 | 100.0% |
Transportation & Commute in Sandston
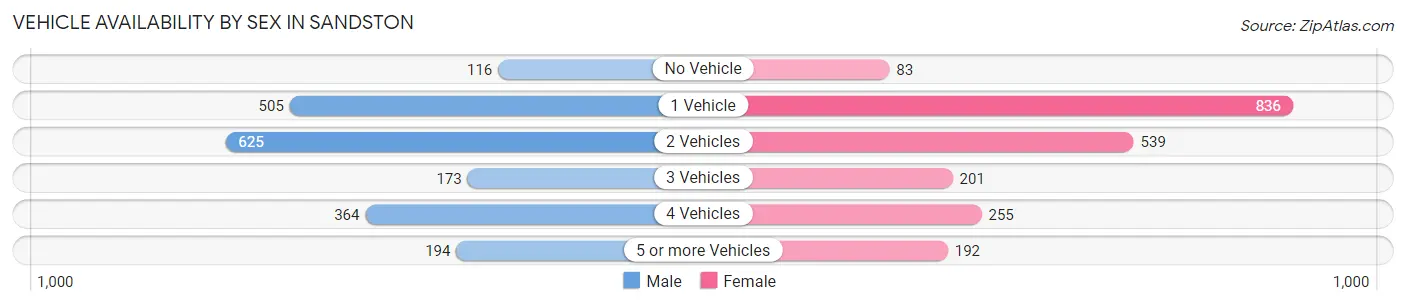
Vehicle Availability by Sex in Sandston
The most prevalent vehicle ownership categories in Sandston are males with 2 vehicles (625, accounting for 31.6%) and females with 2 vehicles (539, making up 29.7%).
| Vehicles Available | Male | Female |
| No Vehicle | 116 (5.9%) | 83 (3.9%) |
| 1 Vehicle | 505 (25.5%) | 836 (39.7%) |
| 2 Vehicles | 625 (31.6%) | 539 (25.6%) |
| 3 Vehicles | 173 (8.7%) | 201 (9.5%) |
| 4 Vehicles | 364 (18.4%) | 255 (12.1%) |
| 5 or more Vehicles | 194 (9.8%) | 192 (9.1%) |
| Total | 1,977 (100.0%) | 2,106 (100.0%) |
Commute Time in Sandston
The most frequently occuring commute durations in Sandston are 15 to 19 minutes (685 commuters, 18.5%), 20 to 24 minutes (662 commuters, 17.9%), and 5 to 9 minutes (480 commuters, 13.0%).
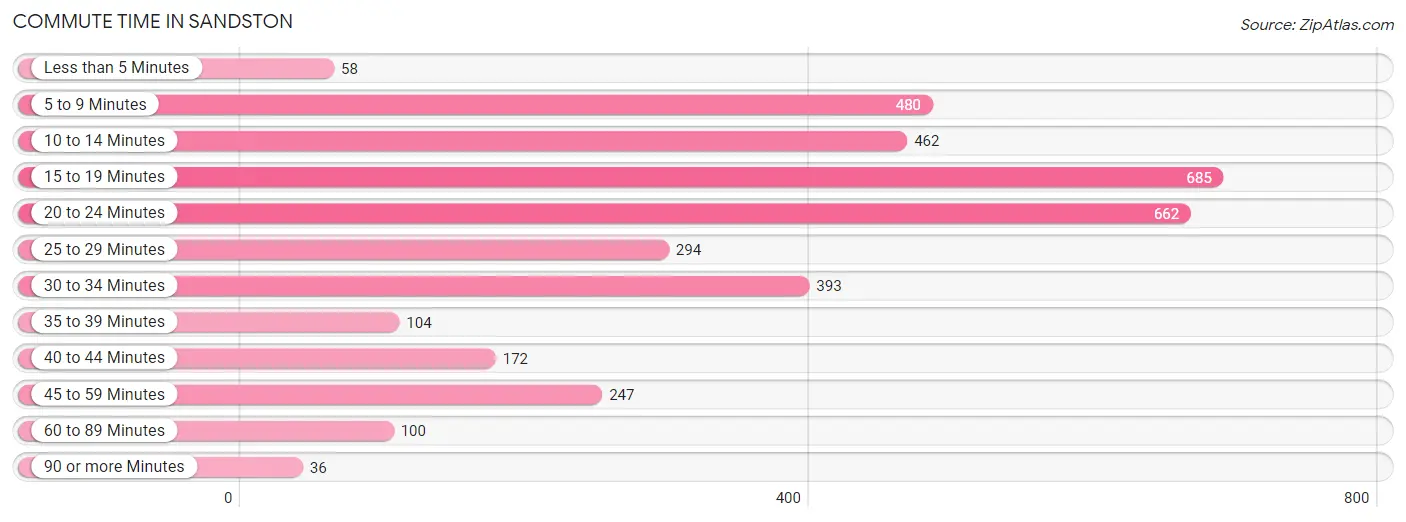
| Commute Time | # Commuters | % Commuters |
| Less than 5 Minutes | 58 | 1.6% |
| 5 to 9 Minutes | 480 | 13.0% |
| 10 to 14 Minutes | 462 | 12.5% |
| 15 to 19 Minutes | 685 | 18.5% |
| 20 to 24 Minutes | 662 | 17.9% |
| 25 to 29 Minutes | 294 | 8.0% |
| 30 to 34 Minutes | 393 | 10.6% |
| 35 to 39 Minutes | 104 | 2.8% |
| 40 to 44 Minutes | 172 | 4.7% |
| 45 to 59 Minutes | 247 | 6.7% |
| 60 to 89 Minutes | 100 | 2.7% |
| 90 or more Minutes | 36 | 1.0% |
Commute Time by Sex in Sandston
The most common commute times in Sandston are 15 to 19 minutes (322 commuters, 18.1%) for males and 20 to 24 minutes (375 commuters, 19.6%) for females.
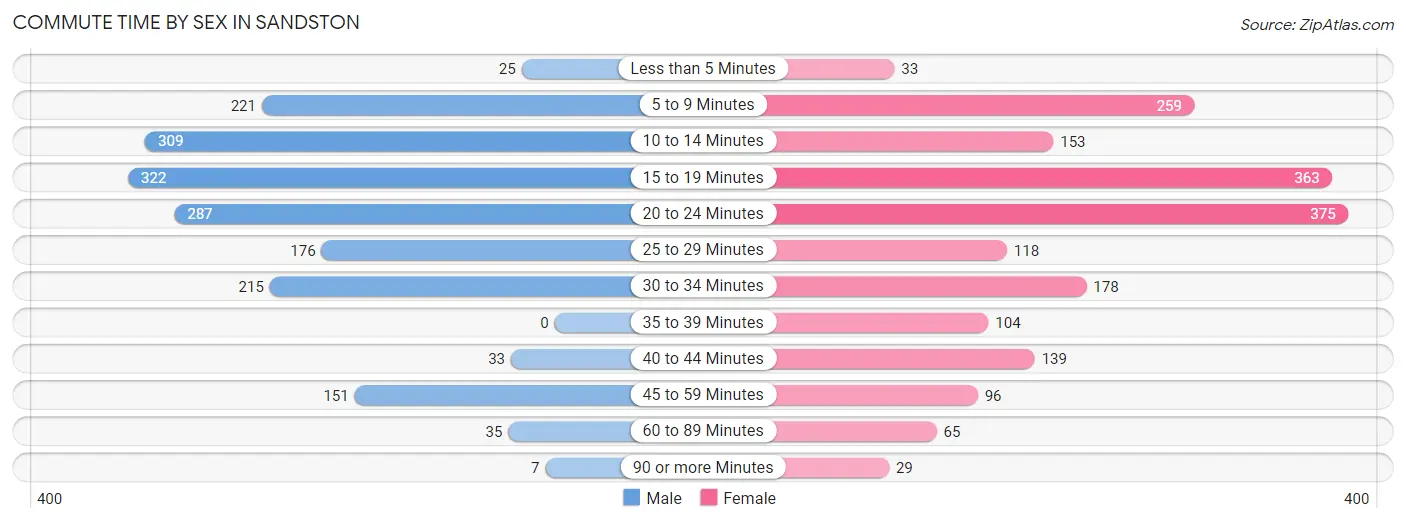
| Commute Time | Male | Female |
| Less than 5 Minutes | 25 (1.4%) | 33 (1.7%) |
| 5 to 9 Minutes | 221 (12.4%) | 259 (13.6%) |
| 10 to 14 Minutes | 309 (17.3%) | 153 (8.0%) |
| 15 to 19 Minutes | 322 (18.1%) | 363 (19.0%) |
| 20 to 24 Minutes | 287 (16.1%) | 375 (19.6%) |
| 25 to 29 Minutes | 176 (9.9%) | 118 (6.2%) |
| 30 to 34 Minutes | 215 (12.1%) | 178 (9.3%) |
| 35 to 39 Minutes | 0 (0.0%) | 104 (5.4%) |
| 40 to 44 Minutes | 33 (1.8%) | 139 (7.3%) |
| 45 to 59 Minutes | 151 (8.5%) | 96 (5.0%) |
| 60 to 89 Minutes | 35 (2.0%) | 65 (3.4%) |
| 90 or more Minutes | 7 (0.4%) | 29 (1.5%) |
Time of Departure to Work by Sex in Sandston
The most frequent times of departure to work in Sandston are 4:00 PM to 11:59 PM (272, 15.3%) for males and 6:30 AM to 6:59 AM (310, 16.2%) for females.
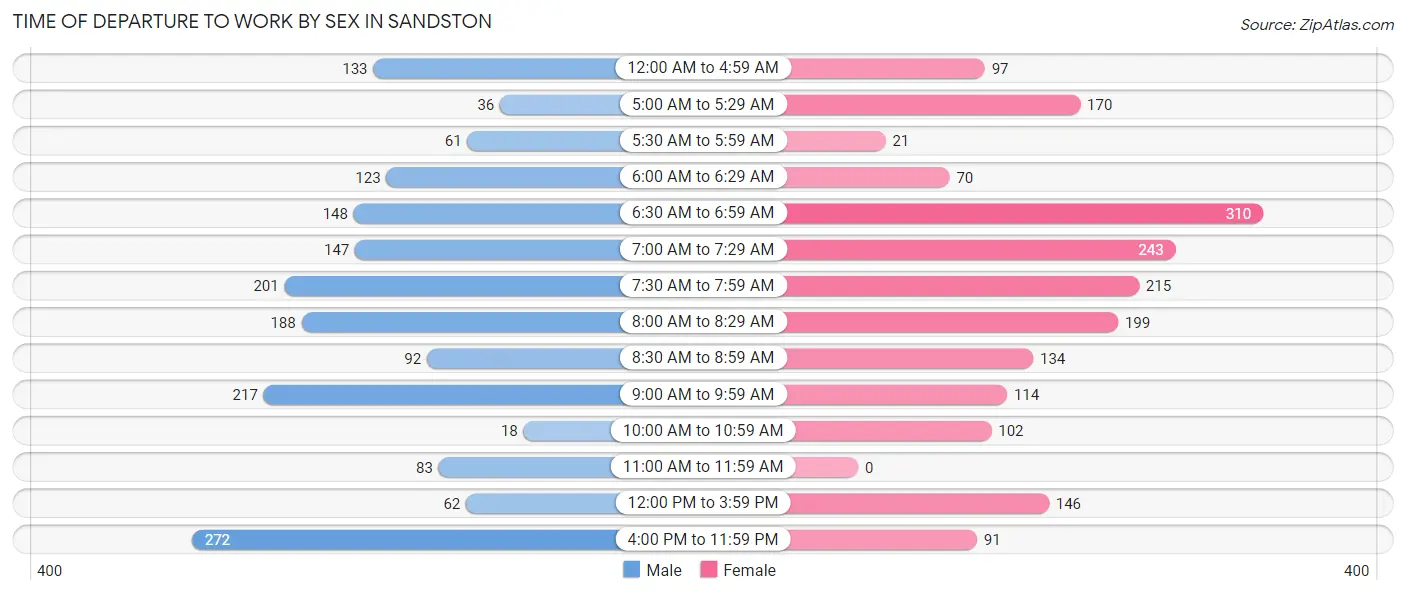
| Time of Departure | Male | Female |
| 12:00 AM to 4:59 AM | 133 (7.5%) | 97 (5.1%) |
| 5:00 AM to 5:29 AM | 36 (2.0%) | 170 (8.9%) |
| 5:30 AM to 5:59 AM | 61 (3.4%) | 21 (1.1%) |
| 6:00 AM to 6:29 AM | 123 (6.9%) | 70 (3.7%) |
| 6:30 AM to 6:59 AM | 148 (8.3%) | 310 (16.2%) |
| 7:00 AM to 7:29 AM | 147 (8.3%) | 243 (12.7%) |
| 7:30 AM to 7:59 AM | 201 (11.3%) | 215 (11.2%) |
| 8:00 AM to 8:29 AM | 188 (10.6%) | 199 (10.4%) |
| 8:30 AM to 8:59 AM | 92 (5.2%) | 134 (7.0%) |
| 9:00 AM to 9:59 AM | 217 (12.2%) | 114 (6.0%) |
| 10:00 AM to 10:59 AM | 18 (1.0%) | 102 (5.3%) |
| 11:00 AM to 11:59 AM | 83 (4.7%) | 0 (0.0%) |
| 12:00 PM to 3:59 PM | 62 (3.5%) | 146 (7.6%) |
| 4:00 PM to 11:59 PM | 272 (15.3%) | 91 (4.8%) |
| Total | 1,781 (100.0%) | 1,912 (100.0%) |
Housing Occupancy in Sandston
Occupancy by Ownership in Sandston
Of the total 3,003 dwellings in Sandston, owner-occupied units account for 1,430 (47.6%), while renter-occupied units make up 1,573 (52.4%).
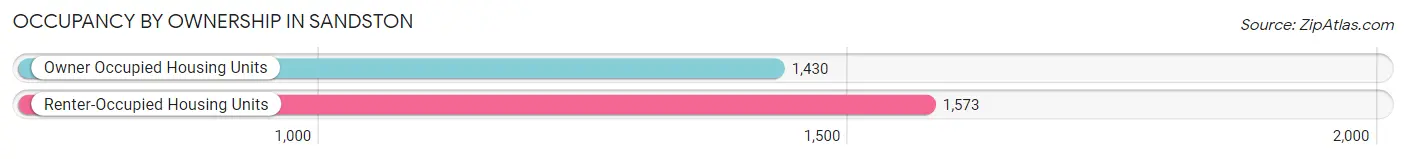
| Occupancy | # Housing Units | % Housing Units |
| Owner Occupied Housing Units | 1,430 | 47.6% |
| Renter-Occupied Housing Units | 1,573 | 52.4% |
| Total Occupied Housing Units | 3,003 | 100.0% |
Occupancy by Household Size in Sandston
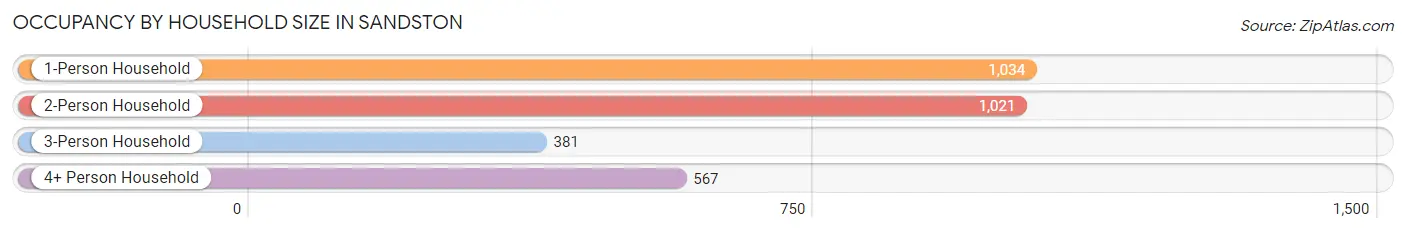
| Household Size | # Housing Units | % Housing Units |
| 1-Person Household | 1,034 | 34.4% |
| 2-Person Household | 1,021 | 34.0% |
| 3-Person Household | 381 | 12.7% |
| 4+ Person Household | 567 | 18.9% |
| Total Housing Units | 3,003 | 100.0% |
Occupancy by Ownership by Household Size in Sandston
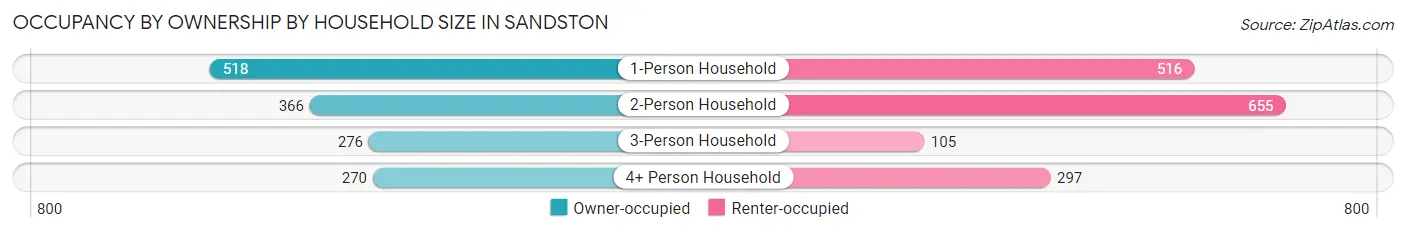
| Household Size | Owner-occupied | Renter-occupied |
| 1-Person Household | 518 (50.1%) | 516 (49.9%) |
| 2-Person Household | 366 (35.8%) | 655 (64.1%) |
| 3-Person Household | 276 (72.4%) | 105 (27.6%) |
| 4+ Person Household | 270 (47.6%) | 297 (52.4%) |
| Total Housing Units | 1,430 (47.6%) | 1,573 (52.4%) |
Occupancy by Educational Attainment in Sandston
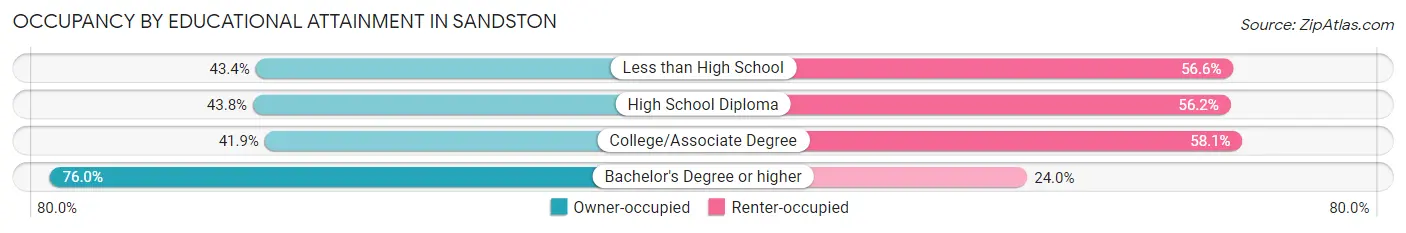
| Household Size | Owner-occupied | Renter-occupied |
| Less than High School | 170 (43.4%) | 222 (56.6%) |
| High School Diploma | 575 (43.8%) | 738 (56.2%) |
| College/Associate Degree | 371 (41.9%) | 514 (58.1%) |
| Bachelor's Degree or higher | 314 (76.0%) | 99 (24.0%) |
Occupancy by Age of Householder in Sandston
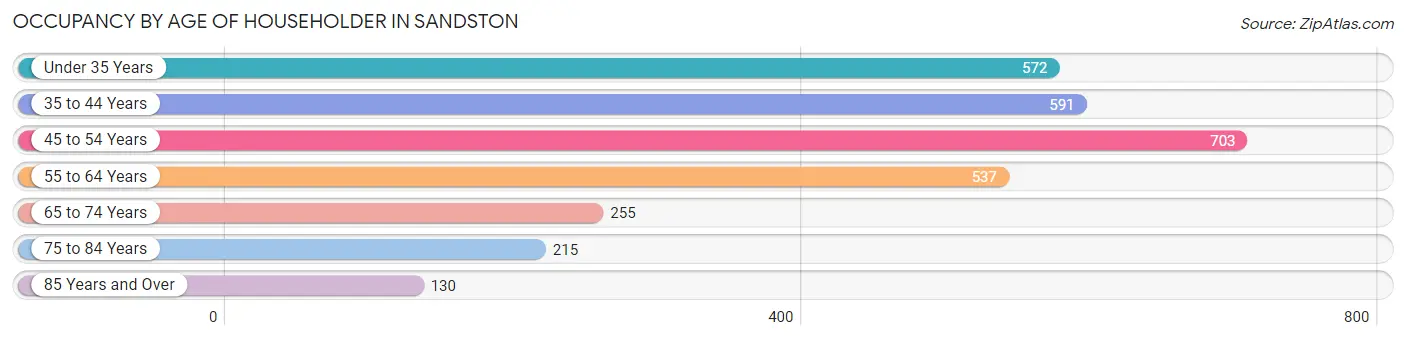
| Age Bracket | # Households | % Households |
| Under 35 Years | 572 | 19.1% |
| 35 to 44 Years | 591 | 19.7% |
| 45 to 54 Years | 703 | 23.4% |
| 55 to 64 Years | 537 | 17.9% |
| 65 to 74 Years | 255 | 8.5% |
| 75 to 84 Years | 215 | 7.2% |
| 85 Years and Over | 130 | 4.3% |
| Total | 3,003 | 100.0% |
Housing Finances in Sandston
Median Income by Occupancy in Sandston
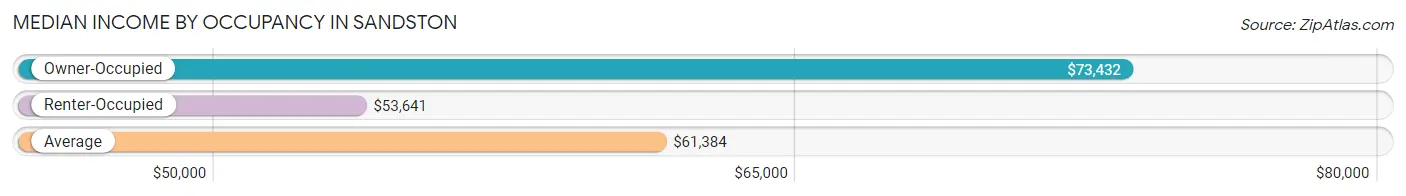
| Occupancy Type | # Households | Median Income |
| Owner-Occupied | 1,430 (47.6%) | $73,432 |
| Renter-Occupied | 1,573 (52.4%) | $53,641 |
| Average | 3,003 (100.0%) | $61,384 |
Occupancy by Householder Income Bracket in Sandston
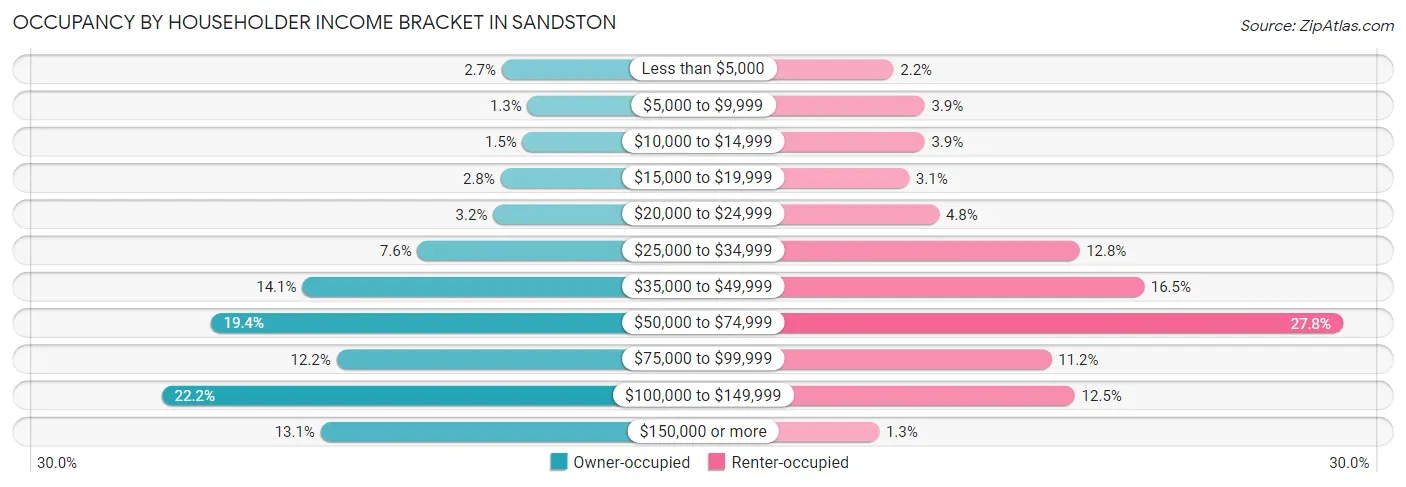
| Income Bracket | Owner-occupied | Renter-occupied |
| Less than $5,000 | 39 (2.7%) | 34 (2.2%) |
| $5,000 to $9,999 | 18 (1.3%) | 62 (3.9%) |
| $10,000 to $14,999 | 22 (1.5%) | 62 (3.9%) |
| $15,000 to $19,999 | 40 (2.8%) | 48 (3.0%) |
| $20,000 to $24,999 | 46 (3.2%) | 75 (4.8%) |
| $25,000 to $34,999 | 108 (7.5%) | 201 (12.8%) |
| $35,000 to $49,999 | 202 (14.1%) | 259 (16.5%) |
| $50,000 to $74,999 | 277 (19.4%) | 438 (27.8%) |
| $75,000 to $99,999 | 174 (12.2%) | 176 (11.2%) |
| $100,000 to $149,999 | 317 (22.2%) | 197 (12.5%) |
| $150,000 or more | 187 (13.1%) | 21 (1.3%) |
| Total | 1,430 (100.0%) | 1,573 (100.0%) |
Monthly Housing Cost Tiers in Sandston
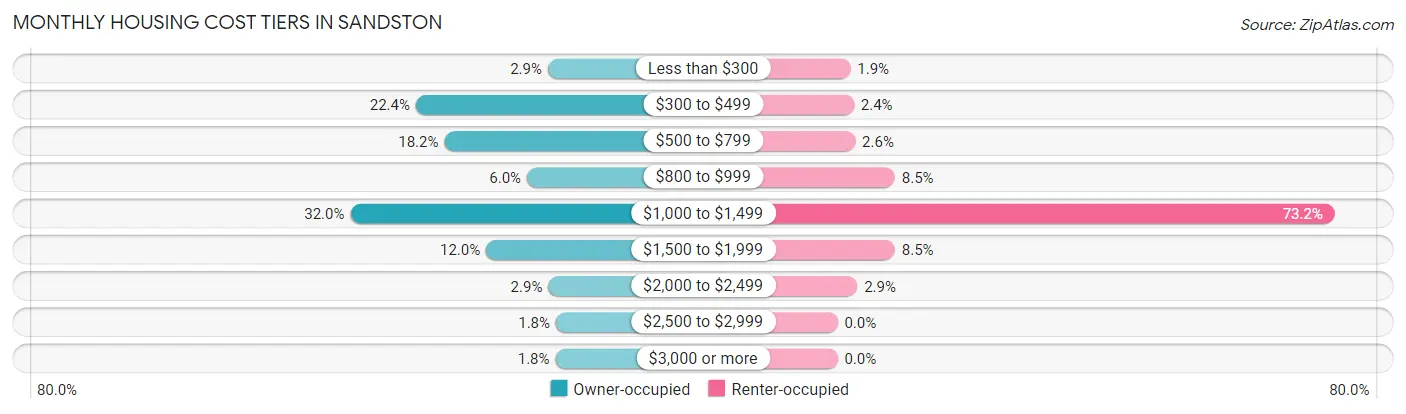
| Monthly Cost | Owner-occupied | Renter-occupied |
| Less than $300 | 42 (2.9%) | 30 (1.9%) |
| $300 to $499 | 320 (22.4%) | 38 (2.4%) |
| $500 to $799 | 260 (18.2%) | 41 (2.6%) |
| $800 to $999 | 86 (6.0%) | 133 (8.5%) |
| $1,000 to $1,499 | 458 (32.0%) | 1,152 (73.2%) |
| $1,500 to $1,999 | 172 (12.0%) | 133 (8.5%) |
| $2,000 to $2,499 | 41 (2.9%) | 46 (2.9%) |
| $2,500 to $2,999 | 25 (1.8%) | 0 (0.0%) |
| $3,000 or more | 26 (1.8%) | 0 (0.0%) |
| Total | 1,430 (100.0%) | 1,573 (100.0%) |
Physical Housing Characteristics in Sandston
Housing Structures in Sandston
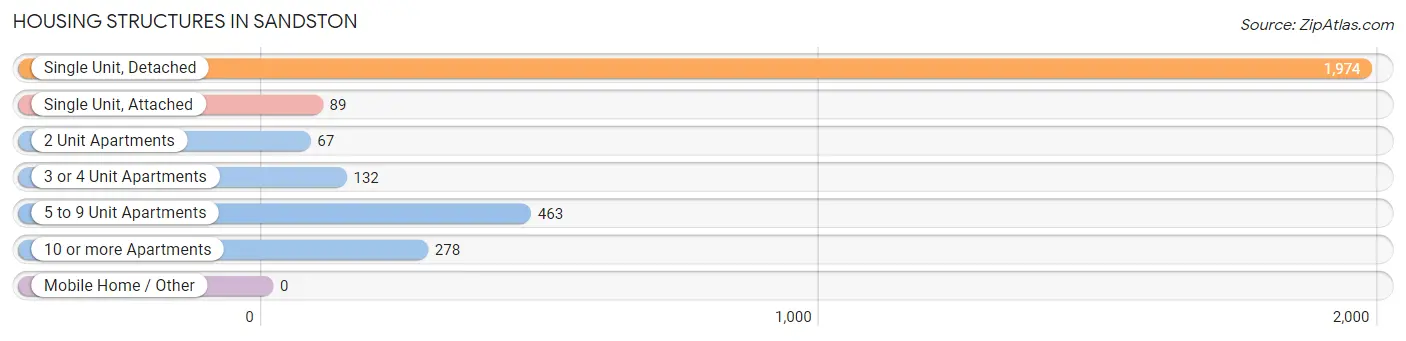
| Structure Type | # Housing Units | % Housing Units |
| Single Unit, Detached | 1,974 | 65.7% |
| Single Unit, Attached | 89 | 3.0% |
| 2 Unit Apartments | 67 | 2.2% |
| 3 or 4 Unit Apartments | 132 | 4.4% |
| 5 to 9 Unit Apartments | 463 | 15.4% |
| 10 or more Apartments | 278 | 9.3% |
| Mobile Home / Other | 0 | 0.0% |
| Total | 3,003 | 100.0% |
Housing Structures by Occupancy in Sandston
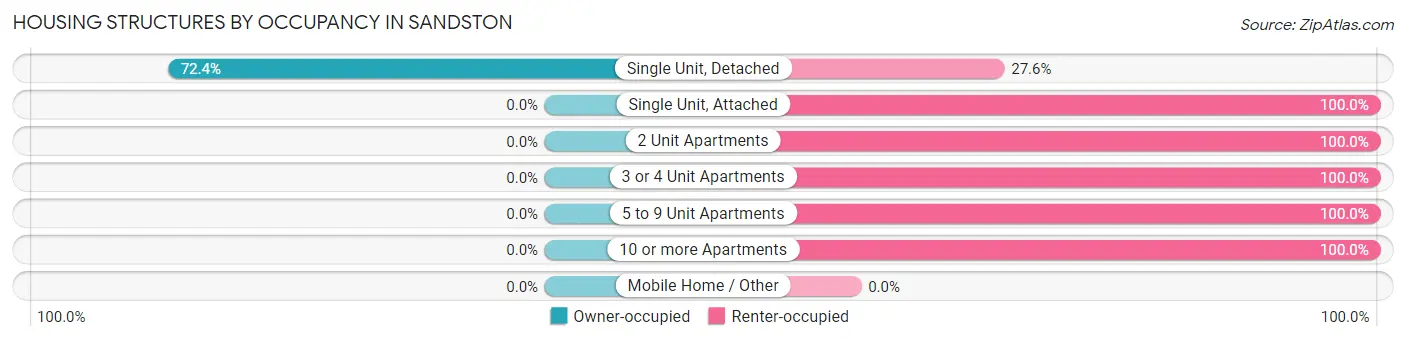
| Structure Type | Owner-occupied | Renter-occupied |
| Single Unit, Detached | 1,430 (72.4%) | 544 (27.6%) |
| Single Unit, Attached | 0 (0.0%) | 89 (100.0%) |
| 2 Unit Apartments | 0 (0.0%) | 67 (100.0%) |
| 3 or 4 Unit Apartments | 0 (0.0%) | 132 (100.0%) |
| 5 to 9 Unit Apartments | 0 (0.0%) | 463 (100.0%) |
| 10 or more Apartments | 0 (0.0%) | 278 (100.0%) |
| Mobile Home / Other | 0 (0.0%) | 0 (0.0%) |
| Total | 1,430 (47.6%) | 1,573 (52.4%) |
Housing Structures by Number of Rooms in Sandston
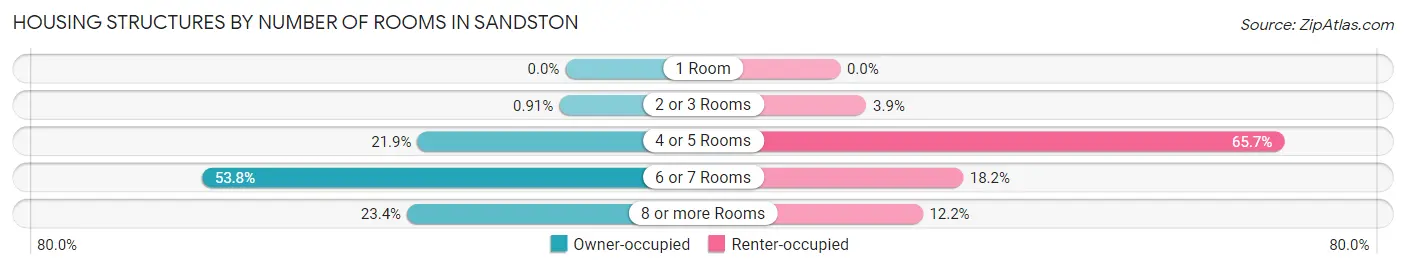
| Number of Rooms | Owner-occupied | Renter-occupied |
| 1 Room | 0 (0.0%) | 0 (0.0%) |
| 2 or 3 Rooms | 13 (0.9%) | 61 (3.9%) |
| 4 or 5 Rooms | 313 (21.9%) | 1,034 (65.7%) |
| 6 or 7 Rooms | 769 (53.8%) | 286 (18.2%) |
| 8 or more Rooms | 335 (23.4%) | 192 (12.2%) |
| Total | 1,430 (100.0%) | 1,573 (100.0%) |
Housing Structure by Heating Type in Sandston
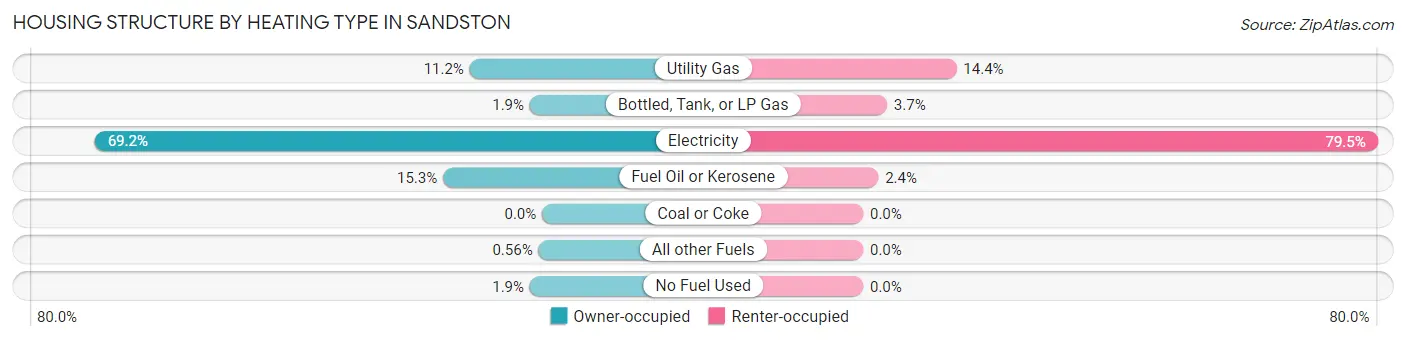
| Heating Type | Owner-occupied | Renter-occupied |
| Utility Gas | 160 (11.2%) | 227 (14.4%) |
| Bottled, Tank, or LP Gas | 27 (1.9%) | 58 (3.7%) |
| Electricity | 989 (69.2%) | 1,251 (79.5%) |
| Fuel Oil or Kerosene | 219 (15.3%) | 37 (2.4%) |
| Coal or Coke | 0 (0.0%) | 0 (0.0%) |
| All other Fuels | 8 (0.6%) | 0 (0.0%) |
| No Fuel Used | 27 (1.9%) | 0 (0.0%) |
| Total | 1,430 (100.0%) | 1,573 (100.0%) |
Household Vehicle Usage in Sandston
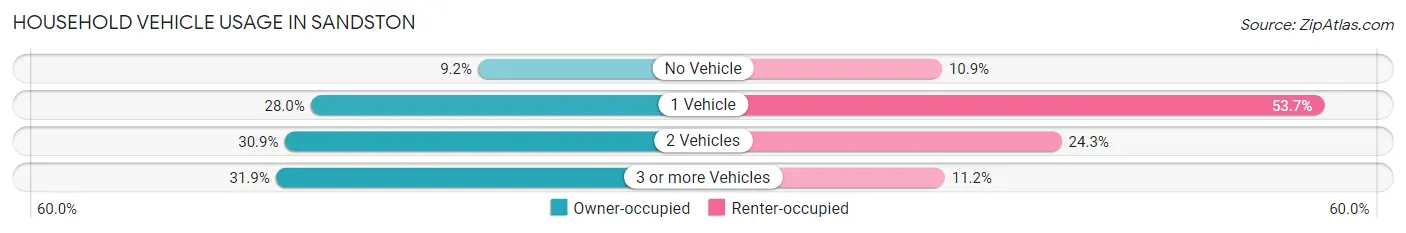
| Vehicles per Household | Owner-occupied | Renter-occupied |
| No Vehicle | 132 (9.2%) | 171 (10.9%) |
| 1 Vehicle | 400 (28.0%) | 844 (53.7%) |
| 2 Vehicles | 442 (30.9%) | 382 (24.3%) |
| 3 or more Vehicles | 456 (31.9%) | 176 (11.2%) |
| Total | 1,430 (100.0%) | 1,573 (100.0%) |
Real Estate & Mortgages in Sandston
Real Estate and Mortgage Overview in Sandston
| Characteristic | Without Mortgage | With Mortgage |
| Housing Units | 491 | 939 |
| Median Property Value | $185,400 | $192,200 |
| Median Household Income | $39,497 | $136 |
| Monthly Housing Costs | $453 | $26 |
| Real Estate Taxes | $1,417 | $59 |
Property Value by Mortgage Status in Sandston
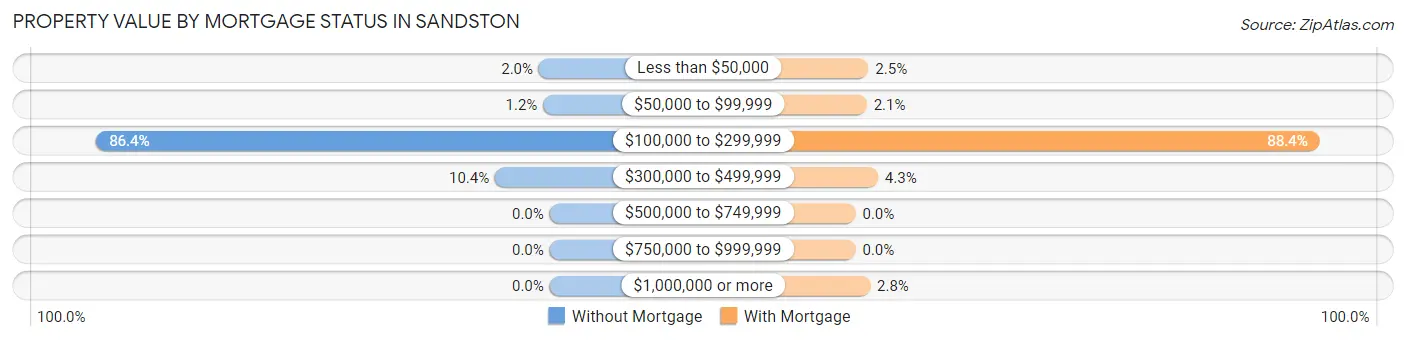
| Property Value | Without Mortgage | With Mortgage |
| Less than $50,000 | 10 (2.0%) | 23 (2.5%) |
| $50,000 to $99,999 | 6 (1.2%) | 20 (2.1%) |
| $100,000 to $299,999 | 424 (86.4%) | 830 (88.4%) |
| $300,000 to $499,999 | 51 (10.4%) | 40 (4.3%) |
| $500,000 to $749,999 | 0 (0.0%) | 0 (0.0%) |
| $750,000 to $999,999 | 0 (0.0%) | 0 (0.0%) |
| $1,000,000 or more | 0 (0.0%) | 26 (2.8%) |
| Total | 491 (100.0%) | 939 (100.0%) |
Household Income by Mortgage Status in Sandston
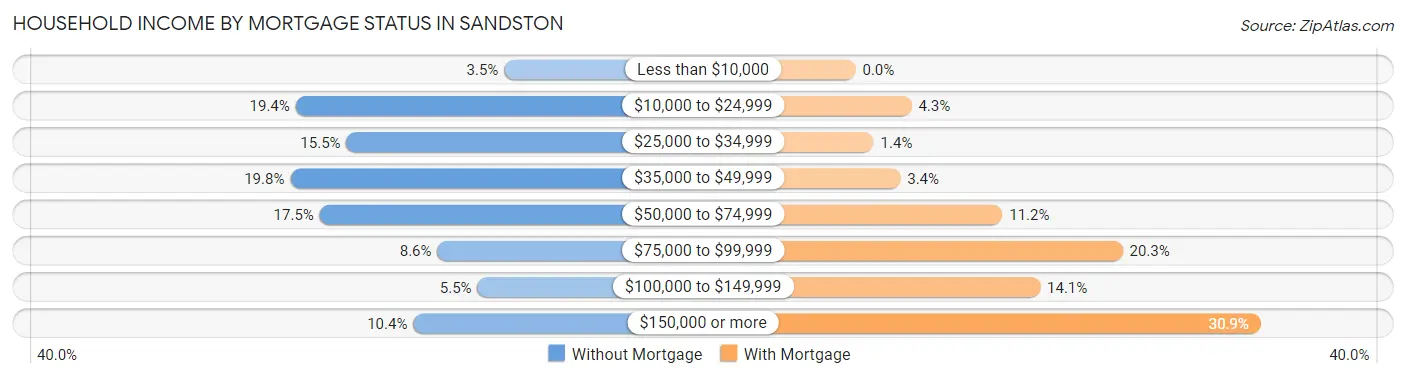
| Household Income | Without Mortgage | With Mortgage |
| Less than $10,000 | 17 (3.5%) | 0 (0.0%) |
| $10,000 to $24,999 | 95 (19.4%) | 40 (4.3%) |
| $25,000 to $34,999 | 76 (15.5%) | 13 (1.4%) |
| $35,000 to $49,999 | 97 (19.8%) | 32 (3.4%) |
| $50,000 to $74,999 | 86 (17.5%) | 105 (11.2%) |
| $75,000 to $99,999 | 42 (8.6%) | 191 (20.3%) |
| $100,000 to $149,999 | 27 (5.5%) | 132 (14.1%) |
| $150,000 or more | 51 (10.4%) | 290 (30.9%) |
| Total | 491 (100.0%) | 939 (100.0%) |
Property Value to Household Income Ratio in Sandston
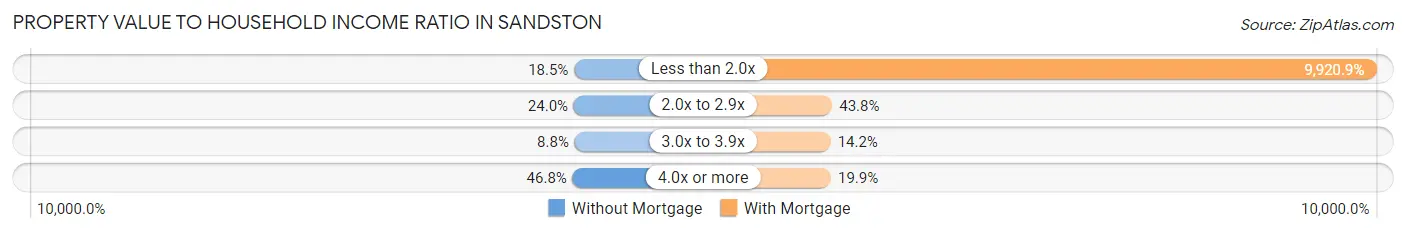
| Value-to-Income Ratio | Without Mortgage | With Mortgage |
| Less than 2.0x | 91 (18.5%) | 93,157 (9,920.9%) |
| 2.0x to 2.9x | 118 (24.0%) | 411 (43.8%) |
| 3.0x to 3.9x | 43 (8.8%) | 133 (14.2%) |
| 4.0x or more | 230 (46.8%) | 187 (19.9%) |
| Total | 491 (100.0%) | 939 (100.0%) |
Real Estate Taxes by Mortgage Status in Sandston
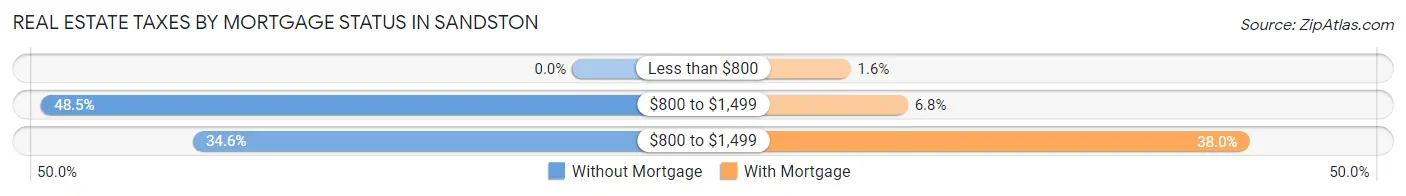
| Property Taxes | Without Mortgage | With Mortgage |
| Less than $800 | 0 (0.0%) | 15 (1.6%) |
| $800 to $1,499 | 238 (48.5%) | 64 (6.8%) |
| $800 to $1,499 | 170 (34.6%) | 357 (38.0%) |
| Total | 491 (100.0%) | 939 (100.0%) |
Health & Disability in Sandston
Health Insurance Coverage by Age in Sandston
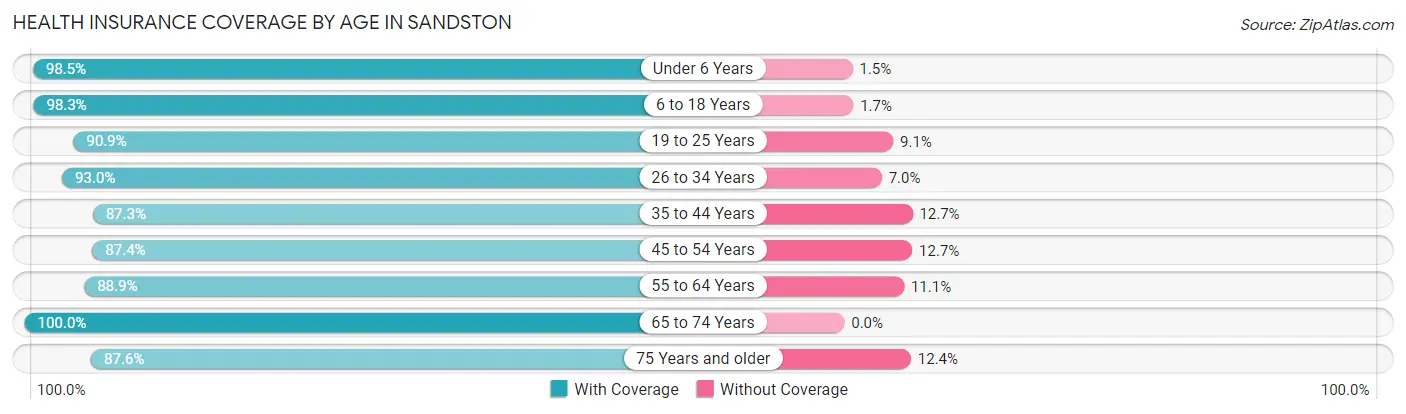
| Age Bracket | With Coverage | Without Coverage |
| Under 6 Years | 387 (98.5%) | 6 (1.5%) |
| 6 to 18 Years | 1,186 (98.3%) | 20 (1.7%) |
| 19 to 25 Years | 609 (90.9%) | 61 (9.1%) |
| 26 to 34 Years | 906 (93.0%) | 68 (7.0%) |
| 35 to 44 Years | 920 (87.3%) | 134 (12.7%) |
| 45 to 54 Years | 1,001 (87.4%) | 145 (12.7%) |
| 55 to 64 Years | 703 (88.9%) | 88 (11.1%) |
| 65 to 74 Years | 386 (100.0%) | 0 (0.0%) |
| 75 Years and older | 466 (87.6%) | 66 (12.4%) |
| Total | 6,564 (91.8%) | 588 (8.2%) |
Health Insurance Coverage by Citizenship Status in Sandston
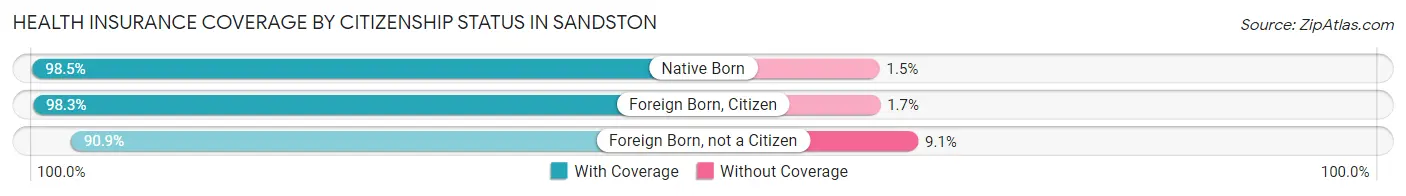
| Citizenship Status | With Coverage | Without Coverage |
| Native Born | 387 (98.5%) | 6 (1.5%) |
| Foreign Born, Citizen | 1,186 (98.3%) | 20 (1.7%) |
| Foreign Born, not a Citizen | 609 (90.9%) | 61 (9.1%) |
Health Insurance Coverage by Household Income in Sandston
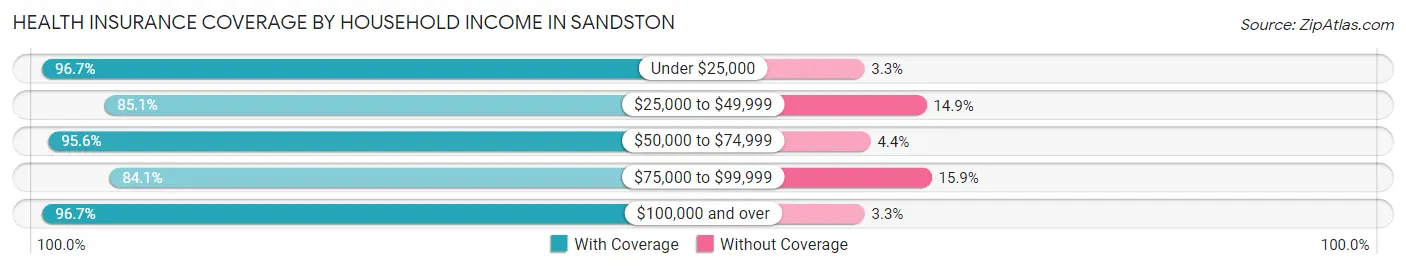
| Household Income | With Coverage | Without Coverage |
| Under $25,000 | 734 (96.7%) | 25 (3.3%) |
| $25,000 to $49,999 | 1,305 (85.1%) | 229 (14.9%) |
| $50,000 to $74,999 | 1,359 (95.6%) | 63 (4.4%) |
| $75,000 to $99,999 | 1,048 (84.1%) | 198 (15.9%) |
| $100,000 and over | 2,117 (96.7%) | 73 (3.3%) |
Public vs Private Health Insurance Coverage by Age in Sandston
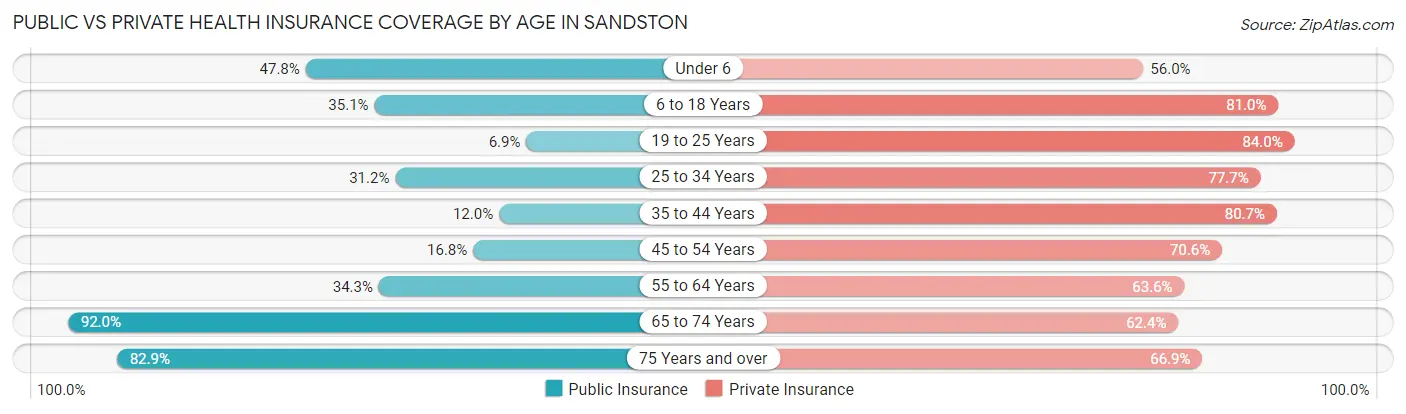
| Age Bracket | Public Insurance | Private Insurance |
| Under 6 | 188 (47.8%) | 220 (56.0%) |
| 6 to 18 Years | 423 (35.1%) | 977 (81.0%) |
| 19 to 25 Years | 46 (6.9%) | 563 (84.0%) |
| 25 to 34 Years | 304 (31.2%) | 757 (77.7%) |
| 35 to 44 Years | 126 (11.9%) | 851 (80.7%) |
| 45 to 54 Years | 192 (16.8%) | 809 (70.6%) |
| 55 to 64 Years | 271 (34.3%) | 503 (63.6%) |
| 65 to 74 Years | 355 (92.0%) | 241 (62.4%) |
| 75 Years and over | 441 (82.9%) | 356 (66.9%) |
| Total | 2,346 (32.8%) | 5,277 (73.8%) |
Disability Status by Sex by Age in Sandston
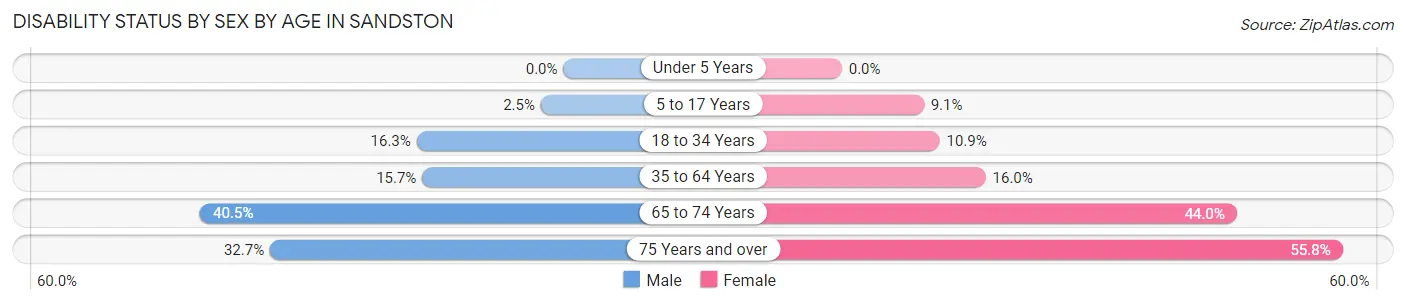
| Age Bracket | Male | Female |
| Under 5 Years | 0 (0.0%) | 0 (0.0%) |
| 5 to 17 Years | 12 (2.5%) | 56 (9.1%) |
| 18 to 34 Years | 149 (16.3%) | 104 (10.9%) |
| 35 to 64 Years | 219 (15.7%) | 256 (16.0%) |
| 65 to 74 Years | 89 (40.5%) | 73 (44.0%) |
| 75 Years and over | 49 (32.7%) | 213 (55.8%) |
Disability Class by Sex by Age in Sandston
Disability Class: Hearing Difficulty
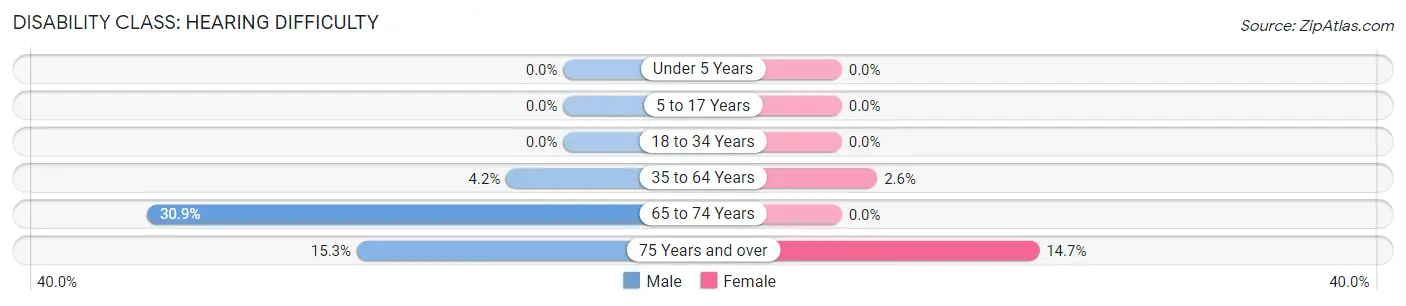
| Age Bracket | Male | Female |
| Under 5 Years | 0 (0.0%) | 0 (0.0%) |
| 5 to 17 Years | 0 (0.0%) | 0 (0.0%) |
| 18 to 34 Years | 0 (0.0%) | 0 (0.0%) |
| 35 to 64 Years | 59 (4.2%) | 42 (2.6%) |
| 65 to 74 Years | 68 (30.9%) | 0 (0.0%) |
| 75 Years and over | 23 (15.3%) | 56 (14.7%) |
Disability Class: Vision Difficulty
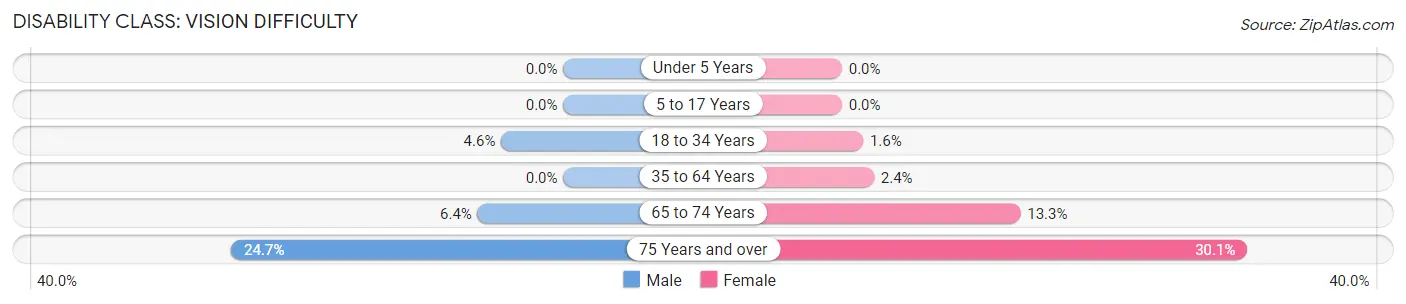
| Age Bracket | Male | Female |
| Under 5 Years | 0 (0.0%) | 0 (0.0%) |
| 5 to 17 Years | 0 (0.0%) | 0 (0.0%) |
| 18 to 34 Years | 42 (4.6%) | 15 (1.6%) |
| 35 to 64 Years | 0 (0.0%) | 38 (2.4%) |
| 65 to 74 Years | 14 (6.4%) | 22 (13.3%) |
| 75 Years and over | 37 (24.7%) | 115 (30.1%) |
Disability Class: Cognitive Difficulty
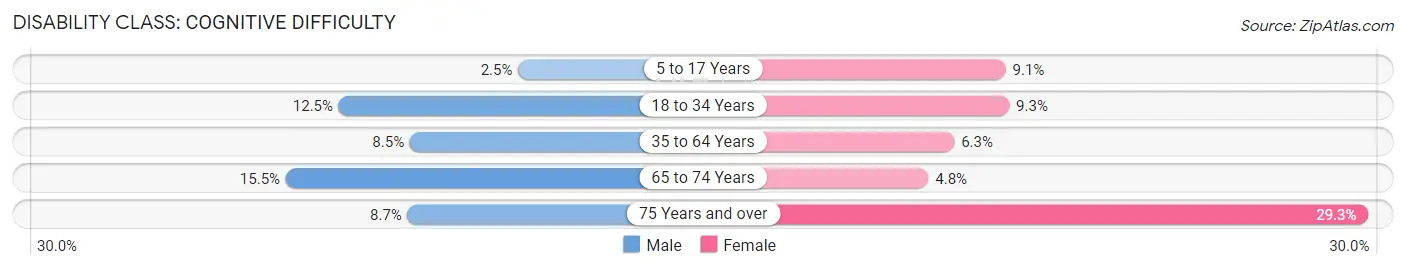
| Age Bracket | Male | Female |
| 5 to 17 Years | 12 (2.5%) | 56 (9.1%) |
| 18 to 34 Years | 114 (12.5%) | 89 (9.3%) |
| 35 to 64 Years | 119 (8.5%) | 100 (6.3%) |
| 65 to 74 Years | 34 (15.4%) | 8 (4.8%) |
| 75 Years and over | 13 (8.7%) | 112 (29.3%) |
Disability Class: Ambulatory Difficulty
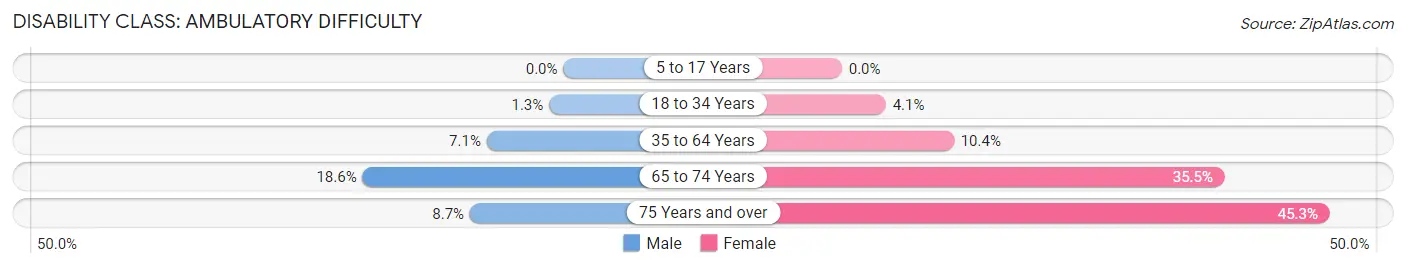
| Age Bracket | Male | Female |
| 5 to 17 Years | 0 (0.0%) | 0 (0.0%) |
| 18 to 34 Years | 12 (1.3%) | 39 (4.1%) |
| 35 to 64 Years | 99 (7.1%) | 166 (10.4%) |
| 65 to 74 Years | 41 (18.6%) | 59 (35.5%) |
| 75 Years and over | 13 (8.7%) | 173 (45.3%) |
Disability Class: Self-Care Difficulty
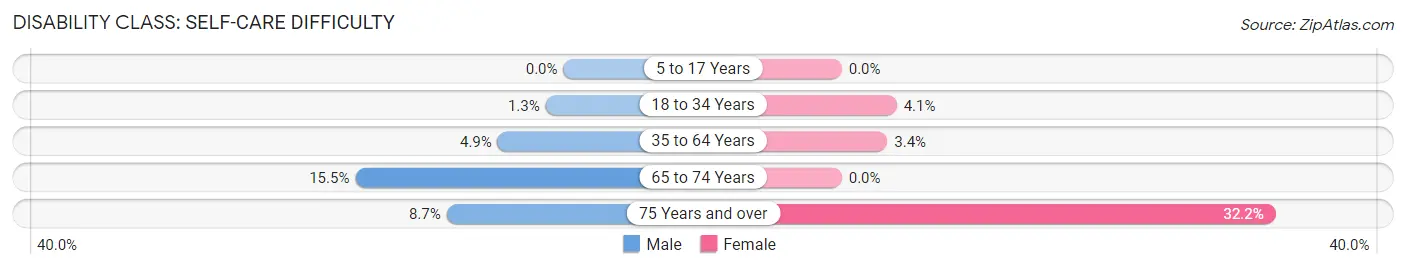
| Age Bracket | Male | Female |
| 5 to 17 Years | 0 (0.0%) | 0 (0.0%) |
| 18 to 34 Years | 12 (1.3%) | 39 (4.1%) |
| 35 to 64 Years | 68 (4.9%) | 54 (3.4%) |
| 65 to 74 Years | 34 (15.4%) | 0 (0.0%) |
| 75 Years and over | 13 (8.7%) | 123 (32.2%) |
Technology Access in Sandston
Computing Device Access in Sandston
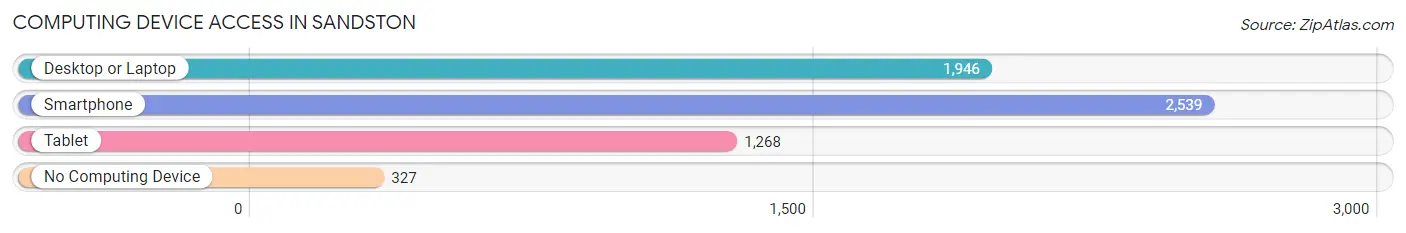
| Device Type | # Households | % Households |
| Desktop or Laptop | 1,946 | 64.8% |
| Smartphone | 2,539 | 84.6% |
| Tablet | 1,268 | 42.2% |
| No Computing Device | 327 | 10.9% |
| Total | 3,003 | 100.0% |
Internet Access in Sandston
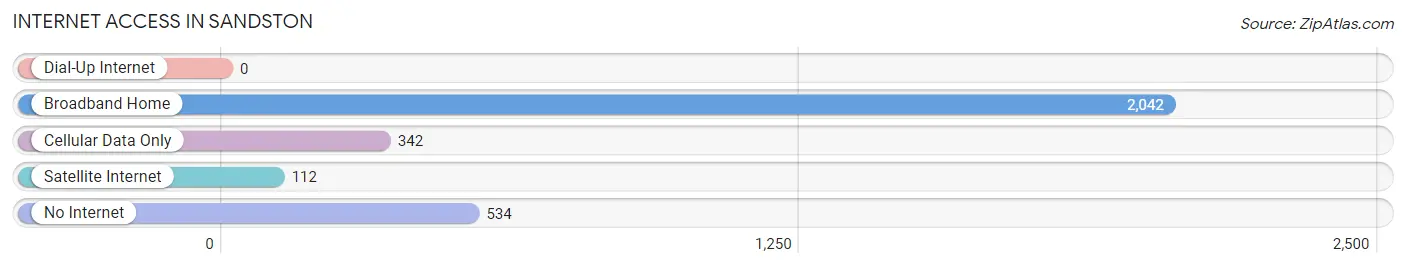
| Internet Type | # Households | % Households |
| Dial-Up Internet | 0 | 0.0% |
| Broadband Home | 2,042 | 68.0% |
| Cellular Data Only | 342 | 11.4% |
| Satellite Internet | 112 | 3.7% |
| No Internet | 534 | 17.8% |
| Total | 3,003 | 100.0% |
Sandston Summary
Sandston, Virginia is a small town located in Henrico County, Virginia. It is situated just east of Richmond, the state capital, and is part of the Greater Richmond Region. Sandston has a population of approximately 4,000 people and is a part of the Richmond-Petersburg metropolitan area.
History
Sandston was first settled in the early 1700s by English colonists. The town was originally known as “Sandstone” and was part of Henrico County. In 1876, the town was officially incorporated as “Sandston”. The town was named after the sandstone quarries that were located in the area.
During the Civil War, Sandston was the site of several battles. The Battle of Seven Pines was fought in the area in 1862, and the Battle of Cold Harbor was fought nearby in 1864.
In the early 1900s, Sandston was a thriving agricultural community. The town was home to several farms and was known for its production of tobacco, corn, and wheat.
Geography
Sandston is located in the Piedmont region of Virginia. The town is situated on the north bank of the James River, and is bordered by the cities of Richmond and Henrico. Sandston is located approximately 10 miles east of Richmond and is part of the Greater Richmond Region.
The town has a total area of 1.3 square miles, all of which is land. The terrain is mostly flat, with some rolling hills. The climate is humid subtropical, with hot, humid summers and mild winters.
Economy
Sandston’s economy is largely based on the service industry. The town is home to several restaurants, retail stores, and other businesses. The town is also home to several industrial and manufacturing companies.
The town is also home to several government agencies, including the Virginia Department of Transportation and the Henrico County Public Schools.
Demographics
As of the 2010 census, Sandston had a population of 4,000 people. The racial makeup of the town was 79.2% White, 15.2% African American, 0.7% Native American, 0.7% Asian, 0.1% Pacific Islander, and 3.8% from other races. Hispanic or Latino of any race were 4.2% of the population.
The median household income in Sandston was $45,000, and the median family income was $50,000. The per capita income for the town was $20,000. About 11.2% of families and 13.2% of the population were below the poverty line.
Sandston is a small town with a rich history and a diverse population. The town is home to several businesses and government agencies, and is part of the Greater Richmond Region. Sandston is a great place to live, work, and raise a family.
Common Questions
What is Per Capita Income in Sandston?
Per Capita income in Sandston is $30,916.
What is the Median Family Income in Sandston?
Median Family Income in Sandston is $72,527.
What is the Median Household income in Sandston?
Median Household Income in Sandston is $61,384.
What is Income or Wage Gap in Sandston?
Income or Wage Gap in Sandston is 0.6%.
Women in Sandston earn 99.4 cents for every dollar earned by a man.
What is Inequality or Gini Index in Sandston?
Inequality or Gini Index in Sandston is 0.37.
What is the Total Population of Sandston?
Total Population of Sandston is 7,152.
What is the Total Male Population of Sandston?
Total Male Population of Sandston is 3,362.
What is the Total Female Population of Sandston?
Total Female Population of Sandston is 3,790.
What is the Ratio of Males per 100 Females in Sandston?
There are 88.71 Males per 100 Females in Sandston.
What is the Ratio of Females per 100 Males in Sandston?
There are 112.73 Females per 100 Males in Sandston.
What is the Median Population Age in Sandston?
Median Population Age in Sandston is 37.9 Years.
What is the Average Family Size in Sandston
Average Family Size in Sandston is 3.2 People.
What is the Average Household Size in Sandston
Average Household Size in Sandston is 2.4 People.
How Large is the Labor Force in Sandston?
There are 4,403 People in the Labor Forcein in Sandston.
What is the Percentage of People in the Labor Force in Sandston?
74.5% of People are in the Labor Force in Sandston.
What is the Unemployment Rate in Sandston?
Unemployment Rate in Sandston is 6.3%.