Riner, VA Map & Demographics
Riner Map
Riner Overview
$34,317
PER CAPITA INCOME
$82,714
AVG FAMILY INCOME
$80,673
AVG HOUSEHOLD INCOME
0.29
INEQUALITY / GINI INDEX
953
TOTAL POPULATION
426
MALE POPULATION
527
FEMALE POPULATION
80.83
MALES / 100 FEMALES
123.71
FEMALES / 100 MALES
43.2
MEDIAN AGE
3.0
AVG FAMILY SIZE
3.0
AVG HOUSEHOLD SIZE
434
LABOR FORCE [ PEOPLE ]
58.6%
PERCENT IN LABOR FORCE
Riner Zip Codes
Riner Area Codes
Income in Riner
Income Overview in Riner
Per Capita Income in Riner is $34,317, while median incomes of families and households are $82,714 and $80,673 respectively.
| Characteristic | Number | Measure |
| Per Capita Income | 953 | $34,317 |
| Median Family Income | 288 | $82,714 |
| Mean Family Income | 288 | $87,531 |
| Median Household Income | 313 | $80,673 |
| Mean Household Income | 313 | $85,635 |
| Income Deficit | 288 | $0 |
| Wage / Income Gap (%) | 953 | 0.00% |
| Wage / Income Gap ($) | 953 | 100.00¢ per $1 |
| Gini / Inequality Index | 953 | 0.29 |
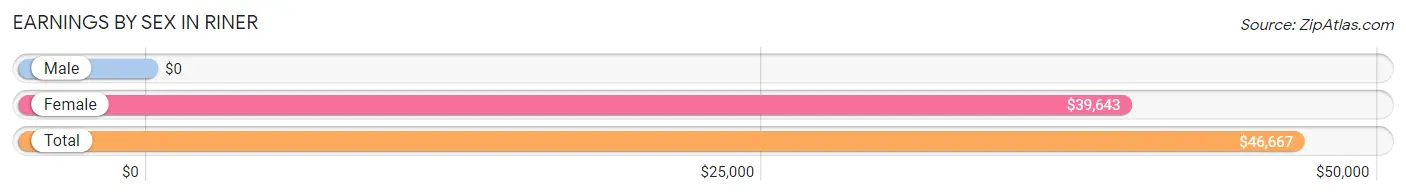
Earnings by Sex in Riner
| Sex | Number | Average Earnings |
| Male | 302 (67.7%) | $0 |
| Female | 144 (32.3%) | $39,643 |
| Total | 446 (100.0%) | $46,667 |
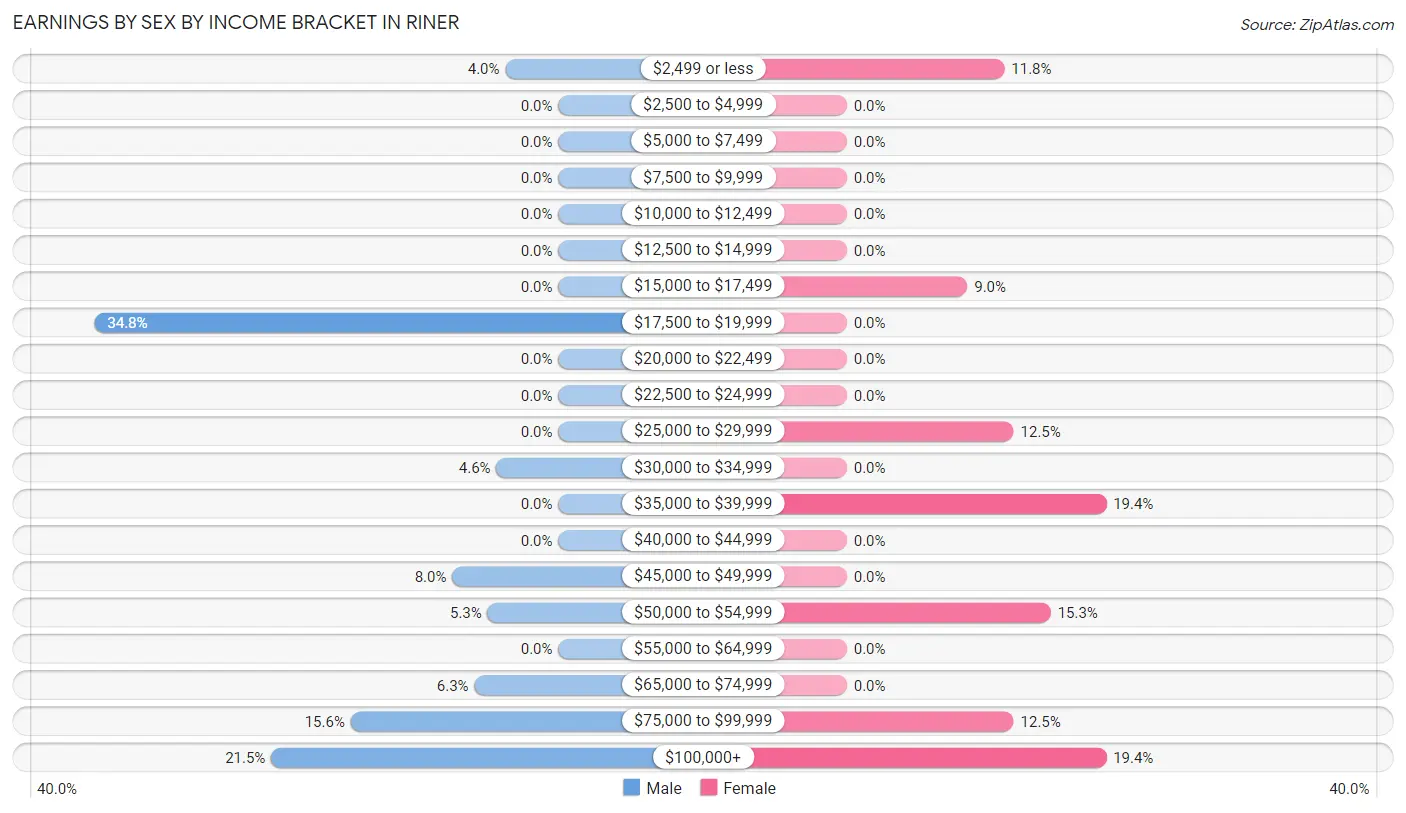
Earnings by Sex by Income Bracket in Riner
The most common earnings brackets in Riner are $17,500 to $19,999 for men (105 | 34.8%) and $35,000 to $39,999 for women (28 | 19.4%).
| Income | Male | Female |
| $2,499 or less | 12 (4.0%) | 17 (11.8%) |
| $2,500 to $4,999 | 0 (0.0%) | 0 (0.0%) |
| $5,000 to $7,499 | 0 (0.0%) | 0 (0.0%) |
| $7,500 to $9,999 | 0 (0.0%) | 0 (0.0%) |
| $10,000 to $12,499 | 0 (0.0%) | 0 (0.0%) |
| $12,500 to $14,999 | 0 (0.0%) | 0 (0.0%) |
| $15,000 to $17,499 | 0 (0.0%) | 13 (9.0%) |
| $17,500 to $19,999 | 105 (34.8%) | 0 (0.0%) |
| $20,000 to $22,499 | 0 (0.0%) | 0 (0.0%) |
| $22,500 to $24,999 | 0 (0.0%) | 0 (0.0%) |
| $25,000 to $29,999 | 0 (0.0%) | 18 (12.5%) |
| $30,000 to $34,999 | 14 (4.6%) | 0 (0.0%) |
| $35,000 to $39,999 | 0 (0.0%) | 28 (19.4%) |
| $40,000 to $44,999 | 0 (0.0%) | 0 (0.0%) |
| $45,000 to $49,999 | 24 (8.0%) | 0 (0.0%) |
| $50,000 to $54,999 | 16 (5.3%) | 22 (15.3%) |
| $55,000 to $64,999 | 0 (0.0%) | 0 (0.0%) |
| $65,000 to $74,999 | 19 (6.3%) | 0 (0.0%) |
| $75,000 to $99,999 | 47 (15.6%) | 18 (12.5%) |
| $100,000+ | 65 (21.5%) | 28 (19.4%) |
| Total | 302 (100.0%) | 144 (100.0%) |
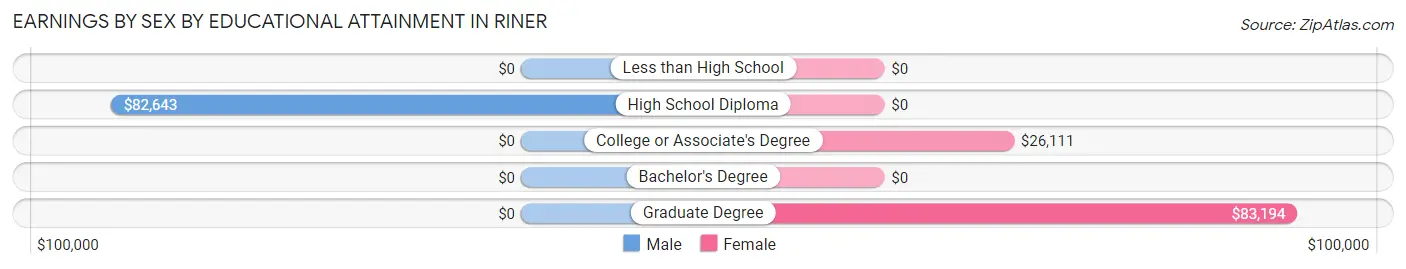
Earnings by Sex by Educational Attainment in Riner
Average earnings in Riner are $72,566 for men and $39,643 for women, a difference of 45.4%. Men with an educational attainment of high school diploma enjoy the highest average annual earnings of $82,643, while those with high school diploma education earn the least with $82,643. Women with an educational attainment of graduate degree earn the most with the average annual earnings of $83,194, while those with college or associate's degree education have the smallest earnings of $26,111.
| Educational Attainment | Male Income | Female Income |
| Less than High School | - | - |
| High School Diploma | $82,643 | $0 |
| College or Associate's Degree | - | - |
| Bachelor's Degree | - | - |
| Graduate Degree | - | - |
| Total | $72,566 | $39,643 |
Family Income in Riner
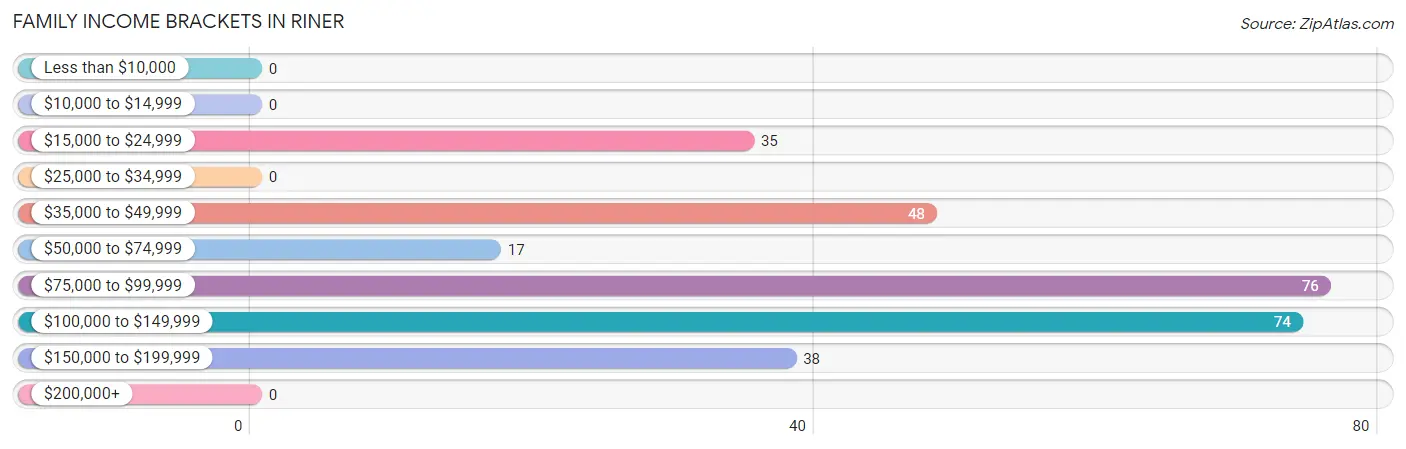
Family Income Brackets in Riner
According to the Riner family income data, there are 76 families falling into the $75,000 to $99,999 income range, which is the most common income bracket and makes up 26.4% of all families.
| Income Bracket | # Families | % Families |
| Less than $10,000 | 0 | 0.0% |
| $10,000 to $14,999 | 0 | 0.0% |
| $15,000 to $24,999 | 35 | 12.2% |
| $25,000 to $34,999 | 0 | 0.0% |
| $35,000 to $49,999 | 48 | 16.7% |
| $50,000 to $74,999 | 17 | 5.9% |
| $75,000 to $99,999 | 76 | 26.4% |
| $100,000 to $149,999 | 74 | 25.7% |
| $150,000 to $199,999 | 38 | 13.2% |
| $200,000+ | 0 | 0.0% |
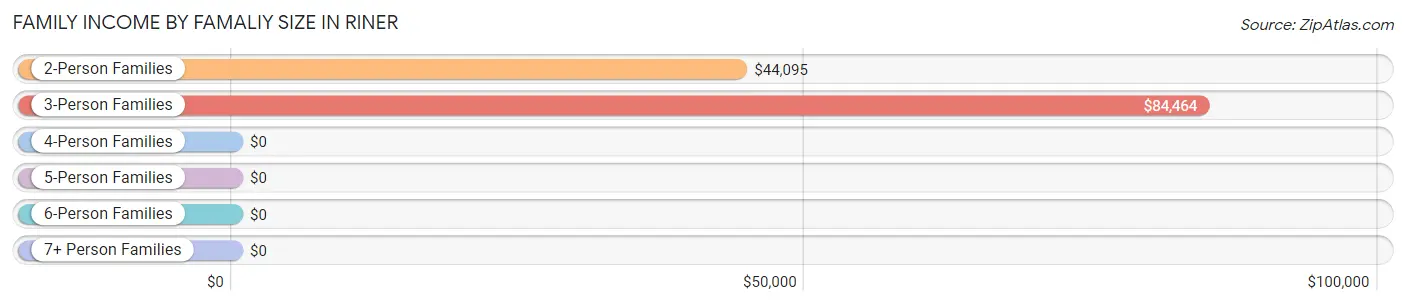
Family Income by Famaliy Size in Riner
3-person families (111 | 38.5%) account for the highest median family income in Riner with $84,464 per family, while 3-person families (111 | 38.5%) have the highest median income of $28,155 per family member.
| Income Bracket | # Families | Median Income |
| 2-Person Families | 145 (50.3%) | $44,095 |
| 3-Person Families | 111 (38.5%) | $84,464 |
| 4-Person Families | 22 (7.6%) | $0 |
| 5-Person Families | 10 (3.5%) | $0 |
| 6-Person Families | 0 (0.0%) | $0 |
| 7+ Person Families | 0 (0.0%) | $0 |
| Total | 288 (100.0%) | $82,714 |
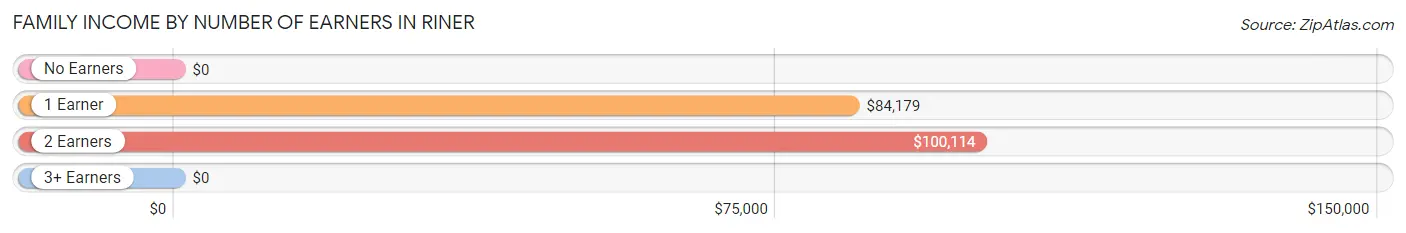
Family Income by Number of Earners in Riner
| Number of Earners | # Families | Median Income |
| No Earners | 65 (22.6%) | $0 |
| 1 Earner | 107 (37.1%) | $84,179 |
| 2 Earners | 94 (32.6%) | $100,114 |
| 3+ Earners | 22 (7.6%) | $0 |
| Total | 288 (100.0%) | $82,714 |
Household Income in Riner
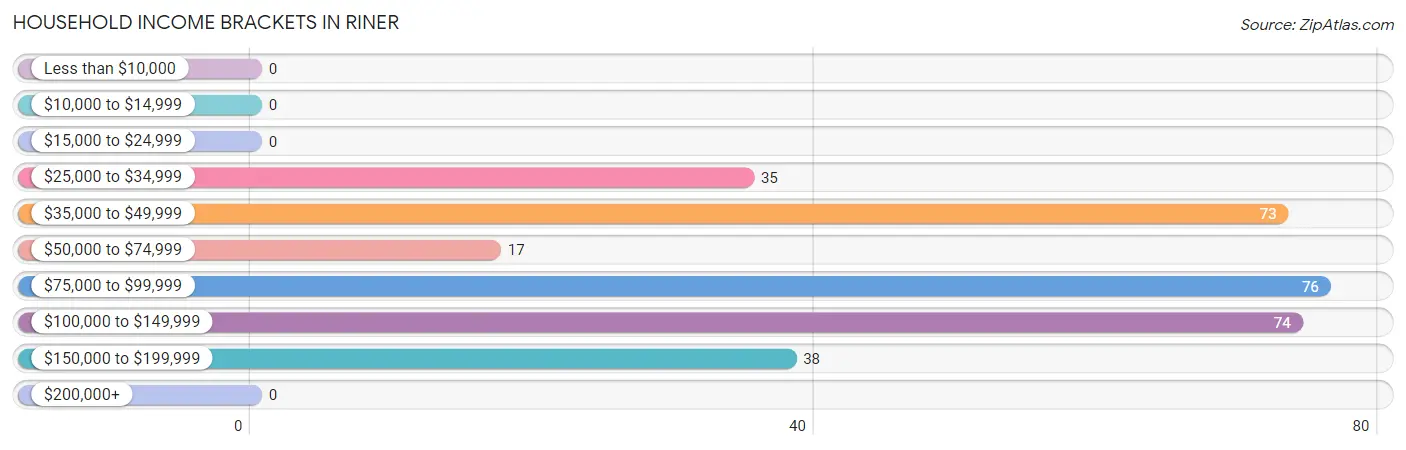
Household Income Brackets in Riner
With 76 households falling in the category, the $75,000 to $99,999 income range is the most frequent in Riner, accounting for 24.3% of all households.
| Income Bracket | # Households | % Households |
| Less than $10,000 | 0 | 0.0% |
| $10,000 to $14,999 | 0 | 0.0% |
| $15,000 to $24,999 | 0 | 0.0% |
| $25,000 to $34,999 | 35 | 11.2% |
| $35,000 to $49,999 | 73 | 23.3% |
| $50,000 to $74,999 | 17 | 5.4% |
| $75,000 to $99,999 | 76 | 24.3% |
| $100,000 to $149,999 | 74 | 23.6% |
| $150,000 to $199,999 | 38 | 12.1% |
| $200,000+ | 0 | 0.0% |
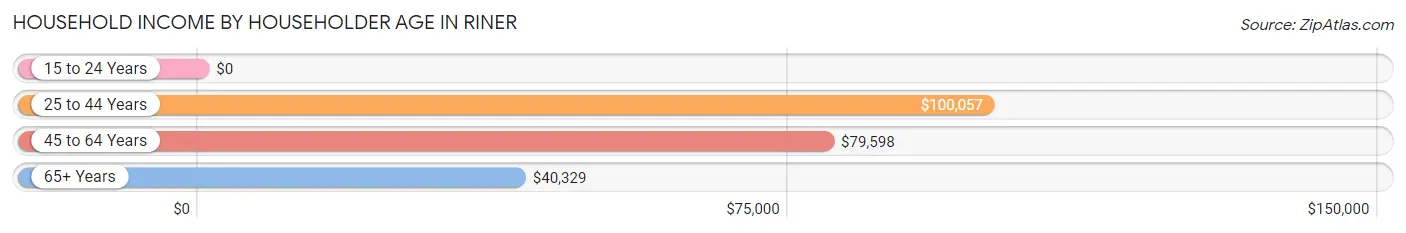
Household Income by Householder Age in Riner
The median household income in Riner is $80,673, with the highest median household income of $100,057 found in the 25 to 44 years age bracket for the primary householder. A total of 107 households (34.2%) fall into this category.
| Income Bracket | # Households | Median Income |
| 15 to 24 Years | 0 (0.0%) | $0 |
| 25 to 44 Years | 107 (34.2%) | $100,057 |
| 45 to 64 Years | 151 (48.2%) | $79,598 |
| 65+ Years | 55 (17.6%) | $40,329 |
| Total | 313 (100.0%) | $80,673 |
Poverty in Riner
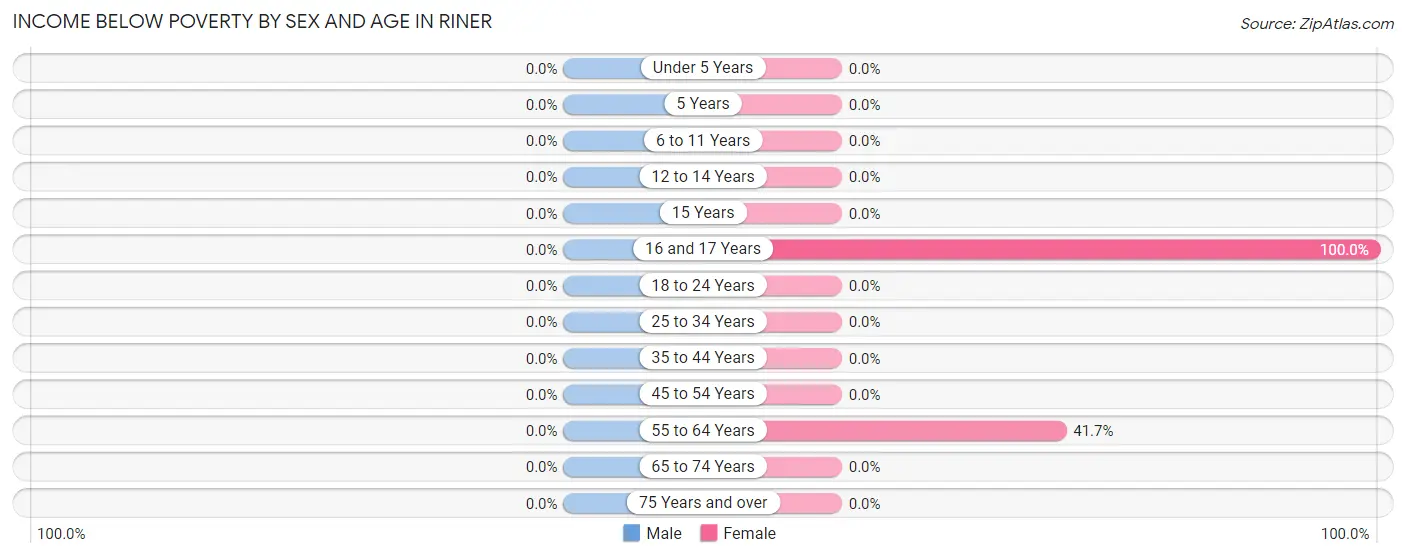
Income Below Poverty by Sex and Age in Riner
| Age Bracket | Male | Female |
| Under 5 Years | 0 (0.0%) | 0 (0.0%) |
| 5 Years | 0 (0.0%) | 0 (0.0%) |
| 6 to 11 Years | 0 (0.0%) | 0 (0.0%) |
| 12 to 14 Years | 0 (0.0%) | 0 (0.0%) |
| 15 Years | 0 (0.0%) | 0 (0.0%) |
| 16 and 17 Years | 0 (0.0%) | 30 (100.0%) |
| 18 to 24 Years | 0 (0.0%) | 0 (0.0%) |
| 25 to 34 Years | 0 (0.0%) | 0 (0.0%) |
| 35 to 44 Years | 0 (0.0%) | 0 (0.0%) |
| 45 to 54 Years | 0 (0.0%) | 0 (0.0%) |
| 55 to 64 Years | 0 (0.0%) | 35 (41.7%) |
| 65 to 74 Years | 0 (0.0%) | 0 (0.0%) |
| 75 Years and over | 0 (0.0%) | 0 (0.0%) |
| Total | 0 (0.0%) | 65 (12.3%) |
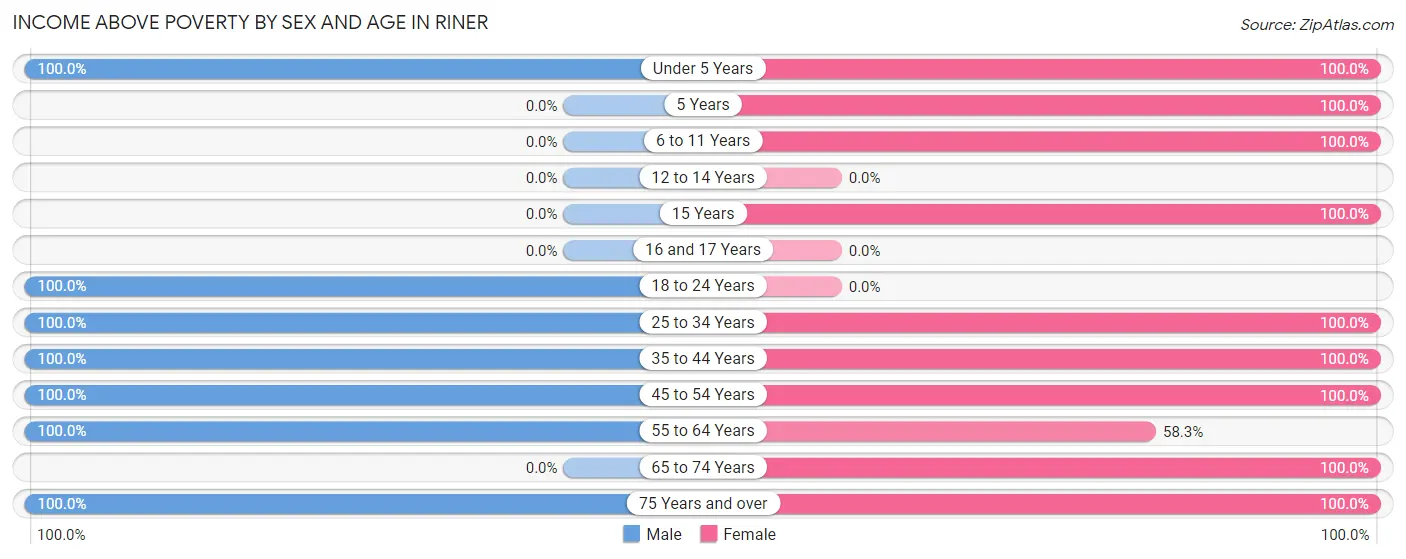
Income Above Poverty by Sex and Age in Riner
According to the poverty statistics in Riner, males aged under 5 years and females aged under 5 years are the age groups that are most secure financially, with 100.0% of males and 100.0% of females in these age groups living above the poverty line.
| Age Bracket | Male | Female |
| Under 5 Years | 26 (100.0%) | 123 (100.0%) |
| 5 Years | 0 (0.0%) | 28 (100.0%) |
| 6 to 11 Years | 0 (0.0%) | 16 (100.0%) |
| 12 to 14 Years | 0 (0.0%) | 0 (0.0%) |
| 15 Years | 0 (0.0%) | 20 (100.0%) |
| 16 and 17 Years | 0 (0.0%) | 0 (0.0%) |
| 18 to 24 Years | 41 (100.0%) | 0 (0.0%) |
| 25 to 34 Years | 40 (100.0%) | 84 (100.0%) |
| 35 to 44 Years | 124 (100.0%) | 17 (100.0%) |
| 45 to 54 Years | 89 (100.0%) | 71 (100.0%) |
| 55 to 64 Years | 76 (100.0%) | 49 (58.3%) |
| 65 to 74 Years | 0 (0.0%) | 10 (100.0%) |
| 75 Years and over | 30 (100.0%) | 44 (100.0%) |
| Total | 426 (100.0%) | 462 (87.7%) |
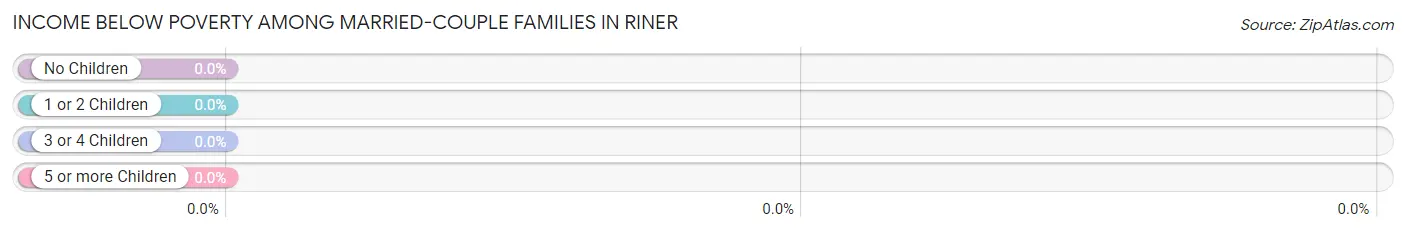
Income Below Poverty Among Married-Couple Families in Riner
| Children | Above Poverty | Below Poverty |
| No Children | 150 (100.0%) | 0 (0.0%) |
| 1 or 2 Children | 93 (100.0%) | 0 (0.0%) |
| 3 or 4 Children | 10 (100.0%) | 0 (0.0%) |
| 5 or more Children | 0 (0.0%) | 0 (0.0%) |
| Total | 253 (100.0%) | 0 (0.0%) |
Income Below Poverty Among Single-Parent Households in Riner
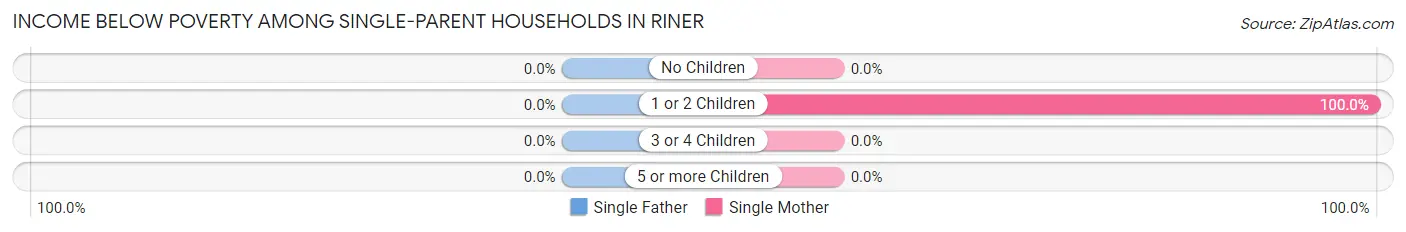
| Children | Single Father | Single Mother |
| No Children | 0 (0.0%) | 0 (0.0%) |
| 1 or 2 Children | 0 (0.0%) | 35 (100.0%) |
| 3 or 4 Children | 0 (0.0%) | 0 (0.0%) |
| 5 or more Children | 0 (0.0%) | 0 (0.0%) |
| Total | 0 (0.0%) | 35 (100.0%) |
Income Below Poverty Among Married-Couple vs Single-Parent Households in Riner
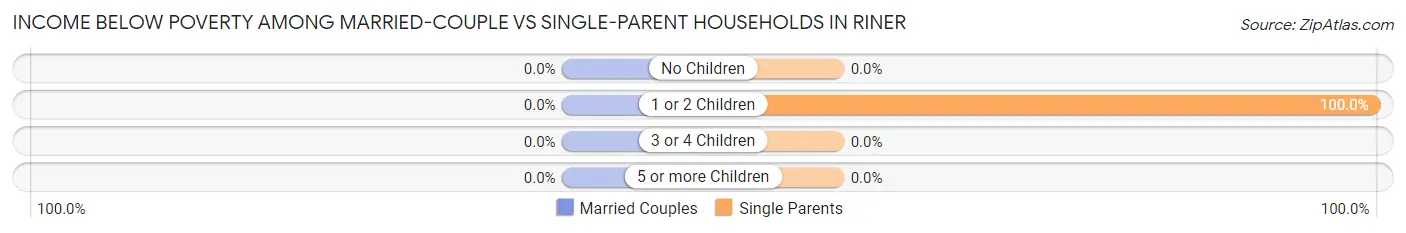
| Children | Married-Couple Families | Single-Parent Households |
| No Children | 0 (0.0%) | 0 (0.0%) |
| 1 or 2 Children | 0 (0.0%) | 35 (100.0%) |
| 3 or 4 Children | 0 (0.0%) | 0 (0.0%) |
| 5 or more Children | 0 (0.0%) | 0 (0.0%) |
| Total | 0 (0.0%) | 35 (100.0%) |
Race in Riner
The most populous races in Riner are , and White / Caucasian (953 | 100.0%).
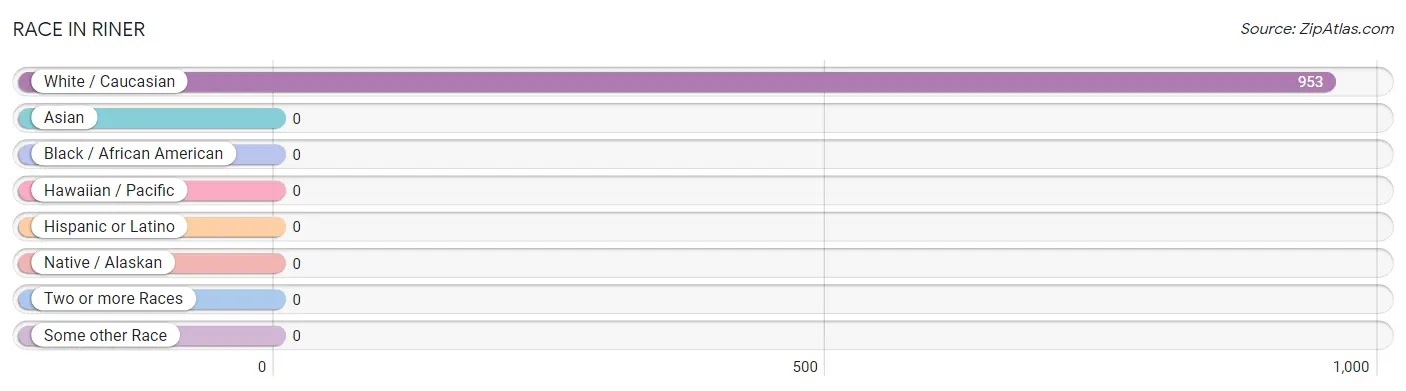
| Race | # Population | % Population |
| Asian | 0 | 0.0% |
| Black / African American | 0 | 0.0% |
| Hawaiian / Pacific | 0 | 0.0% |
| Hispanic or Latino | 0 | 0.0% |
| Native / Alaskan | 0 | 0.0% |
| White / Caucasian | 953 | 100.0% |
| Two or more Races | 0 | 0.0% |
| Some other Race | 0 | 0.0% |
| Total | 953 | 100.0% |
Ancestry in Riner
The most populous ancestries reported in Riner are Irish (225 | 23.6%), German (188 | 19.7%), Scotch-Irish (151 | 15.8%), English (112 | 11.7%), and American (37 | 3.9%), together accounting for 74.8% of all Riner residents.
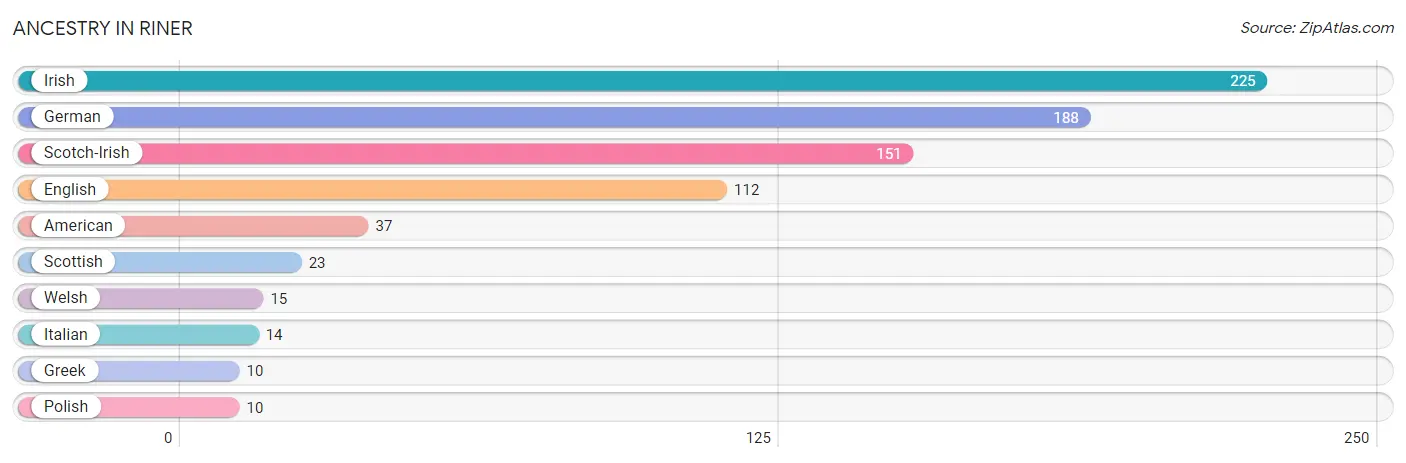
| Ancestry | # Population | % Population |
| American | 37 | 3.9% |
| English | 112 | 11.7% |
| German | 188 | 19.7% |
| Greek | 10 | 1.1% |
| Irish | 225 | 23.6% |
| Italian | 14 | 1.5% |
| Polish | 10 | 1.1% |
| Scotch-Irish | 151 | 15.8% |
| Scottish | 23 | 2.4% |
| Welsh | 15 | 1.6% | View All 10 Rows |
Immigrants in Riner

| Immigration Origin | # Population | % Population | View All 0 Rows |
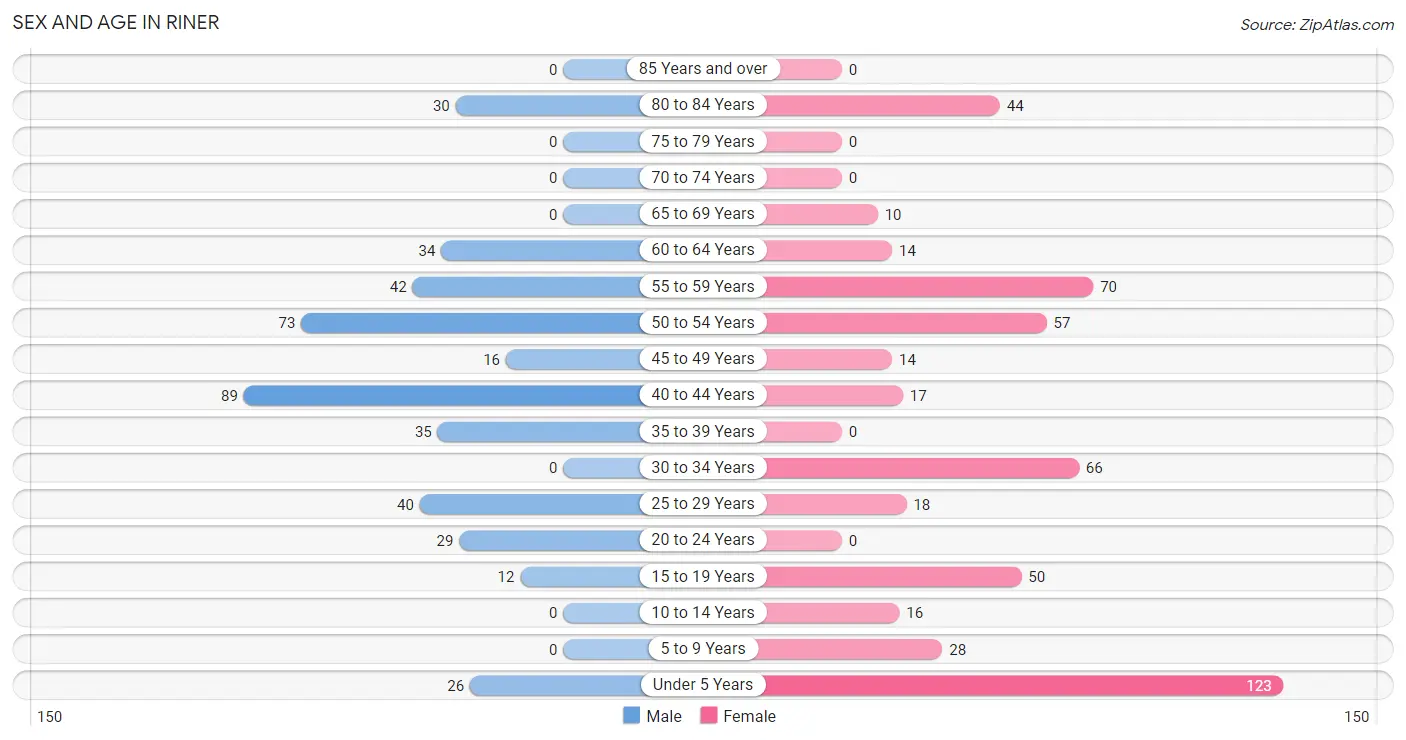
Sex and Age in Riner
Sex and Age in Riner
The most populous age groups in Riner are 40 to 44 Years (89 | 20.9%) for men and Under 5 Years (123 | 23.3%) for women.
| Age Bracket | Male | Female |
| Under 5 Years | 26 (6.1%) | 123 (23.3%) |
| 5 to 9 Years | 0 (0.0%) | 28 (5.3%) |
| 10 to 14 Years | 0 (0.0%) | 16 (3.0%) |
| 15 to 19 Years | 12 (2.8%) | 50 (9.5%) |
| 20 to 24 Years | 29 (6.8%) | 0 (0.0%) |
| 25 to 29 Years | 40 (9.4%) | 18 (3.4%) |
| 30 to 34 Years | 0 (0.0%) | 66 (12.5%) |
| 35 to 39 Years | 35 (8.2%) | 0 (0.0%) |
| 40 to 44 Years | 89 (20.9%) | 17 (3.2%) |
| 45 to 49 Years | 16 (3.8%) | 14 (2.7%) |
| 50 to 54 Years | 73 (17.1%) | 57 (10.8%) |
| 55 to 59 Years | 42 (9.9%) | 70 (13.3%) |
| 60 to 64 Years | 34 (8.0%) | 14 (2.7%) |
| 65 to 69 Years | 0 (0.0%) | 10 (1.9%) |
| 70 to 74 Years | 0 (0.0%) | 0 (0.0%) |
| 75 to 79 Years | 0 (0.0%) | 0 (0.0%) |
| 80 to 84 Years | 30 (7.0%) | 44 (8.4%) |
| 85 Years and over | 0 (0.0%) | 0 (0.0%) |
| Total | 426 (100.0%) | 527 (100.0%) |
Families and Households in Riner
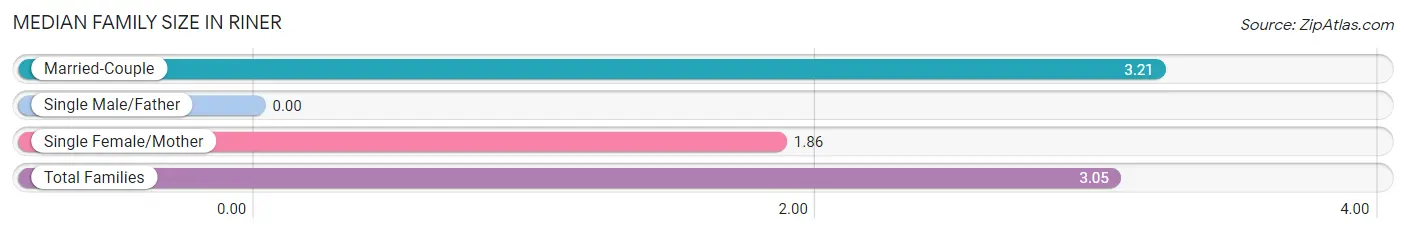
Median Family Size in Riner
| Family Type | # Families | Family Size |
| Married-Couple | 253 (87.8%) | 3.21 |
| Single Male/Father | 0 (0.0%) | - |
| Single Female/Mother | 35 (12.1%) | 1.86 |
| Total Families | 288 (100.0%) | 3.05 |
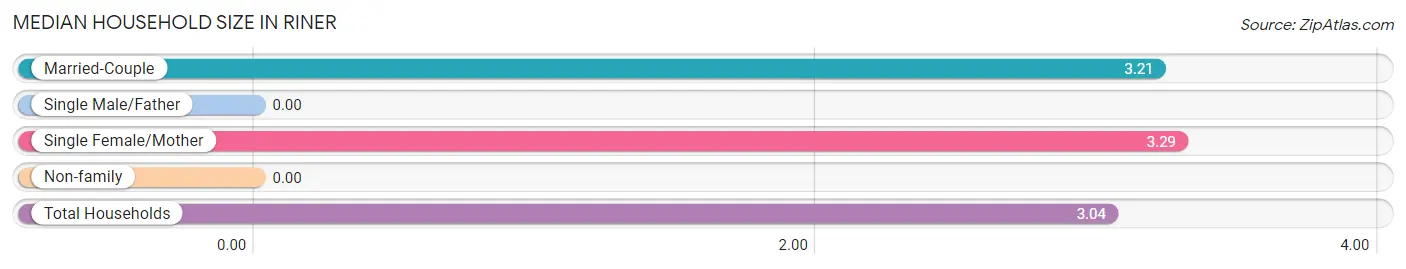
Median Household Size in Riner
| Household Type | # Households | Household Size |
| Married-Couple | 253 (80.8%) | 3.21 |
| Single Male/Father | 0 (0.0%) | - |
| Single Female/Mother | 35 (11.2%) | 3.29 |
| Non-family | 25 (8.0%) | - |
| Total Households | 313 (100.0%) | 3.04 |
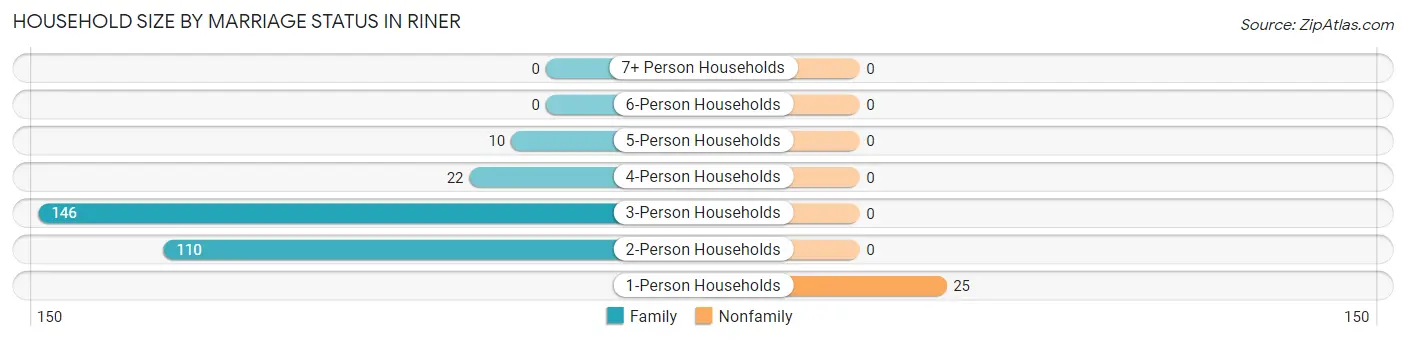
Household Size by Marriage Status in Riner
Out of a total of 313 households in Riner, 288 (92.0%) are family households, while 25 (8.0%) are nonfamily households. The most numerous type of family households are 3-person households, comprising 146, and the most common type of nonfamily households are 1-person households, comprising 25.
| Household Size | Family Households | Nonfamily Households |
| 1-Person Households | - | 25 (8.0%) |
| 2-Person Households | 110 (35.1%) | 0 (0.0%) |
| 3-Person Households | 146 (46.7%) | 0 (0.0%) |
| 4-Person Households | 22 (7.0%) | 0 (0.0%) |
| 5-Person Households | 10 (3.2%) | 0 (0.0%) |
| 6-Person Households | 0 (0.0%) | 0 (0.0%) |
| 7+ Person Households | 0 (0.0%) | 0 (0.0%) |
| Total | 288 (92.0%) | 25 (8.0%) |
Female Fertility in Riner
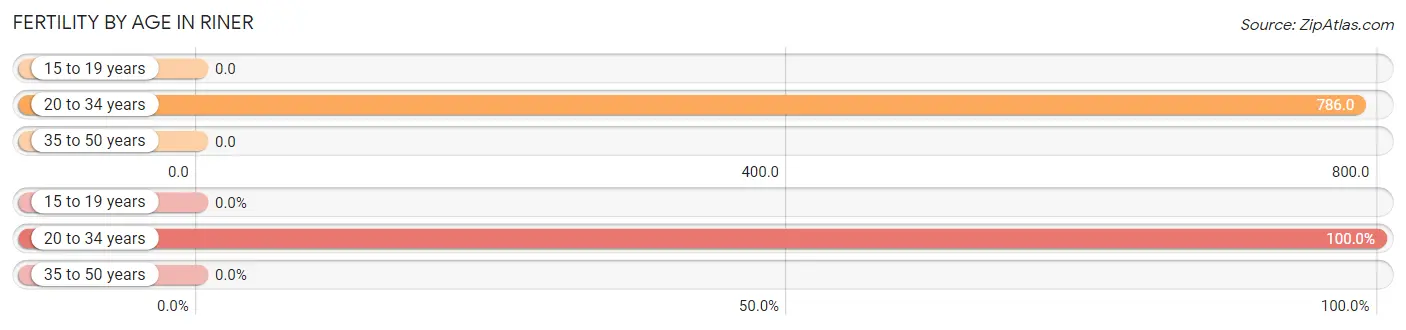
Fertility by Age in Riner
Average fertility rate in Riner is 400.0 births per 1,000 women. Women in the age bracket of 20 to 34 years have the highest fertility rate with 786.0 births per 1,000 women. Women in the age bracket of 20 to 34 years acount for 100.0% of all women with births.
| Age Bracket | Women with Births | Births / 1,000 Women |
| 15 to 19 years | 0 (0.0%) | 0.0 |
| 20 to 34 years | 66 (100.0%) | 786.0 |
| 35 to 50 years | 0 (0.0%) | 0.0 |
| Total | 66 (100.0%) | 400.0 |
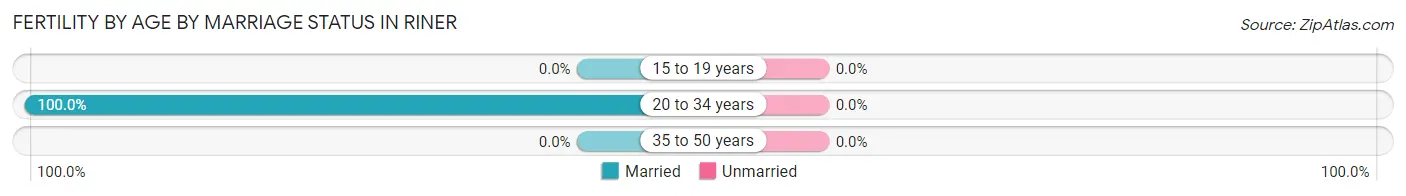
Fertility by Age by Marriage Status in Riner
| Age Bracket | Married | Unmarried |
| 15 to 19 years | 0 (0.0%) | 0 (0.0%) |
| 20 to 34 years | 66 (100.0%) | 0 (0.0%) |
| 35 to 50 years | 0 (0.0%) | 0 (0.0%) |
| Total | 66 (100.0%) | 0 (0.0%) |
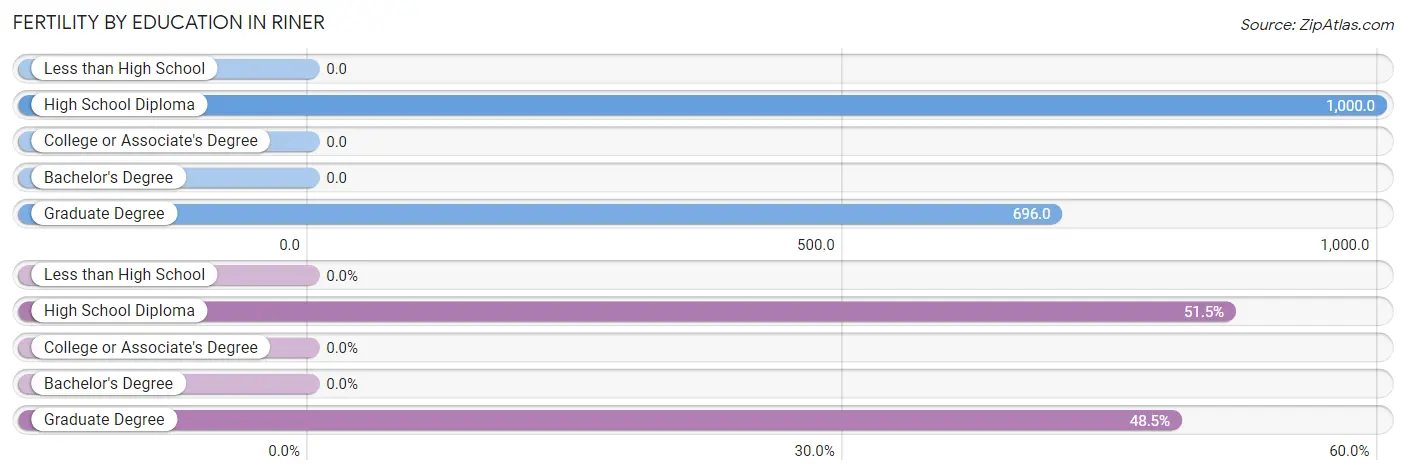
Fertility by Education in Riner
| Educational Attainment | Women with Births | Births / 1,000 Women |
| Less than High School | 0 (0.0%) | 0.0 |
| High School Diploma | 34 (51.5%) | 1,000.0 |
| College or Associate's Degree | 0 (0.0%) | 0.0 |
| Bachelor's Degree | 0 (0.0%) | 0.0 |
| Graduate Degree | 32 (48.5%) | 696.0 |
| Total | 66 (100.0%) | 400.0 |
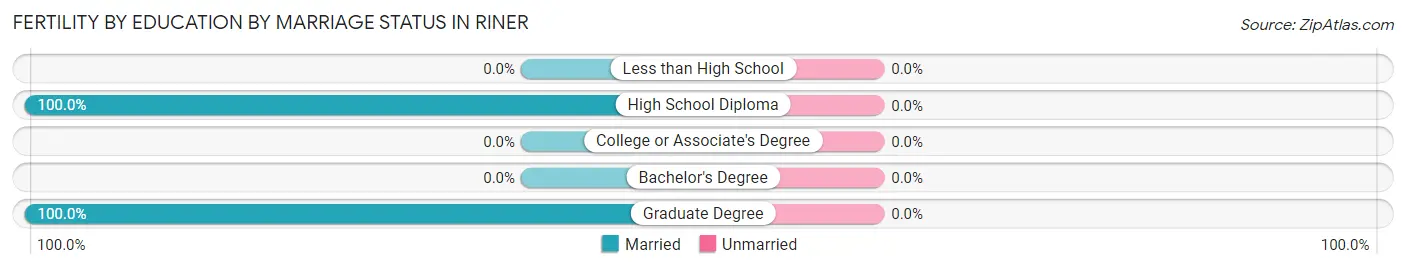
Fertility by Education by Marriage Status in Riner
| Educational Attainment | Married | Unmarried |
| Less than High School | 0 (0.0%) | 0 (0.0%) |
| High School Diploma | 34 (100.0%) | 0 (0.0%) |
| College or Associate's Degree | 0 (0.0%) | 0 (0.0%) |
| Bachelor's Degree | 0 (0.0%) | 0 (0.0%) |
| Graduate Degree | 32 (100.0%) | 0 (0.0%) |
| Total | 66 (100.0%) | 0 (0.0%) |
Employment Characteristics in Riner
Employment by Class of Employer in Riner
Among the 434 employed individuals in Riner, private company employees (211 | 48.6%), state government employees (105 | 24.2%), and not-for-profit organizations (62 | 14.3%) make up the most common classes of employment.
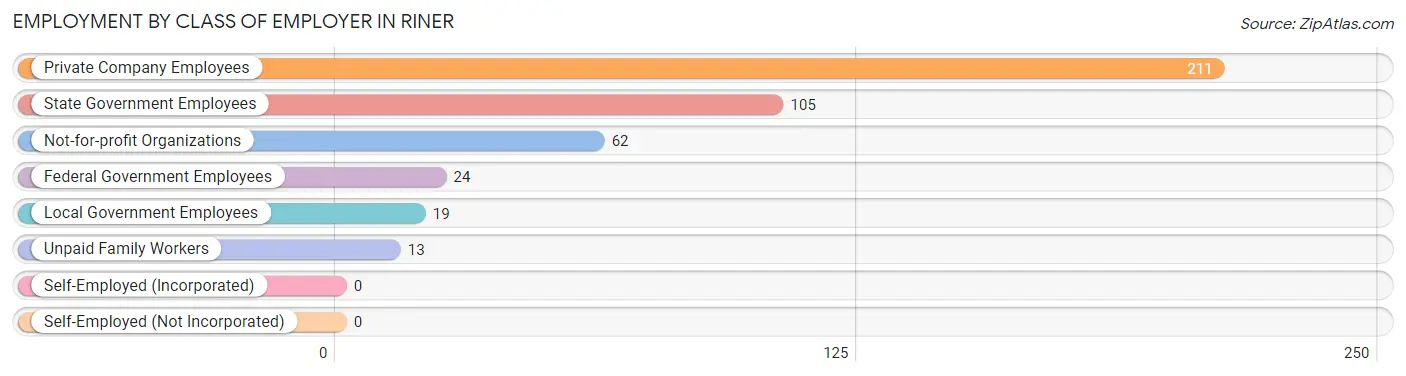
| Employer Class | # Employees | % Employees |
| Private Company Employees | 211 | 48.6% |
| Self-Employed (Incorporated) | 0 | 0.0% |
| Self-Employed (Not Incorporated) | 0 | 0.0% |
| Not-for-profit Organizations | 62 | 14.3% |
| Local Government Employees | 19 | 4.4% |
| State Government Employees | 105 | 24.2% |
| Federal Government Employees | 24 | 5.5% |
| Unpaid Family Workers | 13 | 3.0% |
| Total | 434 | 100.0% |
Employment Status by Age in Riner
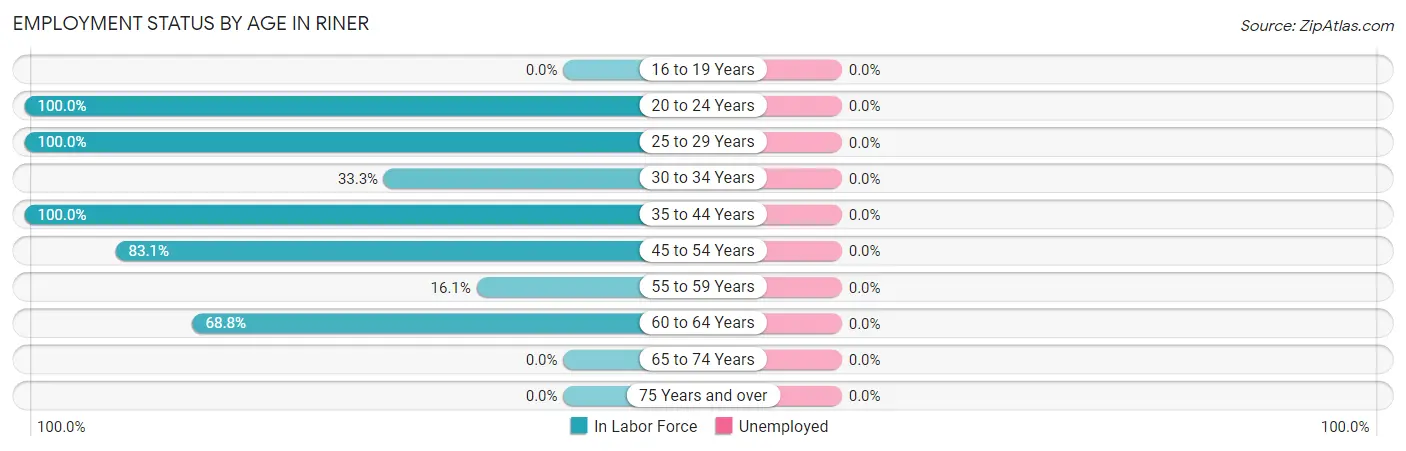
| Age Bracket | In Labor Force | Unemployed |
| 16 to 19 Years | 0 (0.0%) | 0 (0.0%) |
| 20 to 24 Years | 29 (100.0%) | 0 (0.0%) |
| 25 to 29 Years | 58 (100.0%) | 0 (0.0%) |
| 30 to 34 Years | 22 (33.3%) | 0 (0.0%) |
| 35 to 44 Years | 141 (100.0%) | 0 (0.0%) |
| 45 to 54 Years | 133 (83.1%) | 0 (0.0%) |
| 55 to 59 Years | 18 (16.1%) | 0 (0.0%) |
| 60 to 64 Years | 33 (68.8%) | 0 (0.0%) |
| 65 to 74 Years | 0 (0.0%) | 0 (0.0%) |
| 75 Years and over | 0 (0.0%) | 0 (0.0%) |
| Total | 434 (58.6%) | 0 (0.0%) |
Employment Status by Educational Attainment in Riner
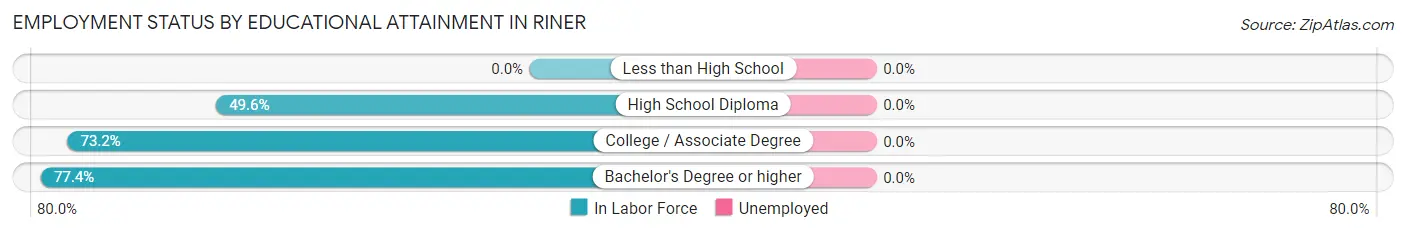
| Educational Attainment | In Labor Force | Unemployed |
| Less than High School | 0 (0.0%) | 0 (0.0%) |
| High School Diploma | 66 (49.6%) | 0 (0.0%) |
| College / Associate Degree | 188 (73.2%) | 0 (0.0%) |
| Bachelor's Degree or higher | 151 (77.4%) | 0 (0.0%) |
| Total | 405 (69.2%) | 0 (0.0%) |
Employment Occupations by Sex in Riner
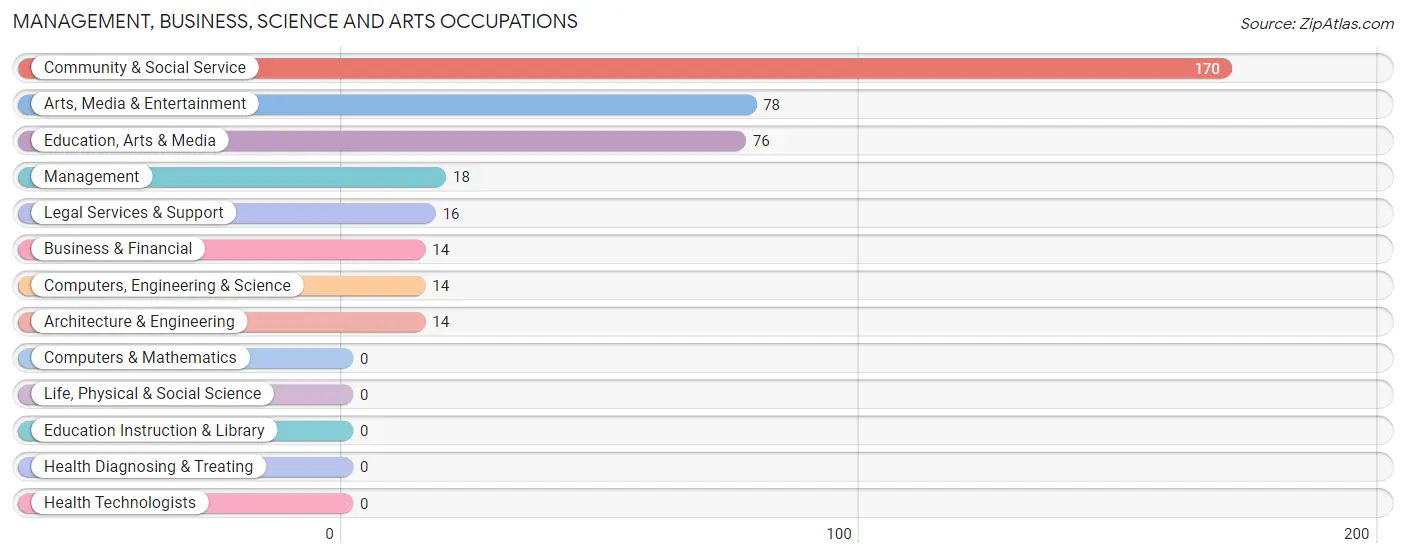
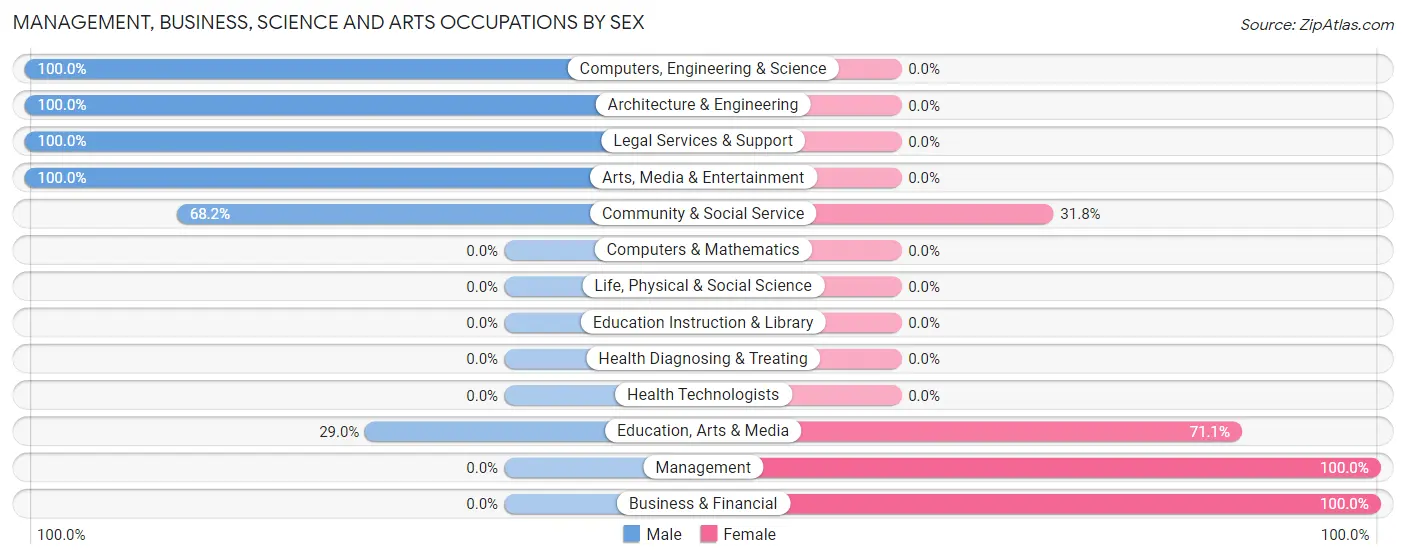
Management, Business, Science and Arts Occupations
The most common Management, Business, Science and Arts occupations in Riner are Community & Social Service (170 | 39.2%), Arts, Media & Entertainment (78 | 18.0%), Education, Arts & Media (76 | 17.5%), Management (18 | 4.2%), and Legal Services & Support (16 | 3.7%).
Management, Business, Science and Arts Occupations by Sex
Within the Management, Business, Science and Arts occupations in Riner, the most male-oriented occupations are Computers, Engineering & Science (100.0%), Architecture & Engineering (100.0%), and Legal Services & Support (100.0%), while the most female-oriented occupations are Management (100.0%), Business & Financial (100.0%), and Education, Arts & Media (71.1%).
| Occupation | Male | Female |
| Management | 0 (0.0%) | 18 (100.0%) |
| Business & Financial | 0 (0.0%) | 14 (100.0%) |
| Computers, Engineering & Science | 14 (100.0%) | 0 (0.0%) |
| Computers & Mathematics | 0 (0.0%) | 0 (0.0%) |
| Architecture & Engineering | 14 (100.0%) | 0 (0.0%) |
| Life, Physical & Social Science | 0 (0.0%) | 0 (0.0%) |
| Community & Social Service | 116 (68.2%) | 54 (31.8%) |
| Education, Arts & Media | 22 (28.9%) | 54 (71.1%) |
| Legal Services & Support | 16 (100.0%) | 0 (0.0%) |
| Education Instruction & Library | 0 (0.0%) | 0 (0.0%) |
| Arts, Media & Entertainment | 78 (100.0%) | 0 (0.0%) |
| Health Diagnosing & Treating | 0 (0.0%) | 0 (0.0%) |
| Health Technologists | 0 (0.0%) | 0 (0.0%) |
| Total (Category) | 130 (60.2%) | 86 (39.8%) |
| Total (Overall) | 290 (66.8%) | 144 (33.2%) |
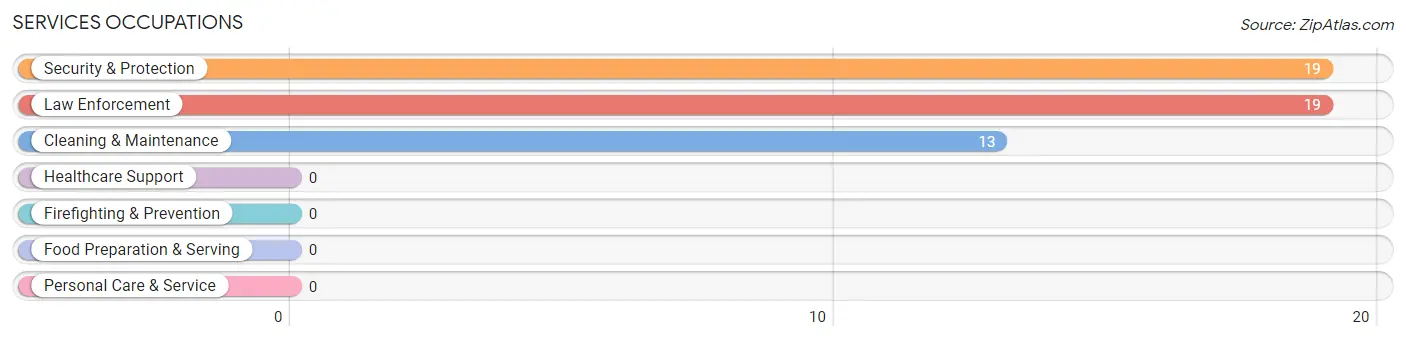
Services Occupations
The most common Services occupations in Riner are Security & Protection (19 | 4.4%), Law Enforcement (19 | 4.4%), and Cleaning & Maintenance (13 | 3.0%).
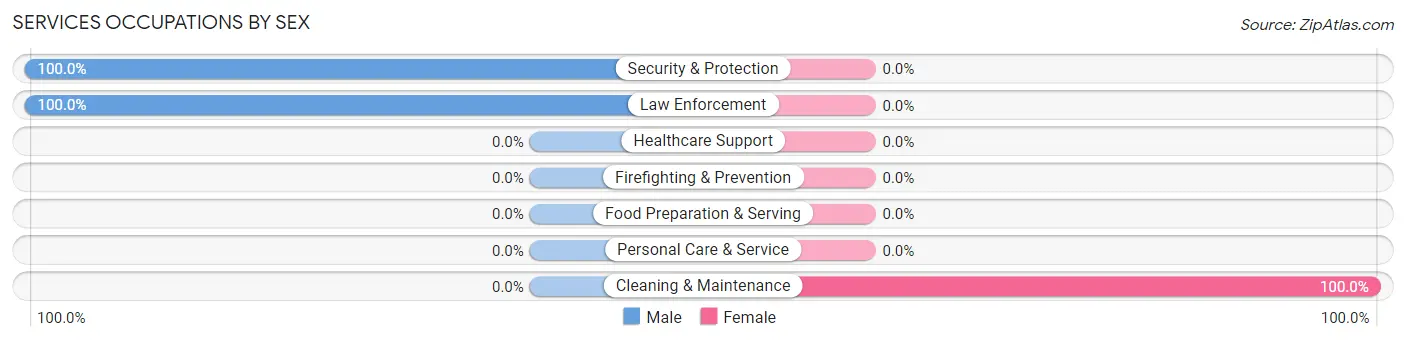
Services Occupations by Sex
| Occupation | Male | Female |
| Healthcare Support | 0 (0.0%) | 0 (0.0%) |
| Security & Protection | 19 (100.0%) | 0 (0.0%) |
| Firefighting & Prevention | 0 (0.0%) | 0 (0.0%) |
| Law Enforcement | 19 (100.0%) | 0 (0.0%) |
| Food Preparation & Serving | 0 (0.0%) | 0 (0.0%) |
| Cleaning & Maintenance | 0 (0.0%) | 13 (100.0%) |
| Personal Care & Service | 0 (0.0%) | 0 (0.0%) |
| Total (Category) | 19 (59.4%) | 13 (40.6%) |
| Total (Overall) | 290 (66.8%) | 144 (33.2%) |
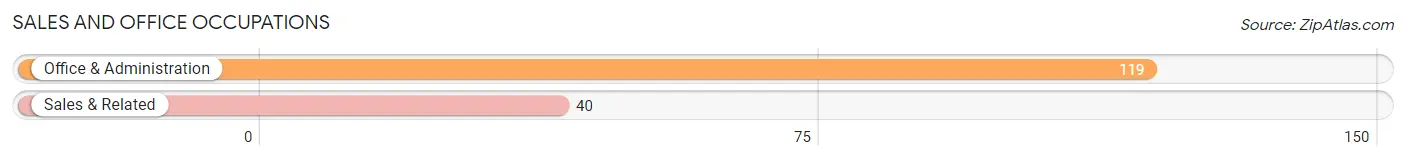
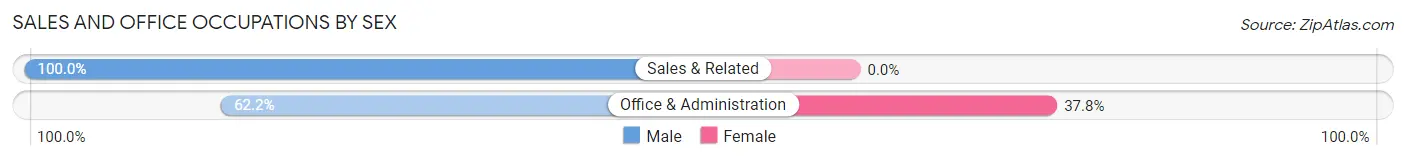
Sales and Office Occupations
The most common Sales and Office occupations in Riner are Office & Administration (119 | 27.4%), and Sales & Related (40 | 9.2%).
Sales and Office Occupations by Sex
| Occupation | Male | Female |
| Sales & Related | 40 (100.0%) | 0 (0.0%) |
| Office & Administration | 74 (62.2%) | 45 (37.8%) |
| Total (Category) | 114 (71.7%) | 45 (28.3%) |
| Total (Overall) | 290 (66.8%) | 144 (33.2%) |
Natural Resources, Construction and Maintenance Occupations
The most common Natural Resources, Construction and Maintenance occupations in Riner are Construction & Extraction (15 | 3.5%), and Installation, Maintenance & Repair (12 | 2.8%).
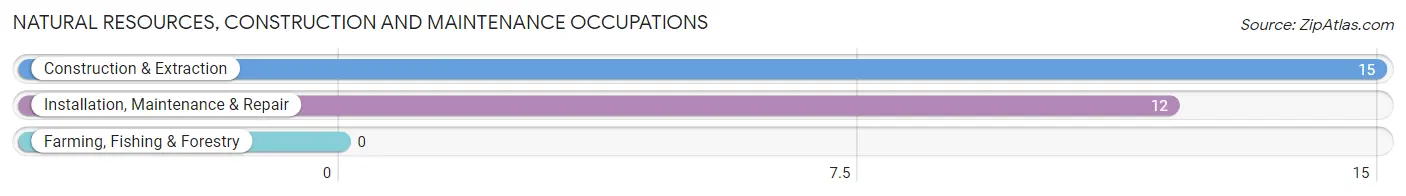
Natural Resources, Construction and Maintenance Occupations by Sex
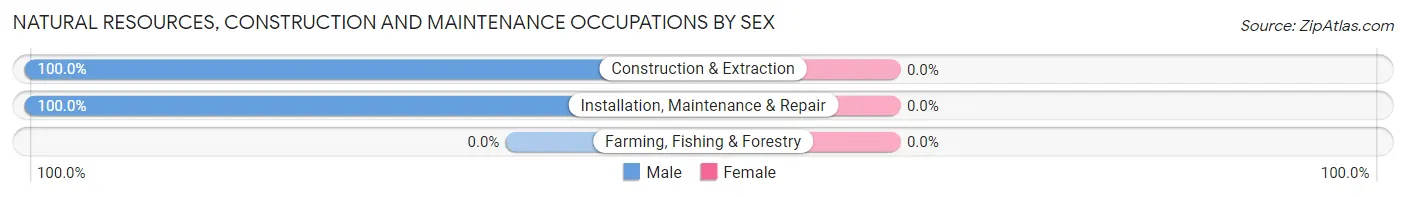
| Occupation | Male | Female |
| Farming, Fishing & Forestry | 0 (0.0%) | 0 (0.0%) |
| Construction & Extraction | 15 (100.0%) | 0 (0.0%) |
| Installation, Maintenance & Repair | 12 (100.0%) | 0 (0.0%) |
| Total (Category) | 27 (100.0%) | 0 (0.0%) |
| Total (Overall) | 290 (66.8%) | 144 (33.2%) |
Production, Transportation and Moving Occupations
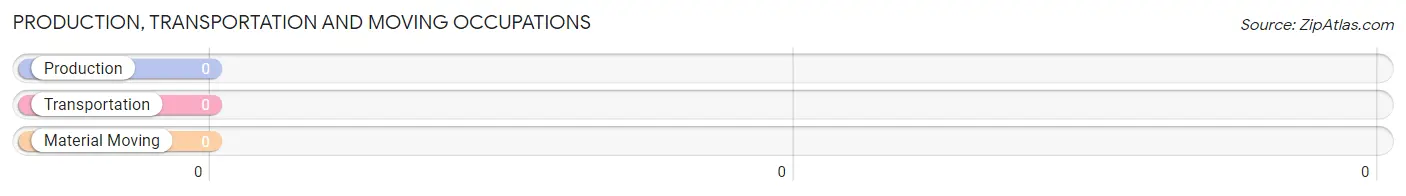
Production, Transportation and Moving Occupations by Sex
| Occupation | Male | Female |
| Production | 0 (0.0%) | 0 (0.0%) |
| Transportation | 0 (0.0%) | 0 (0.0%) |
| Material Moving | 0 (0.0%) | 0 (0.0%) |
| Total (Category) | 0 (0.0%) | 0 (0.0%) |
| Total (Overall) | 290 (66.8%) | 144 (33.2%) |
Employment Industries by Sex in Riner
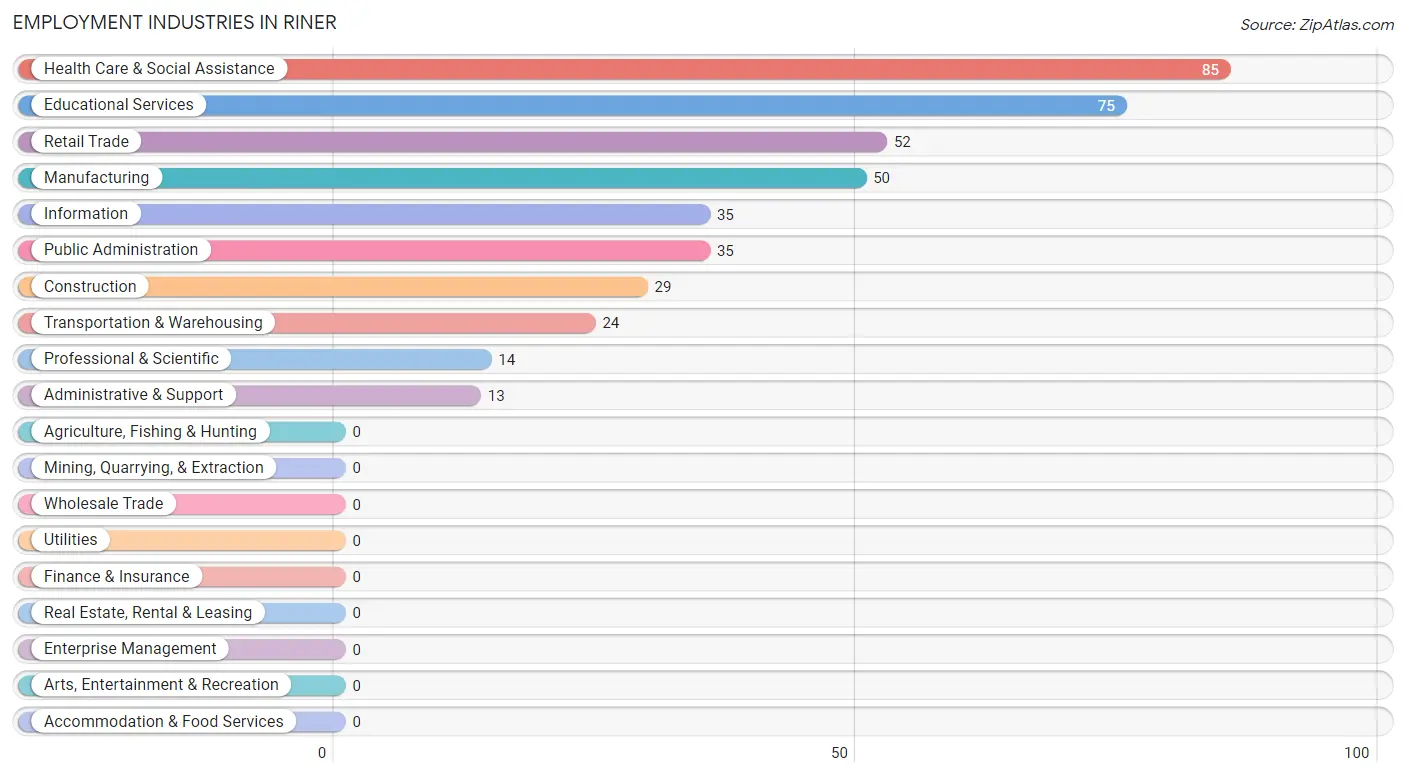
Employment Industries in Riner
The major employment industries in Riner include Health Care & Social Assistance (85 | 19.6%), Educational Services (75 | 17.3%), Retail Trade (52 | 12.0%), Manufacturing (50 | 11.5%), and Information (35 | 8.1%).
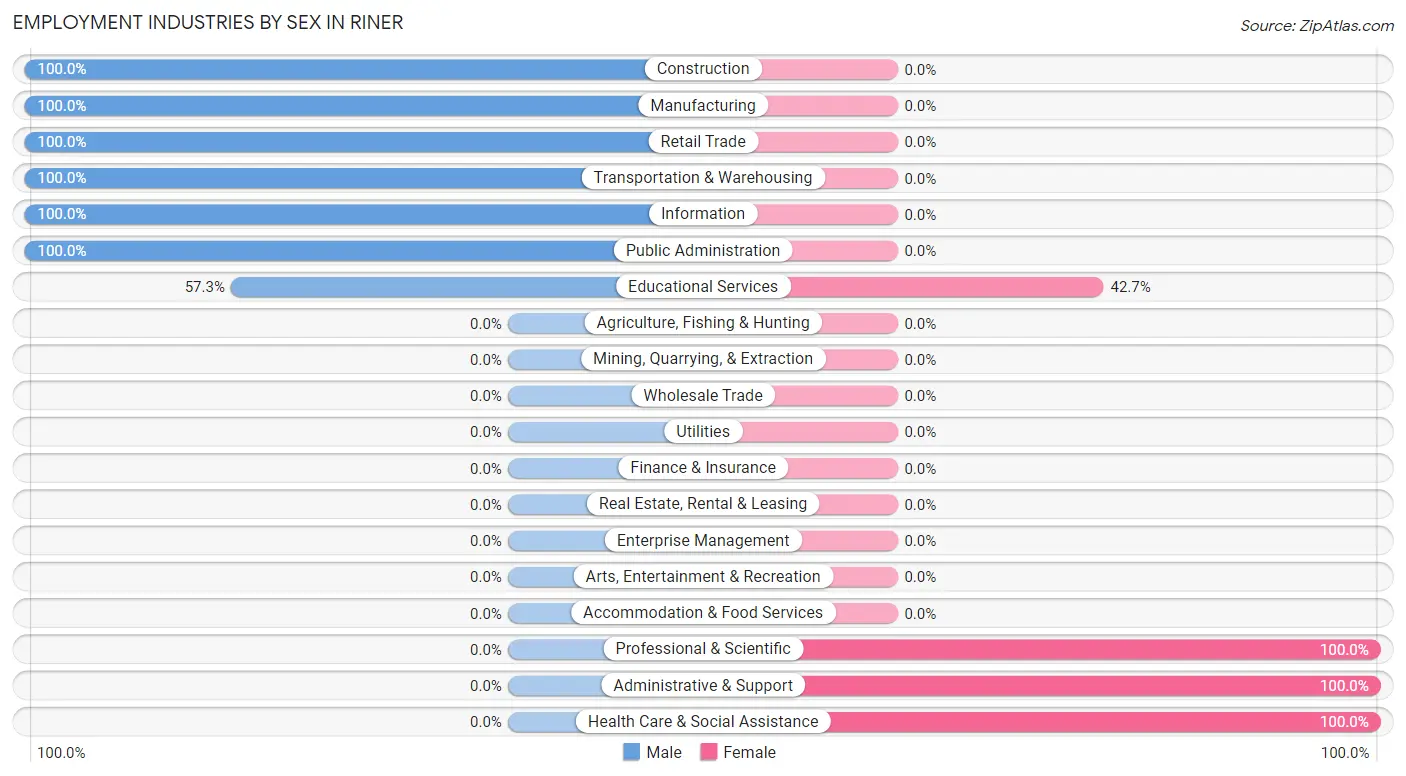
Employment Industries by Sex in Riner
The Riner industries that see more men than women are Construction (100.0%), Manufacturing (100.0%), and Retail Trade (100.0%), whereas the industries that tend to have a higher number of women are Professional & Scientific (100.0%), Administrative & Support (100.0%), and Health Care & Social Assistance (100.0%).
| Industry | Male | Female |
| Agriculture, Fishing & Hunting | 0 (0.0%) | 0 (0.0%) |
| Mining, Quarrying, & Extraction | 0 (0.0%) | 0 (0.0%) |
| Construction | 29 (100.0%) | 0 (0.0%) |
| Manufacturing | 50 (100.0%) | 0 (0.0%) |
| Wholesale Trade | 0 (0.0%) | 0 (0.0%) |
| Retail Trade | 52 (100.0%) | 0 (0.0%) |
| Transportation & Warehousing | 24 (100.0%) | 0 (0.0%) |
| Utilities | 0 (0.0%) | 0 (0.0%) |
| Information | 35 (100.0%) | 0 (0.0%) |
| Finance & Insurance | 0 (0.0%) | 0 (0.0%) |
| Real Estate, Rental & Leasing | 0 (0.0%) | 0 (0.0%) |
| Professional & Scientific | 0 (0.0%) | 14 (100.0%) |
| Enterprise Management | 0 (0.0%) | 0 (0.0%) |
| Administrative & Support | 0 (0.0%) | 13 (100.0%) |
| Educational Services | 43 (57.3%) | 32 (42.7%) |
| Health Care & Social Assistance | 0 (0.0%) | 85 (100.0%) |
| Arts, Entertainment & Recreation | 0 (0.0%) | 0 (0.0%) |
| Accommodation & Food Services | 0 (0.0%) | 0 (0.0%) |
| Public Administration | 35 (100.0%) | 0 (0.0%) |
| Total | 290 (66.8%) | 144 (33.2%) |
Education in Riner
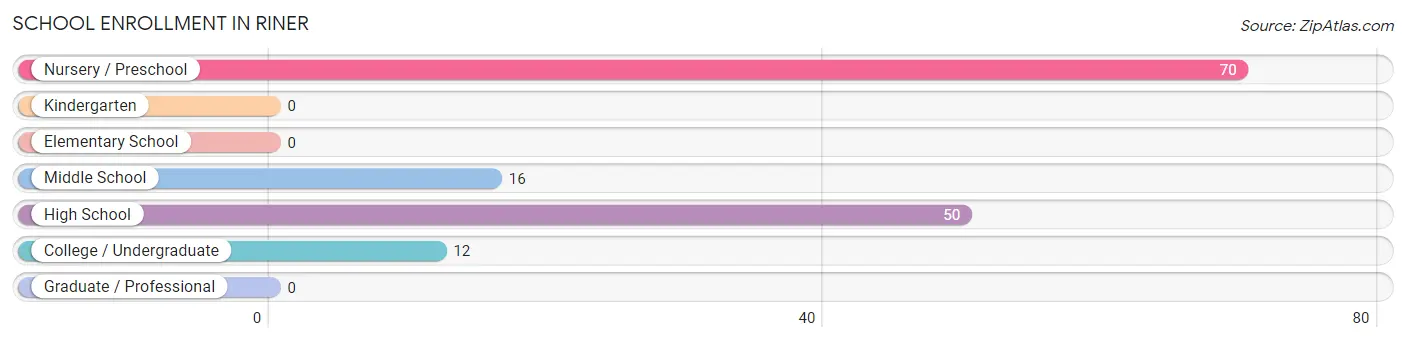
School Enrollment in Riner
The most common levels of schooling among the 148 students in Riner are nursery / preschool (70 | 47.3%), high school (50 | 33.8%), and middle school (16 | 10.8%).
| School Level | # Students | % Students |
| Nursery / Preschool | 70 | 47.3% |
| Kindergarten | 0 | 0.0% |
| Elementary School | 0 | 0.0% |
| Middle School | 16 | 10.8% |
| High School | 50 | 33.8% |
| College / Undergraduate | 12 | 8.1% |
| Graduate / Professional | 0 | 0.0% |
| Total | 148 | 100.0% |
School Enrollment by Age by Funding Source in Riner
Out of a total of 148 students who are enrolled in schools in Riner, 30 (20.3%) attend a private institution, while the remaining 118 (79.7%) are enrolled in public schools. The age group of 15 to 17 year olds has the highest likelihood of being enrolled in private schools, with 30 (60.0% in the age bracket) enrolled. Conversely, the age group of 3 to 4 year olds has the lowest likelihood of being enrolled in a private school, with 42 (100.0% in the age bracket) attending a public institution.
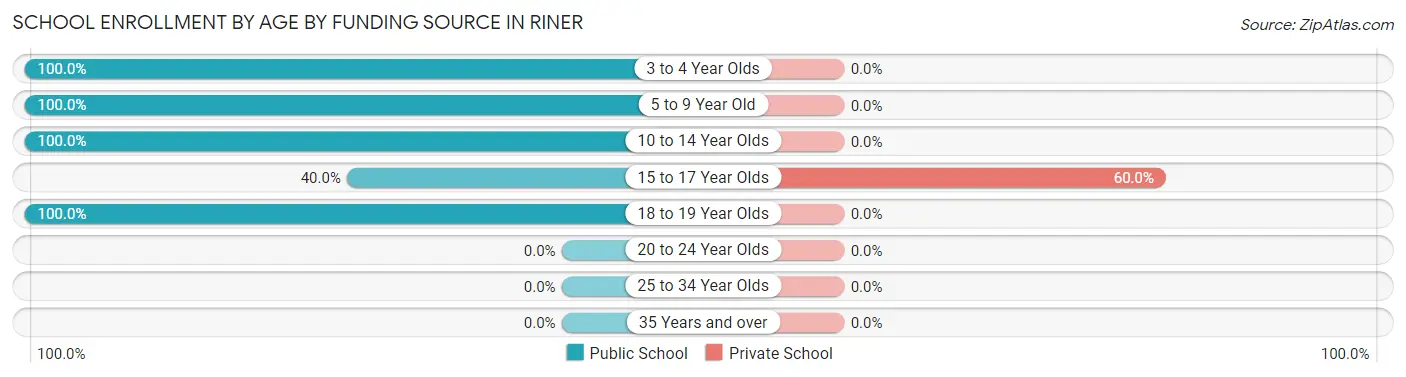
| Age Bracket | Public School | Private School |
| 3 to 4 Year Olds | 42 (100.0%) | 0 (0.0%) |
| 5 to 9 Year Old | 28 (100.0%) | 0 (0.0%) |
| 10 to 14 Year Olds | 16 (100.0%) | 0 (0.0%) |
| 15 to 17 Year Olds | 20 (40.0%) | 30 (60.0%) |
| 18 to 19 Year Olds | 12 (100.0%) | 0 (0.0%) |
| 20 to 24 Year Olds | 0 (0.0%) | 0 (0.0%) |
| 25 to 34 Year Olds | 0 (0.0%) | 0 (0.0%) |
| 35 Years and over | 0 (0.0%) | 0 (0.0%) |
| Total | 118 (79.7%) | 30 (20.3%) |
Educational Attainment by Field of Study in Riner
Arts & humanities (77 | 33.5%), psychology (59 | 25.7%), multidisciplinary studies (35 | 15.2%), business (30 | 13.0%), and engineering (15 | 6.5%) are the most common fields of study among 230 individuals in Riner who have obtained a bachelor's degree or higher.
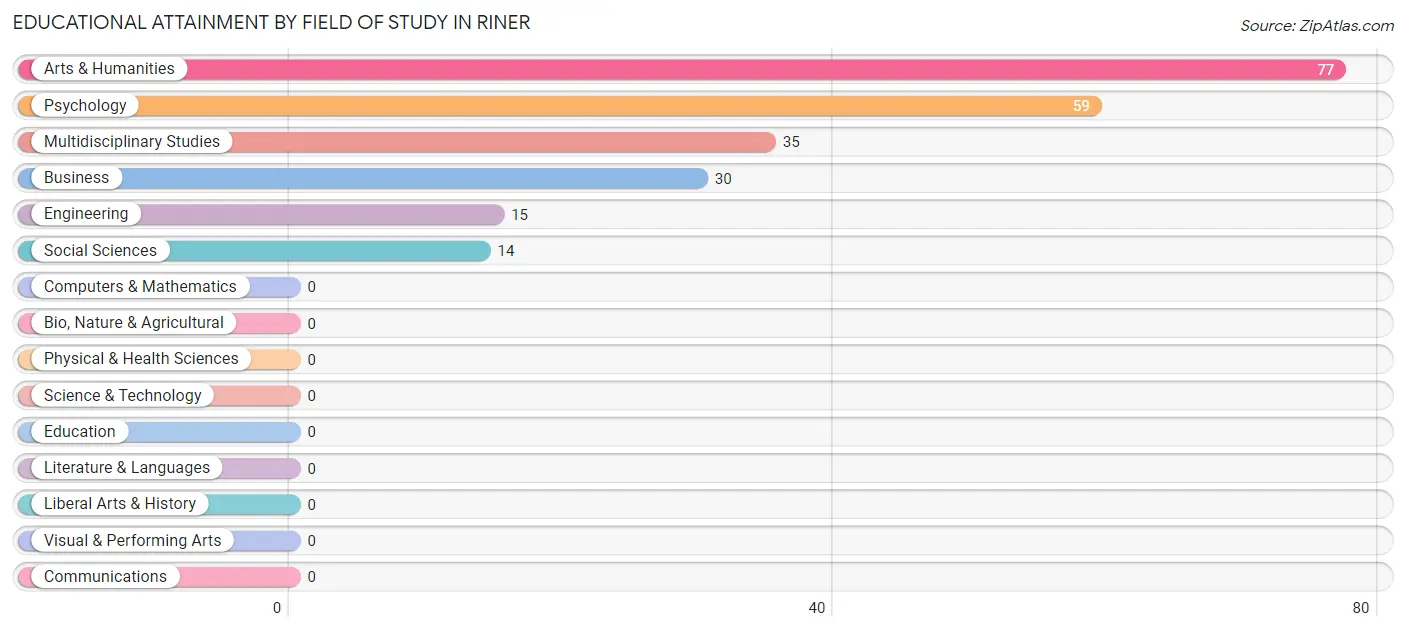
| Field of Study | # Graduates | % Graduates |
| Computers & Mathematics | 0 | 0.0% |
| Bio, Nature & Agricultural | 0 | 0.0% |
| Physical & Health Sciences | 0 | 0.0% |
| Psychology | 59 | 25.7% |
| Social Sciences | 14 | 6.1% |
| Engineering | 15 | 6.5% |
| Multidisciplinary Studies | 35 | 15.2% |
| Science & Technology | 0 | 0.0% |
| Business | 30 | 13.0% |
| Education | 0 | 0.0% |
| Literature & Languages | 0 | 0.0% |
| Liberal Arts & History | 0 | 0.0% |
| Visual & Performing Arts | 0 | 0.0% |
| Communications | 0 | 0.0% |
| Arts & Humanities | 77 | 33.5% |
| Total | 230 | 100.0% |
Transportation & Commute in Riner
Vehicle Availability by Sex in Riner
The most prevalent vehicle ownership categories in Riner are males with 2 vehicles (93, accounting for 32.1%) and females with 2 vehicles (64, making up 64.6%).
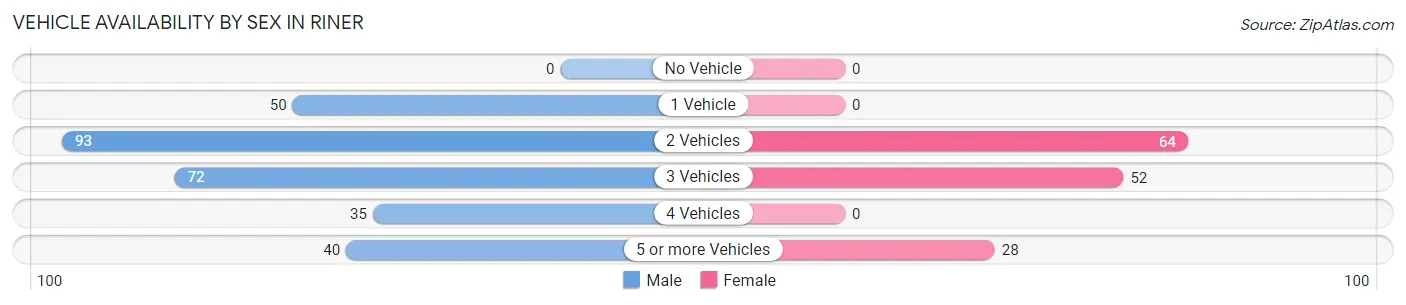
| Vehicles Available | Male | Female |
| No Vehicle | 0 (0.0%) | 0 (0.0%) |
| 1 Vehicle | 50 (17.2%) | 0 (0.0%) |
| 2 Vehicles | 93 (32.1%) | 64 (44.4%) |
| 3 Vehicles | 72 (24.8%) | 52 (36.1%) |
| 4 Vehicles | 35 (12.1%) | 0 (0.0%) |
| 5 or more Vehicles | 40 (13.8%) | 28 (19.4%) |
| Total | 290 (100.0%) | 144 (100.0%) |
Commute Time in Riner
The most frequently occuring commute durations in Riner are 25 to 29 minutes (157 commuters, 40.5%), 15 to 19 minutes (130 commuters, 33.5%), and 30 to 34 minutes (35 commuters, 9.0%).
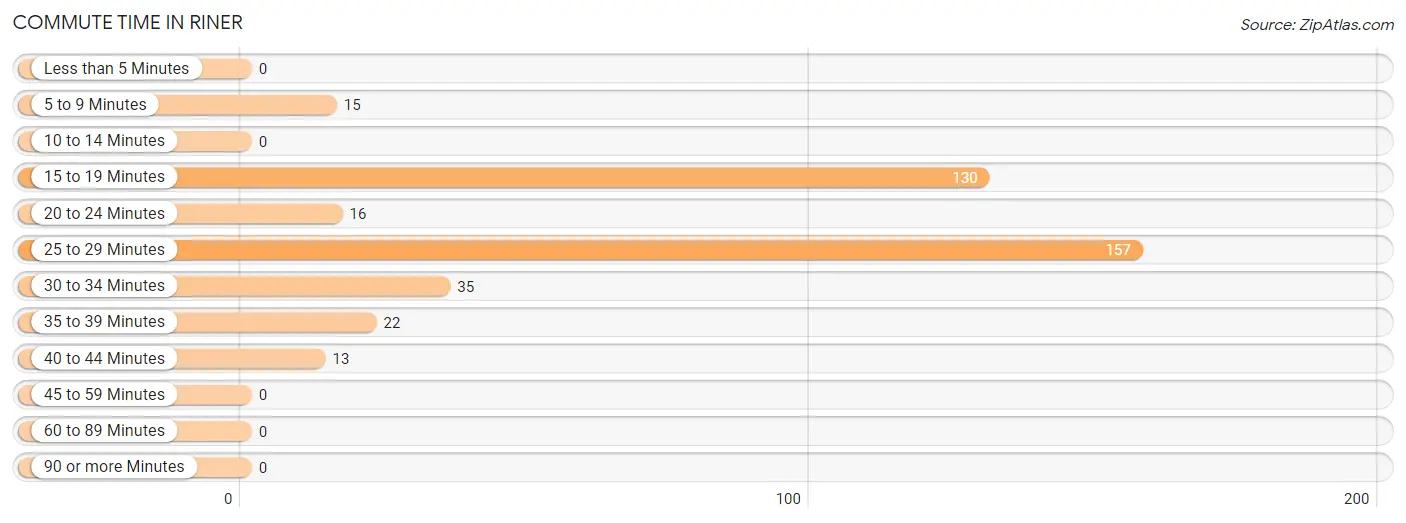
| Commute Time | # Commuters | % Commuters |
| Less than 5 Minutes | 0 | 0.0% |
| 5 to 9 Minutes | 15 | 3.9% |
| 10 to 14 Minutes | 0 | 0.0% |
| 15 to 19 Minutes | 130 | 33.5% |
| 20 to 24 Minutes | 16 | 4.1% |
| 25 to 29 Minutes | 157 | 40.5% |
| 30 to 34 Minutes | 35 | 9.0% |
| 35 to 39 Minutes | 22 | 5.7% |
| 40 to 44 Minutes | 13 | 3.4% |
| 45 to 59 Minutes | 0 | 0.0% |
| 60 to 89 Minutes | 0 | 0.0% |
| 90 or more Minutes | 0 | 0.0% |
Commute Time by Sex in Riner
The most common commute times in Riner are 15 to 19 minutes (102 commuters, 35.2%) for males and 25 to 29 minutes (57 commuters, 58.2%) for females.
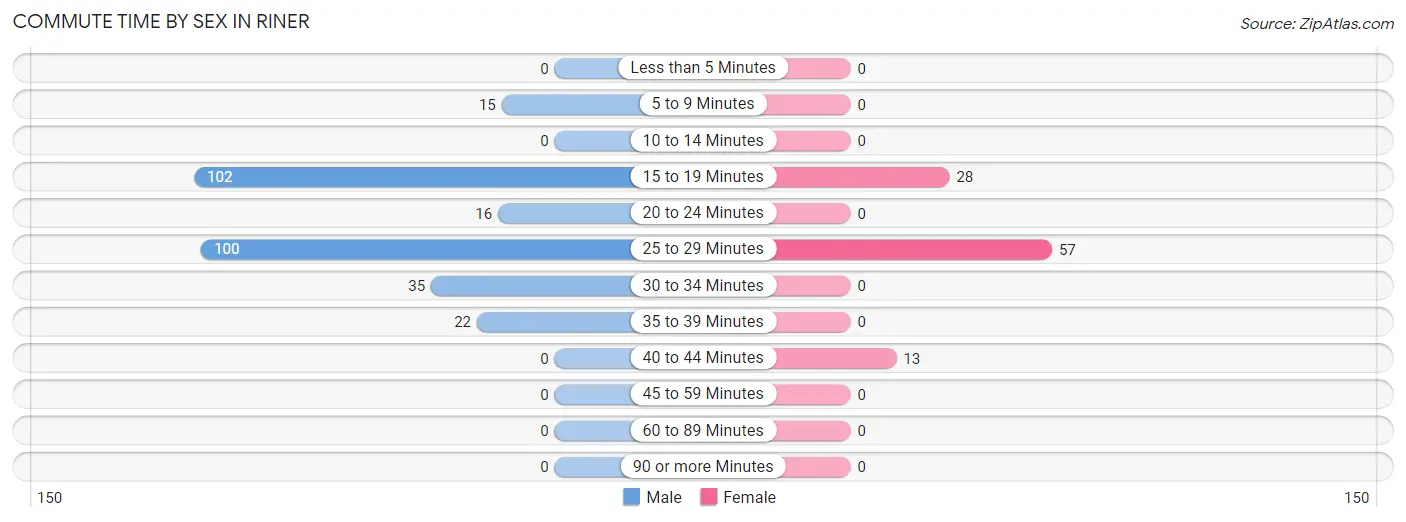
| Commute Time | Male | Female |
| Less than 5 Minutes | 0 (0.0%) | 0 (0.0%) |
| 5 to 9 Minutes | 15 (5.2%) | 0 (0.0%) |
| 10 to 14 Minutes | 0 (0.0%) | 0 (0.0%) |
| 15 to 19 Minutes | 102 (35.2%) | 28 (28.6%) |
| 20 to 24 Minutes | 16 (5.5%) | 0 (0.0%) |
| 25 to 29 Minutes | 100 (34.5%) | 57 (58.2%) |
| 30 to 34 Minutes | 35 (12.1%) | 0 (0.0%) |
| 35 to 39 Minutes | 22 (7.6%) | 0 (0.0%) |
| 40 to 44 Minutes | 0 (0.0%) | 13 (13.3%) |
| 45 to 59 Minutes | 0 (0.0%) | 0 (0.0%) |
| 60 to 89 Minutes | 0 (0.0%) | 0 (0.0%) |
| 90 or more Minutes | 0 (0.0%) | 0 (0.0%) |
Time of Departure to Work by Sex in Riner
The most frequent times of departure to work in Riner are 7:30 AM to 7:59 AM (101, 34.8%) for males and 7:00 AM to 7:29 AM (41, 41.8%) for females.
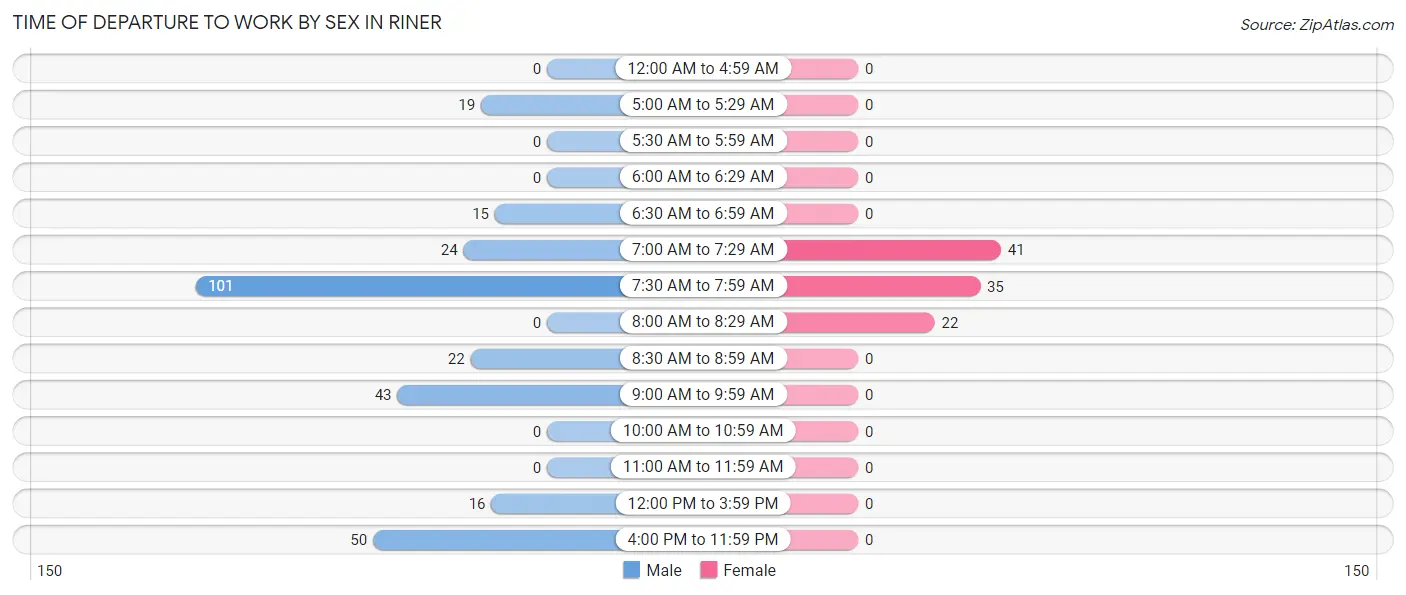
| Time of Departure | Male | Female |
| 12:00 AM to 4:59 AM | 0 (0.0%) | 0 (0.0%) |
| 5:00 AM to 5:29 AM | 19 (6.6%) | 0 (0.0%) |
| 5:30 AM to 5:59 AM | 0 (0.0%) | 0 (0.0%) |
| 6:00 AM to 6:29 AM | 0 (0.0%) | 0 (0.0%) |
| 6:30 AM to 6:59 AM | 15 (5.2%) | 0 (0.0%) |
| 7:00 AM to 7:29 AM | 24 (8.3%) | 41 (41.8%) |
| 7:30 AM to 7:59 AM | 101 (34.8%) | 35 (35.7%) |
| 8:00 AM to 8:29 AM | 0 (0.0%) | 22 (22.5%) |
| 8:30 AM to 8:59 AM | 22 (7.6%) | 0 (0.0%) |
| 9:00 AM to 9:59 AM | 43 (14.8%) | 0 (0.0%) |
| 10:00 AM to 10:59 AM | 0 (0.0%) | 0 (0.0%) |
| 11:00 AM to 11:59 AM | 0 (0.0%) | 0 (0.0%) |
| 12:00 PM to 3:59 PM | 16 (5.5%) | 0 (0.0%) |
| 4:00 PM to 11:59 PM | 50 (17.2%) | 0 (0.0%) |
| Total | 290 (100.0%) | 98 (100.0%) |
Housing Occupancy in Riner
Occupancy by Ownership in Riner
Of the total 313 dwellings in Riner, owner-occupied units account for 259 (82.8%), while renter-occupied units make up 54 (17.2%).
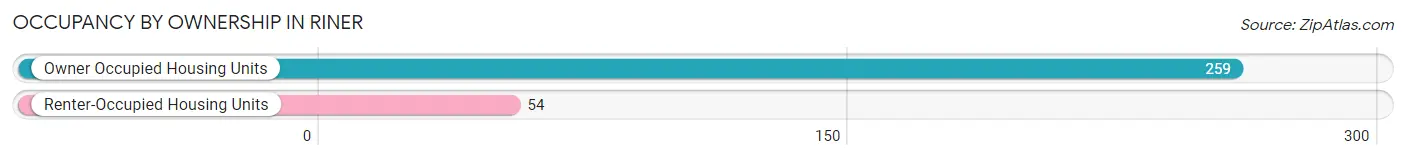
| Occupancy | # Housing Units | % Housing Units |
| Owner Occupied Housing Units | 259 | 82.8% |
| Renter-Occupied Housing Units | 54 | 17.2% |
| Total Occupied Housing Units | 313 | 100.0% |
Occupancy by Household Size in Riner
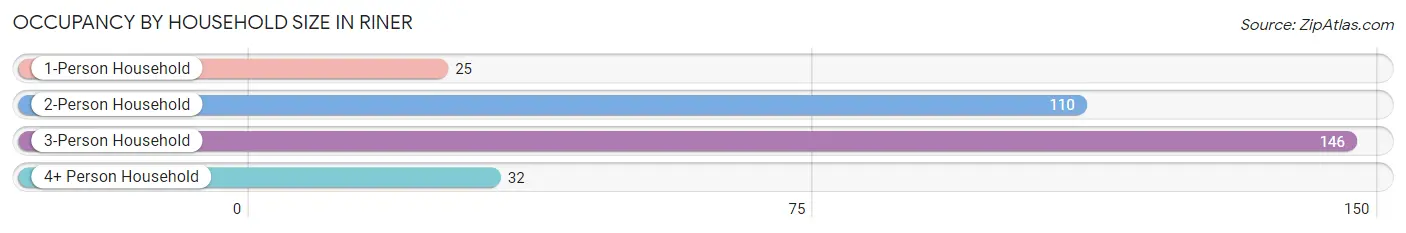
| Household Size | # Housing Units | % Housing Units |
| 1-Person Household | 25 | 8.0% |
| 2-Person Household | 110 | 35.1% |
| 3-Person Household | 146 | 46.7% |
| 4+ Person Household | 32 | 10.2% |
| Total Housing Units | 313 | 100.0% |
Occupancy by Ownership by Household Size in Riner
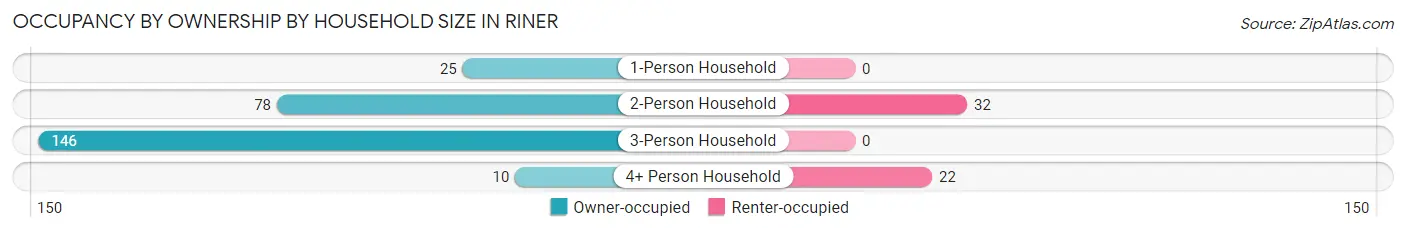
| Household Size | Owner-occupied | Renter-occupied |
| 1-Person Household | 25 (100.0%) | 0 (0.0%) |
| 2-Person Household | 78 (70.9%) | 32 (29.1%) |
| 3-Person Household | 146 (100.0%) | 0 (0.0%) |
| 4+ Person Household | 10 (31.2%) | 22 (68.8%) |
| Total Housing Units | 259 (82.8%) | 54 (17.2%) |
Occupancy by Educational Attainment in Riner
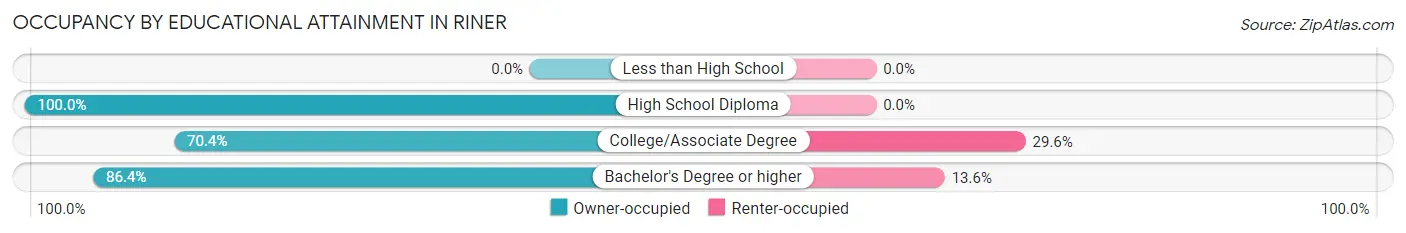
| Household Size | Owner-occupied | Renter-occupied |
| Less than High School | 0 (0.0%) | 0 (0.0%) |
| High School Diploma | 75 (100.0%) | 0 (0.0%) |
| College/Associate Degree | 95 (70.4%) | 40 (29.6%) |
| Bachelor's Degree or higher | 89 (86.4%) | 14 (13.6%) |
Occupancy by Age of Householder in Riner
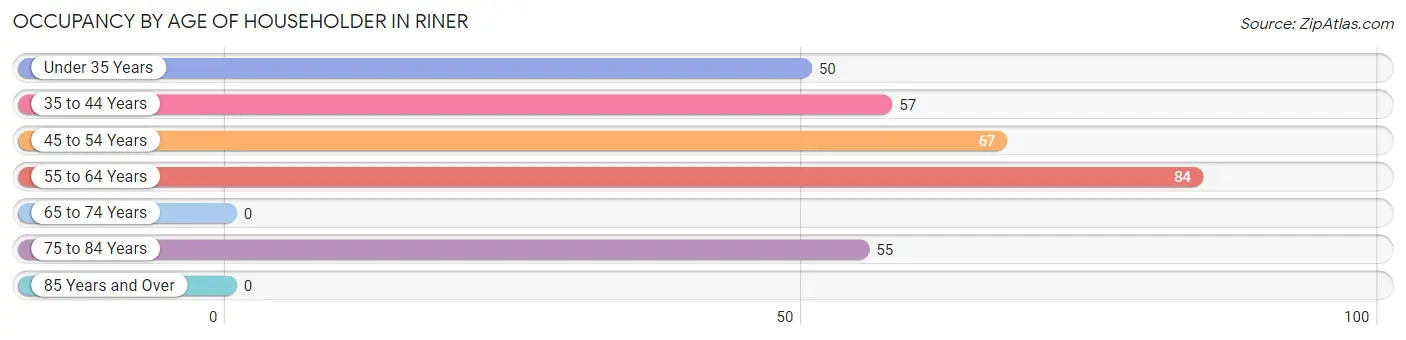
| Age Bracket | # Households | % Households |
| Under 35 Years | 50 | 16.0% |
| 35 to 44 Years | 57 | 18.2% |
| 45 to 54 Years | 67 | 21.4% |
| 55 to 64 Years | 84 | 26.8% |
| 65 to 74 Years | 0 | 0.0% |
| 75 to 84 Years | 55 | 17.6% |
| 85 Years and Over | 0 | 0.0% |
| Total | 313 | 100.0% |
Housing Finances in Riner
Median Income by Occupancy in Riner
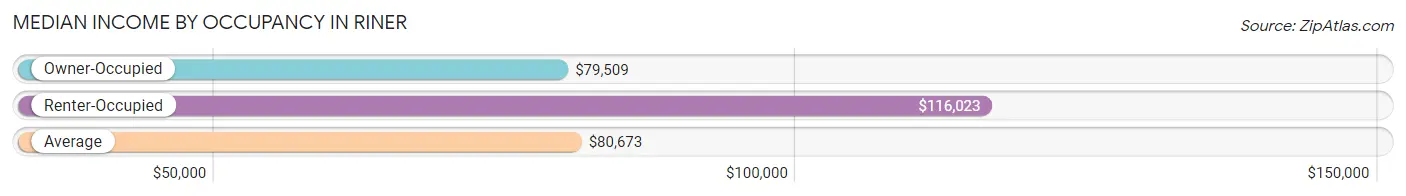
| Occupancy Type | # Households | Median Income |
| Owner-Occupied | 259 (82.8%) | $79,509 |
| Renter-Occupied | 54 (17.2%) | $116,023 |
| Average | 313 (100.0%) | $80,673 |
Occupancy by Householder Income Bracket in Riner
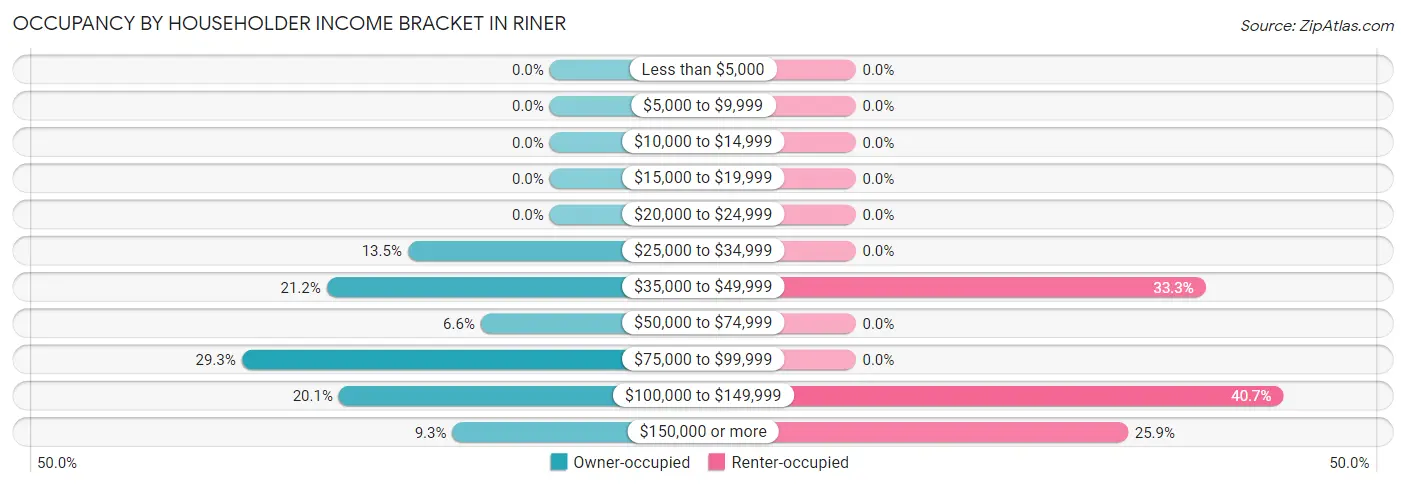
| Income Bracket | Owner-occupied | Renter-occupied |
| Less than $5,000 | 0 (0.0%) | 0 (0.0%) |
| $5,000 to $9,999 | 0 (0.0%) | 0 (0.0%) |
| $10,000 to $14,999 | 0 (0.0%) | 0 (0.0%) |
| $15,000 to $19,999 | 0 (0.0%) | 0 (0.0%) |
| $20,000 to $24,999 | 0 (0.0%) | 0 (0.0%) |
| $25,000 to $34,999 | 35 (13.5%) | 0 (0.0%) |
| $35,000 to $49,999 | 55 (21.2%) | 18 (33.3%) |
| $50,000 to $74,999 | 17 (6.6%) | 0 (0.0%) |
| $75,000 to $99,999 | 76 (29.3%) | 0 (0.0%) |
| $100,000 to $149,999 | 52 (20.1%) | 22 (40.7%) |
| $150,000 or more | 24 (9.3%) | 14 (25.9%) |
| Total | 259 (100.0%) | 54 (100.0%) |
Monthly Housing Cost Tiers in Riner
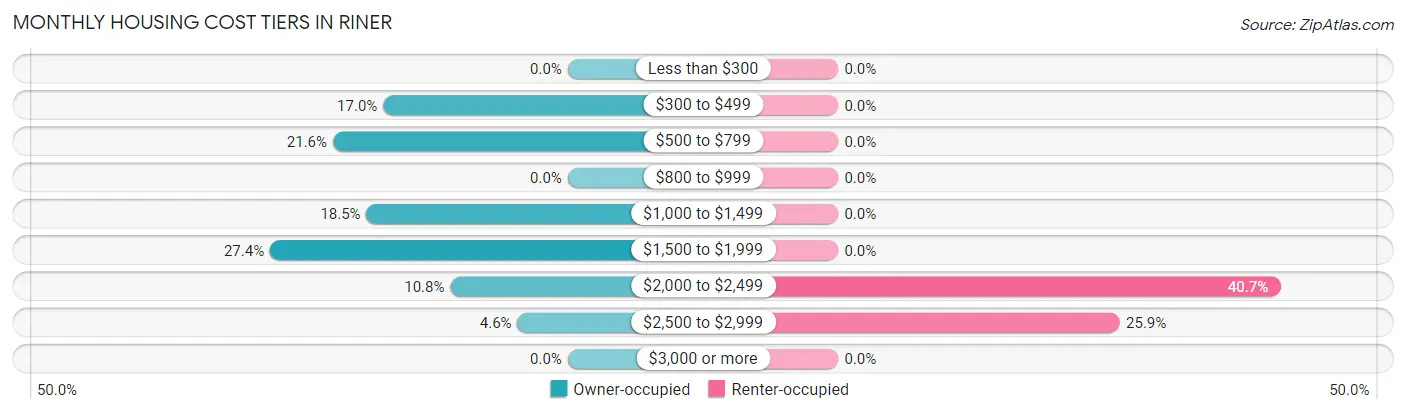
| Monthly Cost | Owner-occupied | Renter-occupied |
| Less than $300 | 0 (0.0%) | 0 (0.0%) |
| $300 to $499 | 44 (17.0%) | 0 (0.0%) |
| $500 to $799 | 56 (21.6%) | 0 (0.0%) |
| $800 to $999 | 0 (0.0%) | 0 (0.0%) |
| $1,000 to $1,499 | 48 (18.5%) | 0 (0.0%) |
| $1,500 to $1,999 | 71 (27.4%) | 0 (0.0%) |
| $2,000 to $2,499 | 28 (10.8%) | 22 (40.7%) |
| $2,500 to $2,999 | 12 (4.6%) | 14 (25.9%) |
| $3,000 or more | 0 (0.0%) | 0 (0.0%) |
| Total | 259 (100.0%) | 54 (100.0%) |
Physical Housing Characteristics in Riner
Housing Structures in Riner
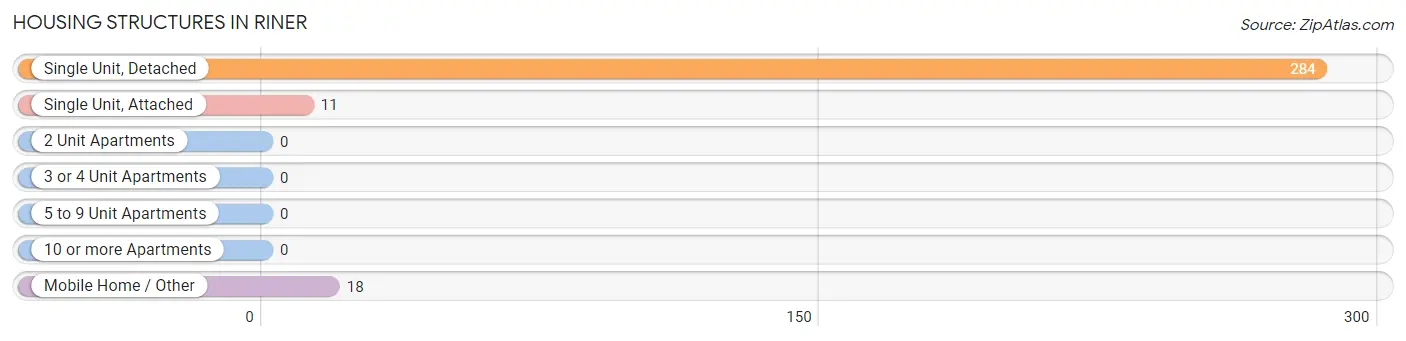
| Structure Type | # Housing Units | % Housing Units |
| Single Unit, Detached | 284 | 90.7% |
| Single Unit, Attached | 11 | 3.5% |
| 2 Unit Apartments | 0 | 0.0% |
| 3 or 4 Unit Apartments | 0 | 0.0% |
| 5 to 9 Unit Apartments | 0 | 0.0% |
| 10 or more Apartments | 0 | 0.0% |
| Mobile Home / Other | 18 | 5.8% |
| Total | 313 | 100.0% |
Housing Structures by Occupancy in Riner
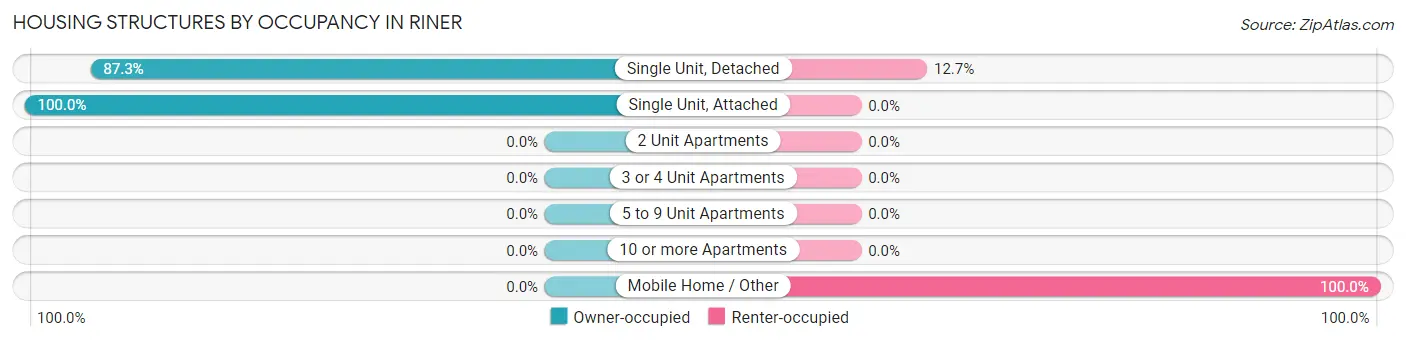
| Structure Type | Owner-occupied | Renter-occupied |
| Single Unit, Detached | 248 (87.3%) | 36 (12.7%) |
| Single Unit, Attached | 11 (100.0%) | 0 (0.0%) |
| 2 Unit Apartments | 0 (0.0%) | 0 (0.0%) |
| 3 or 4 Unit Apartments | 0 (0.0%) | 0 (0.0%) |
| 5 to 9 Unit Apartments | 0 (0.0%) | 0 (0.0%) |
| 10 or more Apartments | 0 (0.0%) | 0 (0.0%) |
| Mobile Home / Other | 0 (0.0%) | 18 (100.0%) |
| Total | 259 (82.8%) | 54 (17.2%) |
Housing Structures by Number of Rooms in Riner
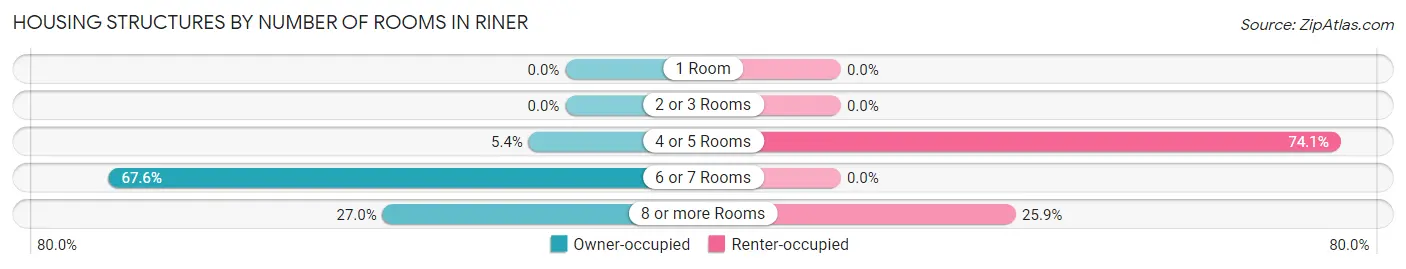
| Number of Rooms | Owner-occupied | Renter-occupied |
| 1 Room | 0 (0.0%) | 0 (0.0%) |
| 2 or 3 Rooms | 0 (0.0%) | 0 (0.0%) |
| 4 or 5 Rooms | 14 (5.4%) | 40 (74.1%) |
| 6 or 7 Rooms | 175 (67.6%) | 0 (0.0%) |
| 8 or more Rooms | 70 (27.0%) | 14 (25.9%) |
| Total | 259 (100.0%) | 54 (100.0%) |
Housing Structure by Heating Type in Riner
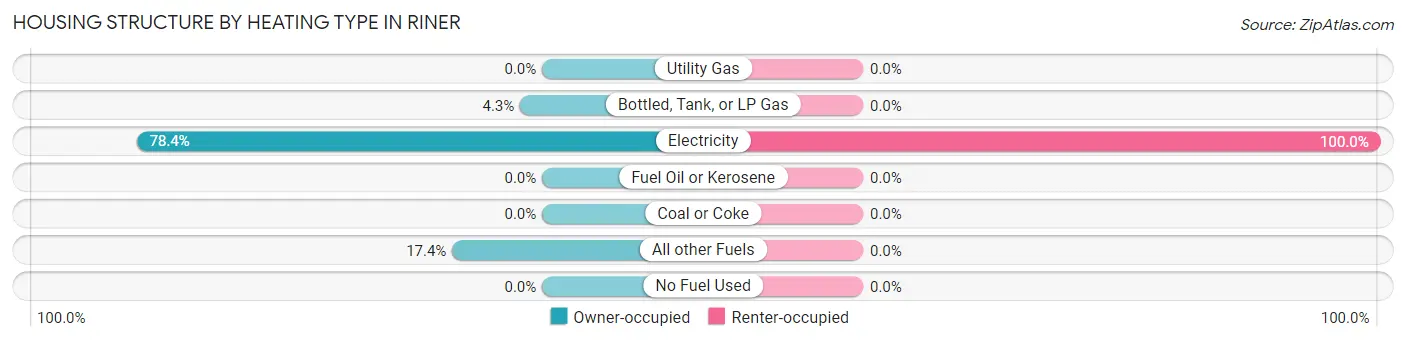
| Heating Type | Owner-occupied | Renter-occupied |
| Utility Gas | 0 (0.0%) | 0 (0.0%) |
| Bottled, Tank, or LP Gas | 11 (4.3%) | 0 (0.0%) |
| Electricity | 203 (78.4%) | 54 (100.0%) |
| Fuel Oil or Kerosene | 0 (0.0%) | 0 (0.0%) |
| Coal or Coke | 0 (0.0%) | 0 (0.0%) |
| All other Fuels | 45 (17.4%) | 0 (0.0%) |
| No Fuel Used | 0 (0.0%) | 0 (0.0%) |
| Total | 259 (100.0%) | 54 (100.0%) |
Household Vehicle Usage in Riner
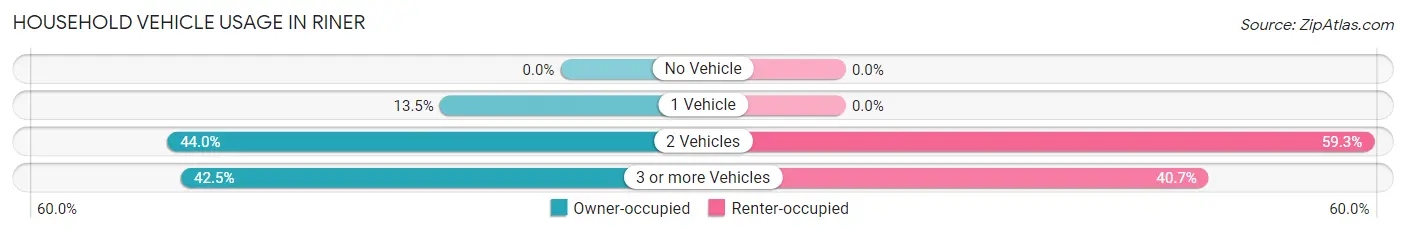
| Vehicles per Household | Owner-occupied | Renter-occupied |
| No Vehicle | 0 (0.0%) | 0 (0.0%) |
| 1 Vehicle | 35 (13.5%) | 0 (0.0%) |
| 2 Vehicles | 114 (44.0%) | 32 (59.3%) |
| 3 or more Vehicles | 110 (42.5%) | 22 (40.7%) |
| Total | 259 (100.0%) | 54 (100.0%) |
Real Estate & Mortgages in Riner
Real Estate and Mortgage Overview in Riner
| Characteristic | Without Mortgage | With Mortgage |
| Housing Units | 85 | 174 |
| Median Property Value | $352,000 | $311,800 |
| Median Household Income | $42,303 | $24 |
| Monthly Housing Costs | $497 | $0 |
| Real Estate Taxes | $2,181 | $0 |
Property Value by Mortgage Status in Riner
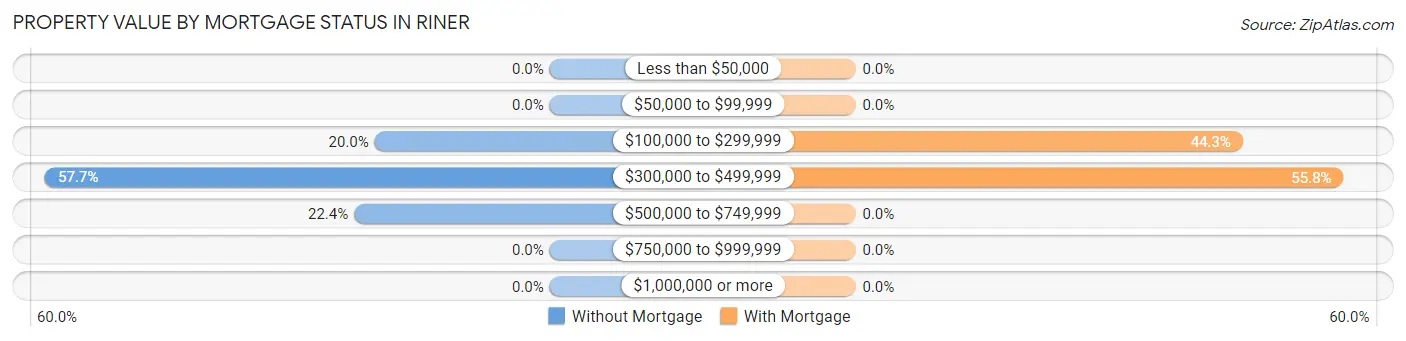
| Property Value | Without Mortgage | With Mortgage |
| Less than $50,000 | 0 (0.0%) | 0 (0.0%) |
| $50,000 to $99,999 | 0 (0.0%) | 0 (0.0%) |
| $100,000 to $299,999 | 17 (20.0%) | 77 (44.3%) |
| $300,000 to $499,999 | 49 (57.7%) | 97 (55.7%) |
| $500,000 to $749,999 | 19 (22.4%) | 0 (0.0%) |
| $750,000 to $999,999 | 0 (0.0%) | 0 (0.0%) |
| $1,000,000 or more | 0 (0.0%) | 0 (0.0%) |
| Total | 85 (100.0%) | 174 (100.0%) |
Household Income by Mortgage Status in Riner
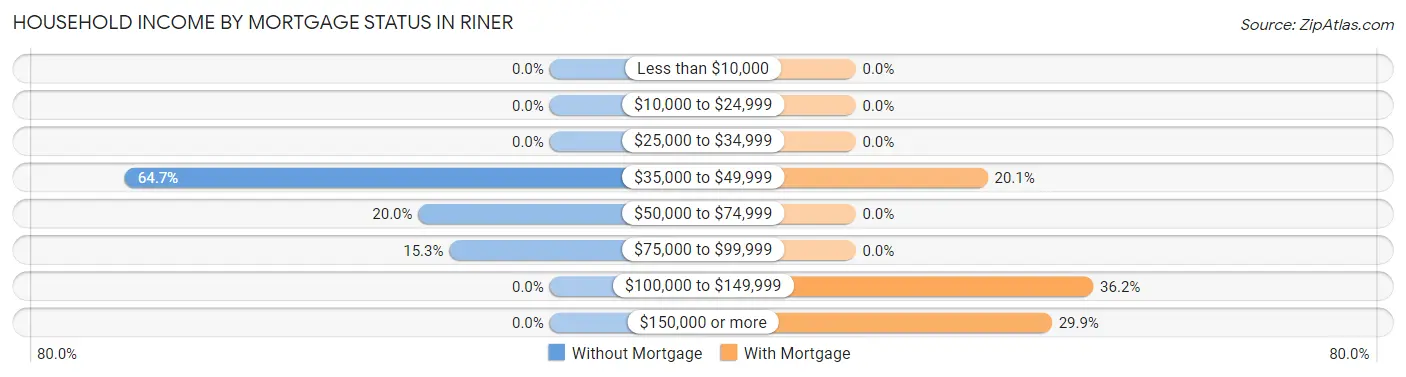
| Household Income | Without Mortgage | With Mortgage |
| Less than $10,000 | 0 (0.0%) | 0 (0.0%) |
| $10,000 to $24,999 | 0 (0.0%) | 0 (0.0%) |
| $25,000 to $34,999 | 0 (0.0%) | 0 (0.0%) |
| $35,000 to $49,999 | 55 (64.7%) | 35 (20.1%) |
| $50,000 to $74,999 | 17 (20.0%) | 0 (0.0%) |
| $75,000 to $99,999 | 13 (15.3%) | 0 (0.0%) |
| $100,000 to $149,999 | 0 (0.0%) | 63 (36.2%) |
| $150,000 or more | 0 (0.0%) | 52 (29.9%) |
| Total | 85 (100.0%) | 174 (100.0%) |
Property Value to Household Income Ratio in Riner
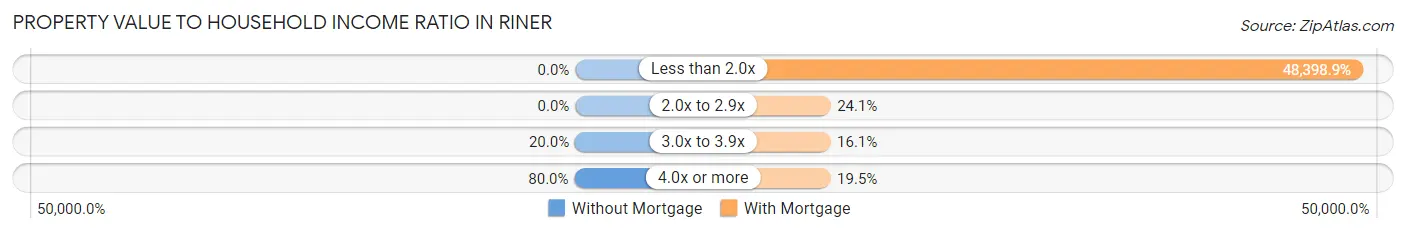
| Value-to-Income Ratio | Without Mortgage | With Mortgage |
| Less than 2.0x | 0 (0.0%) | 84,214 (48,398.8%) |
| 2.0x to 2.9x | 0 (0.0%) | 42 (24.1%) |
| 3.0x to 3.9x | 17 (20.0%) | 28 (16.1%) |
| 4.0x or more | 68 (80.0%) | 34 (19.5%) |
| Total | 85 (100.0%) | 174 (100.0%) |
Real Estate Taxes by Mortgage Status in Riner
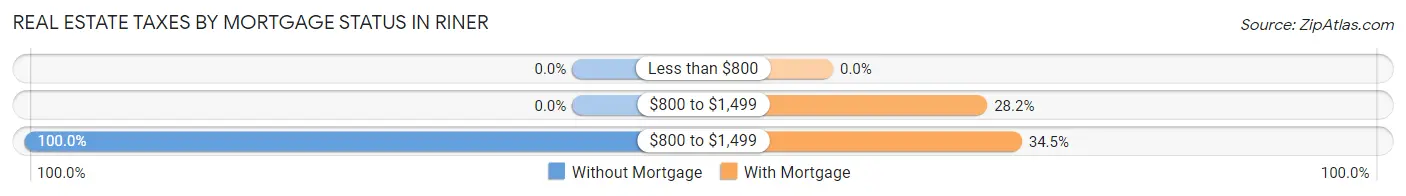
| Property Taxes | Without Mortgage | With Mortgage |
| Less than $800 | 0 (0.0%) | 0 (0.0%) |
| $800 to $1,499 | 0 (0.0%) | 49 (28.2%) |
| $800 to $1,499 | 85 (100.0%) | 60 (34.5%) |
| Total | 85 (100.0%) | 174 (100.0%) |
Health & Disability in Riner
Health Insurance Coverage by Age in Riner
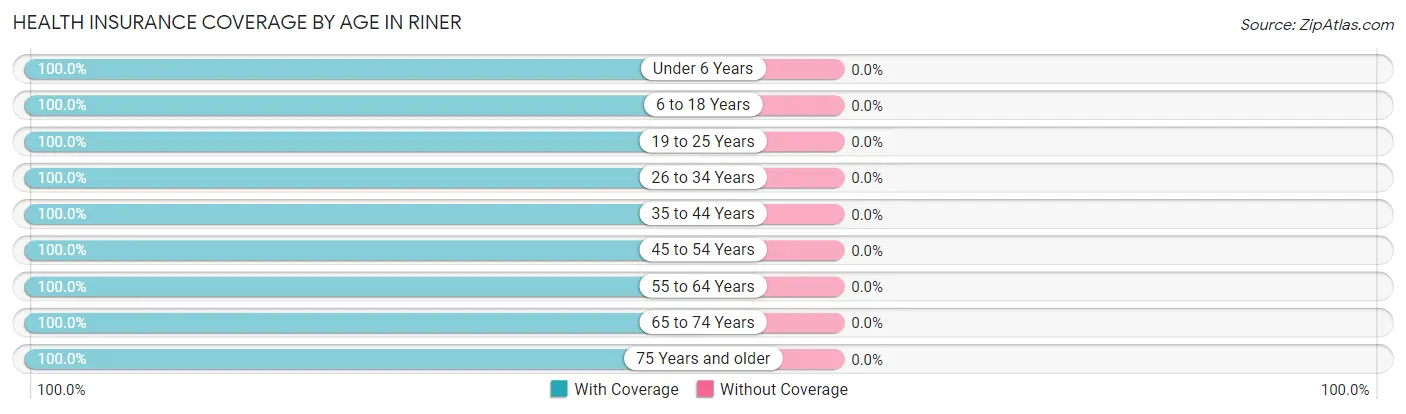
| Age Bracket | With Coverage | Without Coverage |
| Under 6 Years | 177 (100.0%) | 0 (0.0%) |
| 6 to 18 Years | 66 (100.0%) | 0 (0.0%) |
| 19 to 25 Years | 59 (100.0%) | 0 (0.0%) |
| 26 to 34 Years | 106 (100.0%) | 0 (0.0%) |
| 35 to 44 Years | 141 (100.0%) | 0 (0.0%) |
| 45 to 54 Years | 160 (100.0%) | 0 (0.0%) |
| 55 to 64 Years | 160 (100.0%) | 0 (0.0%) |
| 65 to 74 Years | 10 (100.0%) | 0 (0.0%) |
| 75 Years and older | 74 (100.0%) | 0 (0.0%) |
| Total | 953 (100.0%) | 0 (0.0%) |
Health Insurance Coverage by Citizenship Status in Riner
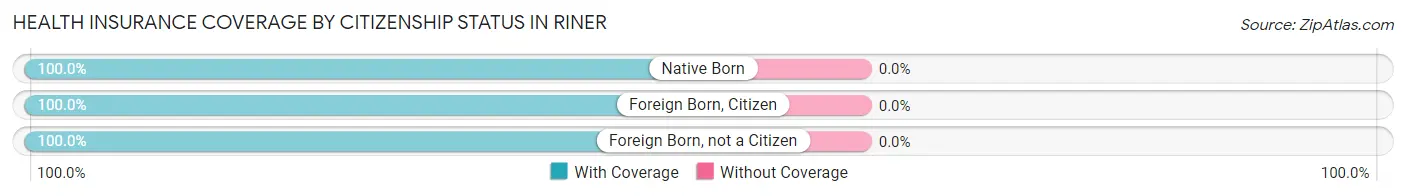
| Citizenship Status | With Coverage | Without Coverage |
| Native Born | 177 (100.0%) | 0 (0.0%) |
| Foreign Born, Citizen | 66 (100.0%) | 0 (0.0%) |
| Foreign Born, not a Citizen | 59 (100.0%) | 0 (0.0%) |
Health Insurance Coverage by Household Income in Riner
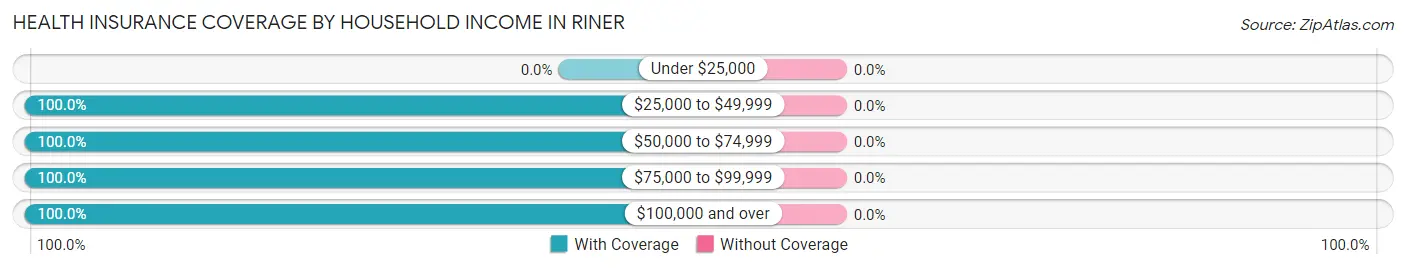
| Household Income | With Coverage | Without Coverage |
| Under $25,000 | 0 (0.0%) | 0 (0.0%) |
| $25,000 to $49,999 | 232 (100.0%) | 0 (0.0%) |
| $50,000 to $74,999 | 36 (100.0%) | 0 (0.0%) |
| $75,000 to $99,999 | 217 (100.0%) | 0 (0.0%) |
| $100,000 and over | 468 (100.0%) | 0 (0.0%) |
Public vs Private Health Insurance Coverage by Age in Riner
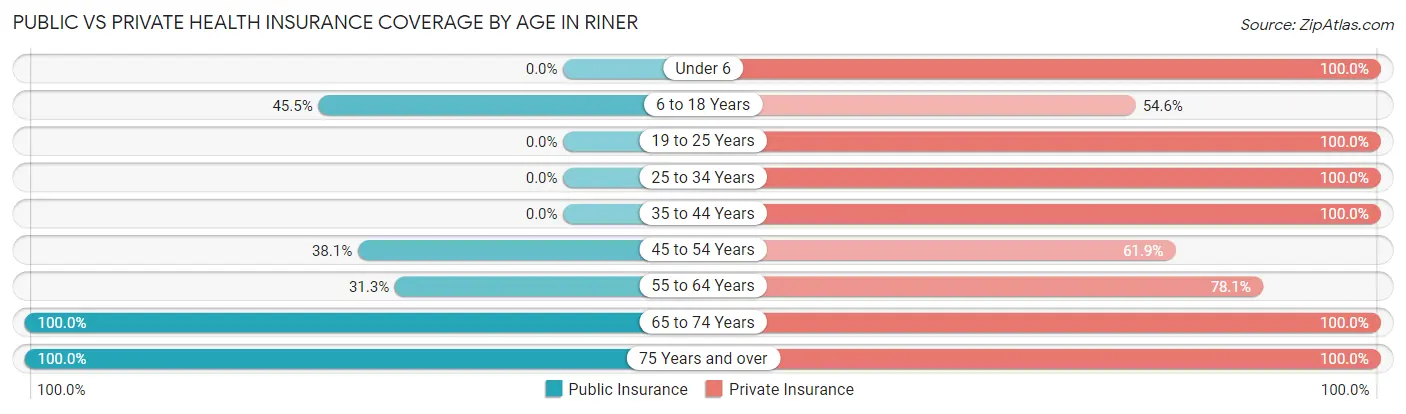
| Age Bracket | Public Insurance | Private Insurance |
| Under 6 | 0 (0.0%) | 177 (100.0%) |
| 6 to 18 Years | 30 (45.5%) | 36 (54.5%) |
| 19 to 25 Years | 0 (0.0%) | 59 (100.0%) |
| 25 to 34 Years | 0 (0.0%) | 106 (100.0%) |
| 35 to 44 Years | 0 (0.0%) | 141 (100.0%) |
| 45 to 54 Years | 61 (38.1%) | 99 (61.9%) |
| 55 to 64 Years | 50 (31.2%) | 125 (78.1%) |
| 65 to 74 Years | 10 (100.0%) | 10 (100.0%) |
| 75 Years and over | 74 (100.0%) | 74 (100.0%) |
| Total | 225 (23.6%) | 827 (86.8%) |
Disability Status by Sex by Age in Riner
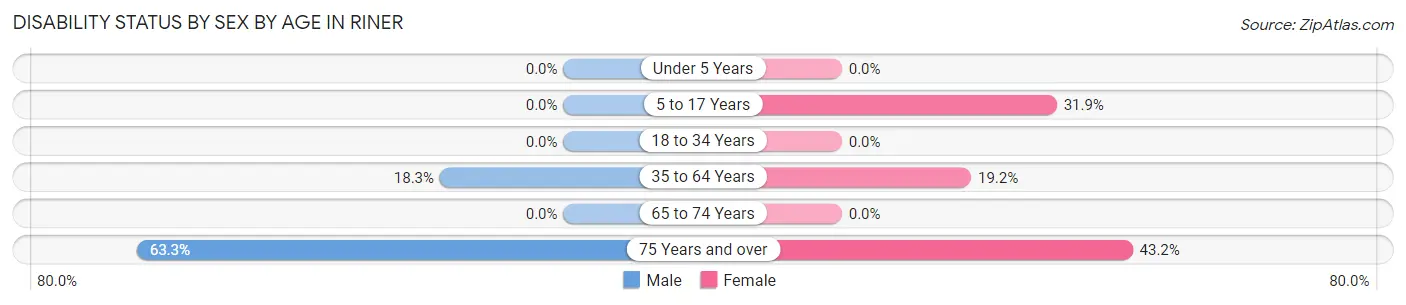
| Age Bracket | Male | Female |
| Under 5 Years | 0 (0.0%) | 0 (0.0%) |
| 5 to 17 Years | 0 (0.0%) | 30 (31.9%) |
| 18 to 34 Years | 0 (0.0%) | 0 (0.0%) |
| 35 to 64 Years | 53 (18.3%) | 33 (19.2%) |
| 65 to 74 Years | 0 (0.0%) | 0 (0.0%) |
| 75 Years and over | 19 (63.3%) | 19 (43.2%) |
Disability Class by Sex by Age in Riner
Disability Class: Hearing Difficulty
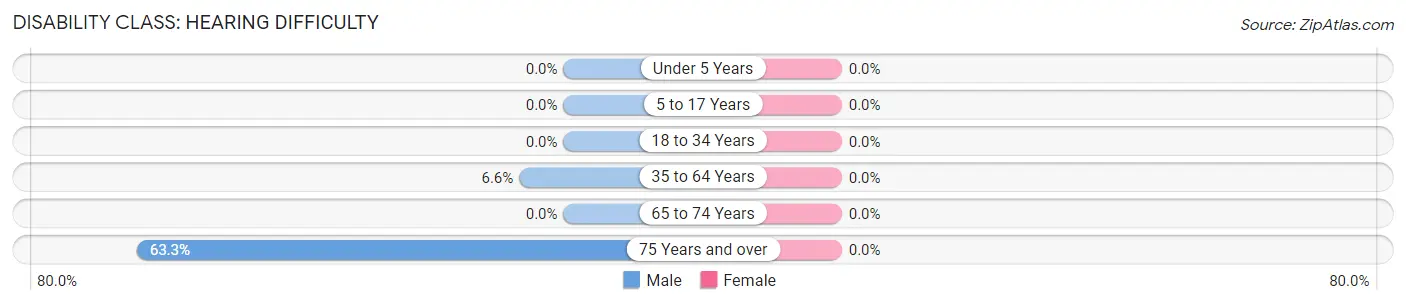
| Age Bracket | Male | Female |
| Under 5 Years | 0 (0.0%) | 0 (0.0%) |
| 5 to 17 Years | 0 (0.0%) | 0 (0.0%) |
| 18 to 34 Years | 0 (0.0%) | 0 (0.0%) |
| 35 to 64 Years | 19 (6.6%) | 0 (0.0%) |
| 65 to 74 Years | 0 (0.0%) | 0 (0.0%) |
| 75 Years and over | 19 (63.3%) | 0 (0.0%) |
Disability Class: Vision Difficulty
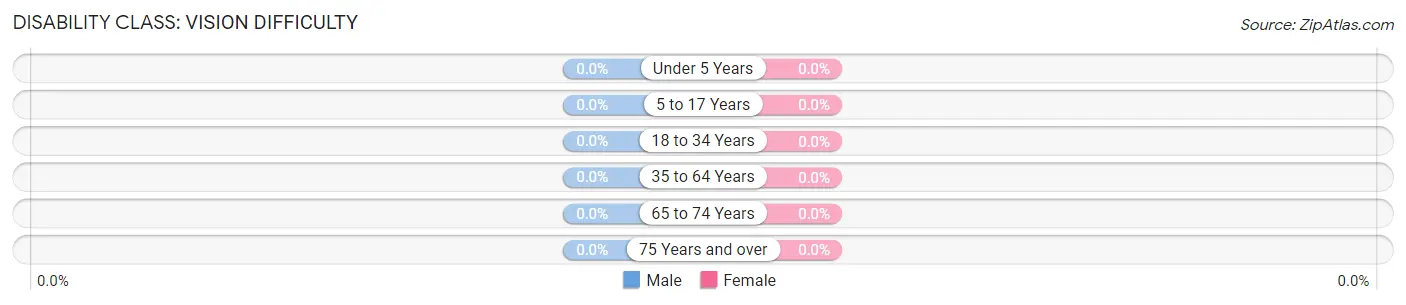
| Age Bracket | Male | Female |
| Under 5 Years | 0 (0.0%) | 0 (0.0%) |
| 5 to 17 Years | 0 (0.0%) | 0 (0.0%) |
| 18 to 34 Years | 0 (0.0%) | 0 (0.0%) |
| 35 to 64 Years | 0 (0.0%) | 0 (0.0%) |
| 65 to 74 Years | 0 (0.0%) | 0 (0.0%) |
| 75 Years and over | 0 (0.0%) | 0 (0.0%) |
Disability Class: Cognitive Difficulty
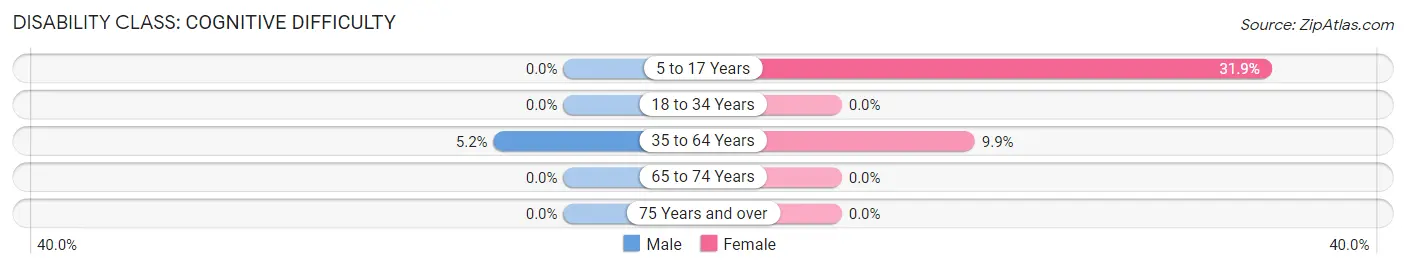
| Age Bracket | Male | Female |
| 5 to 17 Years | 0 (0.0%) | 30 (31.9%) |
| 18 to 34 Years | 0 (0.0%) | 0 (0.0%) |
| 35 to 64 Years | 15 (5.2%) | 17 (9.9%) |
| 65 to 74 Years | 0 (0.0%) | 0 (0.0%) |
| 75 Years and over | 0 (0.0%) | 0 (0.0%) |
Disability Class: Ambulatory Difficulty
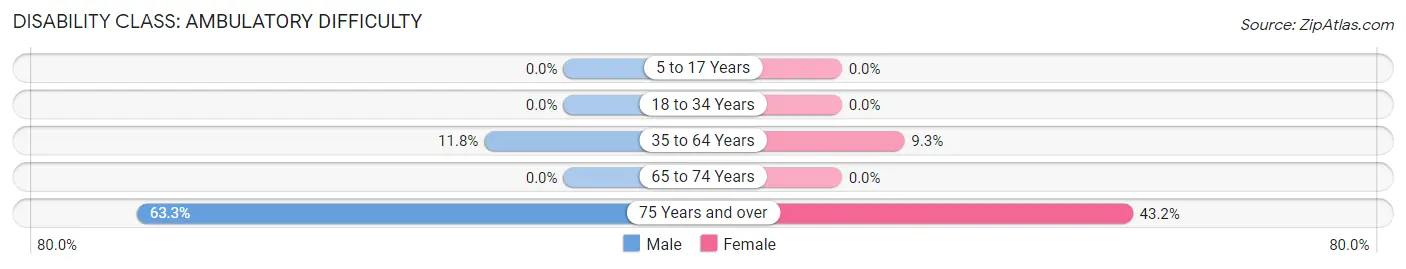
| Age Bracket | Male | Female |
| 5 to 17 Years | 0 (0.0%) | 0 (0.0%) |
| 18 to 34 Years | 0 (0.0%) | 0 (0.0%) |
| 35 to 64 Years | 34 (11.8%) | 16 (9.3%) |
| 65 to 74 Years | 0 (0.0%) | 0 (0.0%) |
| 75 Years and over | 19 (63.3%) | 19 (43.2%) |
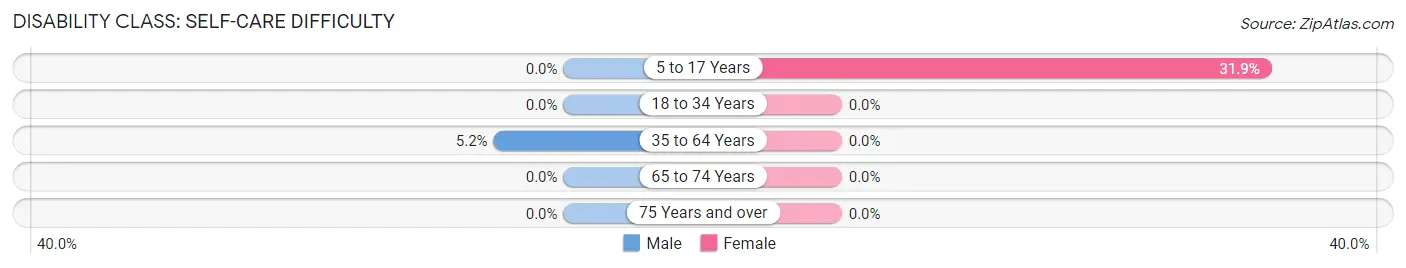
Disability Class: Self-Care Difficulty
| Age Bracket | Male | Female |
| 5 to 17 Years | 0 (0.0%) | 30 (31.9%) |
| 18 to 34 Years | 0 (0.0%) | 0 (0.0%) |
| 35 to 64 Years | 15 (5.2%) | 0 (0.0%) |
| 65 to 74 Years | 0 (0.0%) | 0 (0.0%) |
| 75 Years and over | 0 (0.0%) | 0 (0.0%) |
Technology Access in Riner
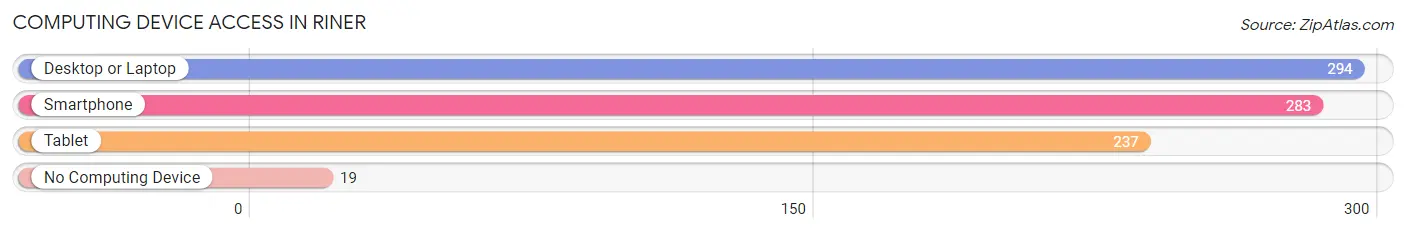
Computing Device Access in Riner
| Device Type | # Households | % Households |
| Desktop or Laptop | 294 | 93.9% |
| Smartphone | 283 | 90.4% |
| Tablet | 237 | 75.7% |
| No Computing Device | 19 | 6.1% |
| Total | 313 | 100.0% |
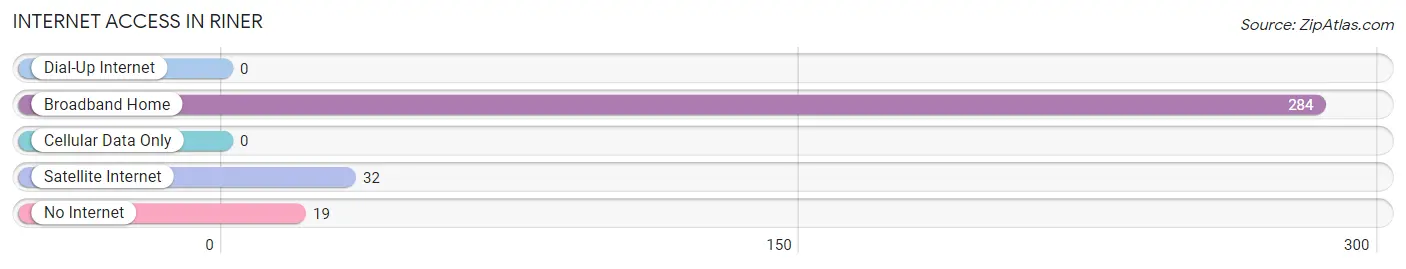
Internet Access in Riner
| Internet Type | # Households | % Households |
| Dial-Up Internet | 0 | 0.0% |
| Broadband Home | 284 | 90.7% |
| Cellular Data Only | 0 | 0.0% |
| Satellite Internet | 32 | 10.2% |
| No Internet | 19 | 6.1% |
| Total | 313 | 100.0% |
Riner Summary
Riner is an unincorporated community located in Montgomery County, Virginia. It is situated in the New River Valley, a region of the Appalachian Mountains. The community is located along the banks of the New River, and is home to approximately 1,000 people.
History
Riner was first settled in the late 1700s by a group of settlers from North Carolina. The community was originally known as “Riner’s Station”, named after the family who owned the land. The Riner family was one of the first families to settle in the area, and their descendants still live in the community today.
In the early 1800s, the community was a stop on the stagecoach route between Christiansburg and Wytheville. The stagecoach route was used to transport goods and passengers between the two towns.
In the late 1800s, the railroad was built through the area, connecting Riner to the larger cities of Roanoke and Radford. This allowed for increased trade and commerce in the area, and helped to spur the growth of the community.
Geography
Riner is located in the New River Valley, a region of the Appalachian Mountains. The community is situated along the banks of the New River, and is surrounded by rolling hills and lush forests. The climate in the area is mild, with temperatures ranging from the mid-30s in the winter to the mid-80s in the summer.
The area is home to a variety of wildlife, including deer, turkey, and black bear. The New River is also home to a variety of fish, including bass, catfish, and sunfish.
Economy
The economy of Riner is largely based on agriculture and tourism. The area is home to several farms, which produce a variety of crops, including corn, soybeans, and hay. The area is also home to several wineries, which produce a variety of wines.
Tourism is also an important part of the local economy. The area is home to several outdoor recreation areas, including the New River Trail State Park and the Claytor Lake State Park. These parks offer a variety of activities, including hiking, camping, fishing, and boating.
Demographics
As of the 2010 census, the population of Riner was 1,000. The racial makeup of the community was 97.2% White, 0.7% African American, 0.3% Native American, 0.3% Asian, and 1.5% from other races. The median household income was $37,500, and the median age was 41.
Riner is a small, rural community with a strong sense of community. The area is home to a variety of churches, and the community is served by several local businesses, including a grocery store, a hardware store, and a gas station. The area is also home to several schools, including Riner Elementary School and Riner High School.
Common Questions
What is Per Capita Income in Riner?
Per Capita income in Riner is $34,317.
What is the Median Family Income in Riner?
Median Family Income in Riner is $82,714.
What is the Median Household income in Riner?
Median Household Income in Riner is $80,673.
What is Inequality or Gini Index in Riner?
Inequality or Gini Index in Riner is 0.29.
What is the Total Population of Riner?
Total Population of Riner is 953.
What is the Total Male Population of Riner?
Total Male Population of Riner is 426.
What is the Total Female Population of Riner?
Total Female Population of Riner is 527.
What is the Ratio of Males per 100 Females in Riner?
There are 80.83 Males per 100 Females in Riner.
What is the Ratio of Females per 100 Males in Riner?
There are 123.71 Females per 100 Males in Riner.
What is the Median Population Age in Riner?
Median Population Age in Riner is 43.2 Years.
What is the Average Family Size in Riner
Average Family Size in Riner is 3.0 People.
What is the Average Household Size in Riner
Average Household Size in Riner is 3.0 People.
How Large is the Labor Force in Riner?
There are 434 People in the Labor Forcein in Riner.
What is the Percentage of People in the Labor Force in Riner?
58.6% of People are in the Labor Force in Riner.