Remington, VA Map & Demographics
Remington Map
Remington Overview
$33,772
PER CAPITA INCOME
$68,750
AVG FAMILY INCOME
$60,952
AVG HOUSEHOLD INCOME
10.2%
WAGE / INCOME GAP [ % ]
89.8¢/ $1
WAGE / INCOME GAP [ $ ]
0.47
INEQUALITY / GINI INDEX
836
TOTAL POPULATION
423
MALE POPULATION
413
FEMALE POPULATION
102.42
MALES / 100 FEMALES
97.64
FEMALES / 100 MALES
29.1
MEDIAN AGE
3.6
AVG FAMILY SIZE
2.8
AVG HOUSEHOLD SIZE
448
LABOR FORCE [ PEOPLE ]
78.7%
PERCENT IN LABOR FORCE
4.7%
UNEMPLOYMENT RATE
Remington Zip Codes
Remington Area Codes
Income in Remington
Income Overview in Remington
Per Capita Income in Remington is $33,772, while median incomes of families and households are $68,750 and $60,952 respectively.
| Characteristic | Number | Measure |
| Per Capita Income | 836 | $33,772 |
| Median Family Income | 184 | $68,750 |
| Mean Family Income | 184 | $102,446 |
| Median Household Income | 302 | $60,952 |
| Mean Household Income | 302 | $90,070 |
| Income Deficit | 184 | $0 |
| Wage / Income Gap (%) | 836 | 10.15% |
| Wage / Income Gap ($) | 836 | 89.85¢ per $1 |
| Gini / Inequality Index | 836 | 0.47 |
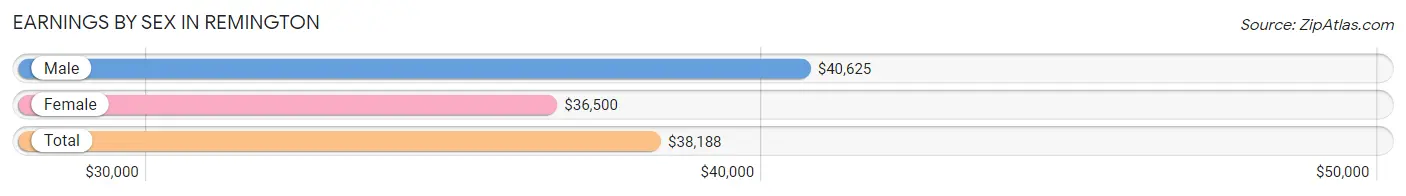
Earnings by Sex in Remington
Average Earnings in Remington are $38,188, $40,625 for men and $36,500 for women, a difference of 10.2%.
| Sex | Number | Average Earnings |
| Male | 237 (51.6%) | $40,625 |
| Female | 222 (48.4%) | $36,500 |
| Total | 459 (100.0%) | $38,188 |
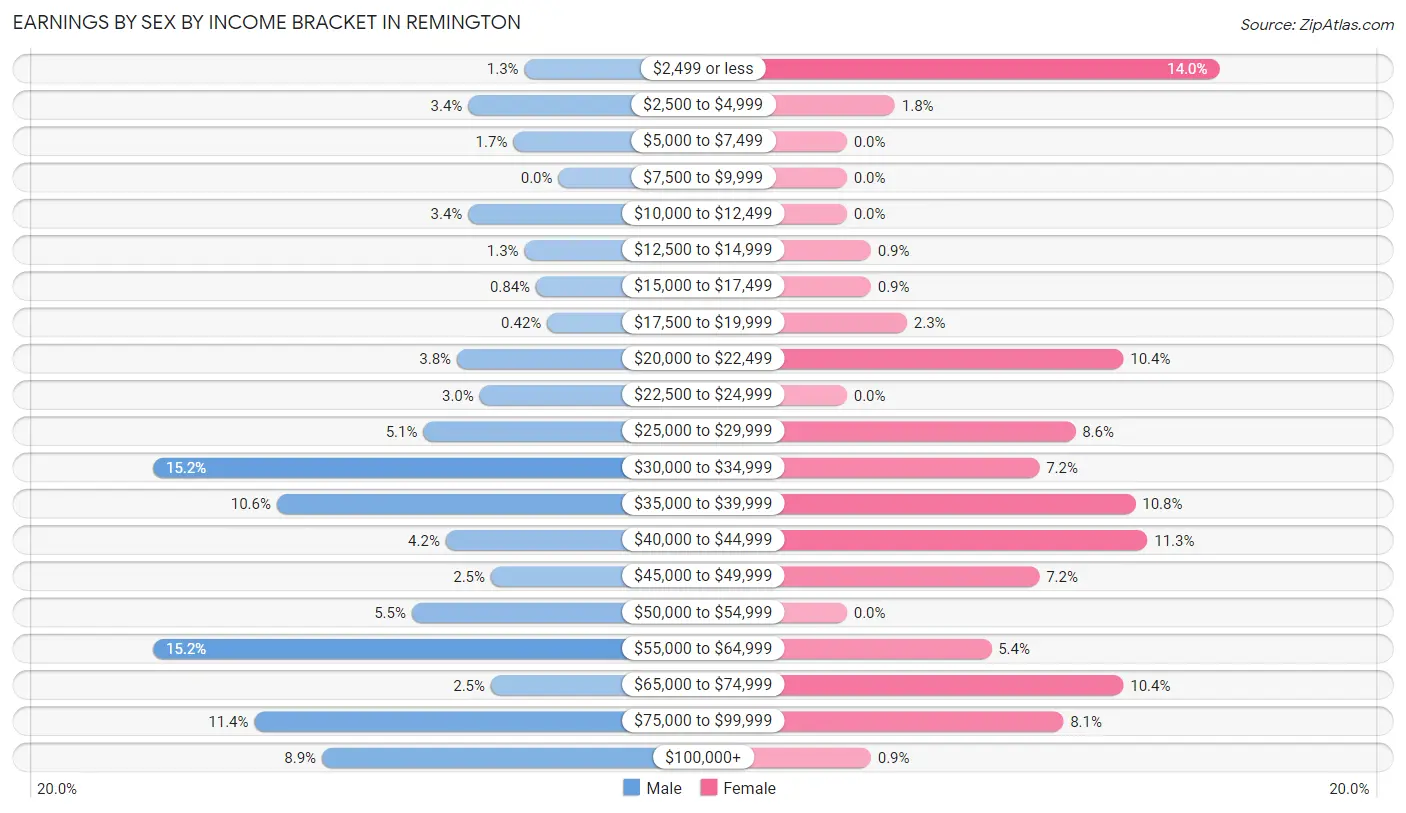
Earnings by Sex by Income Bracket in Remington
The most common earnings brackets in Remington are $30,000 to $34,999 for men (36 | 15.2%) and $2,499 or less for women (31 | 14.0%).
| Income | Male | Female |
| $2,499 or less | 3 (1.3%) | 31 (14.0%) |
| $2,500 to $4,999 | 8 (3.4%) | 4 (1.8%) |
| $5,000 to $7,499 | 4 (1.7%) | 0 (0.0%) |
| $7,500 to $9,999 | 0 (0.0%) | 0 (0.0%) |
| $10,000 to $12,499 | 8 (3.4%) | 0 (0.0%) |
| $12,500 to $14,999 | 3 (1.3%) | 2 (0.9%) |
| $15,000 to $17,499 | 2 (0.8%) | 2 (0.9%) |
| $17,500 to $19,999 | 1 (0.4%) | 5 (2.2%) |
| $20,000 to $22,499 | 9 (3.8%) | 23 (10.4%) |
| $22,500 to $24,999 | 7 (2.9%) | 0 (0.0%) |
| $25,000 to $29,999 | 12 (5.1%) | 19 (8.6%) |
| $30,000 to $34,999 | 36 (15.2%) | 16 (7.2%) |
| $35,000 to $39,999 | 25 (10.5%) | 24 (10.8%) |
| $40,000 to $44,999 | 10 (4.2%) | 25 (11.3%) |
| $45,000 to $49,999 | 6 (2.5%) | 16 (7.2%) |
| $50,000 to $54,999 | 13 (5.5%) | 0 (0.0%) |
| $55,000 to $64,999 | 36 (15.2%) | 12 (5.4%) |
| $65,000 to $74,999 | 6 (2.5%) | 23 (10.4%) |
| $75,000 to $99,999 | 27 (11.4%) | 18 (8.1%) |
| $100,000+ | 21 (8.9%) | 2 (0.9%) |
| Total | 237 (100.0%) | 222 (100.0%) |
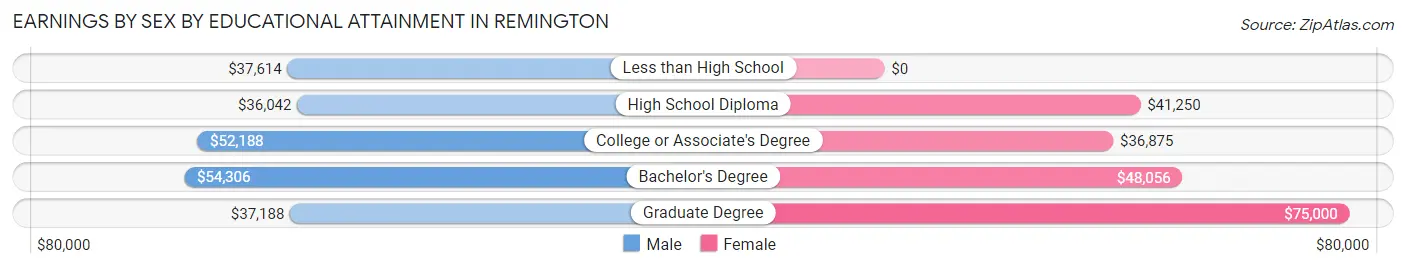
Earnings by Sex by Educational Attainment in Remington
Average earnings in Remington are $44,063 for men and $38,750 for women, a difference of 12.1%. Men with an educational attainment of bachelor's degree enjoy the highest average annual earnings of $54,306, while those with high school diploma education earn the least with $36,042. Women with an educational attainment of graduate degree earn the most with the average annual earnings of $75,000, while those with college or associate's degree education have the smallest earnings of $36,875.
| Educational Attainment | Male Income | Female Income |
| Less than High School | $37,614 | $0 |
| High School Diploma | $36,042 | $41,250 |
| College or Associate's Degree | $52,188 | $36,875 |
| Bachelor's Degree | $54,306 | $48,056 |
| Graduate Degree | $37,188 | $75,000 |
| Total | $44,063 | $38,750 |
Family Income in Remington
Family Income Brackets in Remington
According to the Remington family income data, there are 50 families falling into the $35,000 to $49,999 income range, which is the most common income bracket and makes up 27.2% of all families. Conversely, the less than $10,000 income bracket is the least frequent group with only 2 families (1.1%) belonging to this category.
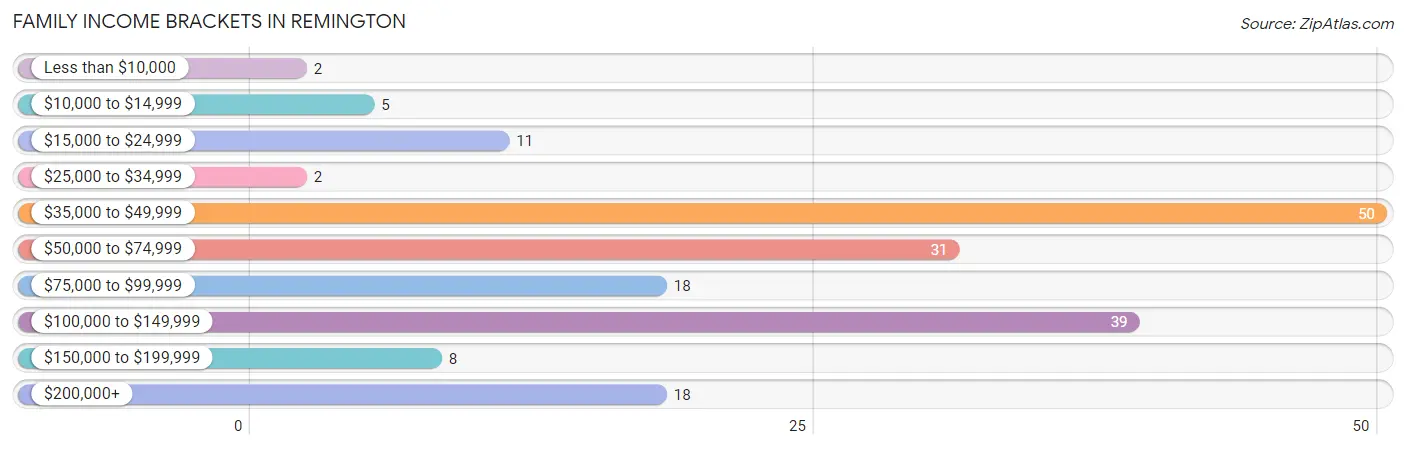
| Income Bracket | # Families | % Families |
| Less than $10,000 | 2 | 1.1% |
| $10,000 to $14,999 | 5 | 2.7% |
| $15,000 to $24,999 | 11 | 6.0% |
| $25,000 to $34,999 | 2 | 1.1% |
| $35,000 to $49,999 | 50 | 27.2% |
| $50,000 to $74,999 | 31 | 16.8% |
| $75,000 to $99,999 | 18 | 9.8% |
| $100,000 to $149,999 | 39 | 21.2% |
| $150,000 to $199,999 | 8 | 4.3% |
| $200,000+ | 18 | 9.8% |
Family Income by Famaliy Size in Remington
2-person families (77 | 41.8%) account for the highest median family income in Remington with $84,028 per family, while 2-person families (77 | 41.8%) have the highest median income of $42,014 per family member.
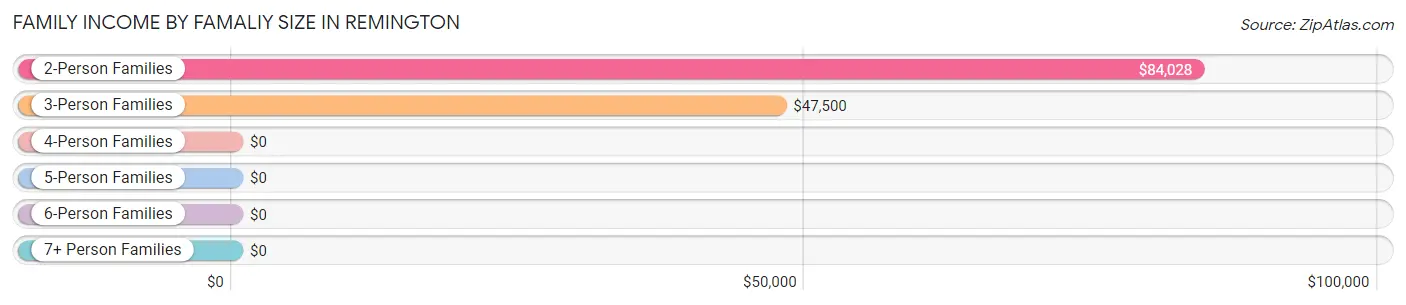
| Income Bracket | # Families | Median Income |
| 2-Person Families | 77 (41.8%) | $84,028 |
| 3-Person Families | 46 (25.0%) | $47,500 |
| 4-Person Families | 33 (17.9%) | $0 |
| 5-Person Families | 14 (7.6%) | $0 |
| 6-Person Families | 14 (7.6%) | $0 |
| 7+ Person Families | 0 (0.0%) | $0 |
| Total | 184 (100.0%) | $68,750 |
Family Income by Number of Earners in Remington
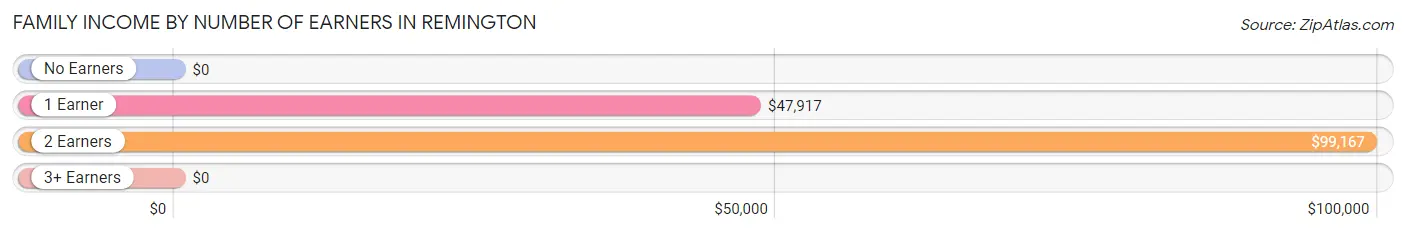
| Number of Earners | # Families | Median Income |
| No Earners | 9 (4.9%) | $0 |
| 1 Earner | 53 (28.8%) | $47,917 |
| 2 Earners | 112 (60.9%) | $99,167 |
| 3+ Earners | 10 (5.4%) | $0 |
| Total | 184 (100.0%) | $68,750 |
Household Income in Remington
Household Income Brackets in Remington
With 83 households falling in the category, the $50,000 to $74,999 income range is the most frequent in Remington, accounting for 27.5% of all households. In contrast, only 4 households (1.3%) fall into the less than $10,000 income bracket, making it the least populous group.
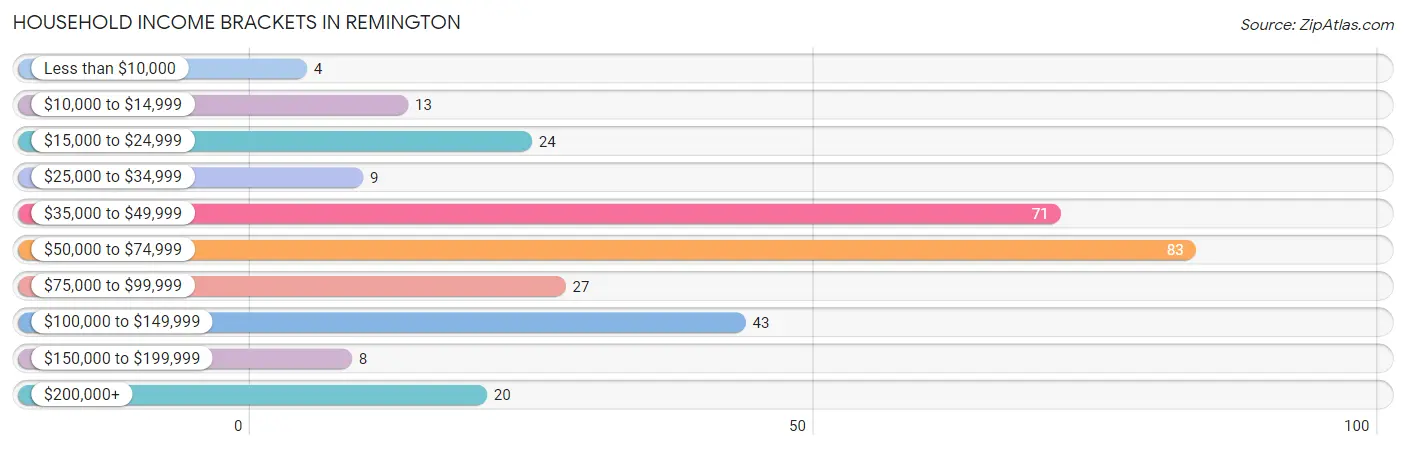
| Income Bracket | # Households | % Households |
| Less than $10,000 | 4 | 1.3% |
| $10,000 to $14,999 | 13 | 4.3% |
| $15,000 to $24,999 | 24 | 7.9% |
| $25,000 to $34,999 | 9 | 3.0% |
| $35,000 to $49,999 | 71 | 23.5% |
| $50,000 to $74,999 | 83 | 27.5% |
| $75,000 to $99,999 | 27 | 8.9% |
| $100,000 to $149,999 | 43 | 14.2% |
| $150,000 to $199,999 | 8 | 2.6% |
| $200,000+ | 20 | 6.6% |
Household Income by Householder Age in Remington
The median household income in Remington is $60,952, with the highest median household income of $81,667 found in the 45 to 64 years age bracket for the primary householder. A total of 102 households (33.8%) fall into this category. Meanwhile, the 65+ years age bracket for the primary householder has the lowest median household income of $0, with 46 households (15.2%) in this group.
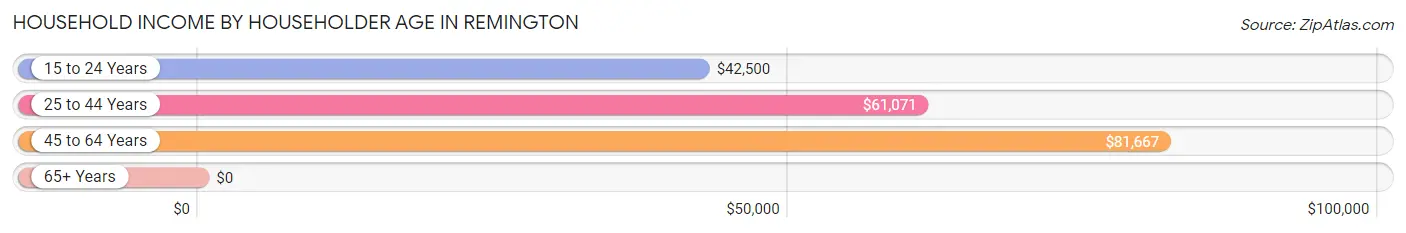
| Income Bracket | # Households | Median Income |
| 15 to 24 Years | 6 (2.0%) | $42,500 |
| 25 to 44 Years | 148 (49.0%) | $61,071 |
| 45 to 64 Years | 102 (33.8%) | $81,667 |
| 65+ Years | 46 (15.2%) | $0 |
| Total | 302 (100.0%) | $60,952 |
Poverty in Remington
Income Below Poverty by Sex and Age in Remington
With 12.3% poverty level for males and 3.9% for females among the residents of Remington, 75 year old and over males and 16 and 17 year old females are the most vulnerable to poverty, with 19 males (90.5%) and 4 females (25.0%) in their respective age groups living below the poverty level.
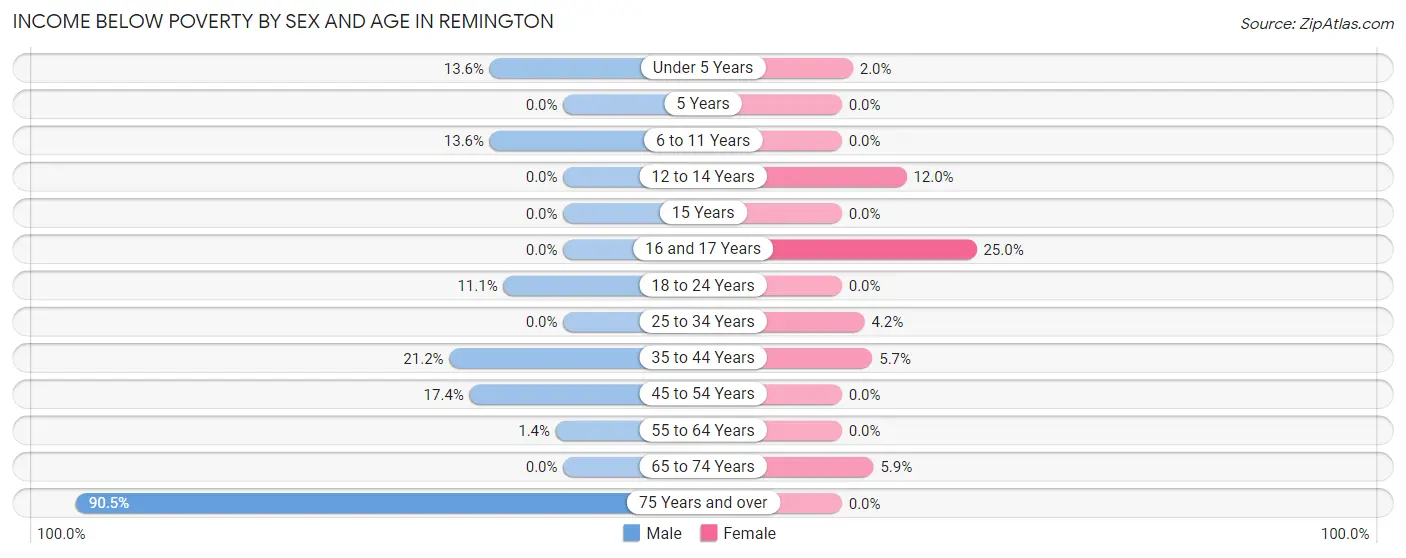
| Age Bracket | Male | Female |
| Under 5 Years | 6 (13.6%) | 1 (2.0%) |
| 5 Years | 0 (0.0%) | 0 (0.0%) |
| 6 to 11 Years | 9 (13.6%) | 0 (0.0%) |
| 12 to 14 Years | 0 (0.0%) | 3 (12.0%) |
| 15 Years | 0 (0.0%) | 0 (0.0%) |
| 16 and 17 Years | 0 (0.0%) | 4 (25.0%) |
| 18 to 24 Years | 2 (11.1%) | 0 (0.0%) |
| 25 to 34 Years | 0 (0.0%) | 4 (4.2%) |
| 35 to 44 Years | 11 (21.1%) | 3 (5.7%) |
| 45 to 54 Years | 4 (17.4%) | 0 (0.0%) |
| 55 to 64 Years | 1 (1.4%) | 0 (0.0%) |
| 65 to 74 Years | 0 (0.0%) | 1 (5.9%) |
| 75 Years and over | 19 (90.5%) | 0 (0.0%) |
| Total | 52 (12.3%) | 16 (3.9%) |
Income Above Poverty by Sex and Age in Remington
According to the poverty statistics in Remington, males aged 5 years and females aged 5 years are the age groups that are most secure financially, with 100.0% of males and 100.0% of females in these age groups living above the poverty line.
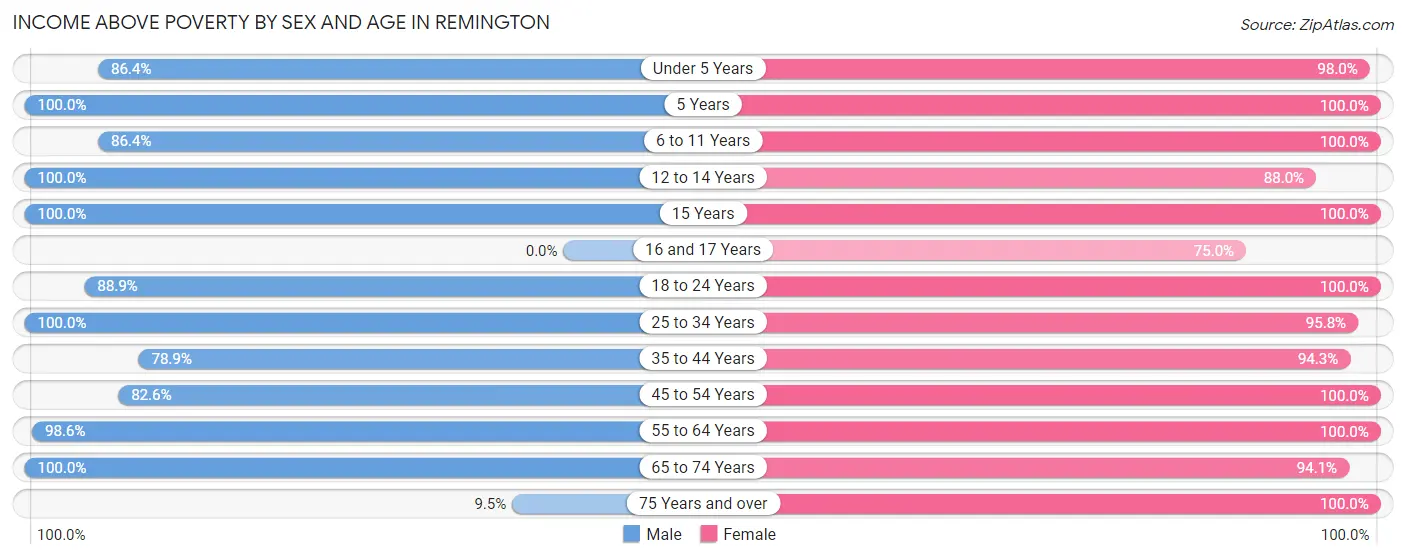
| Age Bracket | Male | Female |
| Under 5 Years | 38 (86.4%) | 48 (98.0%) |
| 5 Years | 3 (100.0%) | 7 (100.0%) |
| 6 to 11 Years | 57 (86.4%) | 31 (100.0%) |
| 12 to 14 Years | 8 (100.0%) | 22 (88.0%) |
| 15 Years | 15 (100.0%) | 19 (100.0%) |
| 16 and 17 Years | 0 (0.0%) | 12 (75.0%) |
| 18 to 24 Years | 16 (88.9%) | 7 (100.0%) |
| 25 to 34 Years | 90 (100.0%) | 91 (95.8%) |
| 35 to 44 Years | 41 (78.8%) | 50 (94.3%) |
| 45 to 54 Years | 19 (82.6%) | 45 (100.0%) |
| 55 to 64 Years | 71 (98.6%) | 41 (100.0%) |
| 65 to 74 Years | 11 (100.0%) | 16 (94.1%) |
| 75 Years and over | 2 (9.5%) | 8 (100.0%) |
| Total | 371 (87.7%) | 397 (96.1%) |
Income Below Poverty Among Married-Couple Families in Remington
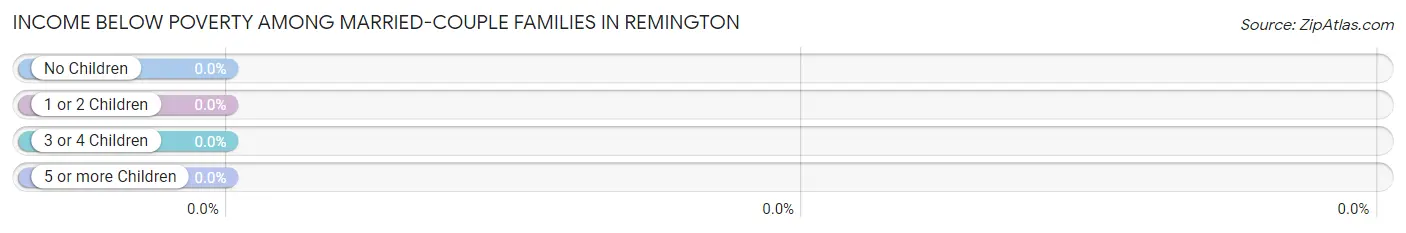
| Children | Above Poverty | Below Poverty |
| No Children | 51 (100.0%) | 0 (0.0%) |
| 1 or 2 Children | 42 (100.0%) | 0 (0.0%) |
| 3 or 4 Children | 8 (100.0%) | 0 (0.0%) |
| 5 or more Children | 0 (0.0%) | 0 (0.0%) |
| Total | 101 (100.0%) | 0 (0.0%) |
Income Below Poverty Among Single-Parent Households in Remington
According to the poverty data in Remington, 14.3% or 3 single-father households and 8.1% or 5 single-mother households are living below the poverty line. Among single-father households, those with 3 or 4 children have the highest poverty rate, with 1 households (100.0%) experiencing poverty. Likewise, among single-mother households, those with 1 or 2 children have the highest poverty rate, with 5 households (10.9%) falling below the poverty line.
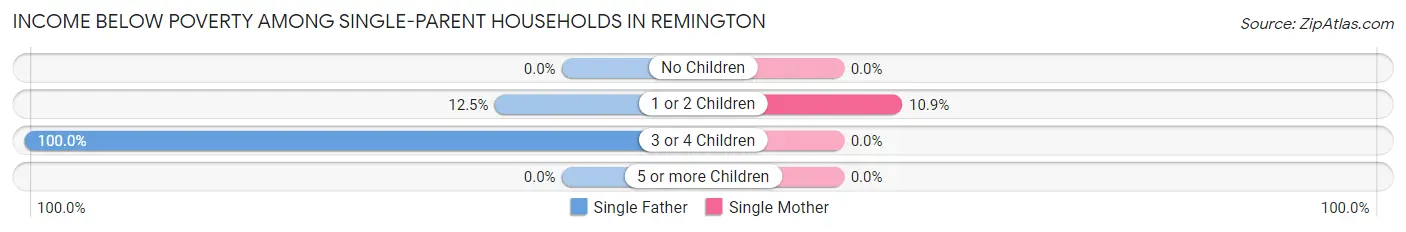
| Children | Single Father | Single Mother |
| No Children | 0 (0.0%) | 0 (0.0%) |
| 1 or 2 Children | 2 (12.5%) | 5 (10.9%) |
| 3 or 4 Children | 1 (100.0%) | 0 (0.0%) |
| 5 or more Children | 0 (0.0%) | 0 (0.0%) |
| Total | 3 (14.3%) | 5 (8.1%) |
Income Below Poverty Among Married-Couple vs Single-Parent Households in Remington
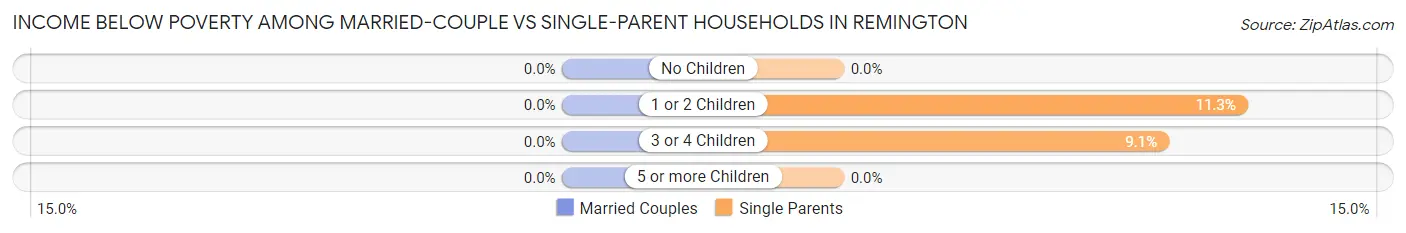
| Children | Married-Couple Families | Single-Parent Households |
| No Children | 0 (0.0%) | 0 (0.0%) |
| 1 or 2 Children | 0 (0.0%) | 7 (11.3%) |
| 3 or 4 Children | 0 (0.0%) | 1 (9.1%) |
| 5 or more Children | 0 (0.0%) | 0 (0.0%) |
| Total | 0 (0.0%) | 8 (9.6%) |
Race in Remington
The most populous races in Remington are White / Caucasian (536 | 64.1%), Black / African American (196 | 23.4%), and Two or more Races (103 | 12.3%).
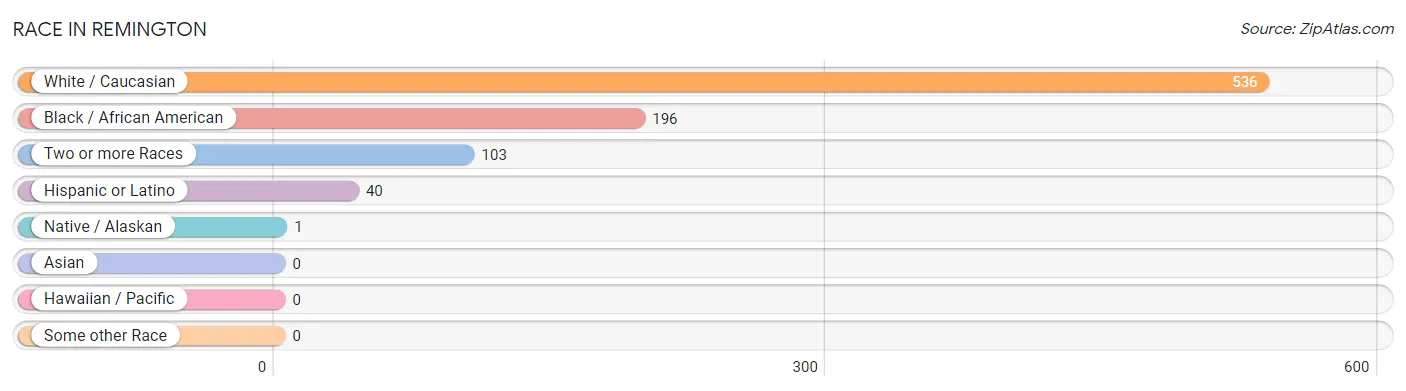
| Race | # Population | % Population |
| Asian | 0 | 0.0% |
| Black / African American | 196 | 23.4% |
| Hawaiian / Pacific | 0 | 0.0% |
| Hispanic or Latino | 40 | 4.8% |
| Native / Alaskan | 1 | 0.1% |
| White / Caucasian | 536 | 64.1% |
| Two or more Races | 103 | 12.3% |
| Some other Race | 0 | 0.0% |
| Total | 836 | 100.0% |
Ancestry in Remington
The most populous ancestries reported in Remington are German (147 | 17.6%), Irish (73 | 8.7%), English (72 | 8.6%), Italian (57 | 6.8%), and American (54 | 6.5%), together accounting for 48.2% of all Remington residents.
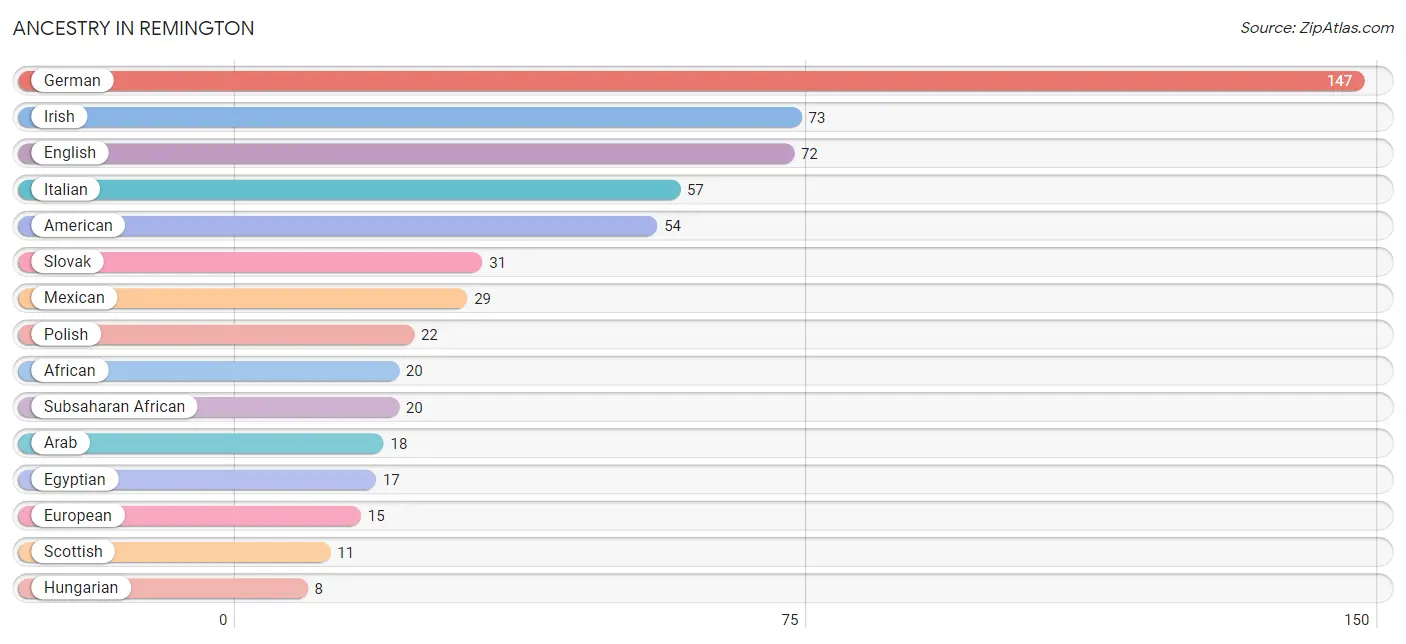
| Ancestry | # Population | % Population |
| African | 20 | 2.4% |
| American | 54 | 6.5% |
| Arab | 18 | 2.1% |
| Central American | 6 | 0.7% |
| Cuban | 5 | 0.6% |
| Eastern European | 2 | 0.2% |
| Egyptian | 17 | 2.0% |
| English | 72 | 8.6% |
| European | 15 | 1.8% |
| French | 4 | 0.5% |
| French Canadian | 4 | 0.5% |
| German | 147 | 17.6% |
| Honduran | 6 | 0.7% |
| Hungarian | 8 | 1.0% |
| Iraqi | 1 | 0.1% |
| Irish | 73 | 8.7% |
| Italian | 57 | 6.8% |
| Mexican | 29 | 3.5% |
| Polish | 22 | 2.6% |
| Russian | 8 | 1.0% |
| Scandinavian | 1 | 0.1% |
| Scotch-Irish | 8 | 1.0% |
| Scottish | 11 | 1.3% |
| Slovak | 31 | 3.7% |
| Subsaharan African | 20 | 2.4% | View All 25 Rows |
Immigrants in Remington
The most numerous immigrant groups reported in Remington came from Central America (13 | 1.6%), Latin America (13 | 1.6%), Mexico (8 | 1.0%), and Honduras (5 | 0.6%), together accounting for 4.7% of all Remington residents.
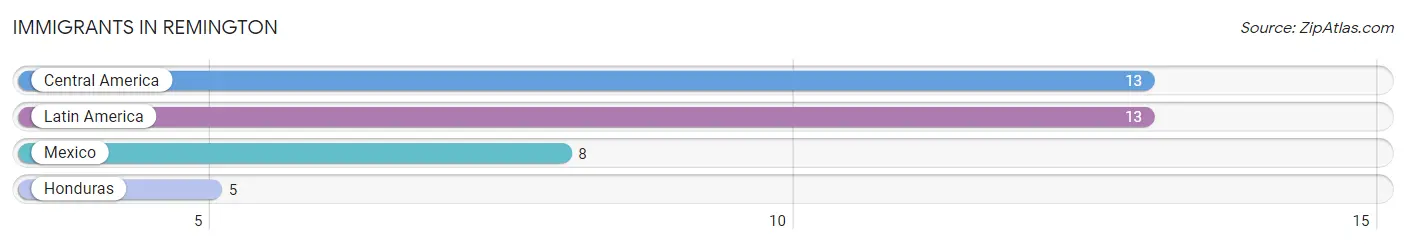
| Immigration Origin | # Population | % Population |
| Central America | 13 | 1.6% |
| Honduras | 5 | 0.6% |
| Latin America | 13 | 1.6% |
| Mexico | 8 | 1.0% | View All 4 Rows |
Sex and Age in Remington
Sex and Age in Remington
The most populous age groups in Remington are 5 to 9 Years (57 | 13.5%) for men and 25 to 29 Years (80 | 19.4%) for women.
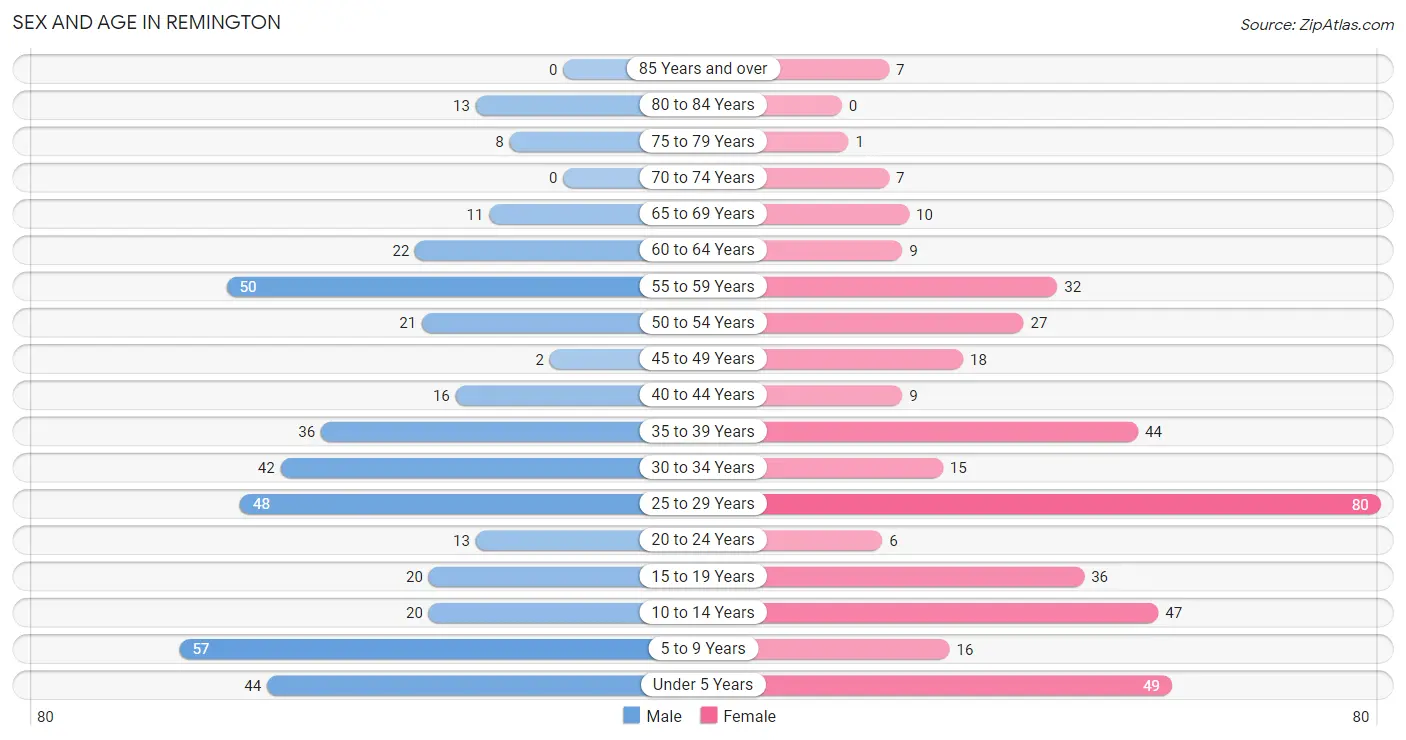
| Age Bracket | Male | Female |
| Under 5 Years | 44 (10.4%) | 49 (11.9%) |
| 5 to 9 Years | 57 (13.5%) | 16 (3.9%) |
| 10 to 14 Years | 20 (4.7%) | 47 (11.4%) |
| 15 to 19 Years | 20 (4.7%) | 36 (8.7%) |
| 20 to 24 Years | 13 (3.1%) | 6 (1.5%) |
| 25 to 29 Years | 48 (11.4%) | 80 (19.4%) |
| 30 to 34 Years | 42 (9.9%) | 15 (3.6%) |
| 35 to 39 Years | 36 (8.5%) | 44 (10.6%) |
| 40 to 44 Years | 16 (3.8%) | 9 (2.2%) |
| 45 to 49 Years | 2 (0.5%) | 18 (4.4%) |
| 50 to 54 Years | 21 (5.0%) | 27 (6.5%) |
| 55 to 59 Years | 50 (11.8%) | 32 (7.7%) |
| 60 to 64 Years | 22 (5.2%) | 9 (2.2%) |
| 65 to 69 Years | 11 (2.6%) | 10 (2.4%) |
| 70 to 74 Years | 0 (0.0%) | 7 (1.7%) |
| 75 to 79 Years | 8 (1.9%) | 1 (0.2%) |
| 80 to 84 Years | 13 (3.1%) | 0 (0.0%) |
| 85 Years and over | 0 (0.0%) | 7 (1.7%) |
| Total | 423 (100.0%) | 413 (100.0%) |
Families and Households in Remington
Median Family Size in Remington
The median family size in Remington is 3.58 persons per family, with single female/mother families (62 | 33.7%) accounting for the largest median family size of 4.15 persons per family. On the other hand, married-couple families (101 | 54.9%) represent the smallest median family size with 3.24 persons per family.
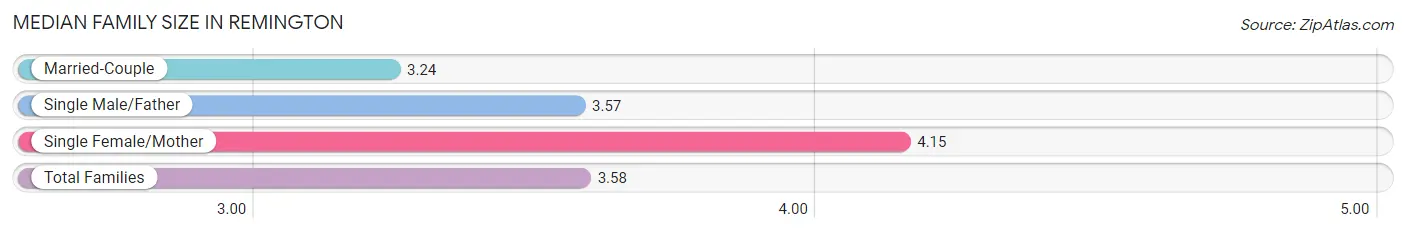
| Family Type | # Families | Family Size |
| Married-Couple | 101 (54.9%) | 3.24 |
| Single Male/Father | 21 (11.4%) | 3.57 |
| Single Female/Mother | 62 (33.7%) | 4.15 |
| Total Families | 184 (100.0%) | 3.58 |
Median Household Size in Remington
The median household size in Remington is 2.75 persons per household, with single female/mother households (62 | 20.5%) accounting for the largest median household size of 4.19 persons per household. non-family households (118 | 39.1%) represent the smallest median household size with 1.34 persons per household.
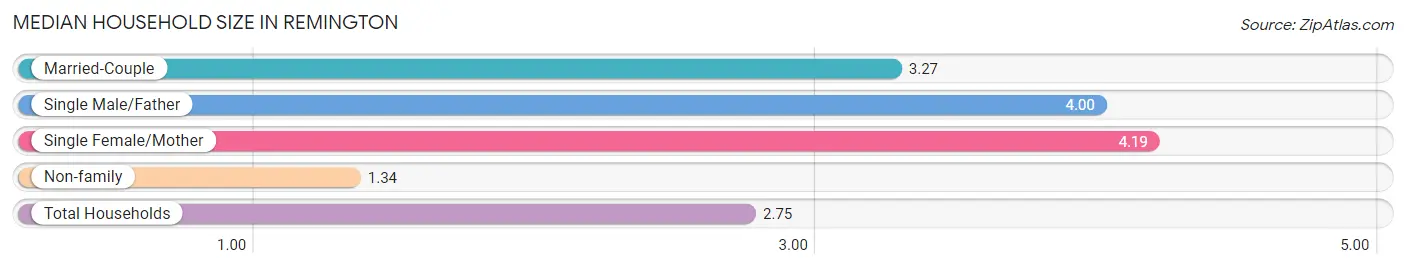
| Household Type | # Households | Household Size |
| Married-Couple | 101 (33.4%) | 3.27 |
| Single Male/Father | 21 (7.0%) | 4.00 |
| Single Female/Mother | 62 (20.5%) | 4.19 |
| Non-family | 118 (39.1%) | 1.34 |
| Total Households | 302 (100.0%) | 2.75 |
Household Size by Marriage Status in Remington
Out of a total of 302 households in Remington, 184 (60.9%) are family households, while 118 (39.1%) are nonfamily households. The most numerous type of family households are 2-person households, comprising 67, and the most common type of nonfamily households are 1-person households, comprising 88.
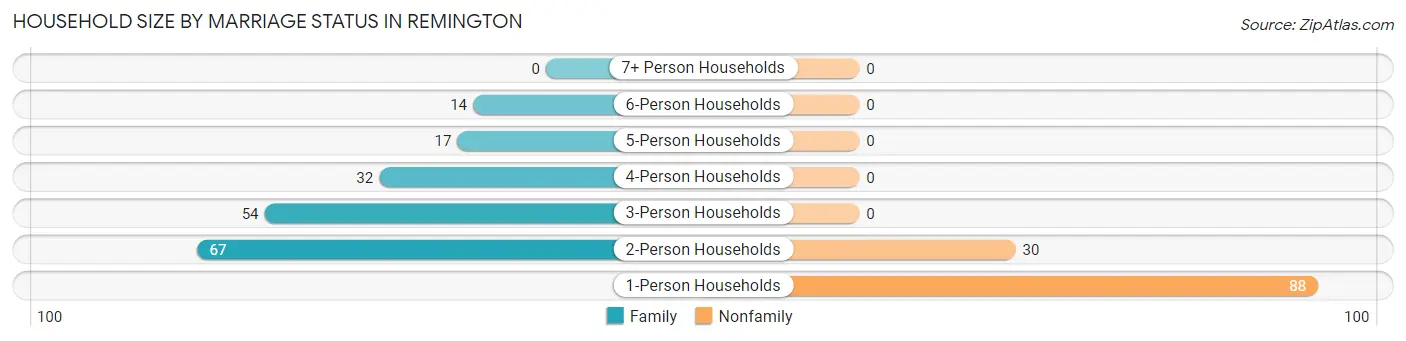
| Household Size | Family Households | Nonfamily Households |
| 1-Person Households | - | 88 (29.1%) |
| 2-Person Households | 67 (22.2%) | 30 (9.9%) |
| 3-Person Households | 54 (17.9%) | 0 (0.0%) |
| 4-Person Households | 32 (10.6%) | 0 (0.0%) |
| 5-Person Households | 17 (5.6%) | 0 (0.0%) |
| 6-Person Households | 14 (4.6%) | 0 (0.0%) |
| 7+ Person Households | 0 (0.0%) | 0 (0.0%) |
| Total | 184 (60.9%) | 118 (39.1%) |
Female Fertility in Remington
Fertility by Age in Remington
Average fertility rate in Remington is 77.0 births per 1,000 women. Women in the age bracket of 20 to 34 years have the highest fertility rate with 129.0 births per 1,000 women. Women in the age bracket of 20 to 34 years acount for 81.2% of all women with births.
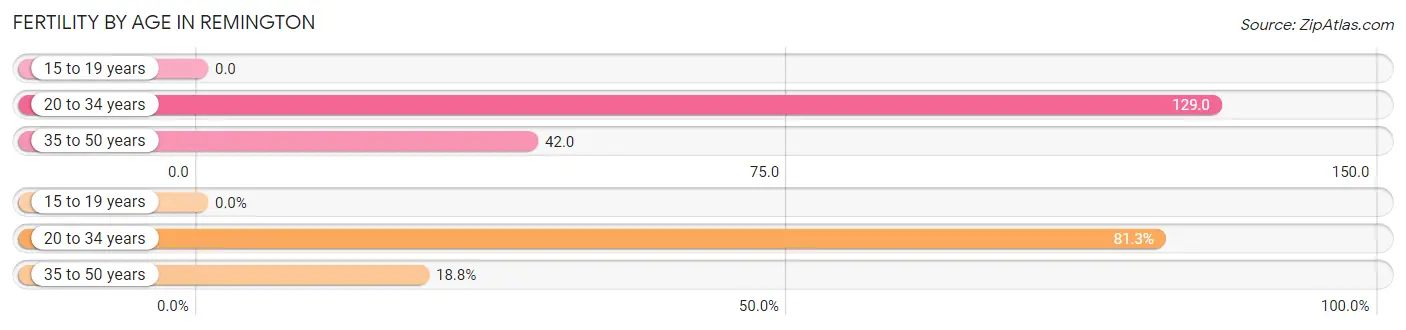
| Age Bracket | Women with Births | Births / 1,000 Women |
| 15 to 19 years | 0 (0.0%) | 0.0 |
| 20 to 34 years | 13 (81.2%) | 129.0 |
| 35 to 50 years | 3 (18.8%) | 42.0 |
| Total | 16 (100.0%) | 77.0 |
Fertility by Age by Marriage Status in Remington
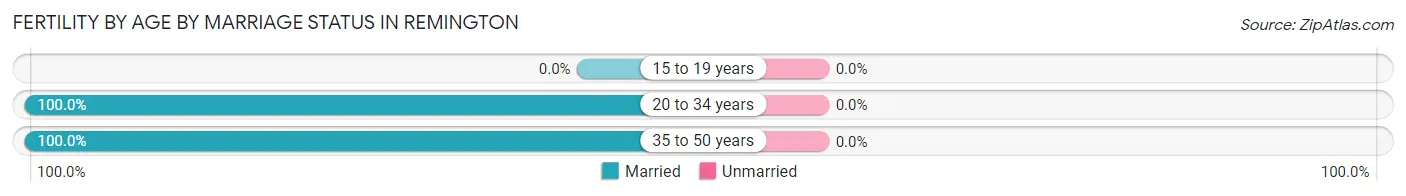
| Age Bracket | Married | Unmarried |
| 15 to 19 years | 0 (0.0%) | 0 (0.0%) |
| 20 to 34 years | 13 (100.0%) | 0 (0.0%) |
| 35 to 50 years | 3 (100.0%) | 0 (0.0%) |
| Total | 16 (100.0%) | 0 (0.0%) |
Fertility by Education in Remington
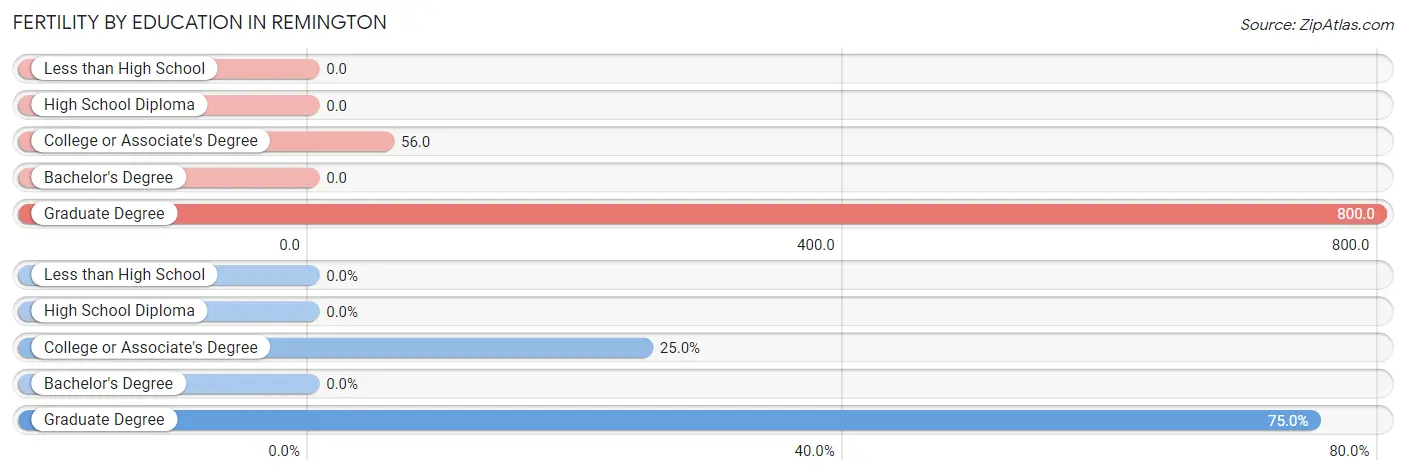
| Educational Attainment | Women with Births | Births / 1,000 Women |
| Less than High School | 0 (0.0%) | 0.0 |
| High School Diploma | 0 (0.0%) | 0.0 |
| College or Associate's Degree | 4 (25.0%) | 56.0 |
| Bachelor's Degree | 0 (0.0%) | 0.0 |
| Graduate Degree | 12 (75.0%) | 800.0 |
| Total | 16 (100.0%) | 77.0 |
Fertility by Education by Marriage Status in Remington
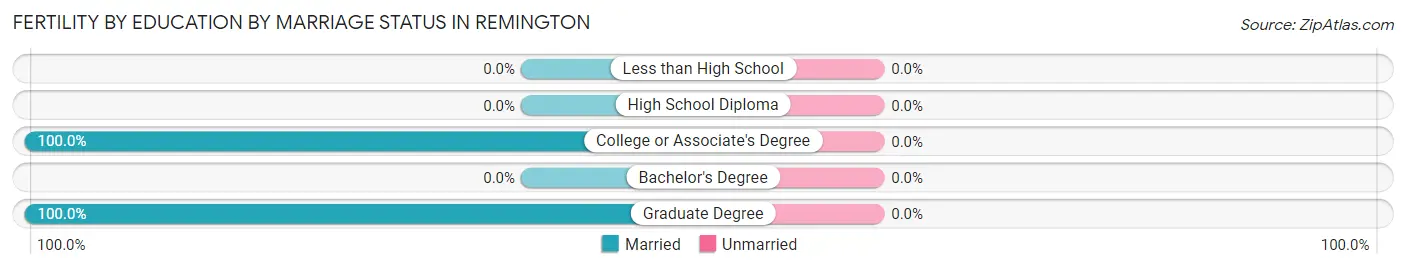
| Educational Attainment | Married | Unmarried |
| Less than High School | 0 (0.0%) | 0 (0.0%) |
| High School Diploma | 0 (0.0%) | 0 (0.0%) |
| College or Associate's Degree | 4 (100.0%) | 0 (0.0%) |
| Bachelor's Degree | 0 (0.0%) | 0 (0.0%) |
| Graduate Degree | 12 (100.0%) | 0 (0.0%) |
| Total | 16 (100.0%) | 0 (0.0%) |
Employment Characteristics in Remington
Employment by Class of Employer in Remington
Among the 391 employed individuals in Remington, private company employees (307 | 78.5%), local government employees (41 | 10.5%), and not-for-profit organizations (18 | 4.6%) make up the most common classes of employment.
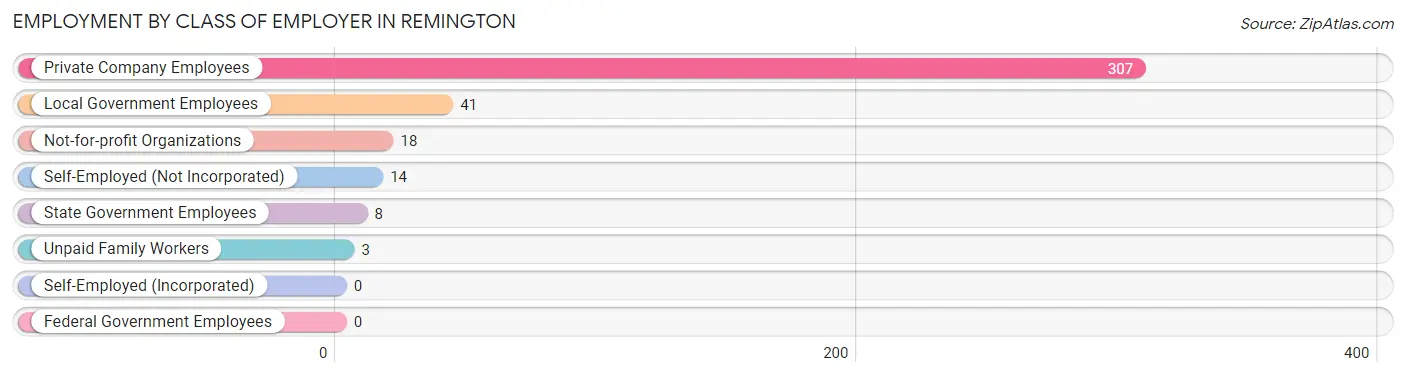
| Employer Class | # Employees | % Employees |
| Private Company Employees | 307 | 78.5% |
| Self-Employed (Incorporated) | 0 | 0.0% |
| Self-Employed (Not Incorporated) | 14 | 3.6% |
| Not-for-profit Organizations | 18 | 4.6% |
| Local Government Employees | 41 | 10.5% |
| State Government Employees | 8 | 2.1% |
| Federal Government Employees | 0 | 0.0% |
| Unpaid Family Workers | 3 | 0.8% |
| Total | 391 | 100.0% |
Employment Status by Age in Remington
According to the labor force statistics for Remington, out of the total population over 16 years of age (569), 78.7% or 448 individuals are in the labor force, with 4.7% or 21 of them unemployed. The age group with the highest labor force participation rate is 20 to 24 years, with 100.0% or 19 individuals in the labor force. Within the labor force, the 75 years and over age range has the highest percentage of unemployed individuals, with 100.0% or 1 of them being unemployed.
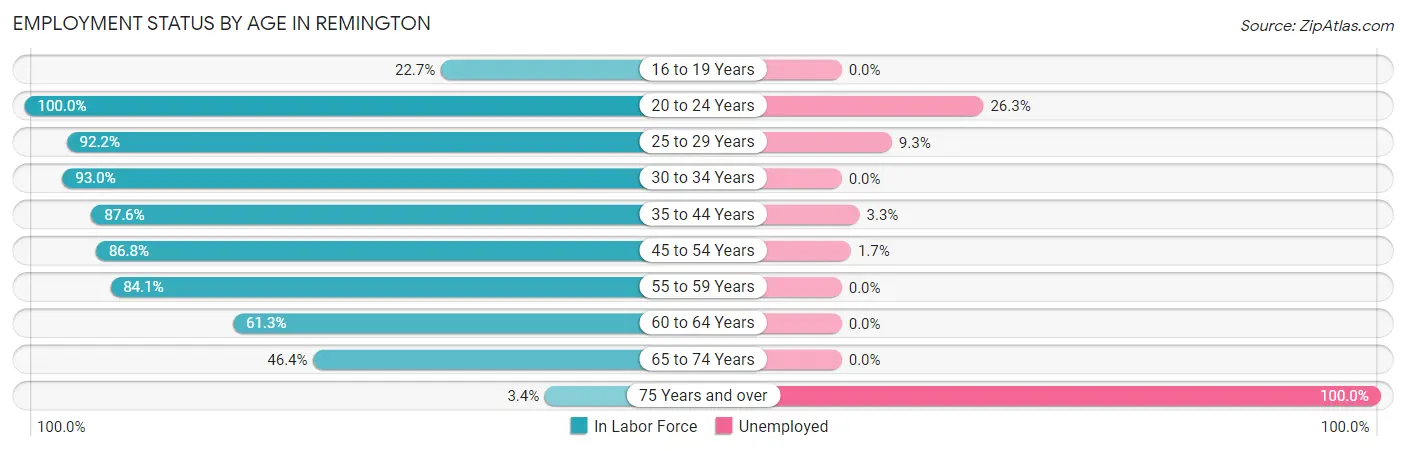
| Age Bracket | In Labor Force | Unemployed |
| 16 to 19 Years | 5 (22.7%) | 0 (0.0%) |
| 20 to 24 Years | 19 (100.0%) | 5 (26.3%) |
| 25 to 29 Years | 118 (92.2%) | 11 (9.3%) |
| 30 to 34 Years | 53 (93.0%) | 0 (0.0%) |
| 35 to 44 Years | 92 (87.6%) | 3 (3.3%) |
| 45 to 54 Years | 59 (86.8%) | 1 (1.7%) |
| 55 to 59 Years | 69 (84.1%) | 0 (0.0%) |
| 60 to 64 Years | 19 (61.3%) | 0 (0.0%) |
| 65 to 74 Years | 13 (46.4%) | 0 (0.0%) |
| 75 Years and over | 1 (3.4%) | 1 (100.0%) |
| Total | 448 (78.7%) | 21 (4.7%) |
Employment Status by Educational Attainment in Remington
According to labor force statistics for Remington, 87.0% of individuals (410) out of the total population between 25 and 64 years of age (471) are in the labor force, with 3.7% or 15 of them being unemployed. The group with the highest labor force participation rate are those with the educational attainment of bachelor's degree or higher, with 95.0% or 132 individuals in the labor force. Within the labor force, individuals with less than high school education have the highest percentage of unemployment, with 19.0% or 11 of them being unemployed.
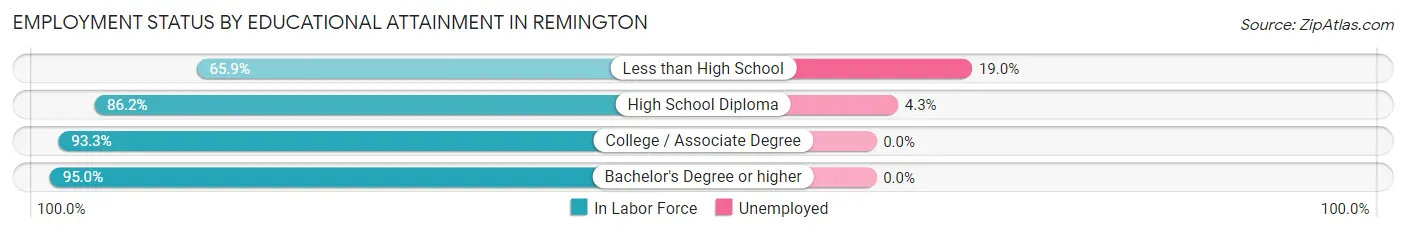
| Educational Attainment | In Labor Force | Unemployed |
| Less than High School | 58 (65.9%) | 17 (19.0%) |
| High School Diploma | 94 (86.2%) | 5 (4.3%) |
| College / Associate Degree | 126 (93.3%) | 0 (0.0%) |
| Bachelor's Degree or higher | 132 (95.0%) | 0 (0.0%) |
| Total | 410 (87.0%) | 17 (3.7%) |
Employment Occupations by Sex in Remington
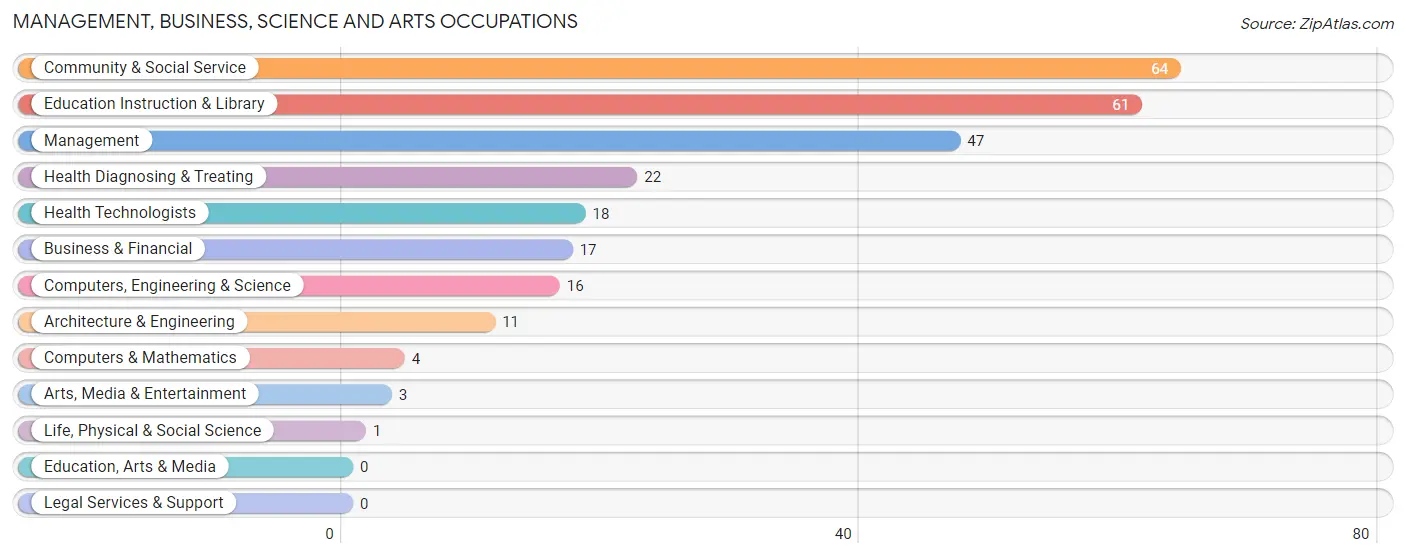
Management, Business, Science and Arts Occupations
The most common Management, Business, Science and Arts occupations in Remington are Community & Social Service (64 | 15.0%), Education Instruction & Library (61 | 14.3%), Management (47 | 11.0%), Health Diagnosing & Treating (22 | 5.1%), and Health Technologists (18 | 4.2%).
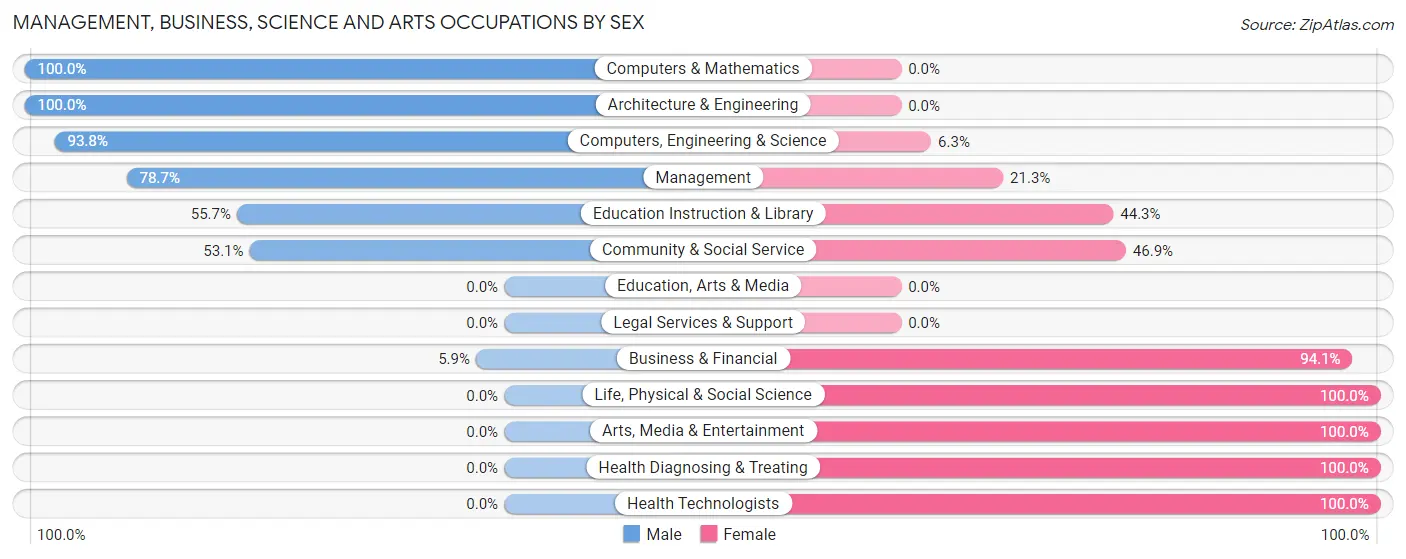
Management, Business, Science and Arts Occupations by Sex
Within the Management, Business, Science and Arts occupations in Remington, the most male-oriented occupations are Computers & Mathematics (100.0%), Architecture & Engineering (100.0%), and Computers, Engineering & Science (93.8%), while the most female-oriented occupations are Life, Physical & Social Science (100.0%), Arts, Media & Entertainment (100.0%), and Health Diagnosing & Treating (100.0%).
| Occupation | Male | Female |
| Management | 37 (78.7%) | 10 (21.3%) |
| Business & Financial | 1 (5.9%) | 16 (94.1%) |
| Computers, Engineering & Science | 15 (93.8%) | 1 (6.2%) |
| Computers & Mathematics | 4 (100.0%) | 0 (0.0%) |
| Architecture & Engineering | 11 (100.0%) | 0 (0.0%) |
| Life, Physical & Social Science | 0 (0.0%) | 1 (100.0%) |
| Community & Social Service | 34 (53.1%) | 30 (46.9%) |
| Education, Arts & Media | 0 (0.0%) | 0 (0.0%) |
| Legal Services & Support | 0 (0.0%) | 0 (0.0%) |
| Education Instruction & Library | 34 (55.7%) | 27 (44.3%) |
| Arts, Media & Entertainment | 0 (0.0%) | 3 (100.0%) |
| Health Diagnosing & Treating | 0 (0.0%) | 22 (100.0%) |
| Health Technologists | 0 (0.0%) | 18 (100.0%) |
| Total (Category) | 87 (52.4%) | 79 (47.6%) |
| Total (Overall) | 227 (53.2%) | 200 (46.8%) |
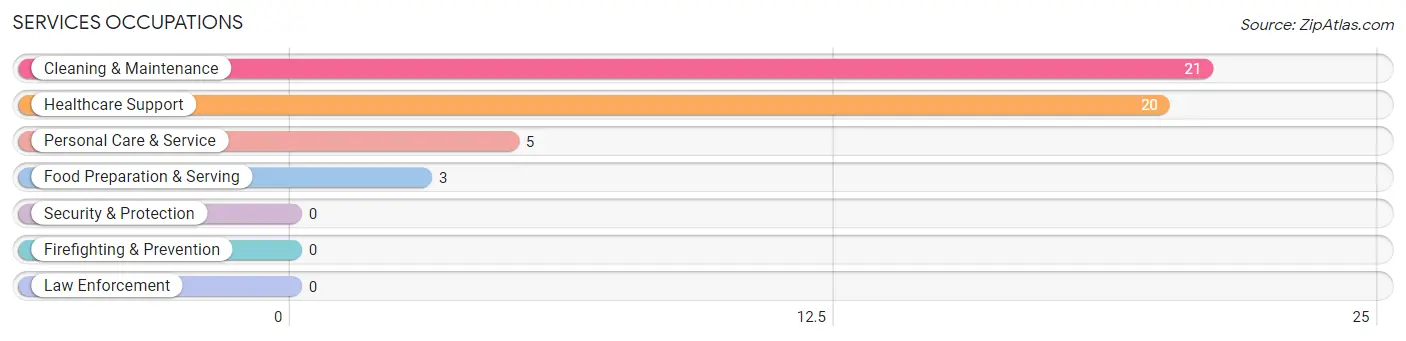
Services Occupations
The most common Services occupations in Remington are Cleaning & Maintenance (21 | 4.9%), Healthcare Support (20 | 4.7%), Personal Care & Service (5 | 1.2%), and Food Preparation & Serving (3 | 0.7%).
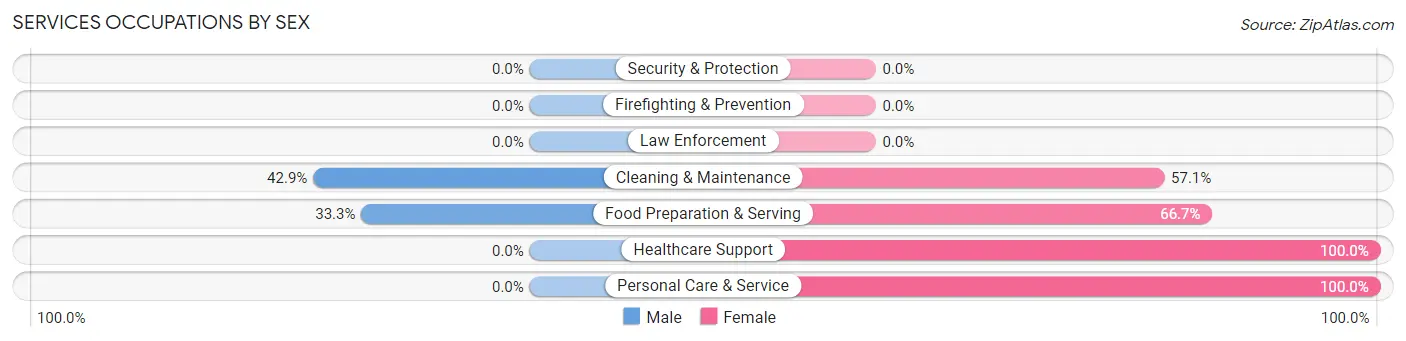
Services Occupations by Sex
Within the Services occupations in Remington, the most male-oriented occupations are Cleaning & Maintenance (42.9%), and Food Preparation & Serving (33.3%), while the most female-oriented occupations are Healthcare Support (100.0%), Personal Care & Service (100.0%), and Food Preparation & Serving (66.7%).
| Occupation | Male | Female |
| Healthcare Support | 0 (0.0%) | 20 (100.0%) |
| Security & Protection | 0 (0.0%) | 0 (0.0%) |
| Firefighting & Prevention | 0 (0.0%) | 0 (0.0%) |
| Law Enforcement | 0 (0.0%) | 0 (0.0%) |
| Food Preparation & Serving | 1 (33.3%) | 2 (66.7%) |
| Cleaning & Maintenance | 9 (42.9%) | 12 (57.1%) |
| Personal Care & Service | 0 (0.0%) | 5 (100.0%) |
| Total (Category) | 10 (20.4%) | 39 (79.6%) |
| Total (Overall) | 227 (53.2%) | 200 (46.8%) |
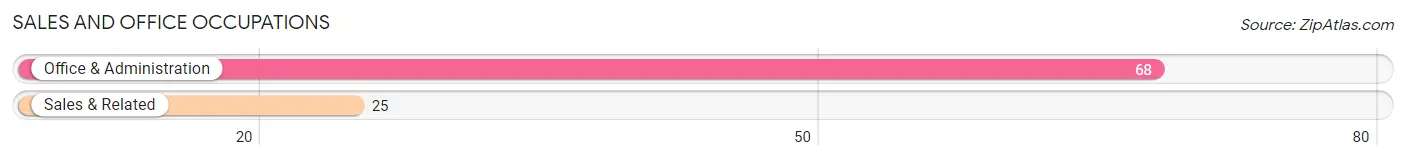
Sales and Office Occupations
The most common Sales and Office occupations in Remington are Office & Administration (68 | 15.9%), and Sales & Related (25 | 5.9%).
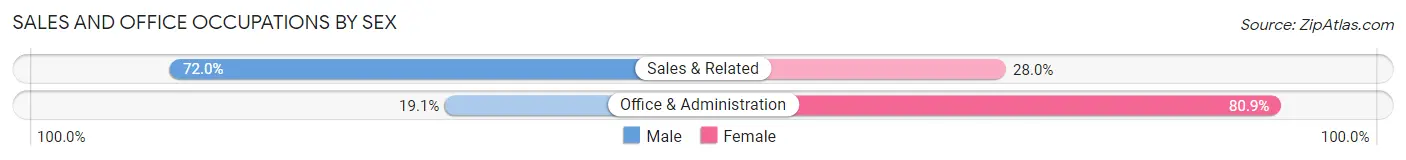
Sales and Office Occupations by Sex
| Occupation | Male | Female |
| Sales & Related | 18 (72.0%) | 7 (28.0%) |
| Office & Administration | 13 (19.1%) | 55 (80.9%) |
| Total (Category) | 31 (33.3%) | 62 (66.7%) |
| Total (Overall) | 227 (53.2%) | 200 (46.8%) |
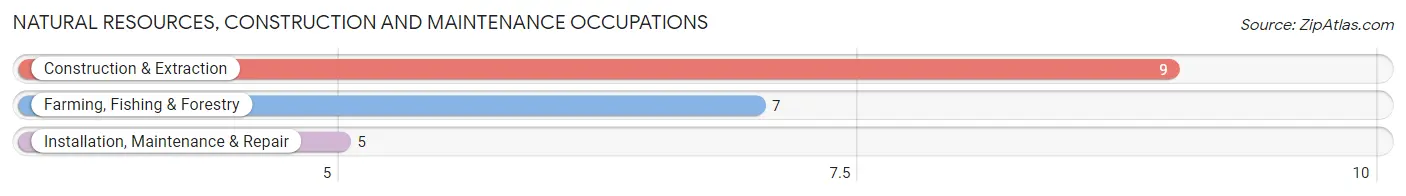
Natural Resources, Construction and Maintenance Occupations
The most common Natural Resources, Construction and Maintenance occupations in Remington are Construction & Extraction (9 | 2.1%), Farming, Fishing & Forestry (7 | 1.6%), and Installation, Maintenance & Repair (5 | 1.2%).
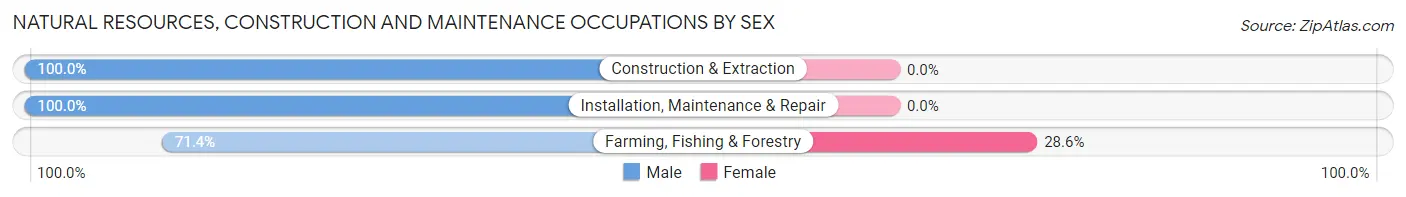
Natural Resources, Construction and Maintenance Occupations by Sex
| Occupation | Male | Female |
| Farming, Fishing & Forestry | 5 (71.4%) | 2 (28.6%) |
| Construction & Extraction | 9 (100.0%) | 0 (0.0%) |
| Installation, Maintenance & Repair | 5 (100.0%) | 0 (0.0%) |
| Total (Category) | 19 (90.5%) | 2 (9.5%) |
| Total (Overall) | 227 (53.2%) | 200 (46.8%) |
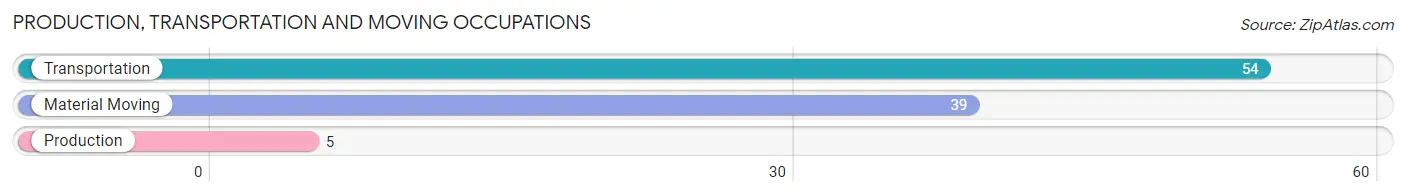
Production, Transportation and Moving Occupations
The most common Production, Transportation and Moving occupations in Remington are Transportation (54 | 12.7%), Material Moving (39 | 9.1%), and Production (5 | 1.2%).
Production, Transportation and Moving Occupations by Sex
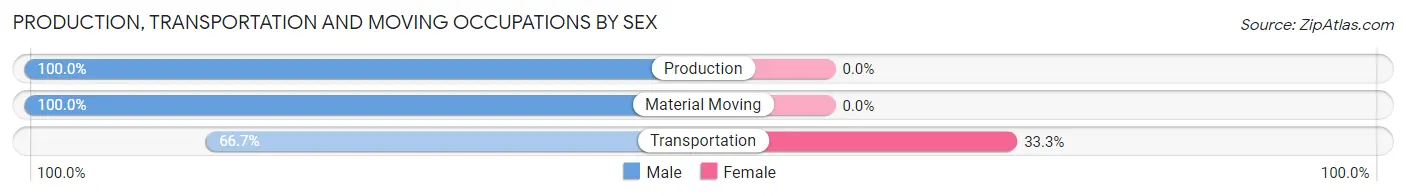
| Occupation | Male | Female |
| Production | 5 (100.0%) | 0 (0.0%) |
| Transportation | 36 (66.7%) | 18 (33.3%) |
| Material Moving | 39 (100.0%) | 0 (0.0%) |
| Total (Category) | 80 (81.6%) | 18 (18.4%) |
| Total (Overall) | 227 (53.2%) | 200 (46.8%) |
Employment Industries by Sex in Remington
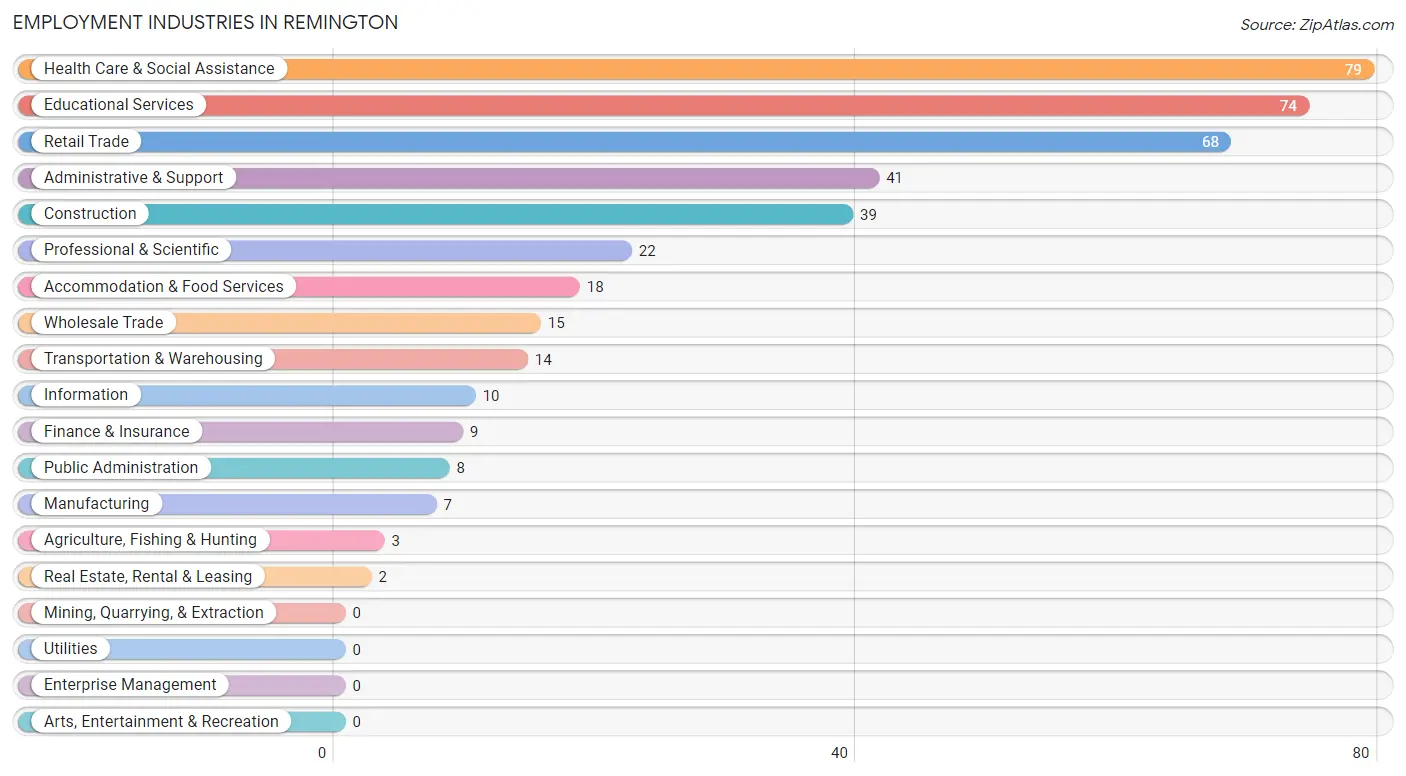
Employment Industries in Remington
The major employment industries in Remington include Health Care & Social Assistance (79 | 18.5%), Educational Services (74 | 17.3%), Retail Trade (68 | 15.9%), Administrative & Support (41 | 9.6%), and Construction (39 | 9.1%).
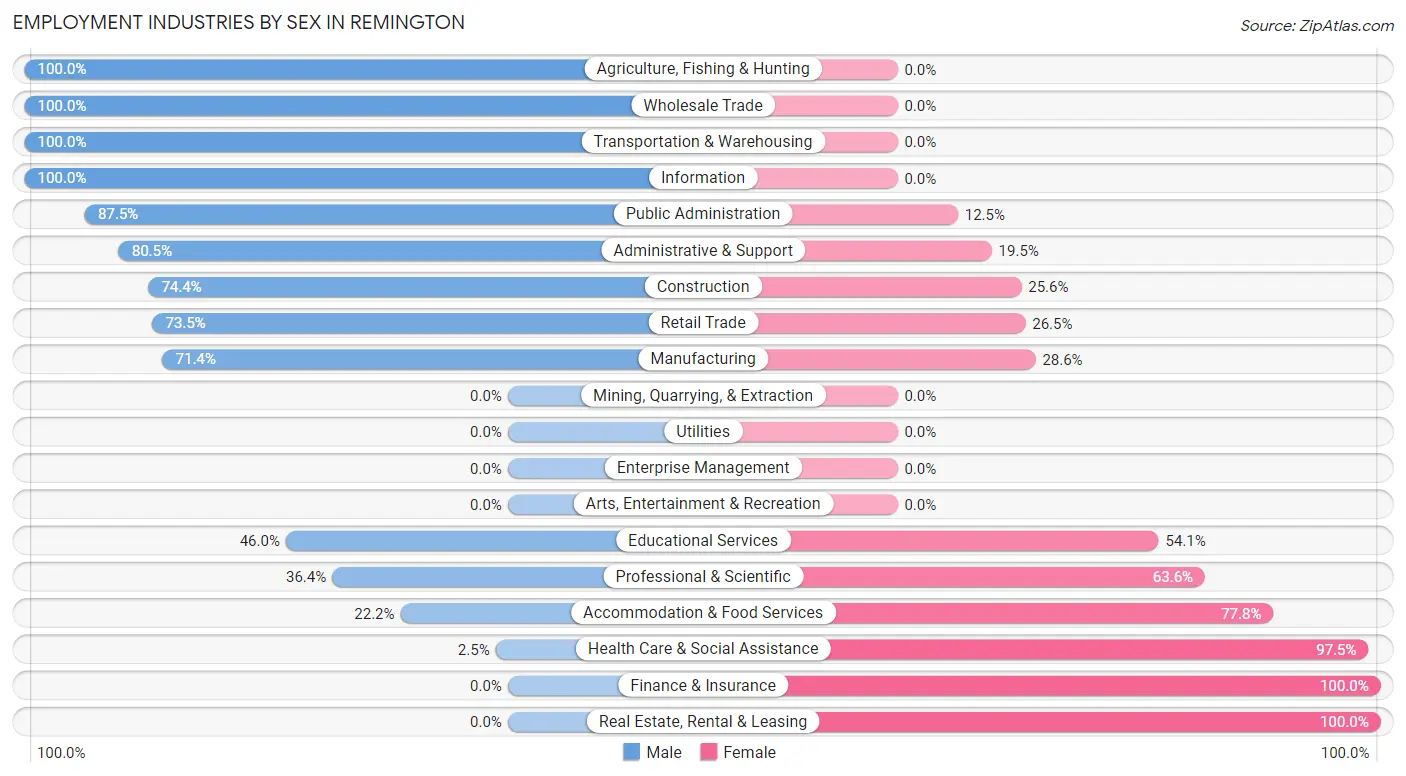
Employment Industries by Sex in Remington
The Remington industries that see more men than women are Agriculture, Fishing & Hunting (100.0%), Wholesale Trade (100.0%), and Transportation & Warehousing (100.0%), whereas the industries that tend to have a higher number of women are Finance & Insurance (100.0%), Real Estate, Rental & Leasing (100.0%), and Health Care & Social Assistance (97.5%).
| Industry | Male | Female |
| Agriculture, Fishing & Hunting | 3 (100.0%) | 0 (0.0%) |
| Mining, Quarrying, & Extraction | 0 (0.0%) | 0 (0.0%) |
| Construction | 29 (74.4%) | 10 (25.6%) |
| Manufacturing | 5 (71.4%) | 2 (28.6%) |
| Wholesale Trade | 15 (100.0%) | 0 (0.0%) |
| Retail Trade | 50 (73.5%) | 18 (26.5%) |
| Transportation & Warehousing | 14 (100.0%) | 0 (0.0%) |
| Utilities | 0 (0.0%) | 0 (0.0%) |
| Information | 10 (100.0%) | 0 (0.0%) |
| Finance & Insurance | 0 (0.0%) | 9 (100.0%) |
| Real Estate, Rental & Leasing | 0 (0.0%) | 2 (100.0%) |
| Professional & Scientific | 8 (36.4%) | 14 (63.6%) |
| Enterprise Management | 0 (0.0%) | 0 (0.0%) |
| Administrative & Support | 33 (80.5%) | 8 (19.5%) |
| Educational Services | 34 (46.0%) | 40 (54.0%) |
| Health Care & Social Assistance | 2 (2.5%) | 77 (97.5%) |
| Arts, Entertainment & Recreation | 0 (0.0%) | 0 (0.0%) |
| Accommodation & Food Services | 4 (22.2%) | 14 (77.8%) |
| Public Administration | 7 (87.5%) | 1 (12.5%) |
| Total | 227 (53.2%) | 200 (46.8%) |
Education in Remington
School Enrollment in Remington
The most common levels of schooling among the 254 students in Remington are elementary school (63 | 24.8%), high school (63 | 24.8%), and middle school (52 | 20.5%).
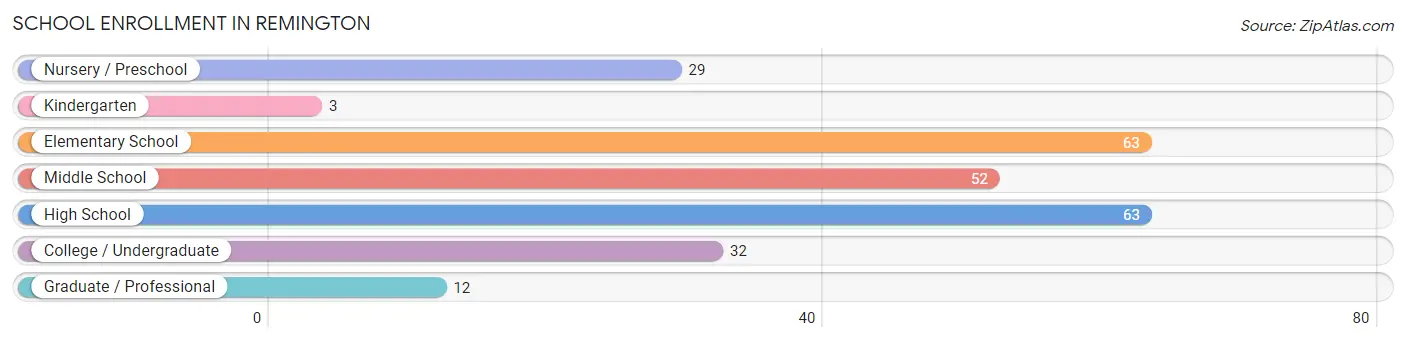
| School Level | # Students | % Students |
| Nursery / Preschool | 29 | 11.4% |
| Kindergarten | 3 | 1.2% |
| Elementary School | 63 | 24.8% |
| Middle School | 52 | 20.5% |
| High School | 63 | 24.8% |
| College / Undergraduate | 32 | 12.6% |
| Graduate / Professional | 12 | 4.7% |
| Total | 254 | 100.0% |
School Enrollment by Age by Funding Source in Remington
Out of a total of 254 students who are enrolled in schools in Remington, 35 (13.8%) attend a private institution, while the remaining 219 (86.2%) are enrolled in public schools. The age group of 3 to 4 year olds has the highest likelihood of being enrolled in private schools, with 29 (100.0% in the age bracket) enrolled. Conversely, the age group of 15 to 17 year olds has the lowest likelihood of being enrolled in a private school, with 50 (100.0% in the age bracket) attending a public institution.
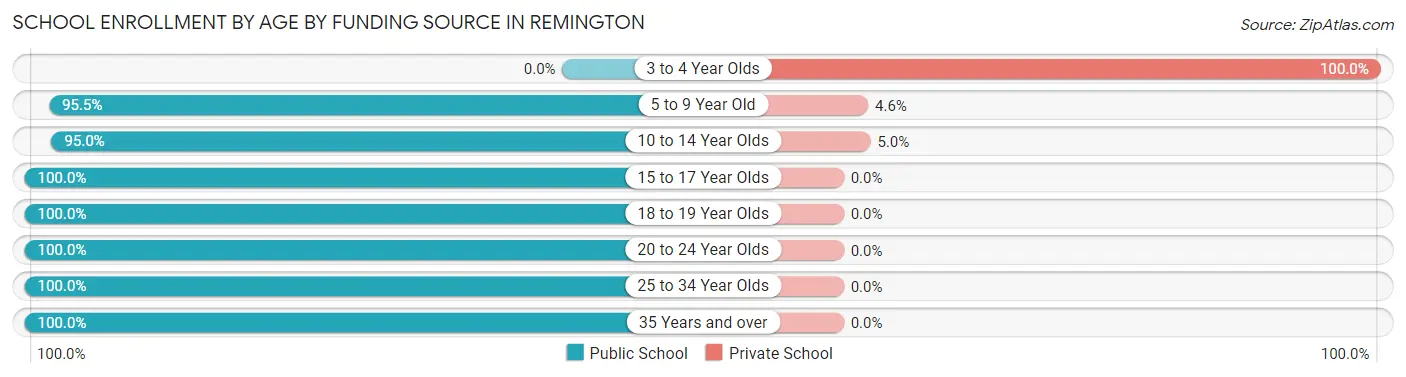
| Age Bracket | Public School | Private School |
| 3 to 4 Year Olds | 0 (0.0%) | 29 (100.0%) |
| 5 to 9 Year Old | 63 (95.5%) | 3 (4.5%) |
| 10 to 14 Year Olds | 57 (95.0%) | 3 (5.0%) |
| 15 to 17 Year Olds | 50 (100.0%) | 0 (0.0%) |
| 18 to 19 Year Olds | 6 (100.0%) | 0 (0.0%) |
| 20 to 24 Year Olds | 5 (100.0%) | 0 (0.0%) |
| 25 to 34 Year Olds | 26 (100.0%) | 0 (0.0%) |
| 35 Years and over | 12 (100.0%) | 0 (0.0%) |
| Total | 219 (86.2%) | 35 (13.8%) |
Educational Attainment by Field of Study in Remington
Business (28 | 14.7%), computers & mathematics (27 | 14.1%), arts & humanities (25 | 13.1%), engineering (19 | 10.0%), and education (18 | 9.4%) are the most common fields of study among 191 individuals in Remington who have obtained a bachelor's degree or higher.
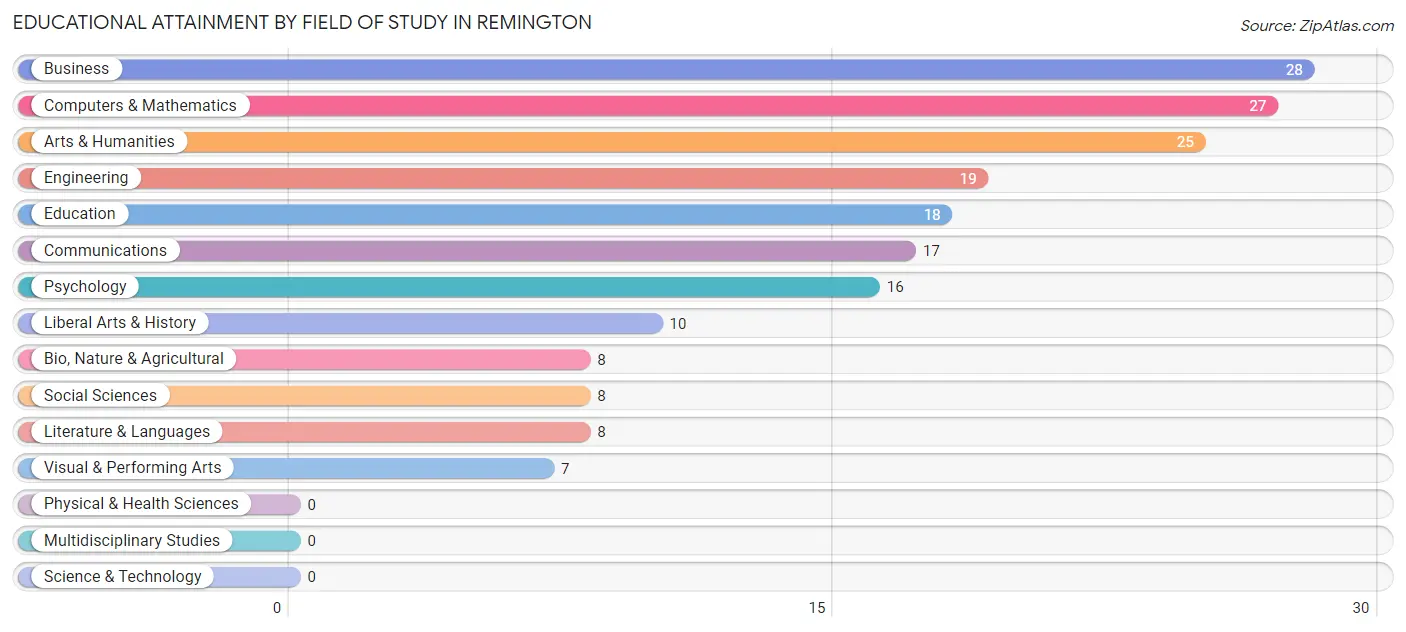
| Field of Study | # Graduates | % Graduates |
| Computers & Mathematics | 27 | 14.1% |
| Bio, Nature & Agricultural | 8 | 4.2% |
| Physical & Health Sciences | 0 | 0.0% |
| Psychology | 16 | 8.4% |
| Social Sciences | 8 | 4.2% |
| Engineering | 19 | 10.0% |
| Multidisciplinary Studies | 0 | 0.0% |
| Science & Technology | 0 | 0.0% |
| Business | 28 | 14.7% |
| Education | 18 | 9.4% |
| Literature & Languages | 8 | 4.2% |
| Liberal Arts & History | 10 | 5.2% |
| Visual & Performing Arts | 7 | 3.7% |
| Communications | 17 | 8.9% |
| Arts & Humanities | 25 | 13.1% |
| Total | 191 | 100.0% |
Transportation & Commute in Remington
Vehicle Availability by Sex in Remington
The most prevalent vehicle ownership categories in Remington are males with 2 vehicles (99, accounting for 46.7%) and females with 2 vehicles (70, making up 55.3%).
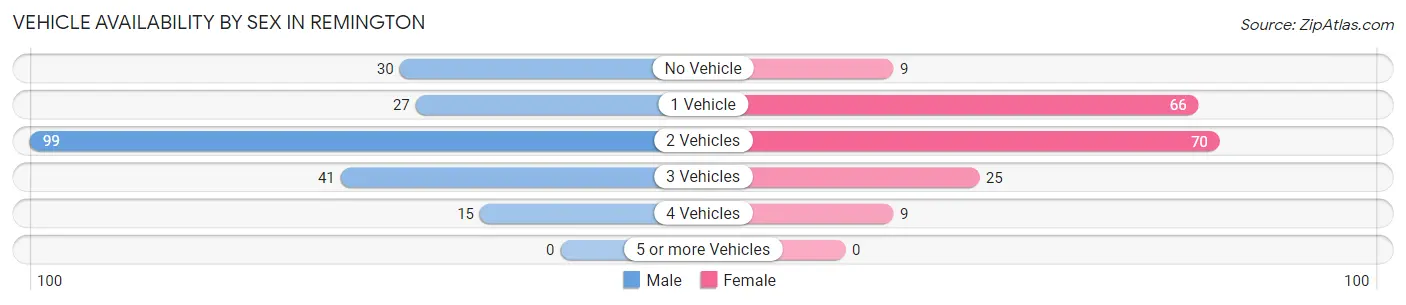
| Vehicles Available | Male | Female |
| No Vehicle | 30 (14.1%) | 9 (5.0%) |
| 1 Vehicle | 27 (12.7%) | 66 (36.9%) |
| 2 Vehicles | 99 (46.7%) | 70 (39.1%) |
| 3 Vehicles | 41 (19.3%) | 25 (14.0%) |
| 4 Vehicles | 15 (7.1%) | 9 (5.0%) |
| 5 or more Vehicles | 0 (0.0%) | 0 (0.0%) |
| Total | 212 (100.0%) | 179 (100.0%) |
Commute Time in Remington
The most frequently occuring commute durations in Remington are 45 to 59 minutes (85 commuters, 22.0%), 20 to 24 minutes (59 commuters, 15.2%), and 60 to 89 minutes (42 commuters, 10.8%).
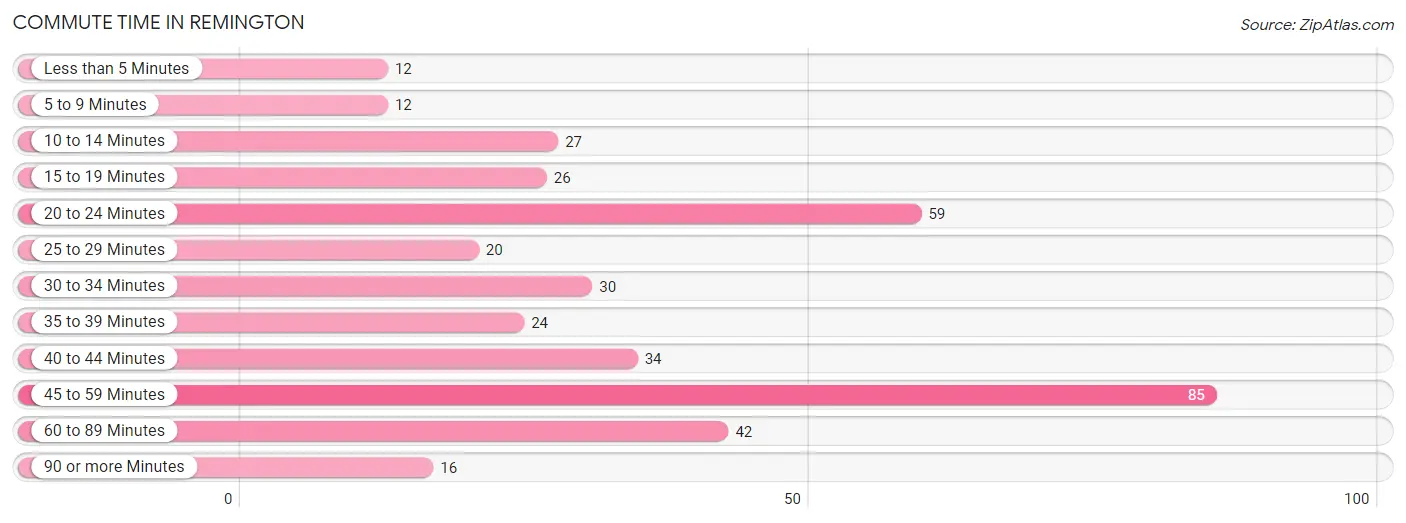
| Commute Time | # Commuters | % Commuters |
| Less than 5 Minutes | 12 | 3.1% |
| 5 to 9 Minutes | 12 | 3.1% |
| 10 to 14 Minutes | 27 | 7.0% |
| 15 to 19 Minutes | 26 | 6.7% |
| 20 to 24 Minutes | 59 | 15.2% |
| 25 to 29 Minutes | 20 | 5.2% |
| 30 to 34 Minutes | 30 | 7.7% |
| 35 to 39 Minutes | 24 | 6.2% |
| 40 to 44 Minutes | 34 | 8.8% |
| 45 to 59 Minutes | 85 | 22.0% |
| 60 to 89 Minutes | 42 | 10.8% |
| 90 or more Minutes | 16 | 4.1% |
Commute Time by Sex in Remington
The most common commute times in Remington are 45 to 59 minutes (52 commuters, 24.9%) for males and 20 to 24 minutes (53 commuters, 29.8%) for females.
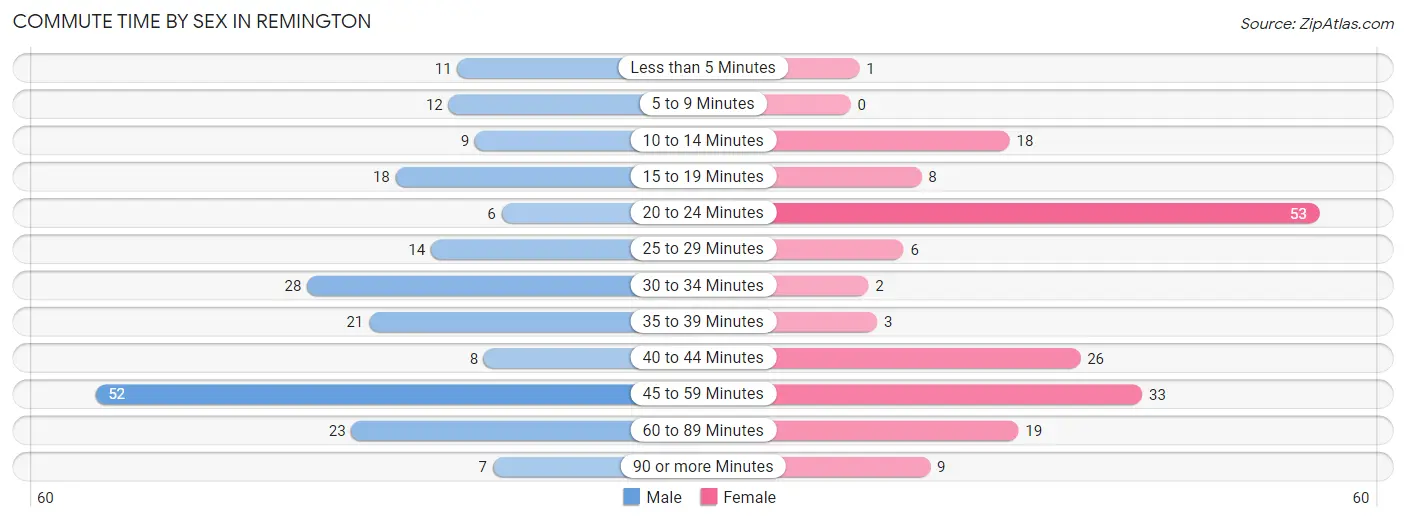
| Commute Time | Male | Female |
| Less than 5 Minutes | 11 (5.3%) | 1 (0.6%) |
| 5 to 9 Minutes | 12 (5.7%) | 0 (0.0%) |
| 10 to 14 Minutes | 9 (4.3%) | 18 (10.1%) |
| 15 to 19 Minutes | 18 (8.6%) | 8 (4.5%) |
| 20 to 24 Minutes | 6 (2.9%) | 53 (29.8%) |
| 25 to 29 Minutes | 14 (6.7%) | 6 (3.4%) |
| 30 to 34 Minutes | 28 (13.4%) | 2 (1.1%) |
| 35 to 39 Minutes | 21 (10.1%) | 3 (1.7%) |
| 40 to 44 Minutes | 8 (3.8%) | 26 (14.6%) |
| 45 to 59 Minutes | 52 (24.9%) | 33 (18.5%) |
| 60 to 89 Minutes | 23 (11.0%) | 19 (10.7%) |
| 90 or more Minutes | 7 (3.4%) | 9 (5.1%) |
Time of Departure to Work by Sex in Remington
The most frequent times of departure to work in Remington are 5:00 AM to 5:29 AM (52, 24.9%) for males and 6:00 AM to 6:29 AM (40, 22.5%) for females.
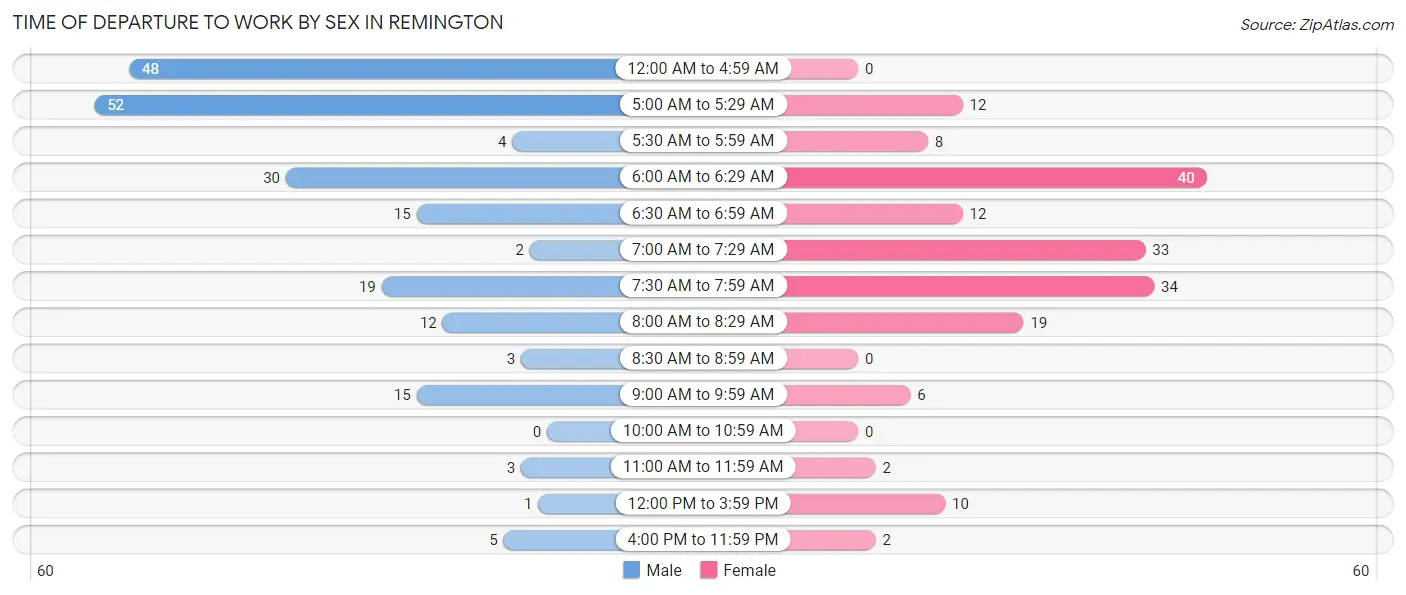
| Time of Departure | Male | Female |
| 12:00 AM to 4:59 AM | 48 (23.0%) | 0 (0.0%) |
| 5:00 AM to 5:29 AM | 52 (24.9%) | 12 (6.7%) |
| 5:30 AM to 5:59 AM | 4 (1.9%) | 8 (4.5%) |
| 6:00 AM to 6:29 AM | 30 (14.3%) | 40 (22.5%) |
| 6:30 AM to 6:59 AM | 15 (7.2%) | 12 (6.7%) |
| 7:00 AM to 7:29 AM | 2 (1.0%) | 33 (18.5%) |
| 7:30 AM to 7:59 AM | 19 (9.1%) | 34 (19.1%) |
| 8:00 AM to 8:29 AM | 12 (5.7%) | 19 (10.7%) |
| 8:30 AM to 8:59 AM | 3 (1.4%) | 0 (0.0%) |
| 9:00 AM to 9:59 AM | 15 (7.2%) | 6 (3.4%) |
| 10:00 AM to 10:59 AM | 0 (0.0%) | 0 (0.0%) |
| 11:00 AM to 11:59 AM | 3 (1.4%) | 2 (1.1%) |
| 12:00 PM to 3:59 PM | 1 (0.5%) | 10 (5.6%) |
| 4:00 PM to 11:59 PM | 5 (2.4%) | 2 (1.1%) |
| Total | 209 (100.0%) | 178 (100.0%) |
Housing Occupancy in Remington
Occupancy by Ownership in Remington
Of the total 302 dwellings in Remington, owner-occupied units account for 137 (45.4%), while renter-occupied units make up 165 (54.6%).
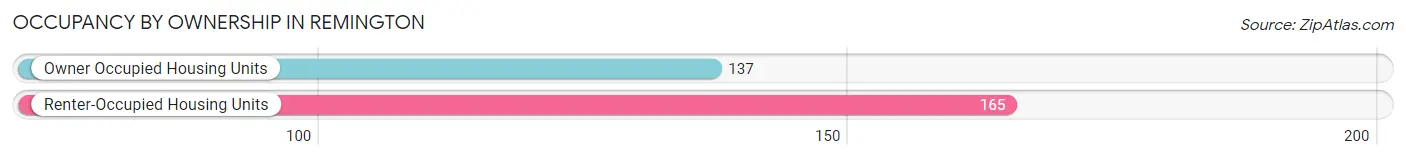
| Occupancy | # Housing Units | % Housing Units |
| Owner Occupied Housing Units | 137 | 45.4% |
| Renter-Occupied Housing Units | 165 | 54.6% |
| Total Occupied Housing Units | 302 | 100.0% |
Occupancy by Household Size in Remington
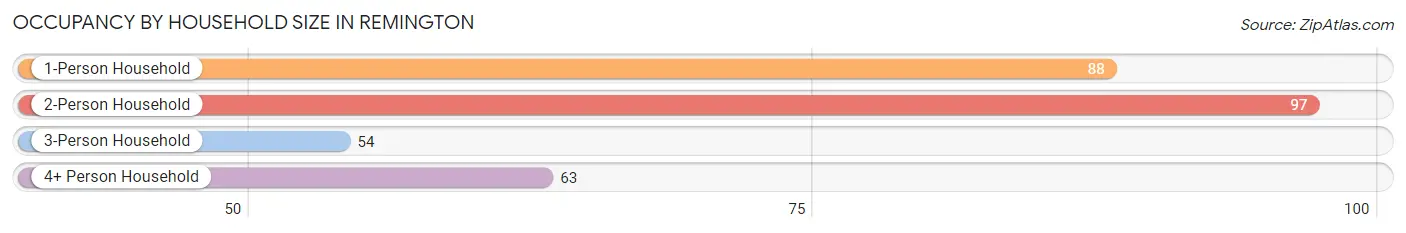
| Household Size | # Housing Units | % Housing Units |
| 1-Person Household | 88 | 29.1% |
| 2-Person Household | 97 | 32.1% |
| 3-Person Household | 54 | 17.9% |
| 4+ Person Household | 63 | 20.9% |
| Total Housing Units | 302 | 100.0% |
Occupancy by Ownership by Household Size in Remington
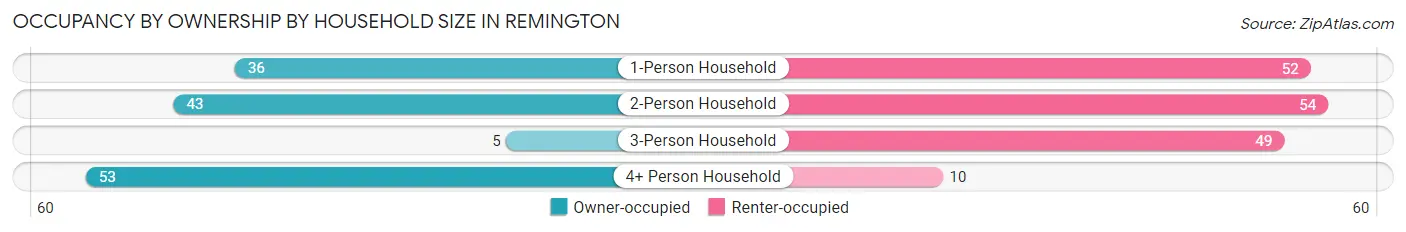
| Household Size | Owner-occupied | Renter-occupied |
| 1-Person Household | 36 (40.9%) | 52 (59.1%) |
| 2-Person Household | 43 (44.3%) | 54 (55.7%) |
| 3-Person Household | 5 (9.3%) | 49 (90.7%) |
| 4+ Person Household | 53 (84.1%) | 10 (15.9%) |
| Total Housing Units | 137 (45.4%) | 165 (54.6%) |
Occupancy by Educational Attainment in Remington
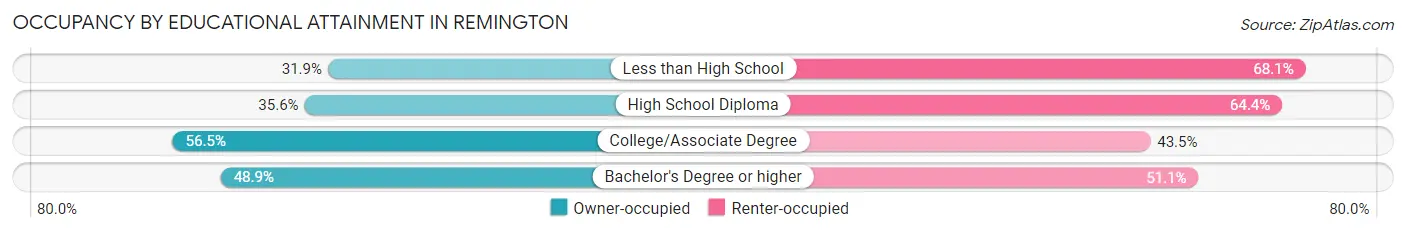
| Household Size | Owner-occupied | Renter-occupied |
| Less than High School | 15 (31.9%) | 32 (68.1%) |
| High School Diploma | 26 (35.6%) | 47 (64.4%) |
| College/Associate Degree | 52 (56.5%) | 40 (43.5%) |
| Bachelor's Degree or higher | 44 (48.9%) | 46 (51.1%) |
Occupancy by Age of Householder in Remington
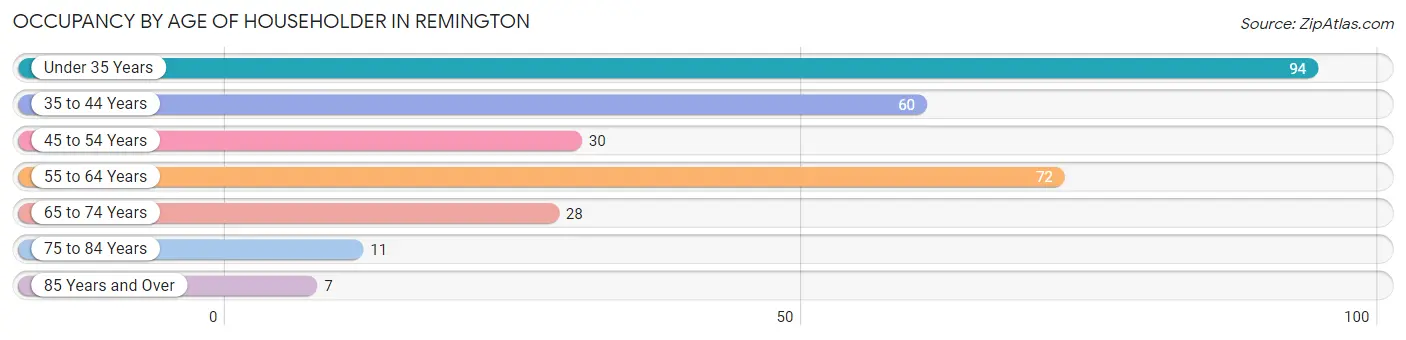
| Age Bracket | # Households | % Households |
| Under 35 Years | 94 | 31.1% |
| 35 to 44 Years | 60 | 19.9% |
| 45 to 54 Years | 30 | 9.9% |
| 55 to 64 Years | 72 | 23.8% |
| 65 to 74 Years | 28 | 9.3% |
| 75 to 84 Years | 11 | 3.6% |
| 85 Years and Over | 7 | 2.3% |
| Total | 302 | 100.0% |
Housing Finances in Remington
Median Income by Occupancy in Remington
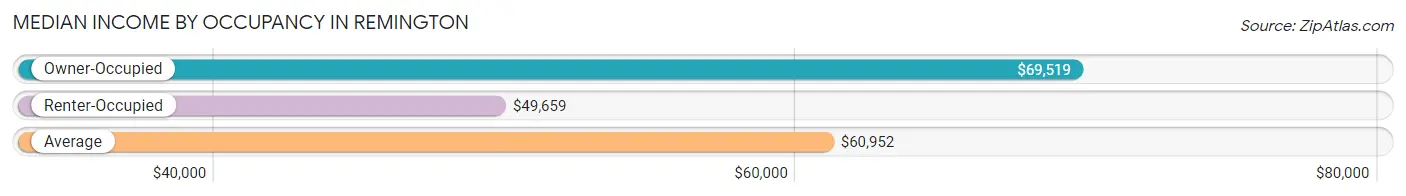
| Occupancy Type | # Households | Median Income |
| Owner-Occupied | 137 (45.4%) | $69,519 |
| Renter-Occupied | 165 (54.6%) | $49,659 |
| Average | 302 (100.0%) | $60,952 |
Occupancy by Householder Income Bracket in Remington
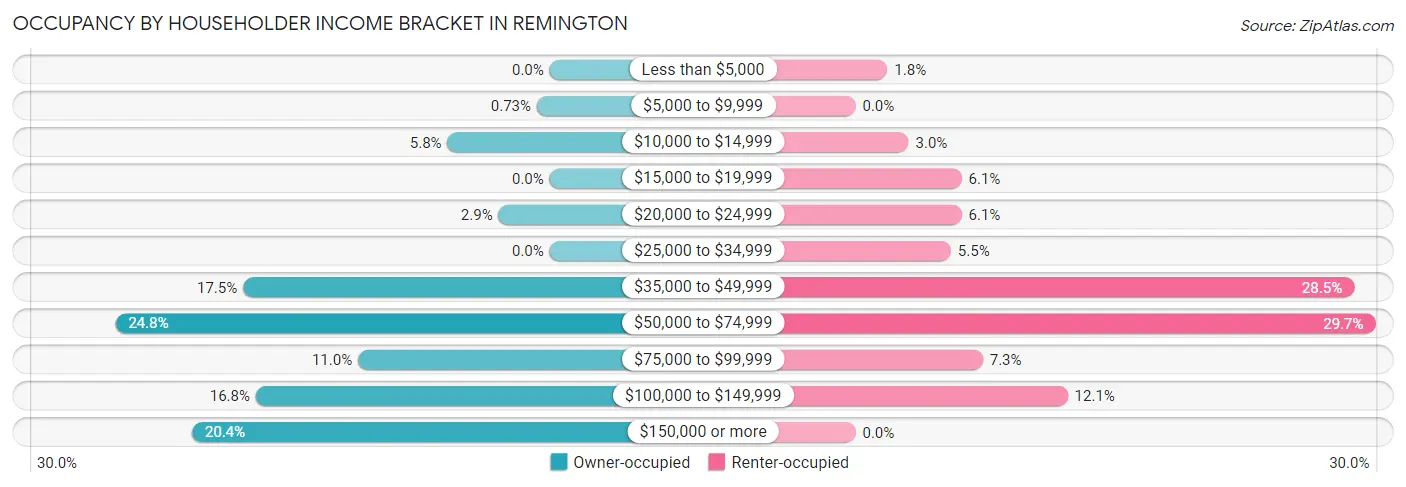
| Income Bracket | Owner-occupied | Renter-occupied |
| Less than $5,000 | 0 (0.0%) | 3 (1.8%) |
| $5,000 to $9,999 | 1 (0.7%) | 0 (0.0%) |
| $10,000 to $14,999 | 8 (5.8%) | 5 (3.0%) |
| $15,000 to $19,999 | 0 (0.0%) | 10 (6.1%) |
| $20,000 to $24,999 | 4 (2.9%) | 10 (6.1%) |
| $25,000 to $34,999 | 0 (0.0%) | 9 (5.4%) |
| $35,000 to $49,999 | 24 (17.5%) | 47 (28.5%) |
| $50,000 to $74,999 | 34 (24.8%) | 49 (29.7%) |
| $75,000 to $99,999 | 15 (11.0%) | 12 (7.3%) |
| $100,000 to $149,999 | 23 (16.8%) | 20 (12.1%) |
| $150,000 or more | 28 (20.4%) | 0 (0.0%) |
| Total | 137 (100.0%) | 165 (100.0%) |
Monthly Housing Cost Tiers in Remington
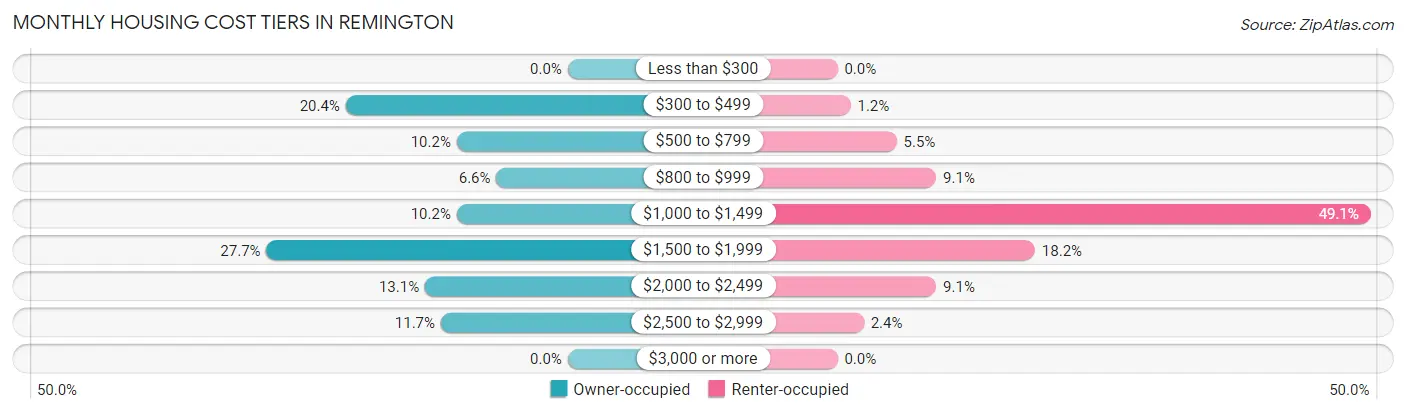
| Monthly Cost | Owner-occupied | Renter-occupied |
| Less than $300 | 0 (0.0%) | 0 (0.0%) |
| $300 to $499 | 28 (20.4%) | 2 (1.2%) |
| $500 to $799 | 14 (10.2%) | 9 (5.4%) |
| $800 to $999 | 9 (6.6%) | 15 (9.1%) |
| $1,000 to $1,499 | 14 (10.2%) | 81 (49.1%) |
| $1,500 to $1,999 | 38 (27.7%) | 30 (18.2%) |
| $2,000 to $2,499 | 18 (13.1%) | 15 (9.1%) |
| $2,500 to $2,999 | 16 (11.7%) | 4 (2.4%) |
| $3,000 or more | 0 (0.0%) | 0 (0.0%) |
| Total | 137 (100.0%) | 165 (100.0%) |
Physical Housing Characteristics in Remington
Housing Structures in Remington
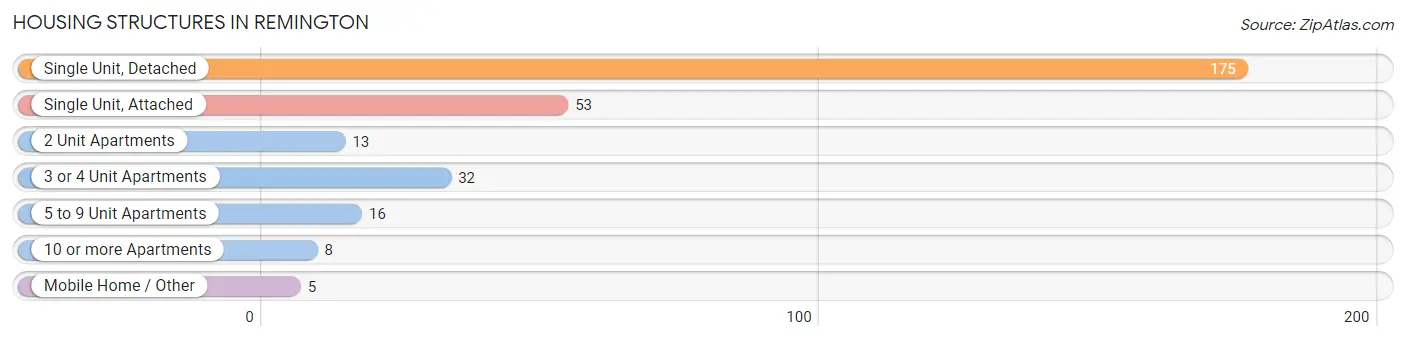
| Structure Type | # Housing Units | % Housing Units |
| Single Unit, Detached | 175 | 58.0% |
| Single Unit, Attached | 53 | 17.5% |
| 2 Unit Apartments | 13 | 4.3% |
| 3 or 4 Unit Apartments | 32 | 10.6% |
| 5 to 9 Unit Apartments | 16 | 5.3% |
| 10 or more Apartments | 8 | 2.6% |
| Mobile Home / Other | 5 | 1.7% |
| Total | 302 | 100.0% |
Housing Structures by Occupancy in Remington
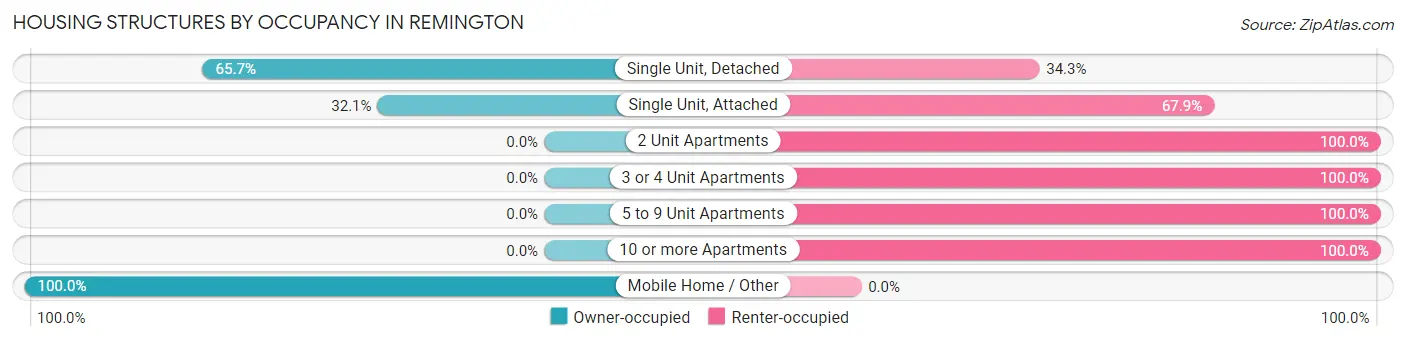
| Structure Type | Owner-occupied | Renter-occupied |
| Single Unit, Detached | 115 (65.7%) | 60 (34.3%) |
| Single Unit, Attached | 17 (32.1%) | 36 (67.9%) |
| 2 Unit Apartments | 0 (0.0%) | 13 (100.0%) |
| 3 or 4 Unit Apartments | 0 (0.0%) | 32 (100.0%) |
| 5 to 9 Unit Apartments | 0 (0.0%) | 16 (100.0%) |
| 10 or more Apartments | 0 (0.0%) | 8 (100.0%) |
| Mobile Home / Other | 5 (100.0%) | 0 (0.0%) |
| Total | 137 (45.4%) | 165 (54.6%) |
Housing Structures by Number of Rooms in Remington
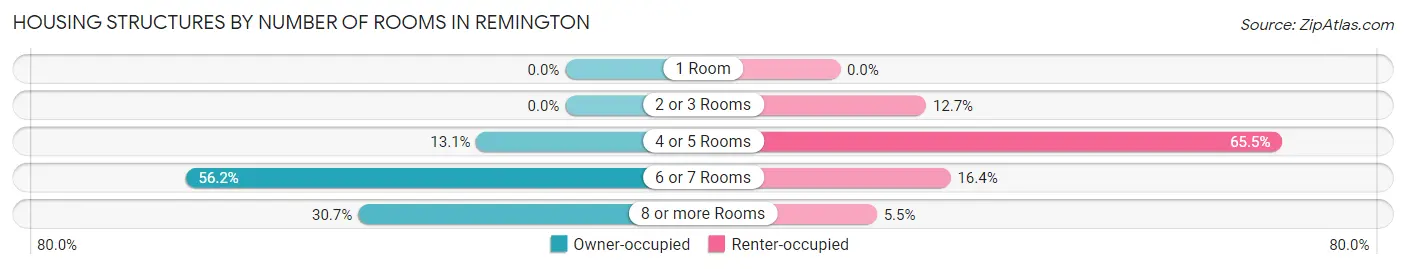
| Number of Rooms | Owner-occupied | Renter-occupied |
| 1 Room | 0 (0.0%) | 0 (0.0%) |
| 2 or 3 Rooms | 0 (0.0%) | 21 (12.7%) |
| 4 or 5 Rooms | 18 (13.1%) | 108 (65.4%) |
| 6 or 7 Rooms | 77 (56.2%) | 27 (16.4%) |
| 8 or more Rooms | 42 (30.7%) | 9 (5.4%) |
| Total | 137 (100.0%) | 165 (100.0%) |
Housing Structure by Heating Type in Remington
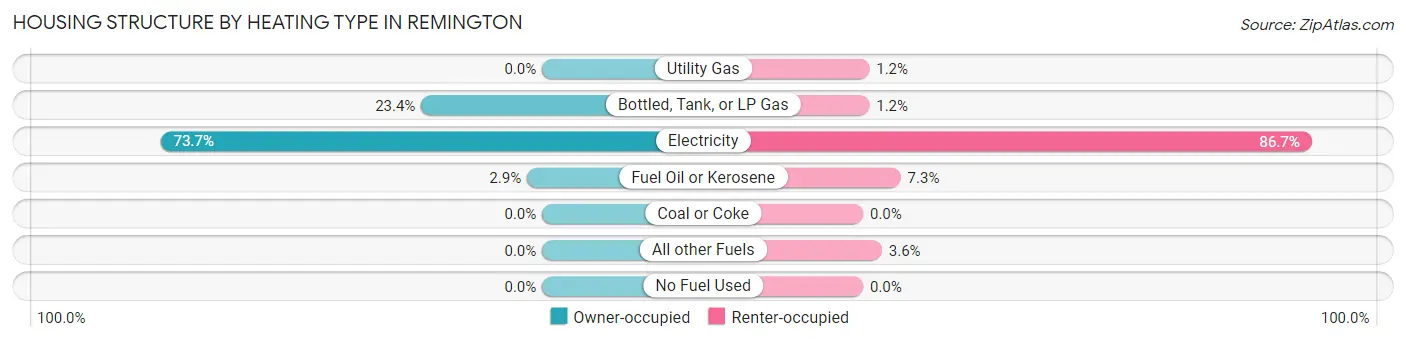
| Heating Type | Owner-occupied | Renter-occupied |
| Utility Gas | 0 (0.0%) | 2 (1.2%) |
| Bottled, Tank, or LP Gas | 32 (23.4%) | 2 (1.2%) |
| Electricity | 101 (73.7%) | 143 (86.7%) |
| Fuel Oil or Kerosene | 4 (2.9%) | 12 (7.3%) |
| Coal or Coke | 0 (0.0%) | 0 (0.0%) |
| All other Fuels | 0 (0.0%) | 6 (3.6%) |
| No Fuel Used | 0 (0.0%) | 0 (0.0%) |
| Total | 137 (100.0%) | 165 (100.0%) |
Household Vehicle Usage in Remington
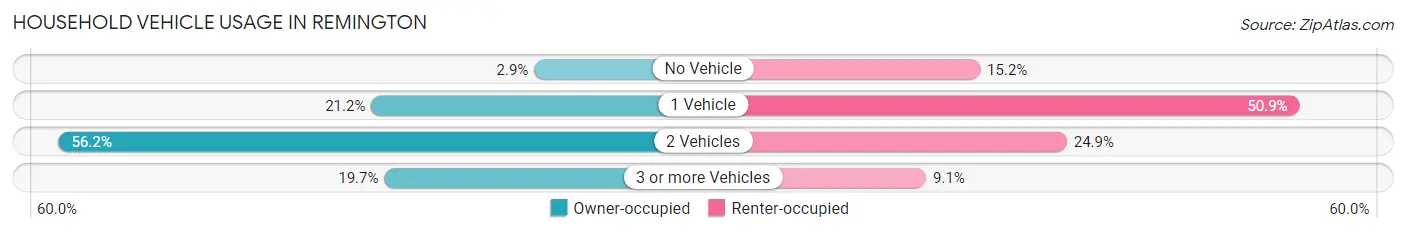
| Vehicles per Household | Owner-occupied | Renter-occupied |
| No Vehicle | 4 (2.9%) | 25 (15.1%) |
| 1 Vehicle | 29 (21.2%) | 84 (50.9%) |
| 2 Vehicles | 77 (56.2%) | 41 (24.8%) |
| 3 or more Vehicles | 27 (19.7%) | 15 (9.1%) |
| Total | 137 (100.0%) | 165 (100.0%) |
Real Estate & Mortgages in Remington
Real Estate and Mortgage Overview in Remington
| Characteristic | Without Mortgage | With Mortgage |
| Housing Units | 43 | 94 |
| Median Property Value | $297,500 | $310,400 |
| Median Household Income | $60,375 | $24 |
| Monthly Housing Costs | $454 | $0 |
| Real Estate Taxes | $1,786 | $2 |
Property Value by Mortgage Status in Remington
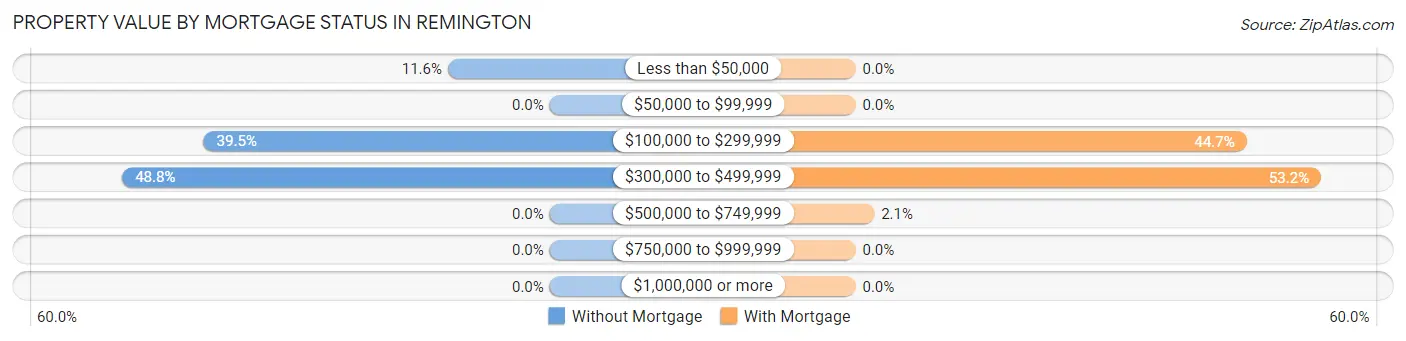
| Property Value | Without Mortgage | With Mortgage |
| Less than $50,000 | 5 (11.6%) | 0 (0.0%) |
| $50,000 to $99,999 | 0 (0.0%) | 0 (0.0%) |
| $100,000 to $299,999 | 17 (39.5%) | 42 (44.7%) |
| $300,000 to $499,999 | 21 (48.8%) | 50 (53.2%) |
| $500,000 to $749,999 | 0 (0.0%) | 2 (2.1%) |
| $750,000 to $999,999 | 0 (0.0%) | 0 (0.0%) |
| $1,000,000 or more | 0 (0.0%) | 0 (0.0%) |
| Total | 43 (100.0%) | 94 (100.0%) |
Household Income by Mortgage Status in Remington
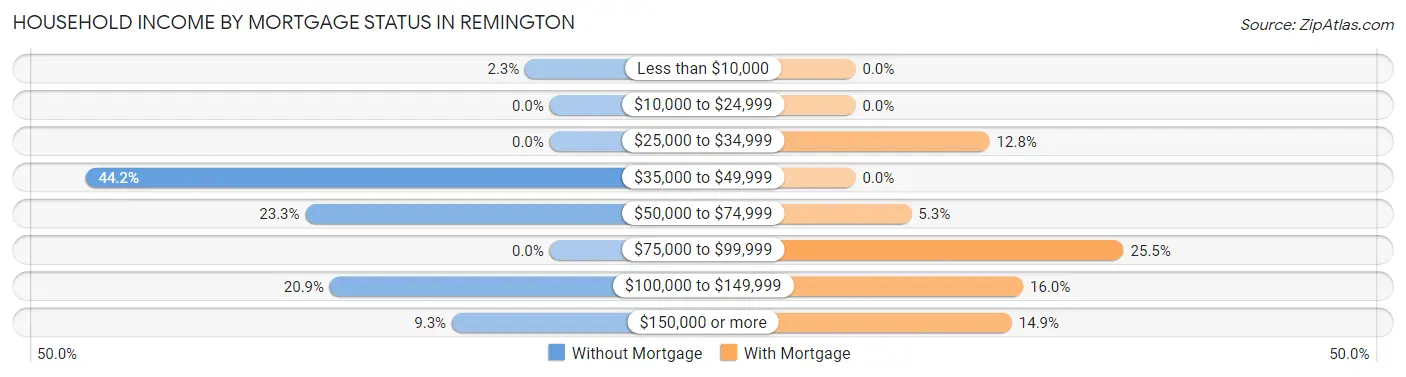
| Household Income | Without Mortgage | With Mortgage |
| Less than $10,000 | 1 (2.3%) | 0 (0.0%) |
| $10,000 to $24,999 | 0 (0.0%) | 0 (0.0%) |
| $25,000 to $34,999 | 0 (0.0%) | 12 (12.8%) |
| $35,000 to $49,999 | 19 (44.2%) | 0 (0.0%) |
| $50,000 to $74,999 | 10 (23.3%) | 5 (5.3%) |
| $75,000 to $99,999 | 0 (0.0%) | 24 (25.5%) |
| $100,000 to $149,999 | 9 (20.9%) | 15 (16.0%) |
| $150,000 or more | 4 (9.3%) | 14 (14.9%) |
| Total | 43 (100.0%) | 94 (100.0%) |
Property Value to Household Income Ratio in Remington
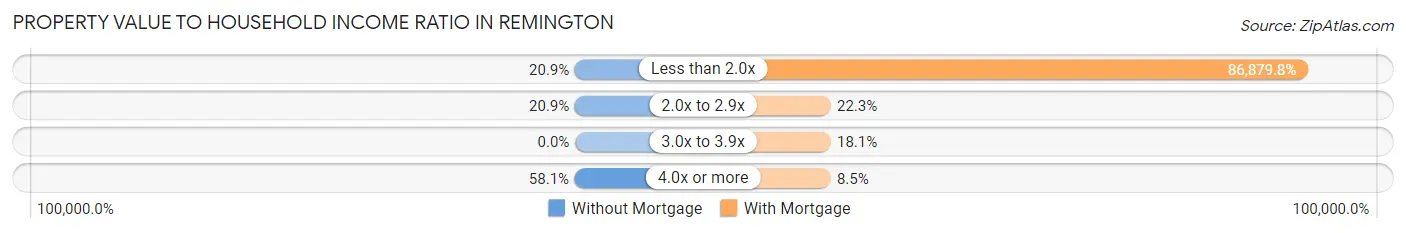
| Value-to-Income Ratio | Without Mortgage | With Mortgage |
| Less than 2.0x | 9 (20.9%) | 81,667 (86,879.8%) |
| 2.0x to 2.9x | 9 (20.9%) | 21 (22.3%) |
| 3.0x to 3.9x | 0 (0.0%) | 17 (18.1%) |
| 4.0x or more | 25 (58.1%) | 8 (8.5%) |
| Total | 43 (100.0%) | 94 (100.0%) |
Real Estate Taxes by Mortgage Status in Remington
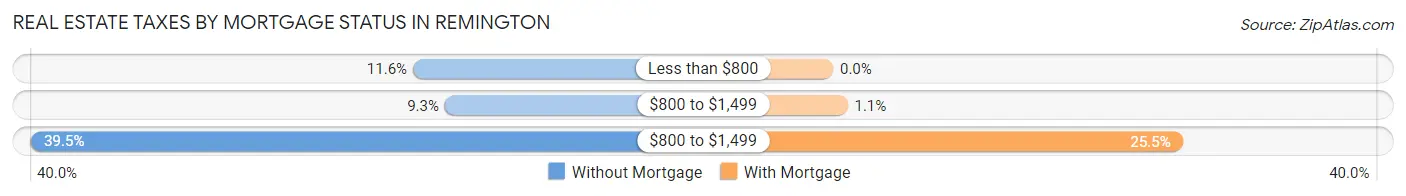
| Property Taxes | Without Mortgage | With Mortgage |
| Less than $800 | 5 (11.6%) | 0 (0.0%) |
| $800 to $1,499 | 4 (9.3%) | 1 (1.1%) |
| $800 to $1,499 | 17 (39.5%) | 24 (25.5%) |
| Total | 43 (100.0%) | 94 (100.0%) |
Health & Disability in Remington
Health Insurance Coverage by Age in Remington
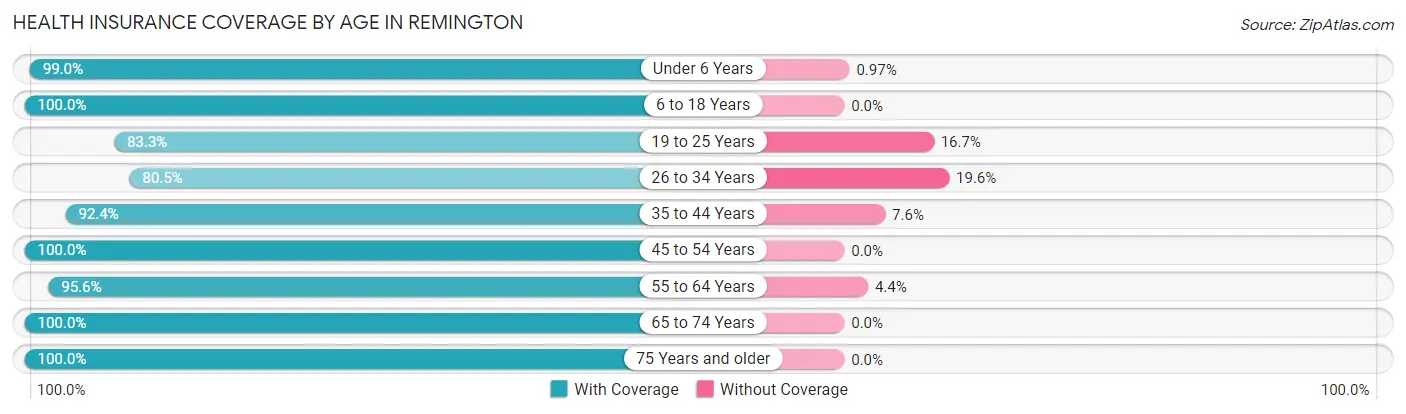
| Age Bracket | With Coverage | Without Coverage |
| Under 6 Years | 102 (99.0%) | 1 (1.0%) |
| 6 to 18 Years | 185 (100.0%) | 0 (0.0%) |
| 19 to 25 Years | 60 (83.3%) | 12 (16.7%) |
| 26 to 34 Years | 107 (80.4%) | 26 (19.6%) |
| 35 to 44 Years | 97 (92.4%) | 8 (7.6%) |
| 45 to 54 Years | 68 (100.0%) | 0 (0.0%) |
| 55 to 64 Years | 108 (95.6%) | 5 (4.4%) |
| 65 to 74 Years | 28 (100.0%) | 0 (0.0%) |
| 75 Years and older | 29 (100.0%) | 0 (0.0%) |
| Total | 784 (93.8%) | 52 (6.2%) |
Health Insurance Coverage by Citizenship Status in Remington
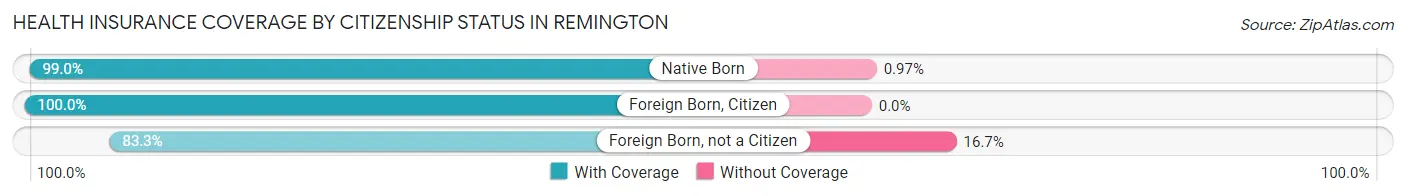
| Citizenship Status | With Coverage | Without Coverage |
| Native Born | 102 (99.0%) | 1 (1.0%) |
| Foreign Born, Citizen | 185 (100.0%) | 0 (0.0%) |
| Foreign Born, not a Citizen | 60 (83.3%) | 12 (16.7%) |
Health Insurance Coverage by Household Income in Remington
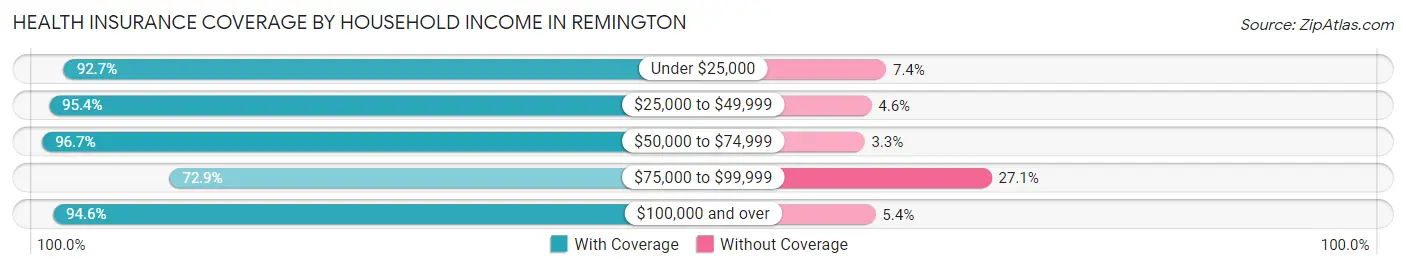
| Household Income | With Coverage | Without Coverage |
| Under $25,000 | 63 (92.6%) | 5 (7.3%) |
| $25,000 to $49,999 | 228 (95.4%) | 11 (4.6%) |
| $50,000 to $74,999 | 234 (96.7%) | 8 (3.3%) |
| $75,000 to $99,999 | 43 (72.9%) | 16 (27.1%) |
| $100,000 and over | 212 (94.6%) | 12 (5.4%) |
Public vs Private Health Insurance Coverage by Age in Remington
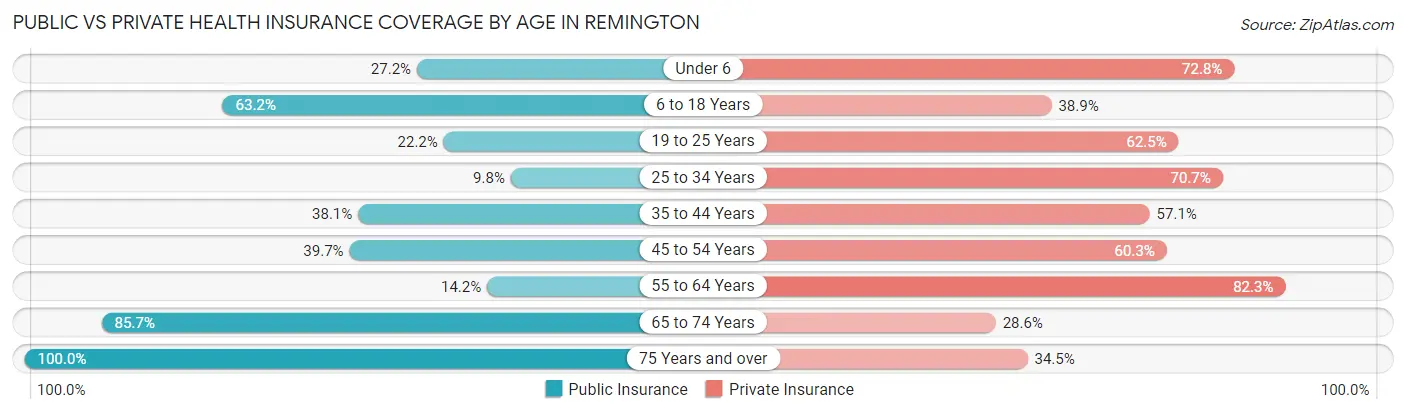
| Age Bracket | Public Insurance | Private Insurance |
| Under 6 | 28 (27.2%) | 75 (72.8%) |
| 6 to 18 Years | 117 (63.2%) | 72 (38.9%) |
| 19 to 25 Years | 16 (22.2%) | 45 (62.5%) |
| 25 to 34 Years | 13 (9.8%) | 94 (70.7%) |
| 35 to 44 Years | 40 (38.1%) | 60 (57.1%) |
| 45 to 54 Years | 27 (39.7%) | 41 (60.3%) |
| 55 to 64 Years | 16 (14.2%) | 93 (82.3%) |
| 65 to 74 Years | 24 (85.7%) | 8 (28.6%) |
| 75 Years and over | 29 (100.0%) | 10 (34.5%) |
| Total | 310 (37.1%) | 498 (59.6%) |
Disability Status by Sex by Age in Remington
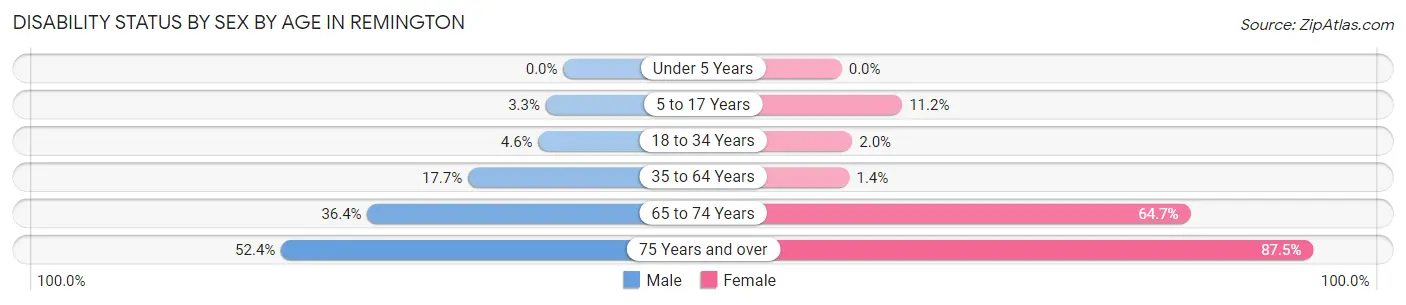
| Age Bracket | Male | Female |
| Under 5 Years | 0 (0.0%) | 0 (0.0%) |
| 5 to 17 Years | 3 (3.3%) | 11 (11.2%) |
| 18 to 34 Years | 5 (4.6%) | 2 (2.0%) |
| 35 to 64 Years | 26 (17.7%) | 2 (1.4%) |
| 65 to 74 Years | 4 (36.4%) | 11 (64.7%) |
| 75 Years and over | 11 (52.4%) | 7 (87.5%) |
Disability Class by Sex by Age in Remington
Disability Class: Hearing Difficulty
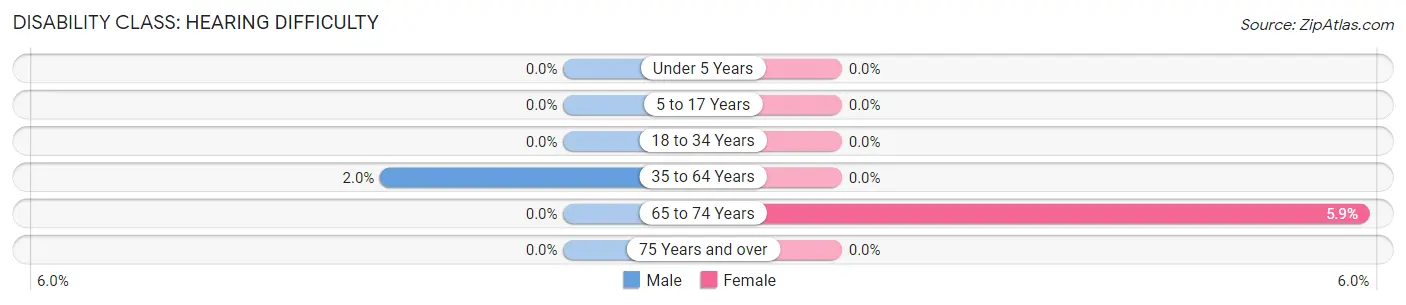
| Age Bracket | Male | Female |
| Under 5 Years | 0 (0.0%) | 0 (0.0%) |
| 5 to 17 Years | 0 (0.0%) | 0 (0.0%) |
| 18 to 34 Years | 0 (0.0%) | 0 (0.0%) |
| 35 to 64 Years | 3 (2.0%) | 0 (0.0%) |
| 65 to 74 Years | 0 (0.0%) | 1 (5.9%) |
| 75 Years and over | 0 (0.0%) | 0 (0.0%) |
Disability Class: Vision Difficulty
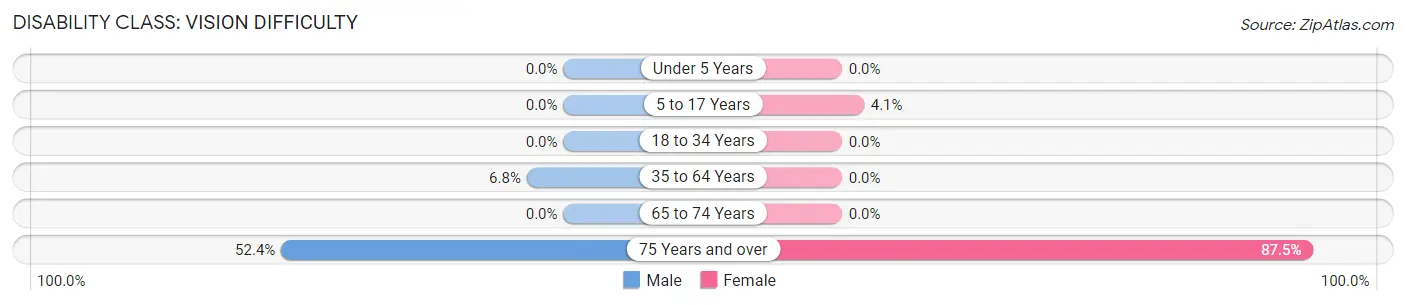
| Age Bracket | Male | Female |
| Under 5 Years | 0 (0.0%) | 0 (0.0%) |
| 5 to 17 Years | 0 (0.0%) | 4 (4.1%) |
| 18 to 34 Years | 0 (0.0%) | 0 (0.0%) |
| 35 to 64 Years | 10 (6.8%) | 0 (0.0%) |
| 65 to 74 Years | 0 (0.0%) | 0 (0.0%) |
| 75 Years and over | 11 (52.4%) | 7 (87.5%) |
Disability Class: Cognitive Difficulty
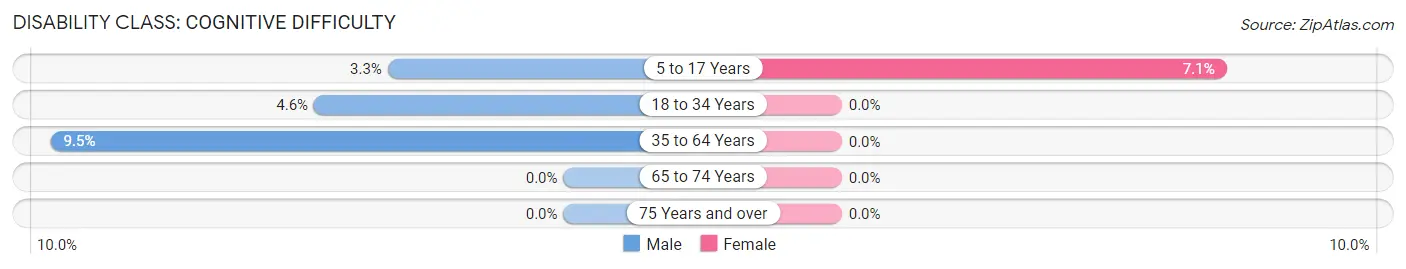
| Age Bracket | Male | Female |
| 5 to 17 Years | 3 (3.3%) | 7 (7.1%) |
| 18 to 34 Years | 5 (4.6%) | 0 (0.0%) |
| 35 to 64 Years | 14 (9.5%) | 0 (0.0%) |
| 65 to 74 Years | 0 (0.0%) | 0 (0.0%) |
| 75 Years and over | 0 (0.0%) | 0 (0.0%) |
Disability Class: Ambulatory Difficulty
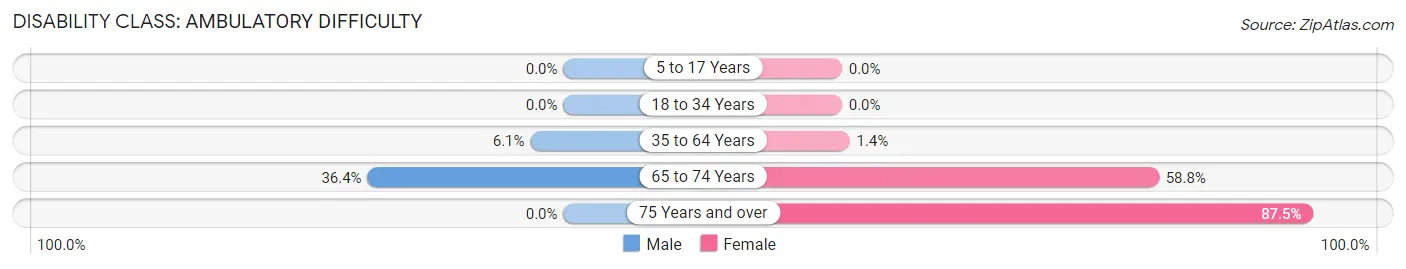
| Age Bracket | Male | Female |
| 5 to 17 Years | 0 (0.0%) | 0 (0.0%) |
| 18 to 34 Years | 0 (0.0%) | 0 (0.0%) |
| 35 to 64 Years | 9 (6.1%) | 2 (1.4%) |
| 65 to 74 Years | 4 (36.4%) | 10 (58.8%) |
| 75 Years and over | 0 (0.0%) | 7 (87.5%) |
Disability Class: Self-Care Difficulty
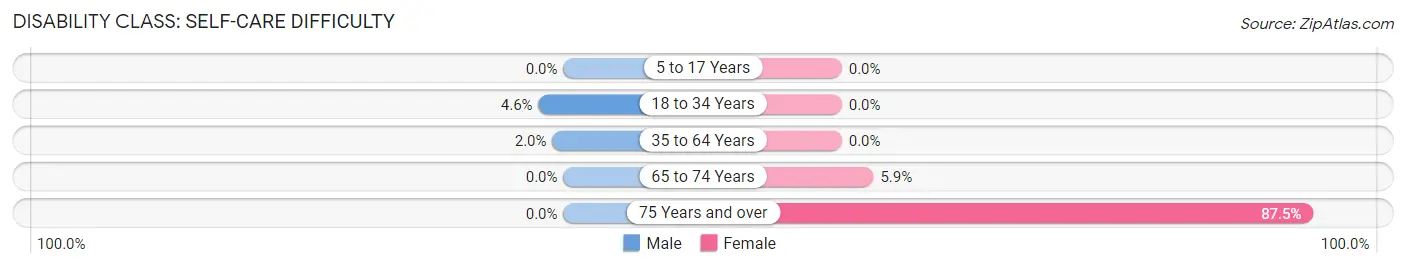
| Age Bracket | Male | Female |
| 5 to 17 Years | 0 (0.0%) | 0 (0.0%) |
| 18 to 34 Years | 5 (4.6%) | 0 (0.0%) |
| 35 to 64 Years | 3 (2.0%) | 0 (0.0%) |
| 65 to 74 Years | 0 (0.0%) | 1 (5.9%) |
| 75 Years and over | 0 (0.0%) | 7 (87.5%) |
Technology Access in Remington
Computing Device Access in Remington
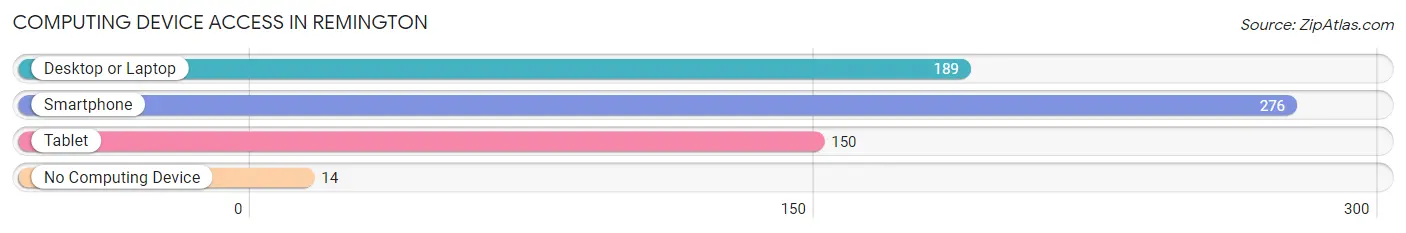
| Device Type | # Households | % Households |
| Desktop or Laptop | 189 | 62.6% |
| Smartphone | 276 | 91.4% |
| Tablet | 150 | 49.7% |
| No Computing Device | 14 | 4.6% |
| Total | 302 | 100.0% |
Internet Access in Remington
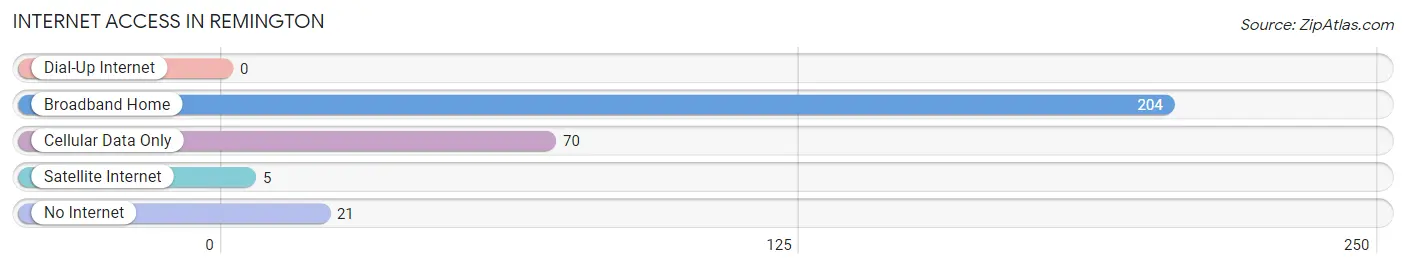
| Internet Type | # Households | % Households |
| Dial-Up Internet | 0 | 0.0% |
| Broadband Home | 204 | 67.5% |
| Cellular Data Only | 70 | 23.2% |
| Satellite Internet | 5 | 1.7% |
| No Internet | 21 | 7.0% |
| Total | 302 | 100.0% |
Remington Summary
Remington, Virginia is a small town located in Fauquier County, Virginia. It is situated in the foothills of the Blue Ridge Mountains, approximately 40 miles west of Washington, D.C. The town has a population of 1,845 people, according to the 2010 census.
History
Remington was founded in 1790 by William Remington, a Revolutionary War veteran. The town was originally known as Remington’s Crossroads, and was a popular stop for travelers on the Great Wagon Road. In 1810, the town was officially incorporated as Remington.
The town was an important stop on the Orange and Alexandria Railroad, which connected Washington, D.C. to the Shenandoah Valley. The railroad was a major factor in the town’s growth and development. In the late 19th century, Remington was a thriving agricultural center, with a number of mills and factories.
Geography
Remington is located in the foothills of the Blue Ridge Mountains, approximately 40 miles west of Washington, D.C. The town is situated on the banks of the Rappahannock River, and is surrounded by rolling hills and farmland. The town is located in the humid subtropical climate zone, and experiences hot, humid summers and mild winters.
Economy
Remington’s economy is largely based on agriculture and tourism. The town is home to a number of farms, which produce a variety of crops, including corn, soybeans, wheat, and hay. The town is also home to a number of wineries, which attract visitors from all over the region.
In addition to agriculture and tourism, Remington is home to a number of small businesses, including restaurants, shops, and services. The town is also home to a number of manufacturing companies, which produce a variety of products, including furniture, clothing, and electronics.
Demographics
According to the 2010 census, Remington has a population of 1,845 people. The town is predominantly white, with a population that is 94.3% white, 2.2% African American, 0.7% Asian, and 0.7% Hispanic or Latino. The median household income in Remington is $50,945, and the median home value is $220,000.
Remington is a small, rural town with a rich history and a vibrant economy. The town is home to a number of farms, wineries, and small businesses, and is a popular destination for tourists and visitors. The town is also home to a diverse population, with a variety of backgrounds and cultures.
Common Questions
What is Per Capita Income in Remington?
Per Capita income in Remington is $33,772.
What is the Median Family Income in Remington?
Median Family Income in Remington is $68,750.
What is the Median Household income in Remington?
Median Household Income in Remington is $60,952.
What is Income or Wage Gap in Remington?
Income or Wage Gap in Remington is 10.2%.
Women in Remington earn 89.8 cents for every dollar earned by a man.
What is Inequality or Gini Index in Remington?
Inequality or Gini Index in Remington is 0.47.
What is the Total Population of Remington?
Total Population of Remington is 836.
What is the Total Male Population of Remington?
Total Male Population of Remington is 423.
What is the Total Female Population of Remington?
Total Female Population of Remington is 413.
What is the Ratio of Males per 100 Females in Remington?
There are 102.42 Males per 100 Females in Remington.
What is the Ratio of Females per 100 Males in Remington?
There are 97.64 Females per 100 Males in Remington.
What is the Median Population Age in Remington?
Median Population Age in Remington is 29.1 Years.
What is the Average Family Size in Remington
Average Family Size in Remington is 3.6 People.
What is the Average Household Size in Remington
Average Household Size in Remington is 2.8 People.
How Large is the Labor Force in Remington?
There are 448 People in the Labor Forcein in Remington.
What is the Percentage of People in the Labor Force in Remington?
78.7% of People are in the Labor Force in Remington.
What is the Unemployment Rate in Remington?
Unemployment Rate in Remington is 4.7%.