Prince George, VA Map & Demographics
Prince George Map
Prince George Overview
$29,675
PER CAPITA INCOME
$76,038
AVG FAMILY INCOME
$75,991
AVG HOUSEHOLD INCOME
37.9%
WAGE / INCOME GAP [ % ]
62.1¢/ $1
WAGE / INCOME GAP [ $ ]
0.28
INEQUALITY / GINI INDEX
1,964
TOTAL POPULATION
781
MALE POPULATION
1,183
FEMALE POPULATION
66.02
MALES / 100 FEMALES
151.47
FEMALES / 100 MALES
34.4
MEDIAN AGE
3.4
AVG FAMILY SIZE
2.8
AVG HOUSEHOLD SIZE
991
LABOR FORCE [ PEOPLE ]
66.4%
PERCENT IN LABOR FORCE
Prince George Zip Codes
Prince George Area Codes
Income in Prince George
Income Overview in Prince George
Per Capita Income in Prince George is $29,675, while median incomes of families and households are $76,038 and $75,991 respectively.
| Characteristic | Number | Measure |
| Per Capita Income | 1,964 | $29,675 |
| Median Family Income | 492 | $76,038 |
| Mean Family Income | 492 | $67,125 |
| Median Household Income | 706 | $75,991 |
| Mean Household Income | 706 | $76,205 |
| Income Deficit | 492 | $0 |
| Wage / Income Gap (%) | 1,964 | 37.88% |
| Wage / Income Gap ($) | 1,964 | 62.12¢ per $1 |
| Gini / Inequality Index | 1,964 | 0.28 |
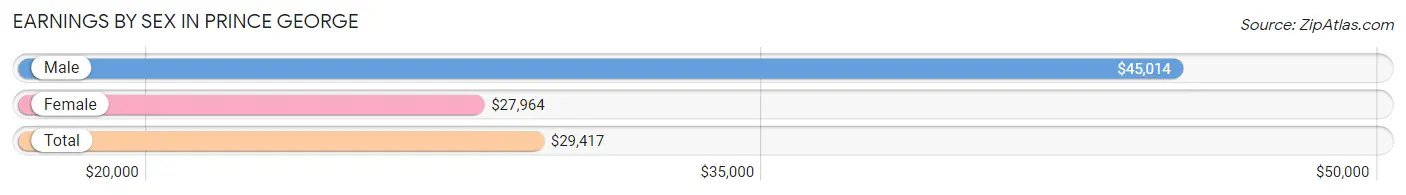
Earnings by Sex in Prince George
Average Earnings in Prince George are $29,417, $45,014 for men and $27,964 for women, a difference of 37.9%.
| Sex | Number | Average Earnings |
| Male | 375 (34.7%) | $45,014 |
| Female | 704 (65.2%) | $27,964 |
| Total | 1,079 (100.0%) | $29,417 |
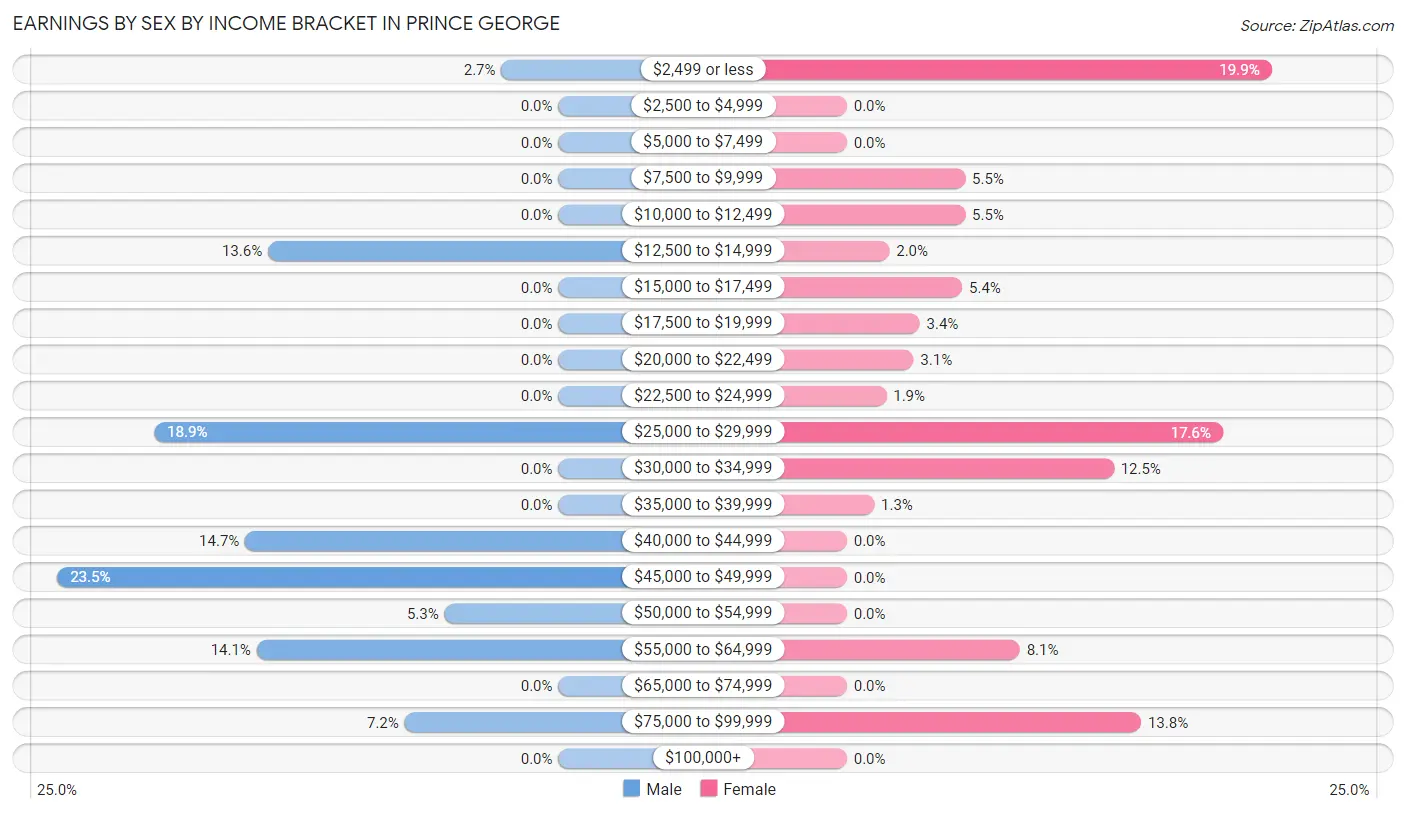
Earnings by Sex by Income Bracket in Prince George
The most common earnings brackets in Prince George are $45,000 to $49,999 for men (88 | 23.5%) and $2,499 or less for women (140 | 19.9%).
| Income | Male | Female |
| $2,499 or less | 10 (2.7%) | 140 (19.9%) |
| $2,500 to $4,999 | 0 (0.0%) | 0 (0.0%) |
| $5,000 to $7,499 | 0 (0.0%) | 0 (0.0%) |
| $7,500 to $9,999 | 0 (0.0%) | 39 (5.5%) |
| $10,000 to $12,499 | 0 (0.0%) | 39 (5.5%) |
| $12,500 to $14,999 | 51 (13.6%) | 14 (2.0%) |
| $15,000 to $17,499 | 0 (0.0%) | 38 (5.4%) |
| $17,500 to $19,999 | 0 (0.0%) | 24 (3.4%) |
| $20,000 to $22,499 | 0 (0.0%) | 22 (3.1%) |
| $22,500 to $24,999 | 0 (0.0%) | 13 (1.8%) |
| $25,000 to $29,999 | 71 (18.9%) | 124 (17.6%) |
| $30,000 to $34,999 | 0 (0.0%) | 88 (12.5%) |
| $35,000 to $39,999 | 0 (0.0%) | 9 (1.3%) |
| $40,000 to $44,999 | 55 (14.7%) | 0 (0.0%) |
| $45,000 to $49,999 | 88 (23.5%) | 0 (0.0%) |
| $50,000 to $54,999 | 20 (5.3%) | 0 (0.0%) |
| $55,000 to $64,999 | 53 (14.1%) | 57 (8.1%) |
| $65,000 to $74,999 | 0 (0.0%) | 0 (0.0%) |
| $75,000 to $99,999 | 27 (7.2%) | 97 (13.8%) |
| $100,000+ | 0 (0.0%) | 0 (0.0%) |
| Total | 375 (100.0%) | 704 (100.0%) |
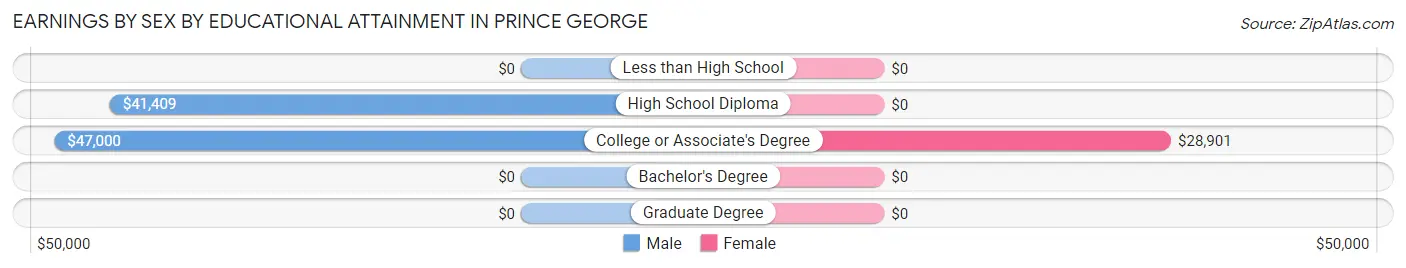
Earnings by Sex by Educational Attainment in Prince George
Average earnings in Prince George are $45,526 for men and $29,526 for women, a difference of 35.1%. Men with an educational attainment of college or associate's degree enjoy the highest average annual earnings of $47,000, while those with high school diploma education earn the least with $41,409. Women with an educational attainment of college or associate's degree earn the most with the average annual earnings of $28,901, while those with college or associate's degree education have the smallest earnings of $28,901.
| Educational Attainment | Male Income | Female Income |
| Less than High School | - | - |
| High School Diploma | $41,409 | $0 |
| College or Associate's Degree | $47,000 | $28,901 |
| Bachelor's Degree | - | - |
| Graduate Degree | - | - |
| Total | $45,526 | $29,526 |
Family Income in Prince George
Family Income Brackets in Prince George
According to the Prince George family income data, there are 194 families falling into the $75,000 to $99,999 income range, which is the most common income bracket and makes up 39.4% of all families.
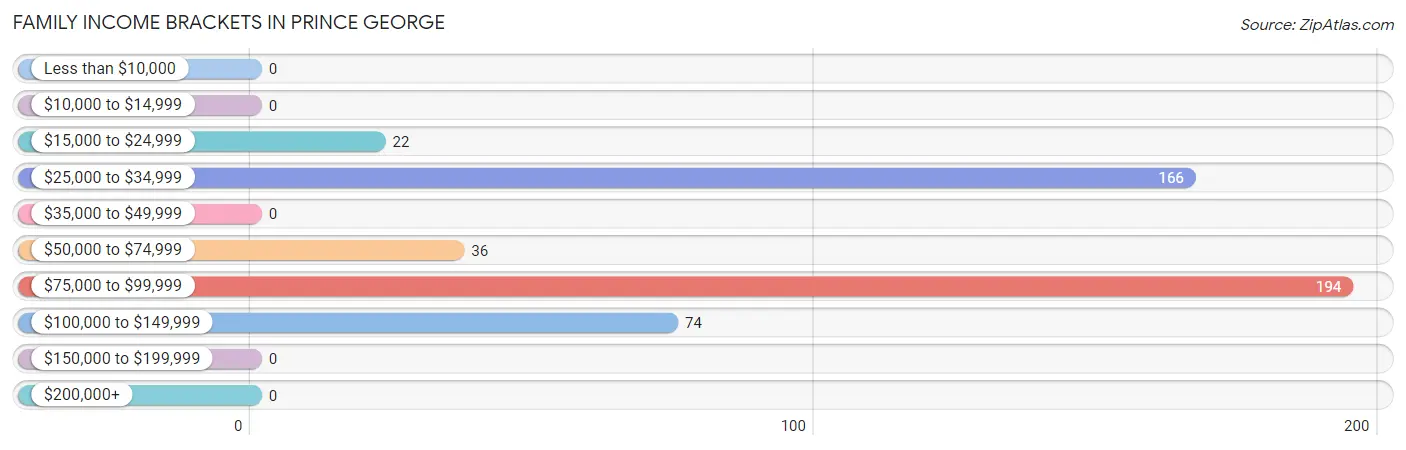
| Income Bracket | # Families | % Families |
| Less than $10,000 | 0 | 0.0% |
| $10,000 to $14,999 | 0 | 0.0% |
| $15,000 to $24,999 | 22 | 4.5% |
| $25,000 to $34,999 | 166 | 33.7% |
| $35,000 to $49,999 | 0 | 0.0% |
| $50,000 to $74,999 | 36 | 7.3% |
| $75,000 to $99,999 | 194 | 39.4% |
| $100,000 to $149,999 | 74 | 15.0% |
| $150,000 to $199,999 | 0 | 0.0% |
| $200,000+ | 0 | 0.0% |
Family Income by Famaliy Size in Prince George
2-person families (178 | 36.2%) account for the highest median family income in Prince George with $81,250 per family, while 2-person families (178 | 36.2%) have the highest median income of $40,625 per family member.
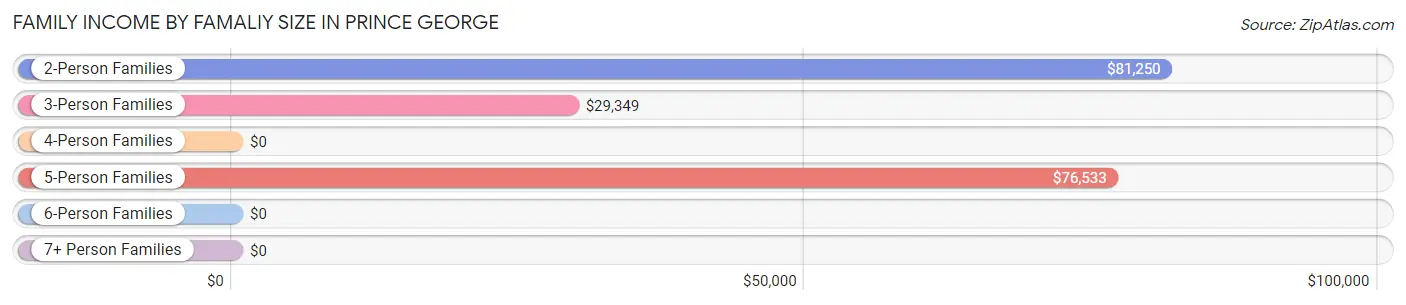
| Income Bracket | # Families | Median Income |
| 2-Person Families | 178 (36.2%) | $81,250 |
| 3-Person Families | 149 (30.3%) | $29,349 |
| 4-Person Families | 76 (15.4%) | $0 |
| 5-Person Families | 89 (18.1%) | $76,533 |
| 6-Person Families | 0 (0.0%) | $0 |
| 7+ Person Families | 0 (0.0%) | $0 |
| Total | 492 (100.0%) | $76,038 |
Family Income by Number of Earners in Prince George
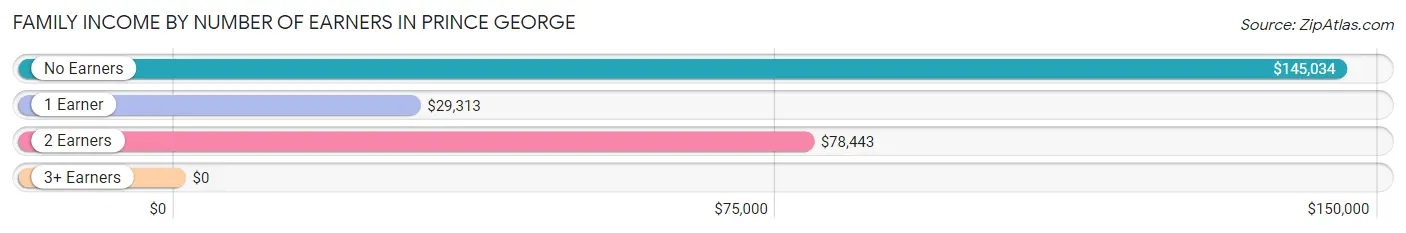
| Number of Earners | # Families | Median Income |
| No Earners | 73 (14.8%) | $145,034 |
| 1 Earner | 171 (34.8%) | $29,313 |
| 2 Earners | 146 (29.7%) | $78,443 |
| 3+ Earners | 102 (20.7%) | $0 |
| Total | 492 (100.0%) | $76,038 |
Household Income in Prince George
Household Income Brackets in Prince George
With 194 households falling in the category, the $75,000 to $99,999 income range is the most frequent in Prince George, accounting for 27.5% of all households.
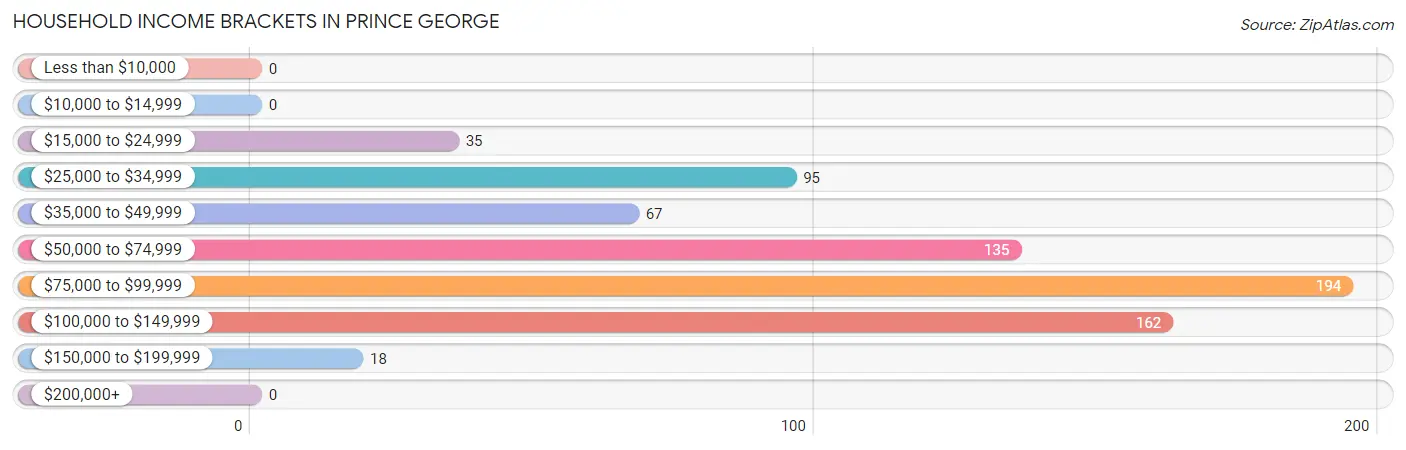
| Income Bracket | # Households | % Households |
| Less than $10,000 | 0 | 0.0% |
| $10,000 to $14,999 | 0 | 0.0% |
| $15,000 to $24,999 | 35 | 5.0% |
| $25,000 to $34,999 | 95 | 13.5% |
| $35,000 to $49,999 | 67 | 9.5% |
| $50,000 to $74,999 | 135 | 19.1% |
| $75,000 to $99,999 | 194 | 27.5% |
| $100,000 to $149,999 | 162 | 22.9% |
| $150,000 to $199,999 | 18 | 2.5% |
| $200,000+ | 0 | 0.0% |
Household Income by Householder Age in Prince George
The median household income in Prince George is $75,991, with the highest median household income of $90,260 found in the 45 to 64 years age bracket for the primary householder. A total of 117 households (16.6%) fall into this category.
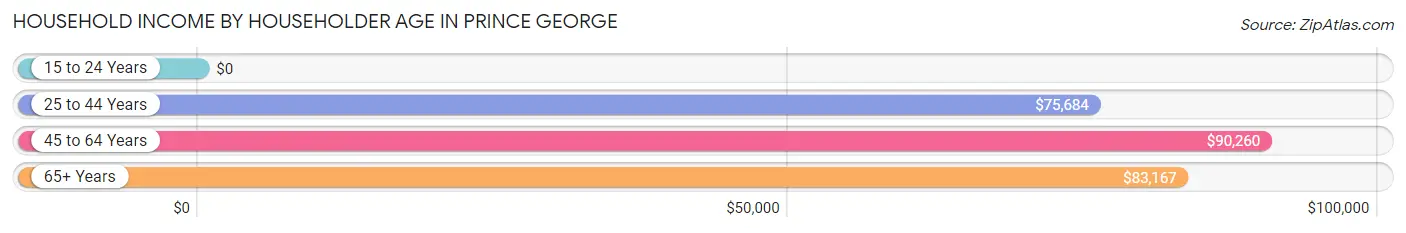
| Income Bracket | # Households | Median Income |
| 15 to 24 Years | 0 (0.0%) | $0 |
| 25 to 44 Years | 363 (51.4%) | $75,684 |
| 45 to 64 Years | 117 (16.6%) | $90,260 |
| 65+ Years | 226 (32.0%) | $83,167 |
| Total | 706 (100.0%) | $75,991 |
Poverty in Prince George
Income Below Poverty by Sex and Age in Prince George
With 7.3% poverty level for males and 9.4% for females among the residents of Prince George, under 5 year old males and 15 year old females are the most vulnerable to poverty, with 26 males (100.0%) and 32 females (100.0%) in their respective age groups living below the poverty level.
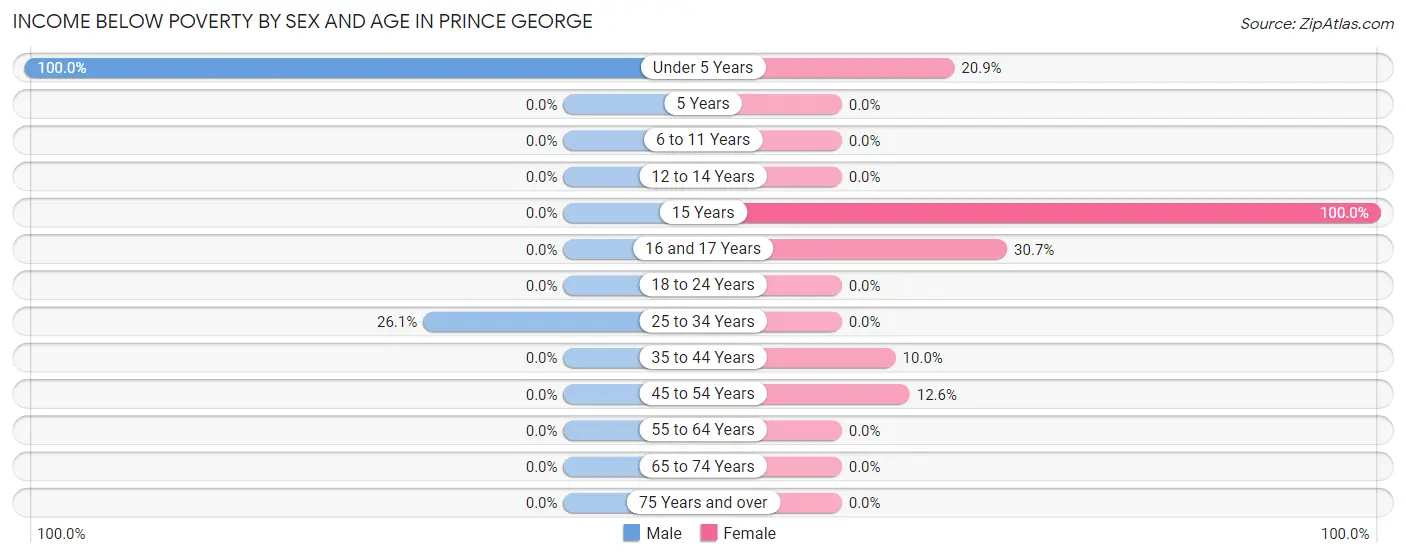
| Age Bracket | Male | Female |
| Under 5 Years | 26 (100.0%) | 14 (20.9%) |
| 5 Years | 0 (0.0%) | 0 (0.0%) |
| 6 to 11 Years | 0 (0.0%) | 0 (0.0%) |
| 12 to 14 Years | 0 (0.0%) | 0 (0.0%) |
| 15 Years | 0 (0.0%) | 32 (100.0%) |
| 16 and 17 Years | 0 (0.0%) | 31 (30.7%) |
| 18 to 24 Years | 0 (0.0%) | 0 (0.0%) |
| 25 to 34 Years | 31 (26.1%) | 0 (0.0%) |
| 35 to 44 Years | 0 (0.0%) | 22 (10.0%) |
| 45 to 54 Years | 0 (0.0%) | 12 (12.6%) |
| 55 to 64 Years | 0 (0.0%) | 0 (0.0%) |
| 65 to 74 Years | 0 (0.0%) | 0 (0.0%) |
| 75 Years and over | 0 (0.0%) | 0 (0.0%) |
| Total | 57 (7.3%) | 111 (9.4%) |
Income Above Poverty by Sex and Age in Prince George
According to the poverty statistics in Prince George, males aged 5 years and females aged 6 to 11 years are the age groups that are most secure financially, with 100.0% of males and 100.0% of females in these age groups living above the poverty line.
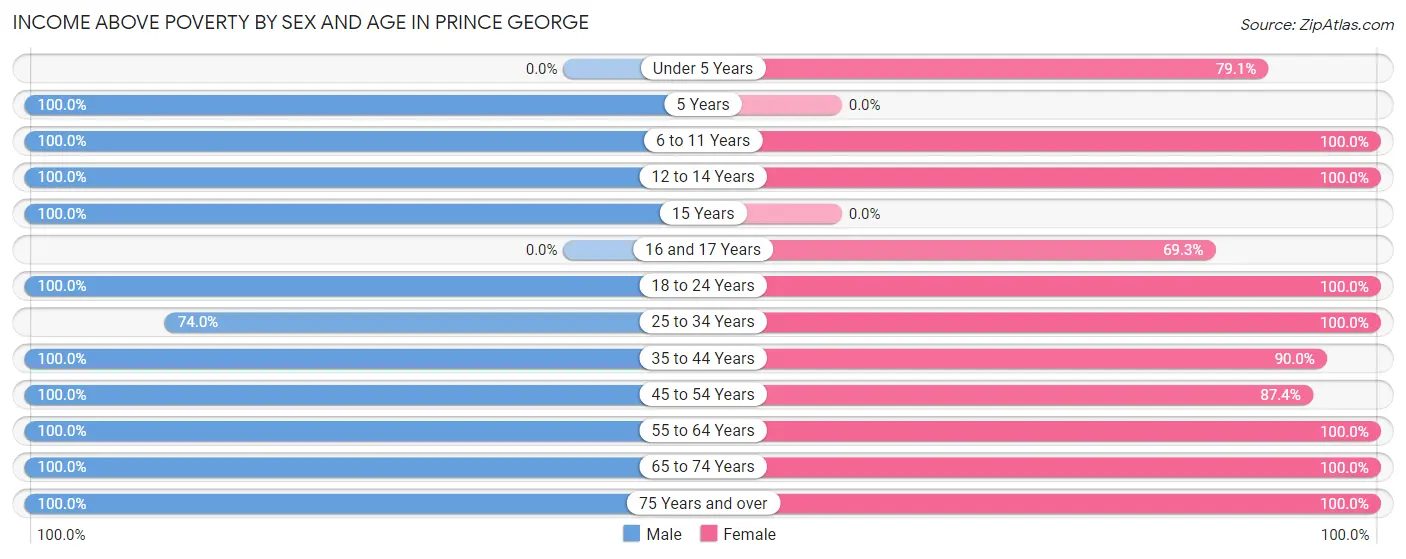
| Age Bracket | Male | Female |
| Under 5 Years | 0 (0.0%) | 53 (79.1%) |
| 5 Years | 39 (100.0%) | 0 (0.0%) |
| 6 to 11 Years | 74 (100.0%) | 98 (100.0%) |
| 12 to 14 Years | 24 (100.0%) | 67 (100.0%) |
| 15 Years | 45 (100.0%) | 0 (0.0%) |
| 16 and 17 Years | 0 (0.0%) | 70 (69.3%) |
| 18 to 24 Years | 90 (100.0%) | 85 (100.0%) |
| 25 to 34 Years | 88 (74.0%) | 159 (100.0%) |
| 35 to 44 Years | 98 (100.0%) | 198 (90.0%) |
| 45 to 54 Years | 101 (100.0%) | 83 (87.4%) |
| 55 to 64 Years | 27 (100.0%) | 39 (100.0%) |
| 65 to 74 Years | 40 (100.0%) | 92 (100.0%) |
| 75 Years and over | 98 (100.0%) | 128 (100.0%) |
| Total | 724 (92.7%) | 1,072 (90.6%) |
Income Below Poverty Among Married-Couple Families in Prince George
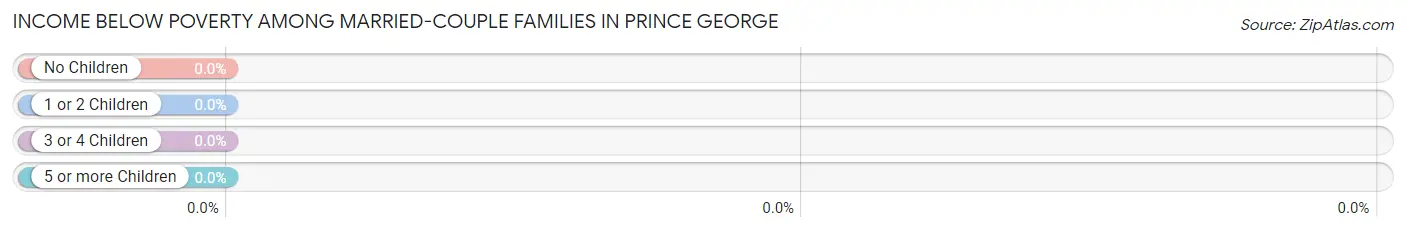
| Children | Above Poverty | Below Poverty |
| No Children | 196 (100.0%) | 0 (0.0%) |
| 1 or 2 Children | 35 (100.0%) | 0 (0.0%) |
| 3 or 4 Children | 53 (100.0%) | 0 (0.0%) |
| 5 or more Children | 0 (0.0%) | 0 (0.0%) |
| Total | 284 (100.0%) | 0 (0.0%) |
Income Below Poverty Among Single-Parent Households in Prince George
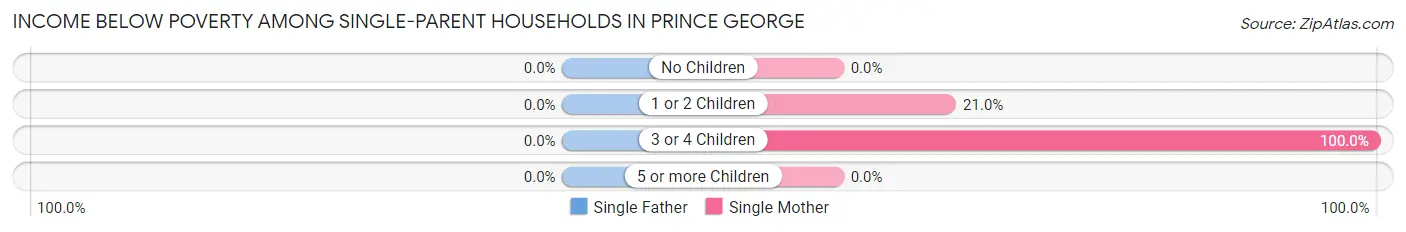
| Children | Single Father | Single Mother |
| No Children | 0 (0.0%) | 0 (0.0%) |
| 1 or 2 Children | 0 (0.0%) | 22 (20.9%) |
| 3 or 4 Children | 0 (0.0%) | 12 (100.0%) |
| 5 or more Children | 0 (0.0%) | 0 (0.0%) |
| Total | 0 (0.0%) | 34 (29.1%) |
Income Below Poverty Among Married-Couple vs Single-Parent Households in Prince George
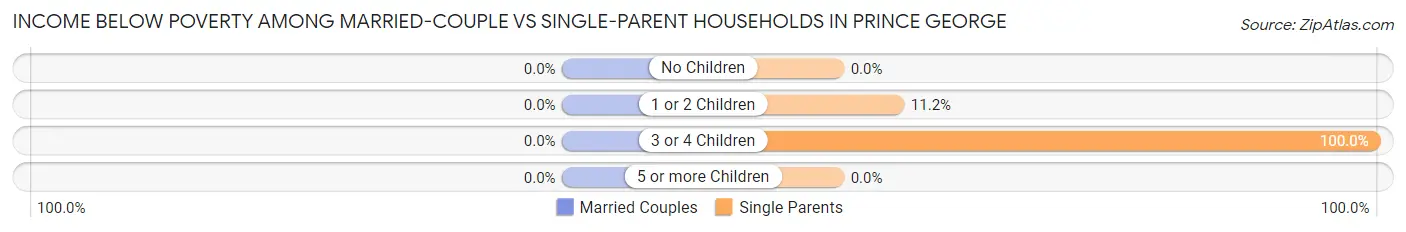
| Children | Married-Couple Families | Single-Parent Households |
| No Children | 0 (0.0%) | 0 (0.0%) |
| 1 or 2 Children | 0 (0.0%) | 22 (11.2%) |
| 3 or 4 Children | 0 (0.0%) | 12 (100.0%) |
| 5 or more Children | 0 (0.0%) | 0 (0.0%) |
| Total | 0 (0.0%) | 34 (16.4%) |
Race in Prince George
The most populous races in Prince George are White / Caucasian (985 | 50.1%), Black / African American (964 | 49.1%), and Hispanic or Latino (107 | 5.4%).
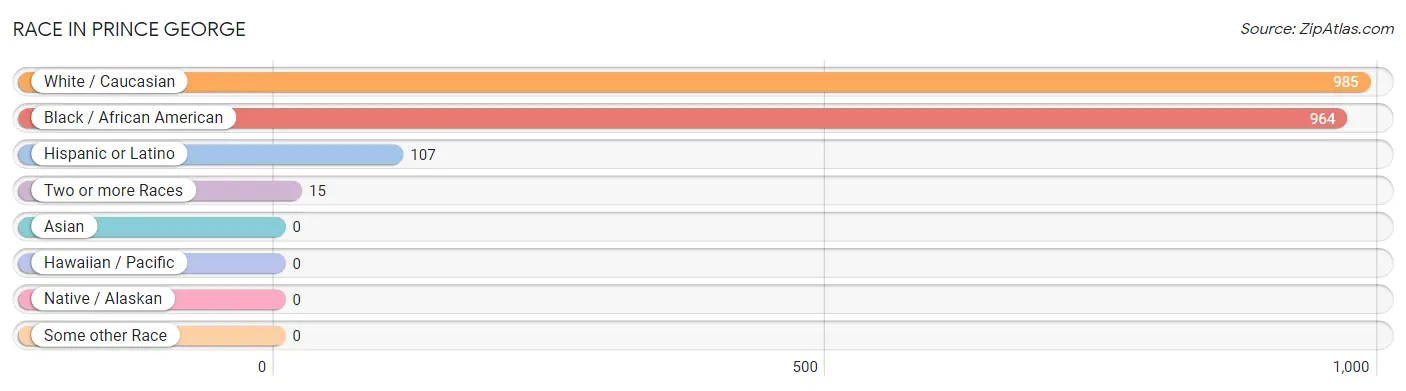
| Race | # Population | % Population |
| Asian | 0 | 0.0% |
| Black / African American | 964 | 49.1% |
| Hawaiian / Pacific | 0 | 0.0% |
| Hispanic or Latino | 107 | 5.4% |
| Native / Alaskan | 0 | 0.0% |
| White / Caucasian | 985 | 50.1% |
| Two or more Races | 15 | 0.8% |
| Some other Race | 0 | 0.0% |
| Total | 1,964 | 100.0% |
Ancestry in Prince George
The most populous ancestries reported in Prince George are English (229 | 11.7%), Irish (88 | 4.5%), American (83 | 4.2%), Italian (76 | 3.9%), and German (63 | 3.2%), together accounting for 27.5% of all Prince George residents.
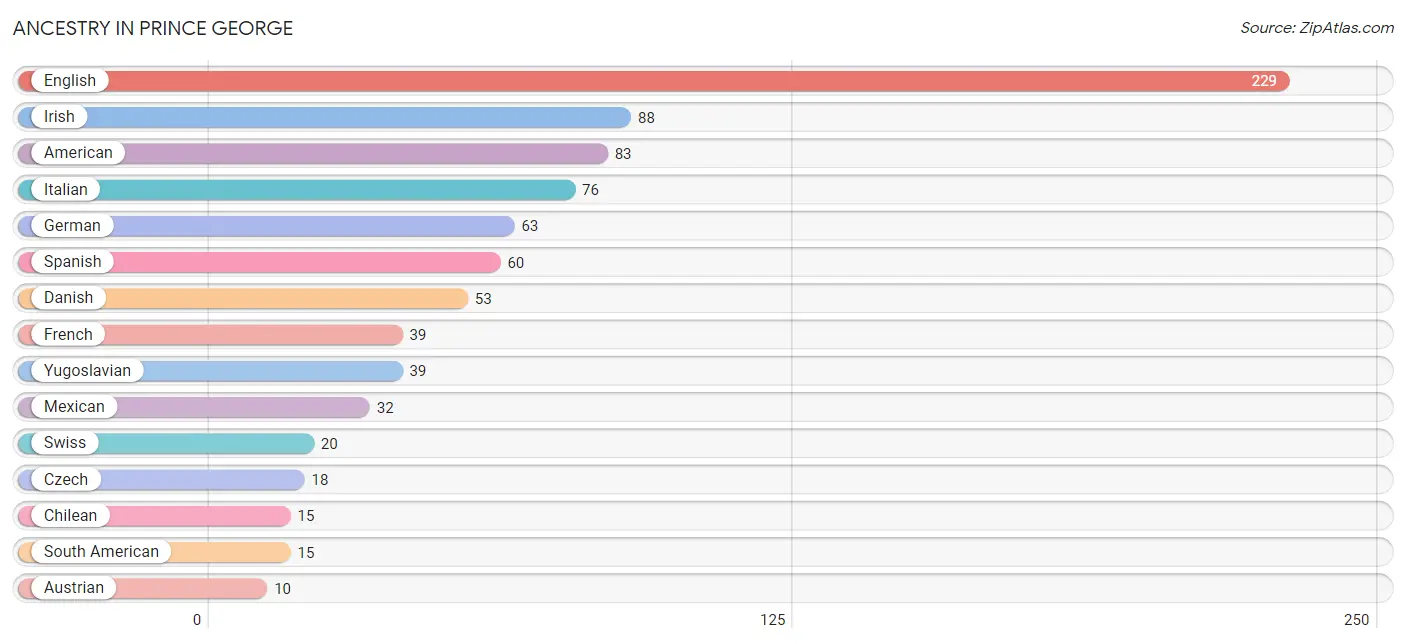
| Ancestry | # Population | % Population |
| American | 83 | 4.2% |
| Austrian | 10 | 0.5% |
| Chilean | 15 | 0.8% |
| Czech | 18 | 0.9% |
| Czechoslovakian | 10 | 0.5% |
| Danish | 53 | 2.7% |
| English | 229 | 11.7% |
| French | 39 | 2.0% |
| German | 63 | 3.2% |
| Irish | 88 | 4.5% |
| Italian | 76 | 3.9% |
| Mexican | 32 | 1.6% |
| South American | 15 | 0.8% |
| Spanish | 60 | 3.0% |
| Swiss | 20 | 1.0% |
| Yugoslavian | 39 | 2.0% | View All 16 Rows |
Immigrants in Prince George
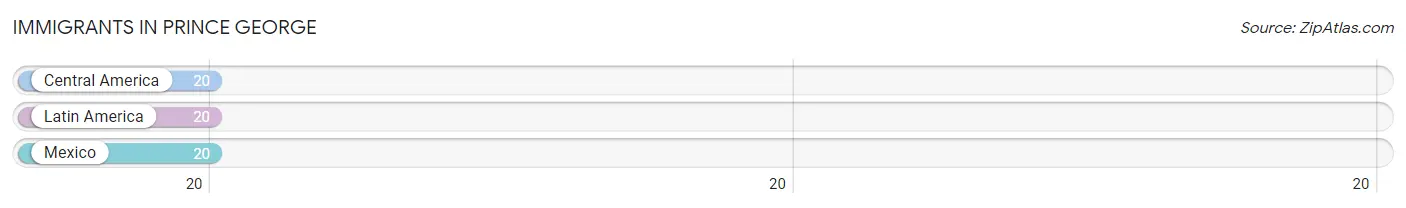
The most numerous immigrant groups reported in Prince George came from Central America (20 | 1.0%), Latin America (20 | 1.0%), and Mexico (20 | 1.0%), together accounting for 3.1% of all Prince George residents.
| Immigration Origin | # Population | % Population |
| Central America | 20 | 1.0% |
| Latin America | 20 | 1.0% |
| Mexico | 20 | 1.0% | View All 3 Rows |
Sex and Age in Prince George
Sex and Age in Prince George
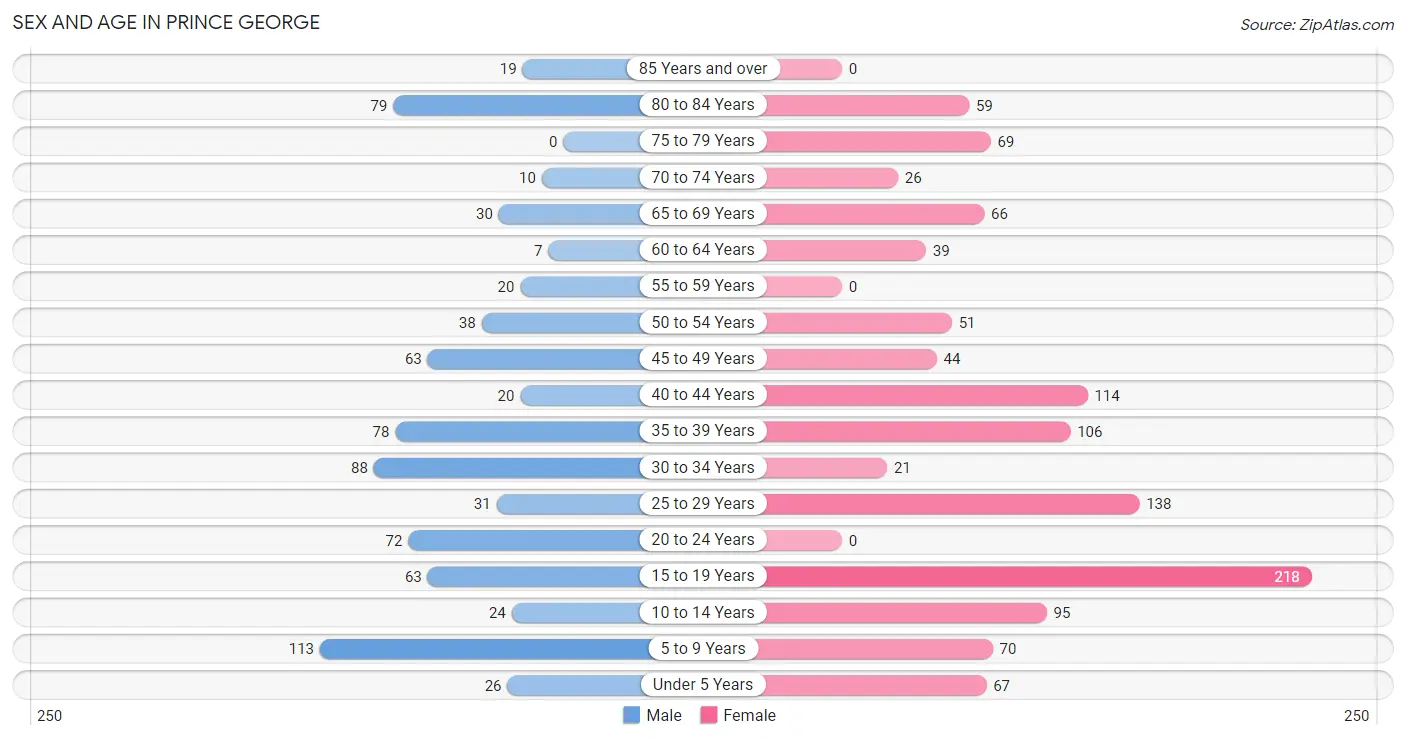
The most populous age groups in Prince George are 5 to 9 Years (113 | 14.5%) for men and 15 to 19 Years (218 | 18.4%) for women.
| Age Bracket | Male | Female |
| Under 5 Years | 26 (3.3%) | 67 (5.7%) |
| 5 to 9 Years | 113 (14.5%) | 70 (5.9%) |
| 10 to 14 Years | 24 (3.1%) | 95 (8.0%) |
| 15 to 19 Years | 63 (8.1%) | 218 (18.4%) |
| 20 to 24 Years | 72 (9.2%) | 0 (0.0%) |
| 25 to 29 Years | 31 (4.0%) | 138 (11.7%) |
| 30 to 34 Years | 88 (11.3%) | 21 (1.8%) |
| 35 to 39 Years | 78 (10.0%) | 106 (9.0%) |
| 40 to 44 Years | 20 (2.6%) | 114 (9.6%) |
| 45 to 49 Years | 63 (8.1%) | 44 (3.7%) |
| 50 to 54 Years | 38 (4.9%) | 51 (4.3%) |
| 55 to 59 Years | 20 (2.6%) | 0 (0.0%) |
| 60 to 64 Years | 7 (0.9%) | 39 (3.3%) |
| 65 to 69 Years | 30 (3.8%) | 66 (5.6%) |
| 70 to 74 Years | 10 (1.3%) | 26 (2.2%) |
| 75 to 79 Years | 0 (0.0%) | 69 (5.8%) |
| 80 to 84 Years | 79 (10.1%) | 59 (5.0%) |
| 85 Years and over | 19 (2.4%) | 0 (0.0%) |
| Total | 781 (100.0%) | 1,183 (100.0%) |
Families and Households in Prince George
Median Family Size in Prince George
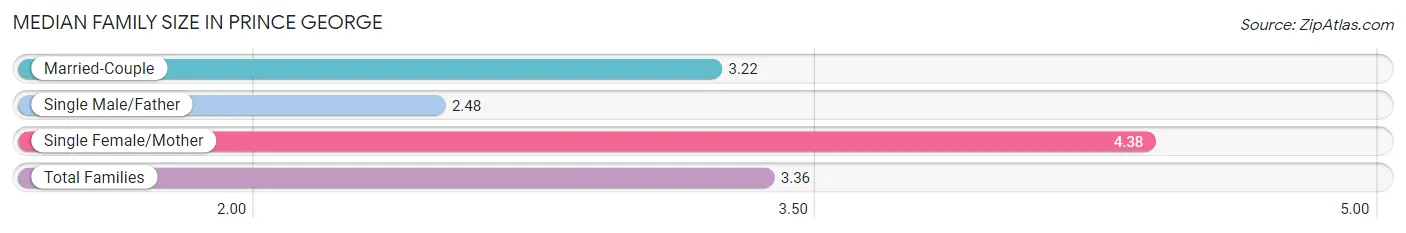
The median family size in Prince George is 3.36 persons per family, with single female/mother families (117 | 23.8%) accounting for the largest median family size of 4.38 persons per family. On the other hand, single male/father families (91 | 18.5%) represent the smallest median family size with 2.48 persons per family.
| Family Type | # Families | Family Size |
| Married-Couple | 284 (57.7%) | 3.22 |
| Single Male/Father | 91 (18.5%) | 2.48 |
| Single Female/Mother | 117 (23.8%) | 4.38 |
| Total Families | 492 (100.0%) | 3.36 |
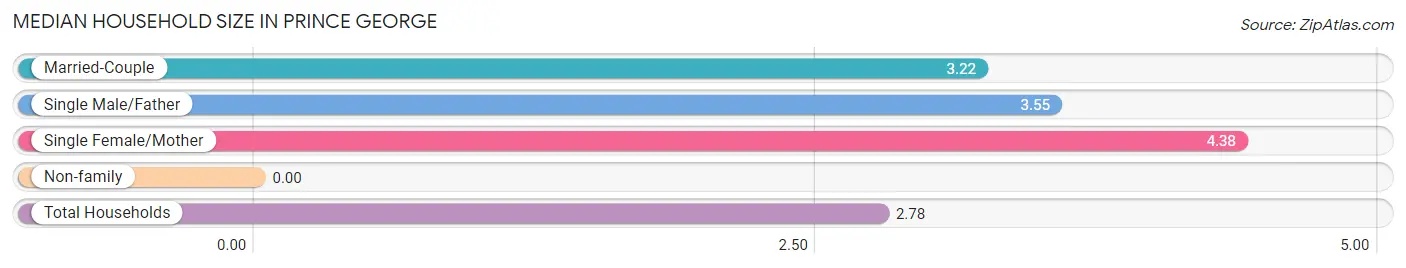
Median Household Size in Prince George
| Household Type | # Households | Household Size |
| Married-Couple | 284 (40.2%) | 3.22 |
| Single Male/Father | 91 (12.9%) | 3.55 |
| Single Female/Mother | 117 (16.6%) | 4.38 |
| Non-family | 214 (30.3%) | - |
| Total Households | 706 (100.0%) | 2.78 |
Household Size by Marriage Status in Prince George
Out of a total of 706 households in Prince George, 492 (69.7%) are family households, while 214 (30.3%) are nonfamily households. The most numerous type of family households are 2-person households, comprising 178, and the most common type of nonfamily households are 1-person households, comprising 214.
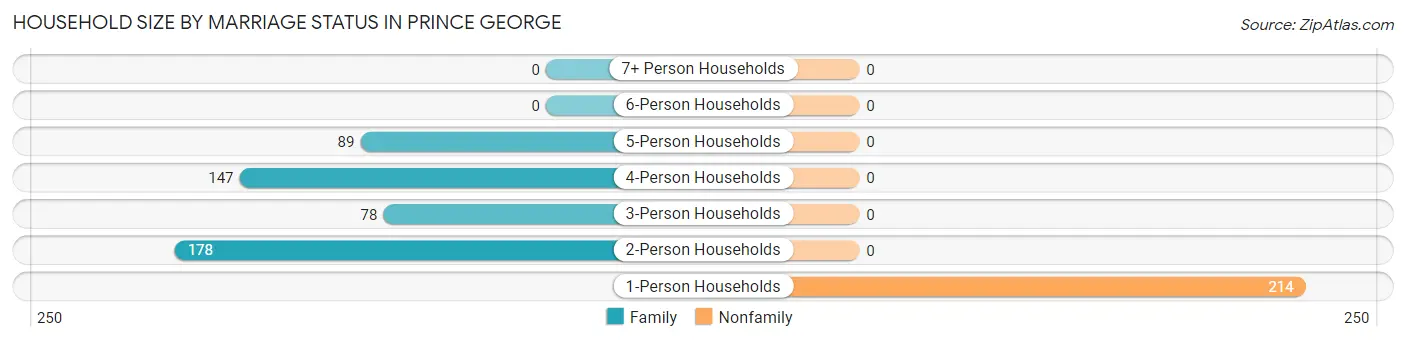
| Household Size | Family Households | Nonfamily Households |
| 1-Person Households | - | 214 (30.3%) |
| 2-Person Households | 178 (25.2%) | 0 (0.0%) |
| 3-Person Households | 78 (11.1%) | 0 (0.0%) |
| 4-Person Households | 147 (20.8%) | 0 (0.0%) |
| 5-Person Households | 89 (12.6%) | 0 (0.0%) |
| 6-Person Households | 0 (0.0%) | 0 (0.0%) |
| 7+ Person Households | 0 (0.0%) | 0 (0.0%) |
| Total | 492 (69.7%) | 214 (30.3%) |
Female Fertility in Prince George
Fertility by Age in Prince George
| Age Bracket | Women with Births | Births / 1,000 Women |
| 15 to 19 years | 0 (0.0%) | 0.0 |
| 20 to 34 years | 0 (0.0%) | 0.0 |
| 35 to 50 years | 0 (0.0%) | 0.0 |
| Total | 0 (0.0%) | 0.0 |
Fertility by Age by Marriage Status in Prince George
| Age Bracket | Married | Unmarried |
| 15 to 19 years | 0 (0.0%) | 0 (0.0%) |
| 20 to 34 years | 0 (0.0%) | 0 (0.0%) |
| 35 to 50 years | 0 (0.0%) | 0 (0.0%) |
| Total | 0 (0.0%) | 0 (0.0%) |
Fertility by Education in Prince George
| Educational Attainment | Women with Births | Births / 1,000 Women |
| Less than High School | 0 (0.0%) | 0.0 |
| High School Diploma | 0 (0.0%) | 0.0 |
| College or Associate's Degree | 0 (0.0%) | 0.0 |
| Bachelor's Degree | 0 (0.0%) | 0.0 |
| Graduate Degree | 0 (0.0%) | 0.0 |
| Total | 0 (0.0%) | 0.0 |
Fertility by Education by Marriage Status in Prince George
| Educational Attainment | Married | Unmarried |
| Less than High School | 0 (0.0%) | 0 (0.0%) |
| High School Diploma | 0 (0.0%) | 0 (0.0%) |
| College or Associate's Degree | 0 (0.0%) | 0 (0.0%) |
| Bachelor's Degree | 0 (0.0%) | 0 (0.0%) |
| Graduate Degree | 0 (0.0%) | 0 (0.0%) |
| Total | 0 (0.0%) | 0 (0.0%) |
Employment Characteristics in Prince George
Employment by Class of Employer in Prince George
Among the 990 employed individuals in Prince George, private company employees (777 | 78.5%), federal government employees (94 | 9.5%), and not-for-profit organizations (66 | 6.7%) make up the most common classes of employment.
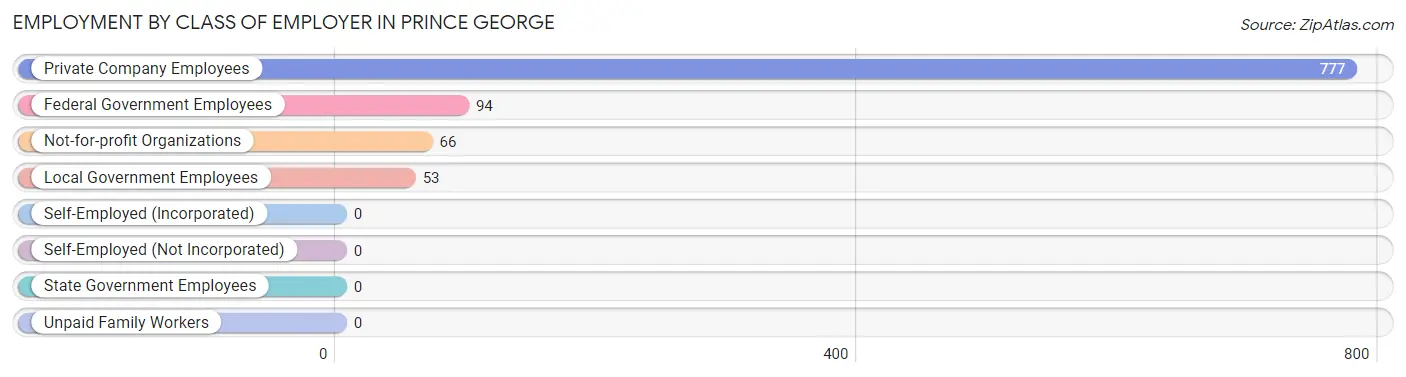
| Employer Class | # Employees | % Employees |
| Private Company Employees | 777 | 78.5% |
| Self-Employed (Incorporated) | 0 | 0.0% |
| Self-Employed (Not Incorporated) | 0 | 0.0% |
| Not-for-profit Organizations | 66 | 6.7% |
| Local Government Employees | 53 | 5.3% |
| State Government Employees | 0 | 0.0% |
| Federal Government Employees | 94 | 9.5% |
| Unpaid Family Workers | 0 | 0.0% |
| Total | 990 | 100.0% |
Employment Status by Age in Prince George
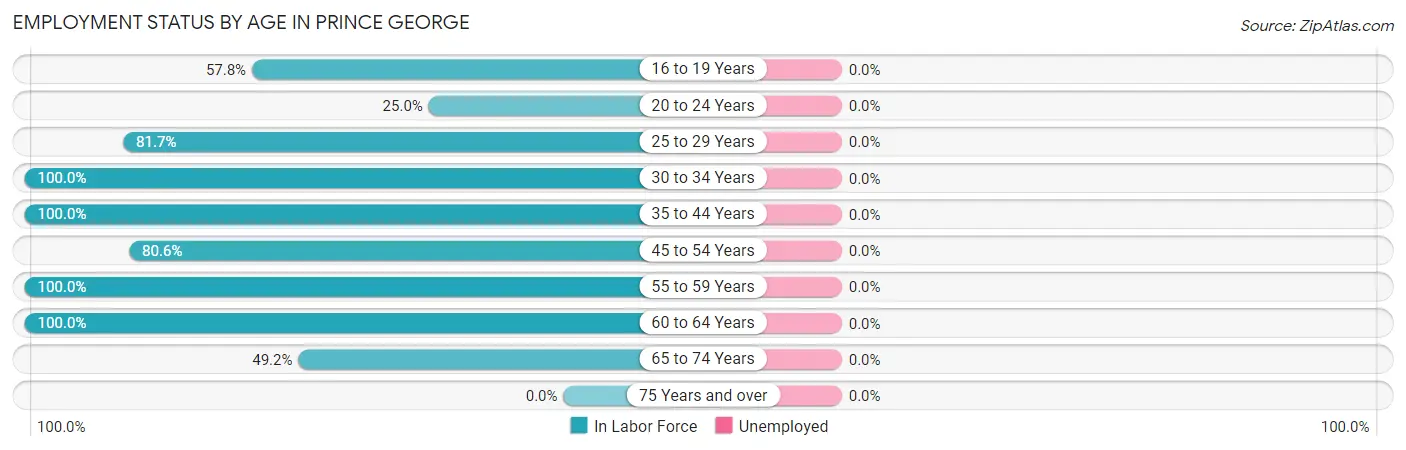
| Age Bracket | In Labor Force | Unemployed |
| 16 to 19 Years | 118 (57.8%) | 0 (0.0%) |
| 20 to 24 Years | 18 (25.0%) | 0 (0.0%) |
| 25 to 29 Years | 138 (81.7%) | 0 (0.0%) |
| 30 to 34 Years | 109 (100.0%) | 0 (0.0%) |
| 35 to 44 Years | 318 (100.0%) | 0 (0.0%) |
| 45 to 54 Years | 158 (80.6%) | 0 (0.0%) |
| 55 to 59 Years | 20 (100.0%) | 0 (0.0%) |
| 60 to 64 Years | 46 (100.0%) | 0 (0.0%) |
| 65 to 74 Years | 65 (49.2%) | 0 (0.0%) |
| 75 Years and over | 0 (0.0%) | 0 (0.0%) |
| Total | 991 (66.4%) | 0 (0.0%) |
Employment Status by Educational Attainment in Prince George
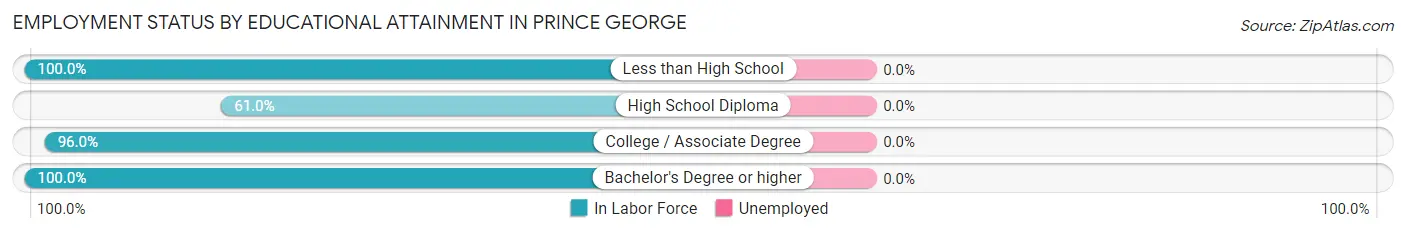
| Educational Attainment | In Labor Force | Unemployed |
| Less than High School | 88 (100.0%) | 0 (0.0%) |
| High School Diploma | 86 (61.0%) | 0 (0.0%) |
| College / Associate Degree | 336 (96.0%) | 0 (0.0%) |
| Bachelor's Degree or higher | 279 (100.0%) | 0 (0.0%) |
| Total | 789 (92.0%) | 0 (0.0%) |
Employment Occupations by Sex in Prince George
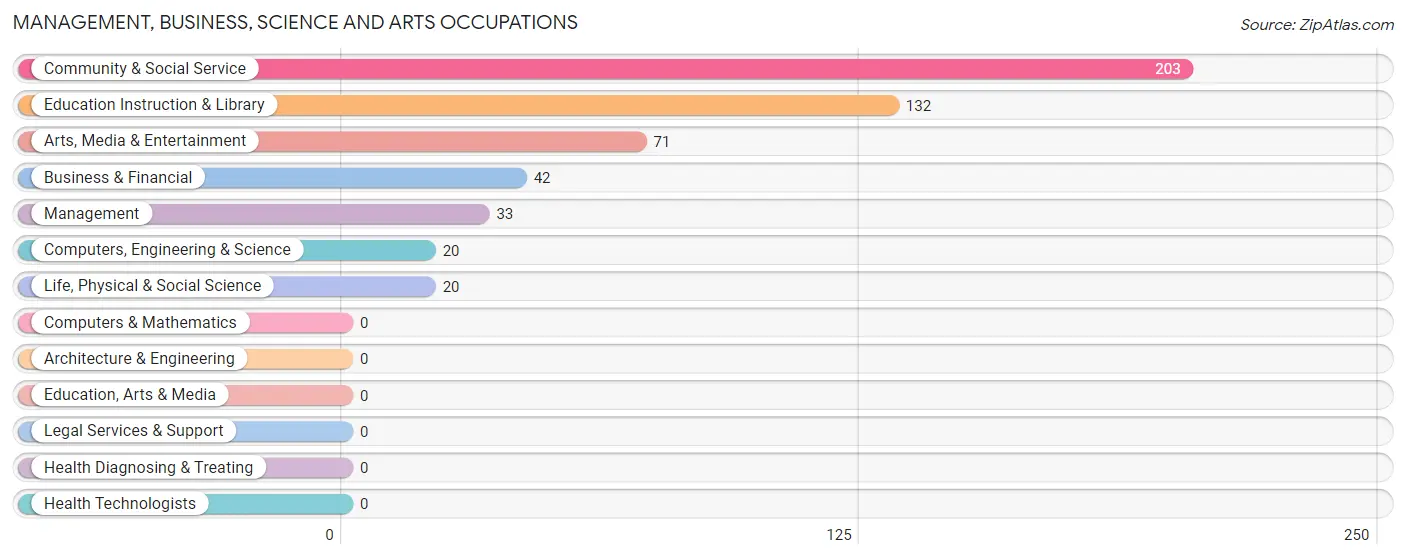
Management, Business, Science and Arts Occupations
The most common Management, Business, Science and Arts occupations in Prince George are Community & Social Service (203 | 20.5%), Education Instruction & Library (132 | 13.3%), Arts, Media & Entertainment (71 | 7.2%), Business & Financial (42 | 4.2%), and Management (33 | 3.3%).
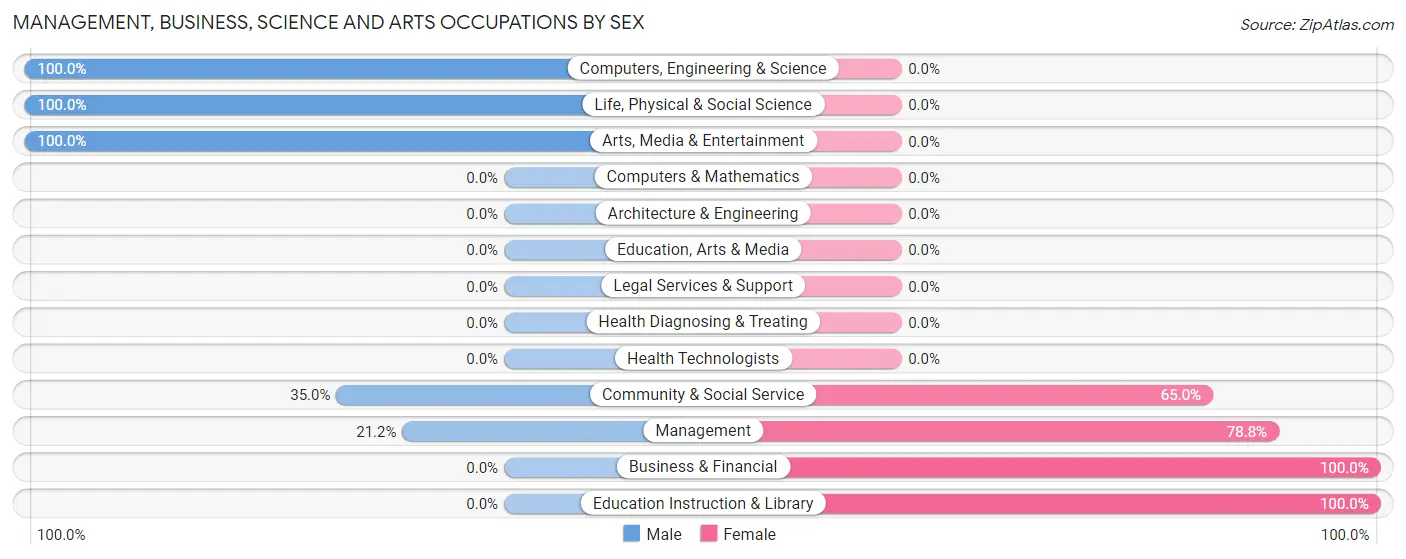
Management, Business, Science and Arts Occupations by Sex
Within the Management, Business, Science and Arts occupations in Prince George, the most male-oriented occupations are Computers, Engineering & Science (100.0%), Life, Physical & Social Science (100.0%), and Arts, Media & Entertainment (100.0%), while the most female-oriented occupations are Business & Financial (100.0%), Education Instruction & Library (100.0%), and Management (78.8%).
| Occupation | Male | Female |
| Management | 7 (21.2%) | 26 (78.8%) |
| Business & Financial | 0 (0.0%) | 42 (100.0%) |
| Computers, Engineering & Science | 20 (100.0%) | 0 (0.0%) |
| Computers & Mathematics | 0 (0.0%) | 0 (0.0%) |
| Architecture & Engineering | 0 (0.0%) | 0 (0.0%) |
| Life, Physical & Social Science | 20 (100.0%) | 0 (0.0%) |
| Community & Social Service | 71 (35.0%) | 132 (65.0%) |
| Education, Arts & Media | 0 (0.0%) | 0 (0.0%) |
| Legal Services & Support | 0 (0.0%) | 0 (0.0%) |
| Education Instruction & Library | 0 (0.0%) | 132 (100.0%) |
| Arts, Media & Entertainment | 71 (100.0%) | 0 (0.0%) |
| Health Diagnosing & Treating | 0 (0.0%) | 0 (0.0%) |
| Health Technologists | 0 (0.0%) | 0 (0.0%) |
| Total (Category) | 98 (32.9%) | 200 (67.1%) |
| Total (Overall) | 365 (36.9%) | 625 (63.1%) |
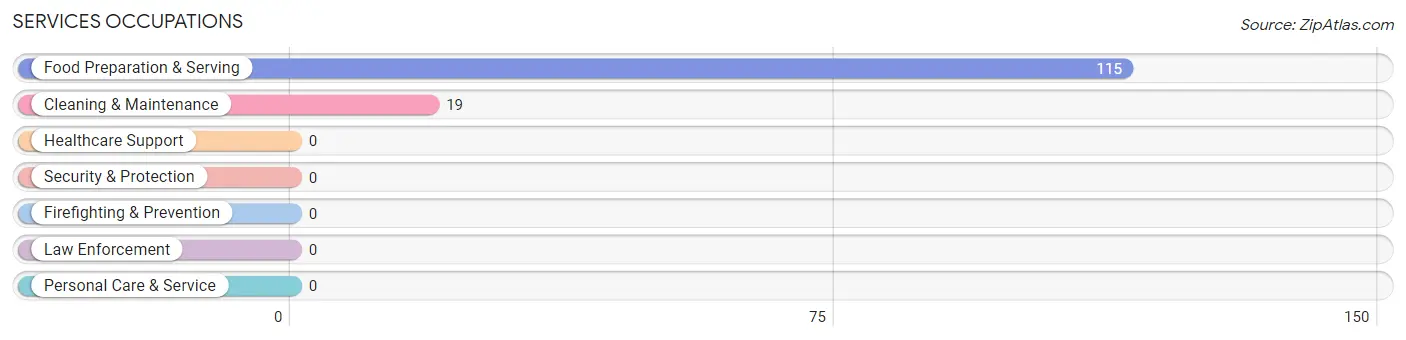
Services Occupations
The most common Services occupations in Prince George are Food Preparation & Serving (115 | 11.6%), and Cleaning & Maintenance (19 | 1.9%).
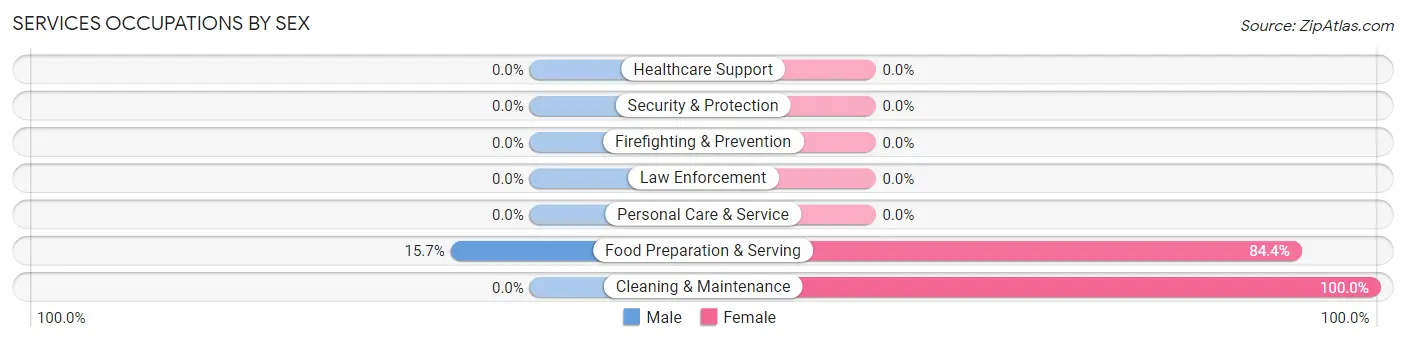
Services Occupations by Sex
| Occupation | Male | Female |
| Healthcare Support | 0 (0.0%) | 0 (0.0%) |
| Security & Protection | 0 (0.0%) | 0 (0.0%) |
| Firefighting & Prevention | 0 (0.0%) | 0 (0.0%) |
| Law Enforcement | 0 (0.0%) | 0 (0.0%) |
| Food Preparation & Serving | 18 (15.7%) | 97 (84.4%) |
| Cleaning & Maintenance | 0 (0.0%) | 19 (100.0%) |
| Personal Care & Service | 0 (0.0%) | 0 (0.0%) |
| Total (Category) | 18 (13.4%) | 116 (86.6%) |
| Total (Overall) | 365 (36.9%) | 625 (63.1%) |
Sales and Office Occupations
The most common Sales and Office occupations in Prince George are Sales & Related (245 | 24.7%), and Office & Administration (157 | 15.9%).
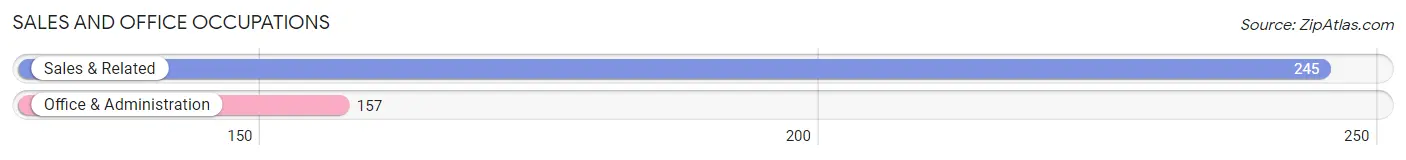
Sales and Office Occupations by Sex

| Occupation | Male | Female |
| Sales & Related | 109 (44.5%) | 136 (55.5%) |
| Office & Administration | 15 (9.6%) | 142 (90.4%) |
| Total (Category) | 124 (30.8%) | 278 (69.2%) |
| Total (Overall) | 365 (36.9%) | 625 (63.1%) |
Natural Resources, Construction and Maintenance Occupations
The most common Natural Resources, Construction and Maintenance occupations in Prince George are , and Construction & Extraction (57 | 5.8%).
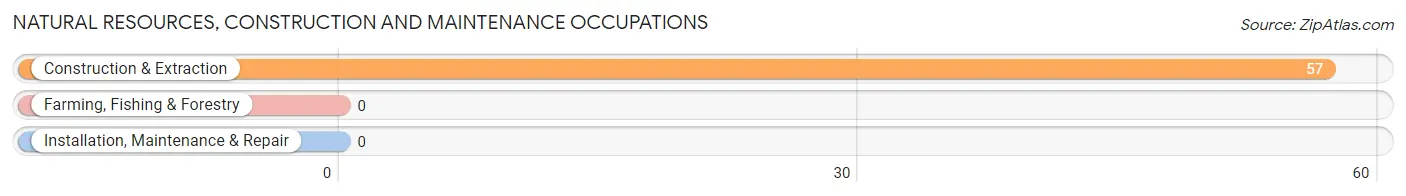
Natural Resources, Construction and Maintenance Occupations by Sex
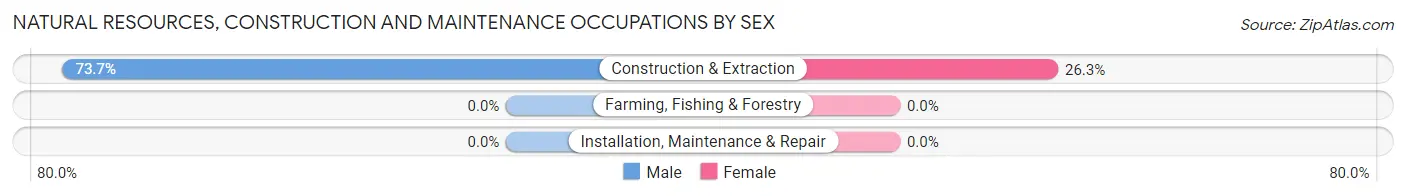
| Occupation | Male | Female |
| Farming, Fishing & Forestry | 0 (0.0%) | 0 (0.0%) |
| Construction & Extraction | 42 (73.7%) | 15 (26.3%) |
| Installation, Maintenance & Repair | 0 (0.0%) | 0 (0.0%) |
| Total (Category) | 42 (73.7%) | 15 (26.3%) |
| Total (Overall) | 365 (36.9%) | 625 (63.1%) |
Production, Transportation and Moving Occupations
The most common Production, Transportation and Moving occupations in Prince George are Transportation (79 | 8.0%), and Production (20 | 2.0%).
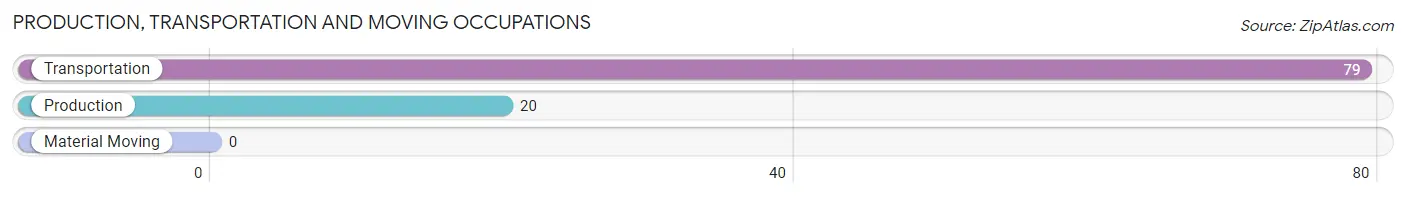
Production, Transportation and Moving Occupations by Sex
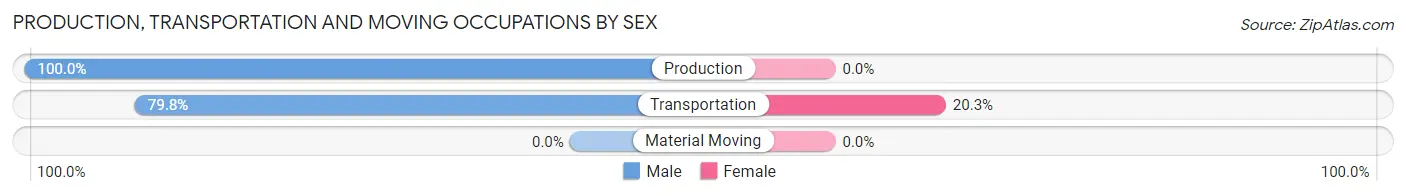
| Occupation | Male | Female |
| Production | 20 (100.0%) | 0 (0.0%) |
| Transportation | 63 (79.7%) | 16 (20.3%) |
| Material Moving | 0 (0.0%) | 0 (0.0%) |
| Total (Category) | 83 (83.8%) | 16 (16.2%) |
| Total (Overall) | 365 (36.9%) | 625 (63.1%) |
Employment Industries by Sex in Prince George
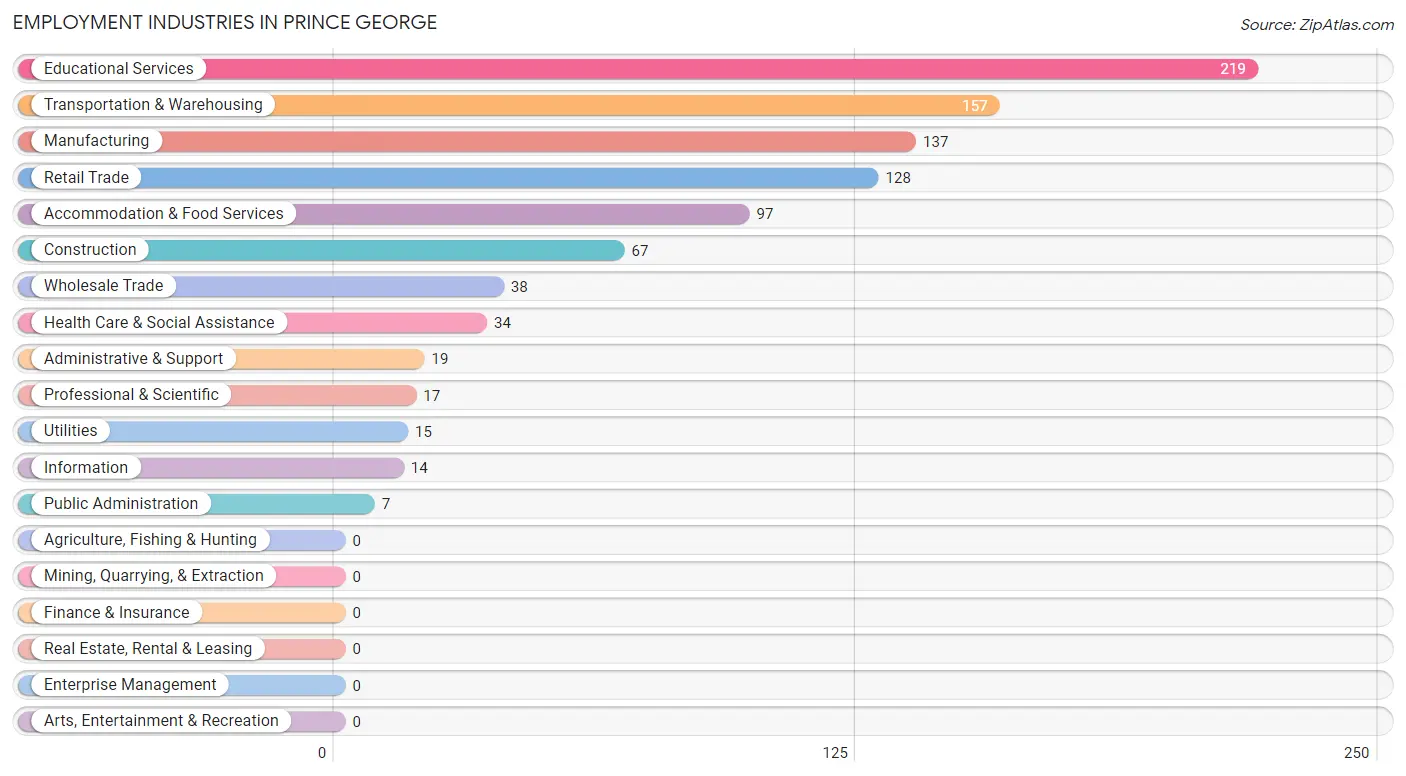
Employment Industries in Prince George
The major employment industries in Prince George include Educational Services (219 | 22.1%), Transportation & Warehousing (157 | 15.9%), Manufacturing (137 | 13.8%), Retail Trade (128 | 12.9%), and Accommodation & Food Services (97 | 9.8%).
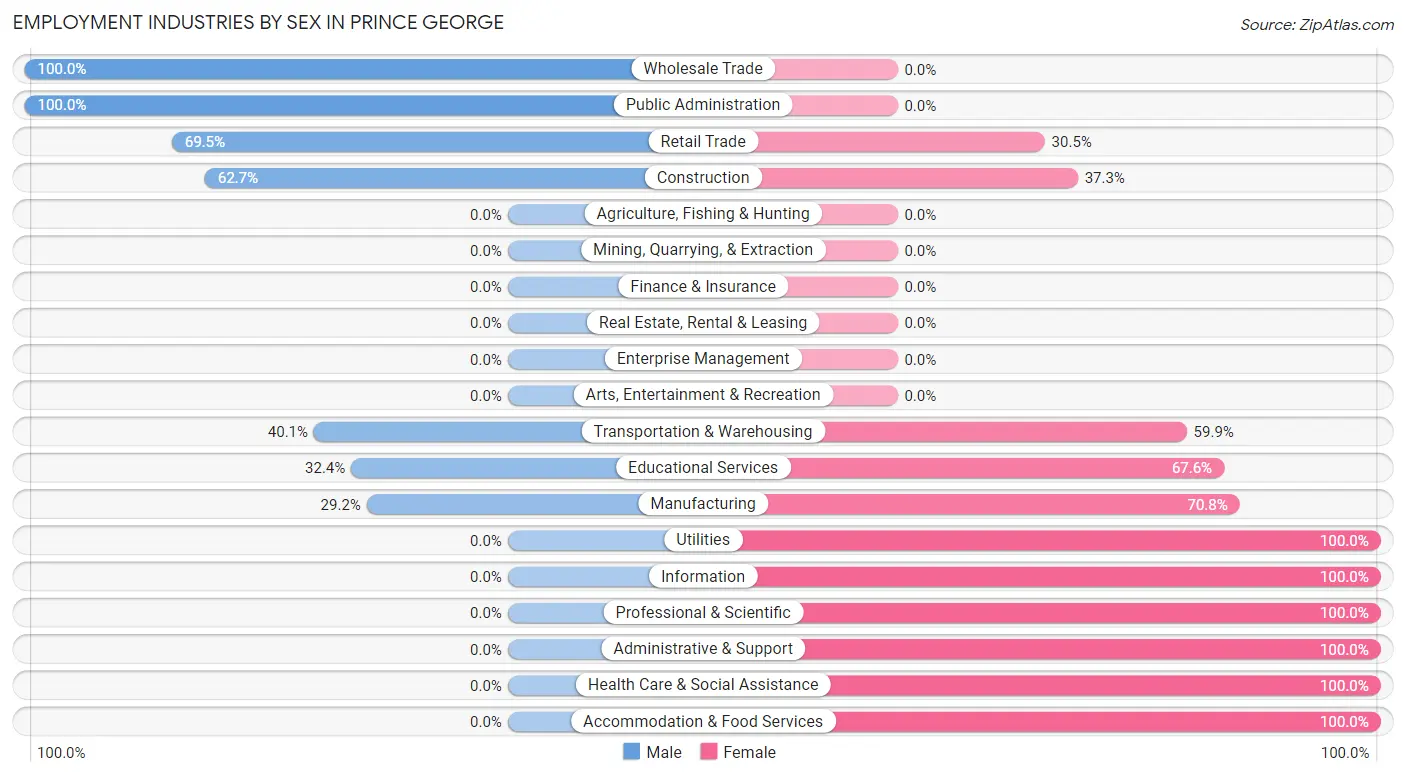
Employment Industries by Sex in Prince George
The Prince George industries that see more men than women are Wholesale Trade (100.0%), Public Administration (100.0%), and Retail Trade (69.5%), whereas the industries that tend to have a higher number of women are Utilities (100.0%), Information (100.0%), and Professional & Scientific (100.0%).
| Industry | Male | Female |
| Agriculture, Fishing & Hunting | 0 (0.0%) | 0 (0.0%) |
| Mining, Quarrying, & Extraction | 0 (0.0%) | 0 (0.0%) |
| Construction | 42 (62.7%) | 25 (37.3%) |
| Manufacturing | 40 (29.2%) | 97 (70.8%) |
| Wholesale Trade | 38 (100.0%) | 0 (0.0%) |
| Retail Trade | 89 (69.5%) | 39 (30.5%) |
| Transportation & Warehousing | 63 (40.1%) | 94 (59.9%) |
| Utilities | 0 (0.0%) | 15 (100.0%) |
| Information | 0 (0.0%) | 14 (100.0%) |
| Finance & Insurance | 0 (0.0%) | 0 (0.0%) |
| Real Estate, Rental & Leasing | 0 (0.0%) | 0 (0.0%) |
| Professional & Scientific | 0 (0.0%) | 17 (100.0%) |
| Enterprise Management | 0 (0.0%) | 0 (0.0%) |
| Administrative & Support | 0 (0.0%) | 19 (100.0%) |
| Educational Services | 71 (32.4%) | 148 (67.6%) |
| Health Care & Social Assistance | 0 (0.0%) | 34 (100.0%) |
| Arts, Entertainment & Recreation | 0 (0.0%) | 0 (0.0%) |
| Accommodation & Food Services | 0 (0.0%) | 97 (100.0%) |
| Public Administration | 7 (100.0%) | 0 (0.0%) |
| Total | 365 (36.9%) | 625 (63.1%) |
Education in Prince George
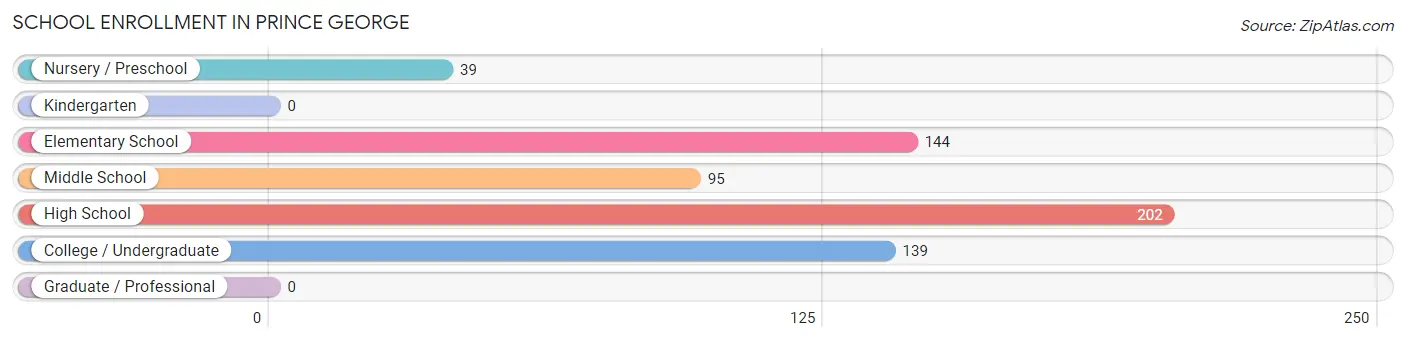
School Enrollment in Prince George
The most common levels of schooling among the 619 students in Prince George are high school (202 | 32.6%), elementary school (144 | 23.3%), and college / undergraduate (139 | 22.5%).
| School Level | # Students | % Students |
| Nursery / Preschool | 39 | 6.3% |
| Kindergarten | 0 | 0.0% |
| Elementary School | 144 | 23.3% |
| Middle School | 95 | 15.3% |
| High School | 202 | 32.6% |
| College / Undergraduate | 139 | 22.5% |
| Graduate / Professional | 0 | 0.0% |
| Total | 619 | 100.0% |
School Enrollment by Age by Funding Source in Prince George
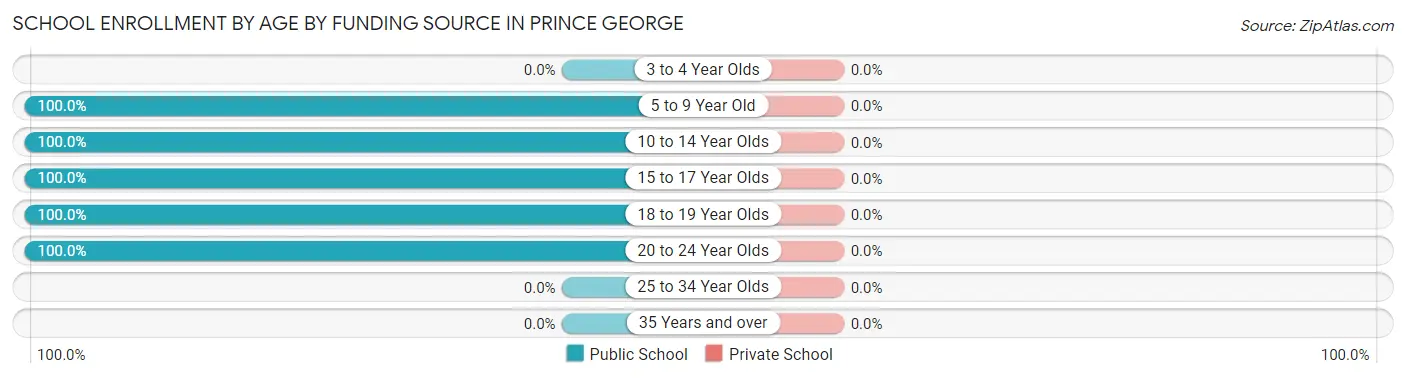
| Age Bracket | Public School | Private School |
| 3 to 4 Year Olds | 0 (0.0%) | 0 (0.0%) |
| 5 to 9 Year Old | 183 (100.0%) | 0 (0.0%) |
| 10 to 14 Year Olds | 119 (100.0%) | 0 (0.0%) |
| 15 to 17 Year Olds | 178 (100.0%) | 0 (0.0%) |
| 18 to 19 Year Olds | 85 (100.0%) | 0 (0.0%) |
| 20 to 24 Year Olds | 54 (100.0%) | 0 (0.0%) |
| 25 to 34 Year Olds | 0 (0.0%) | 0 (0.0%) |
| 35 Years and over | 0 (0.0%) | 0 (0.0%) |
| Total | 619 (100.0%) | 0 (0.0%) |
Educational Attainment by Field of Study in Prince George
Bio, nature & agricultural (97 | 25.5%), physical & health sciences (71 | 18.7%), social sciences (53 | 14.0%), business (41 | 10.8%), and visual & performing arts (39 | 10.3%) are the most common fields of study among 380 individuals in Prince George who have obtained a bachelor's degree or higher.
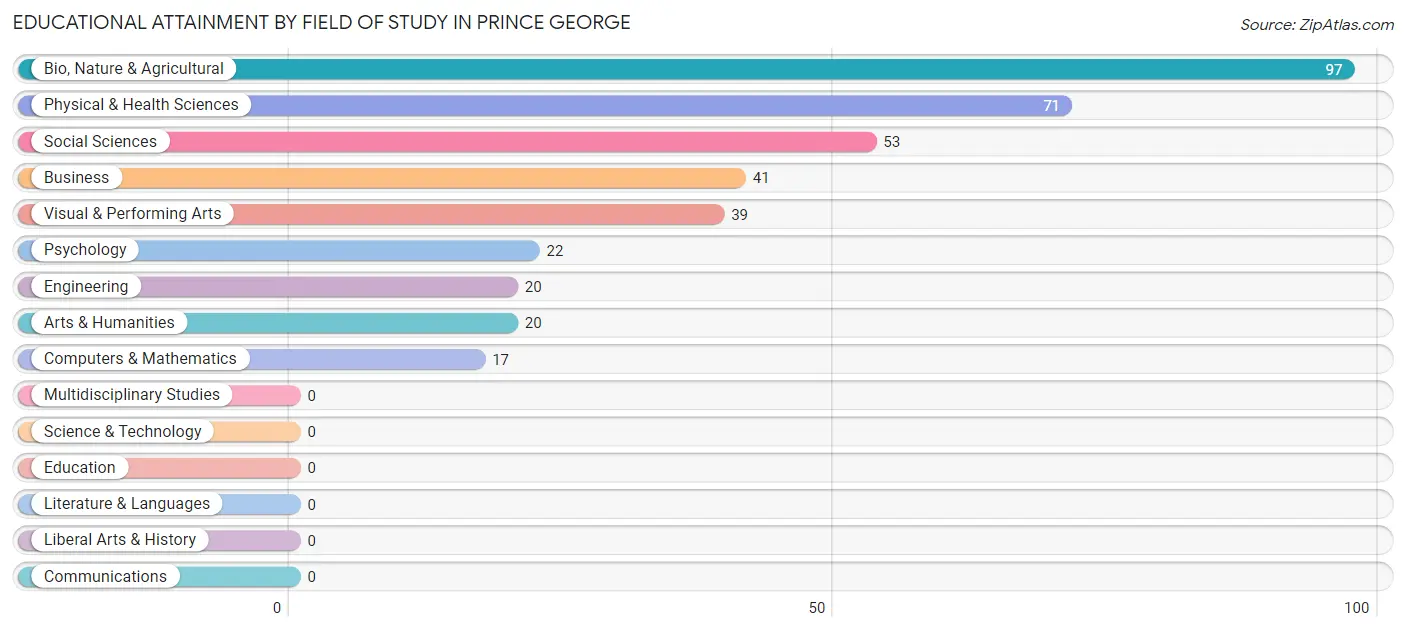
| Field of Study | # Graduates | % Graduates |
| Computers & Mathematics | 17 | 4.5% |
| Bio, Nature & Agricultural | 97 | 25.5% |
| Physical & Health Sciences | 71 | 18.7% |
| Psychology | 22 | 5.8% |
| Social Sciences | 53 | 14.0% |
| Engineering | 20 | 5.3% |
| Multidisciplinary Studies | 0 | 0.0% |
| Science & Technology | 0 | 0.0% |
| Business | 41 | 10.8% |
| Education | 0 | 0.0% |
| Literature & Languages | 0 | 0.0% |
| Liberal Arts & History | 0 | 0.0% |
| Visual & Performing Arts | 39 | 10.3% |
| Communications | 0 | 0.0% |
| Arts & Humanities | 20 | 5.3% |
| Total | 380 | 100.0% |
Transportation & Commute in Prince George
Vehicle Availability by Sex in Prince George
The most prevalent vehicle ownership categories in Prince George are males with 2 vehicles (160, accounting for 43.8%) and females with 2 vehicles (209, making up 25.6%).
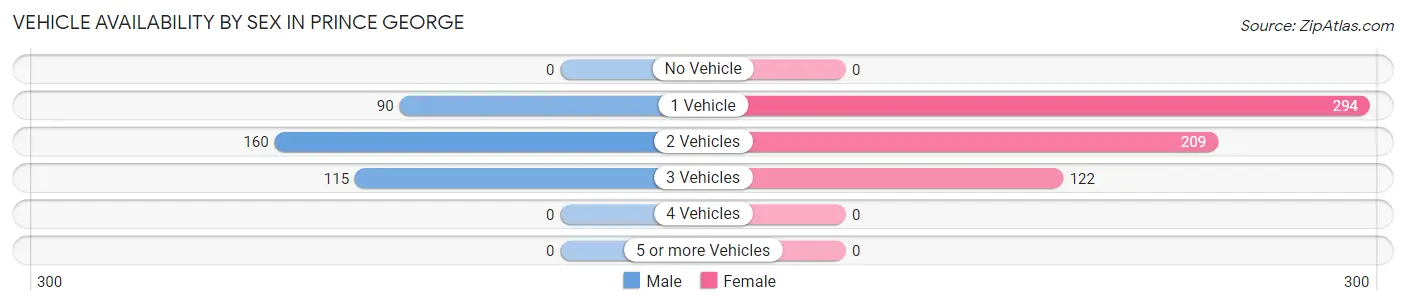
| Vehicles Available | Male | Female |
| No Vehicle | 0 (0.0%) | 0 (0.0%) |
| 1 Vehicle | 90 (24.7%) | 294 (47.0%) |
| 2 Vehicles | 160 (43.8%) | 209 (33.4%) |
| 3 Vehicles | 115 (31.5%) | 122 (19.5%) |
| 4 Vehicles | 0 (0.0%) | 0 (0.0%) |
| 5 or more Vehicles | 0 (0.0%) | 0 (0.0%) |
| Total | 365 (100.0%) | 625 (100.0%) |
Commute Time in Prince George
The most frequently occuring commute durations in Prince George are 20 to 24 minutes (352 commuters, 36.2%), 15 to 19 minutes (212 commuters, 21.8%), and 10 to 14 minutes (156 commuters, 16.0%).
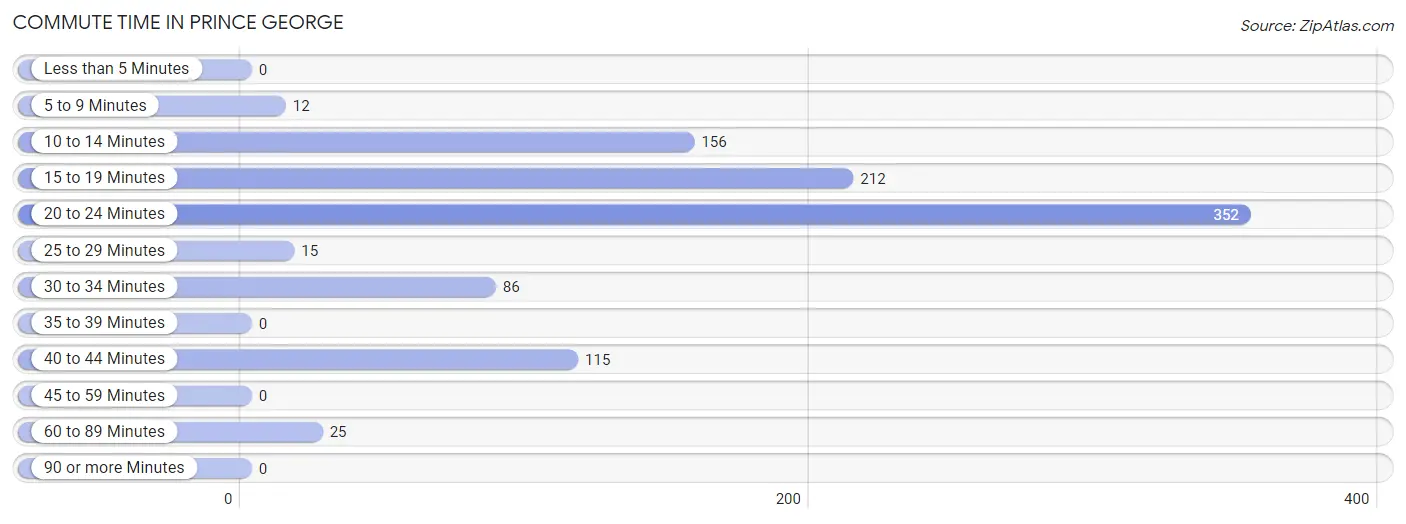
| Commute Time | # Commuters | % Commuters |
| Less than 5 Minutes | 0 | 0.0% |
| 5 to 9 Minutes | 12 | 1.2% |
| 10 to 14 Minutes | 156 | 16.0% |
| 15 to 19 Minutes | 212 | 21.8% |
| 20 to 24 Minutes | 352 | 36.2% |
| 25 to 29 Minutes | 15 | 1.5% |
| 30 to 34 Minutes | 86 | 8.8% |
| 35 to 39 Minutes | 0 | 0.0% |
| 40 to 44 Minutes | 115 | 11.8% |
| 45 to 59 Minutes | 0 | 0.0% |
| 60 to 89 Minutes | 25 | 2.6% |
| 90 or more Minutes | 0 | 0.0% |
Commute Time by Sex in Prince George
The most common commute times in Prince George are 20 to 24 minutes (108 commuters, 29.6%) for males and 20 to 24 minutes (244 commuters, 40.1%) for females.
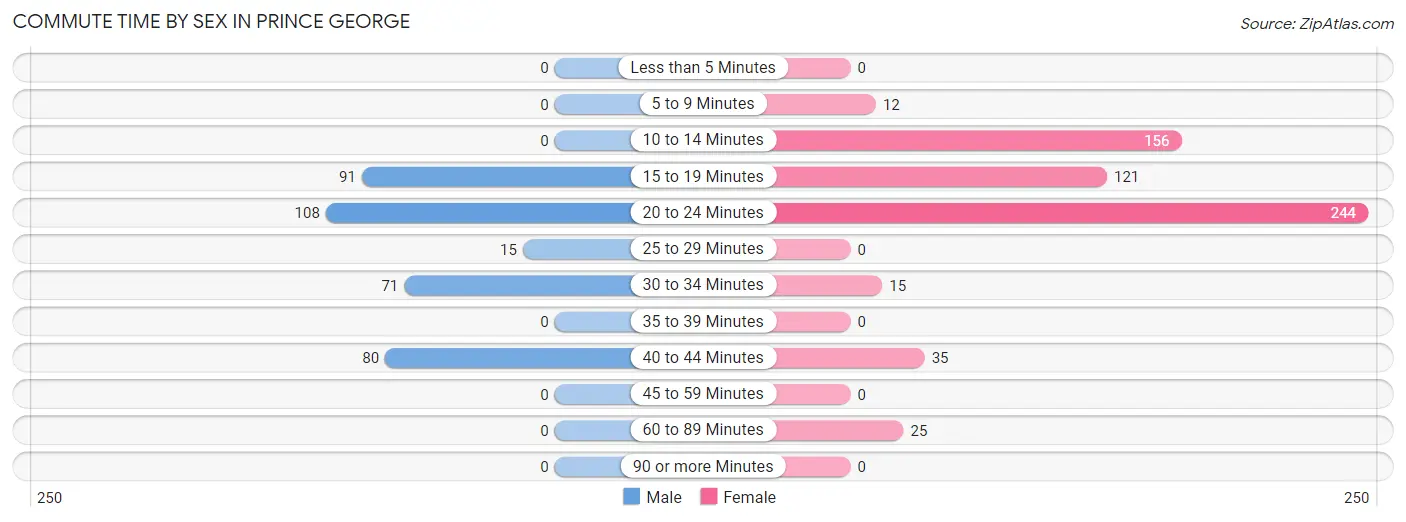
| Commute Time | Male | Female |
| Less than 5 Minutes | 0 (0.0%) | 0 (0.0%) |
| 5 to 9 Minutes | 0 (0.0%) | 12 (2.0%) |
| 10 to 14 Minutes | 0 (0.0%) | 156 (25.7%) |
| 15 to 19 Minutes | 91 (24.9%) | 121 (19.9%) |
| 20 to 24 Minutes | 108 (29.6%) | 244 (40.1%) |
| 25 to 29 Minutes | 15 (4.1%) | 0 (0.0%) |
| 30 to 34 Minutes | 71 (19.5%) | 15 (2.5%) |
| 35 to 39 Minutes | 0 (0.0%) | 0 (0.0%) |
| 40 to 44 Minutes | 80 (21.9%) | 35 (5.8%) |
| 45 to 59 Minutes | 0 (0.0%) | 0 (0.0%) |
| 60 to 89 Minutes | 0 (0.0%) | 25 (4.1%) |
| 90 or more Minutes | 0 (0.0%) | 0 (0.0%) |
Time of Departure to Work by Sex in Prince George
The most frequent times of departure to work in Prince George are 7:00 AM to 7:29 AM (116, 31.8%) for males and 8:00 AM to 8:29 AM (162, 26.6%) for females.
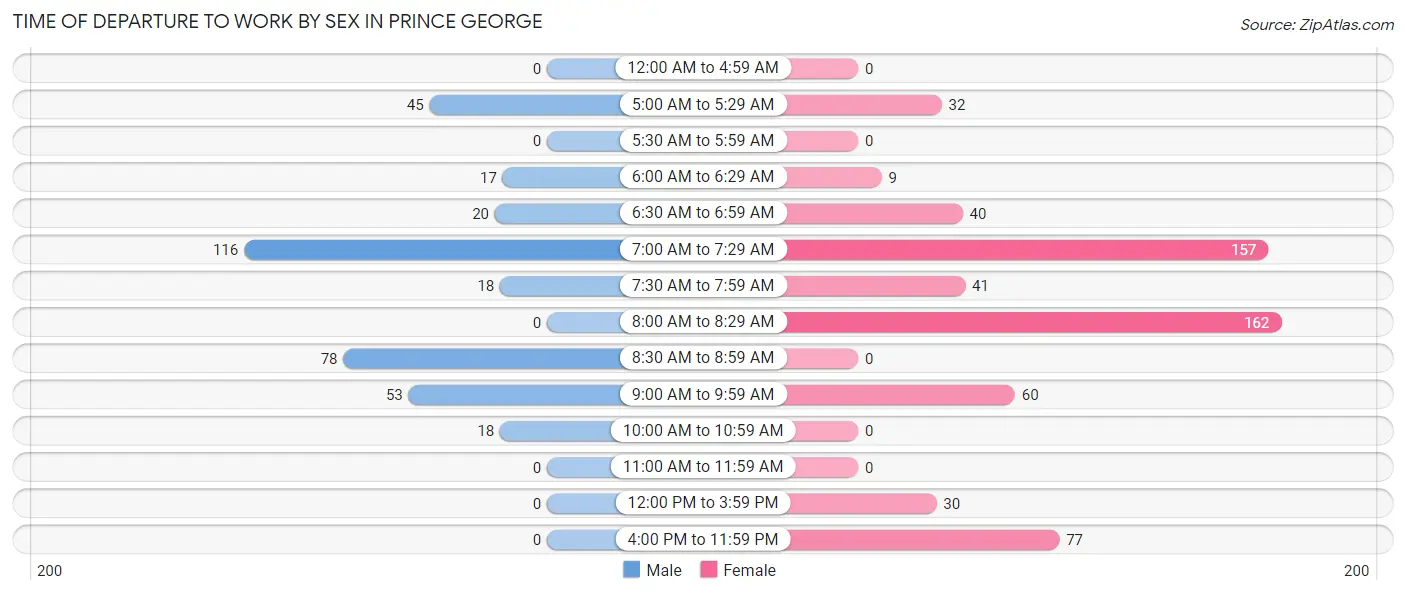
| Time of Departure | Male | Female |
| 12:00 AM to 4:59 AM | 0 (0.0%) | 0 (0.0%) |
| 5:00 AM to 5:29 AM | 45 (12.3%) | 32 (5.3%) |
| 5:30 AM to 5:59 AM | 0 (0.0%) | 0 (0.0%) |
| 6:00 AM to 6:29 AM | 17 (4.7%) | 9 (1.5%) |
| 6:30 AM to 6:59 AM | 20 (5.5%) | 40 (6.6%) |
| 7:00 AM to 7:29 AM | 116 (31.8%) | 157 (25.8%) |
| 7:30 AM to 7:59 AM | 18 (4.9%) | 41 (6.7%) |
| 8:00 AM to 8:29 AM | 0 (0.0%) | 162 (26.6%) |
| 8:30 AM to 8:59 AM | 78 (21.4%) | 0 (0.0%) |
| 9:00 AM to 9:59 AM | 53 (14.5%) | 60 (9.9%) |
| 10:00 AM to 10:59 AM | 18 (4.9%) | 0 (0.0%) |
| 11:00 AM to 11:59 AM | 0 (0.0%) | 0 (0.0%) |
| 12:00 PM to 3:59 PM | 0 (0.0%) | 30 (4.9%) |
| 4:00 PM to 11:59 PM | 0 (0.0%) | 77 (12.7%) |
| Total | 365 (100.0%) | 608 (100.0%) |
Housing Occupancy in Prince George
Occupancy by Ownership in Prince George
Of the total 706 dwellings in Prince George, owner-occupied units account for 382 (54.1%), while renter-occupied units make up 324 (45.9%).
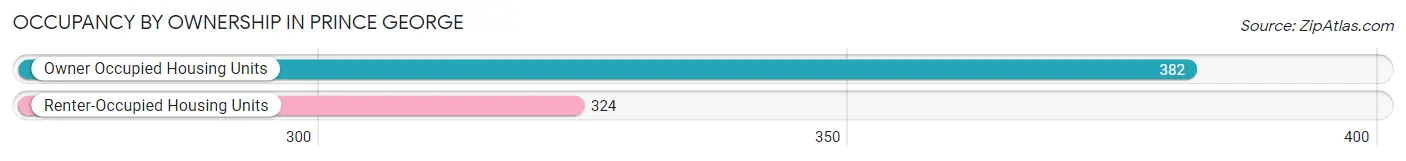
| Occupancy | # Housing Units | % Housing Units |
| Owner Occupied Housing Units | 382 | 54.1% |
| Renter-Occupied Housing Units | 324 | 45.9% |
| Total Occupied Housing Units | 706 | 100.0% |
Occupancy by Household Size in Prince George
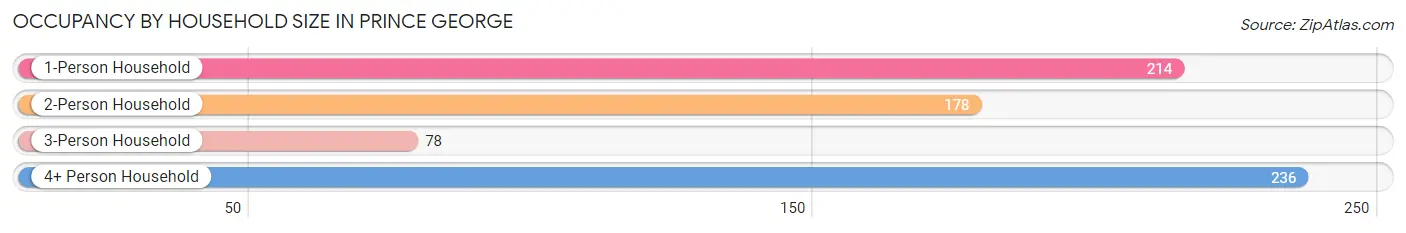
| Household Size | # Housing Units | % Housing Units |
| 1-Person Household | 214 | 30.3% |
| 2-Person Household | 178 | 25.2% |
| 3-Person Household | 78 | 11.1% |
| 4+ Person Household | 236 | 33.4% |
| Total Housing Units | 706 | 100.0% |
Occupancy by Ownership by Household Size in Prince George
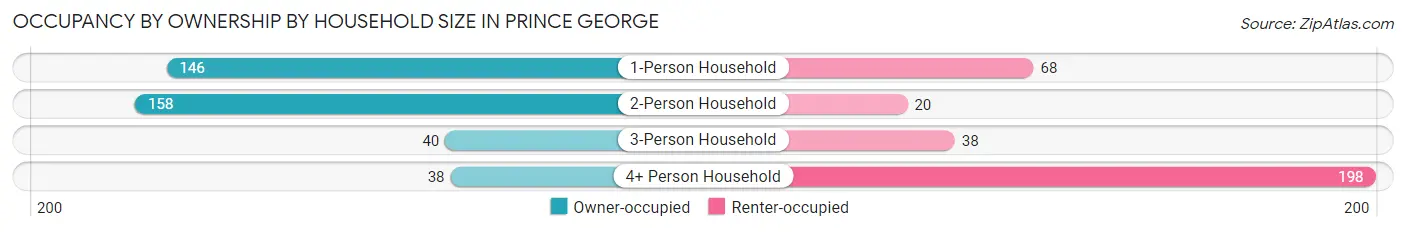
| Household Size | Owner-occupied | Renter-occupied |
| 1-Person Household | 146 (68.2%) | 68 (31.8%) |
| 2-Person Household | 158 (88.8%) | 20 (11.2%) |
| 3-Person Household | 40 (51.3%) | 38 (48.7%) |
| 4+ Person Household | 38 (16.1%) | 198 (83.9%) |
| Total Housing Units | 382 (54.1%) | 324 (45.9%) |
Occupancy by Educational Attainment in Prince George
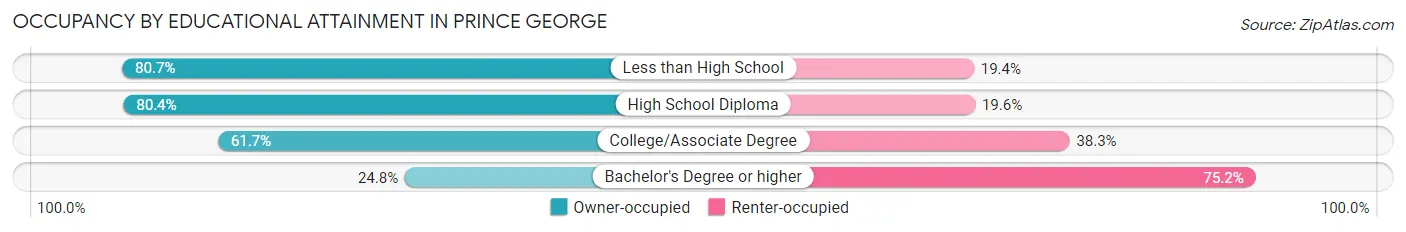
| Household Size | Owner-occupied | Renter-occupied |
| Less than High School | 50 (80.6%) | 12 (19.4%) |
| High School Diploma | 78 (80.4%) | 19 (19.6%) |
| College/Associate Degree | 198 (61.7%) | 123 (38.3%) |
| Bachelor's Degree or higher | 56 (24.8%) | 170 (75.2%) |
Occupancy by Age of Householder in Prince George
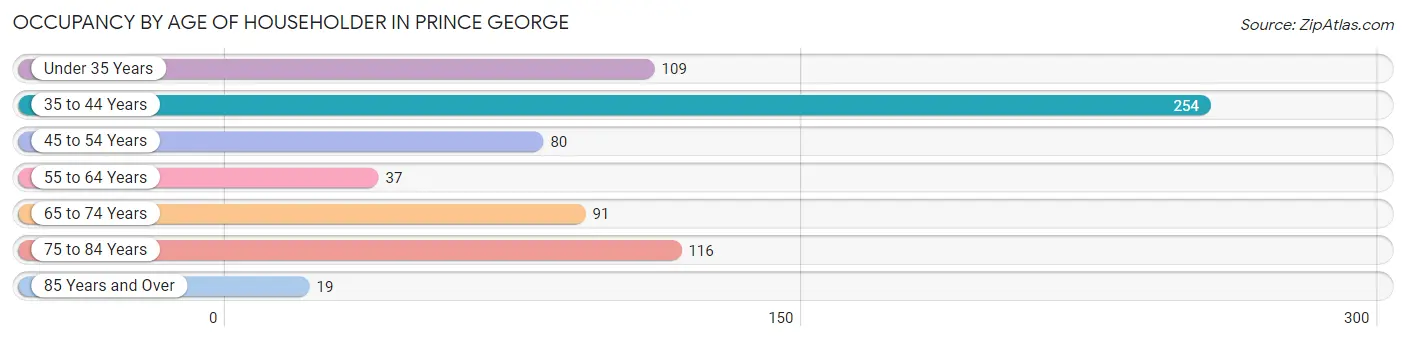
| Age Bracket | # Households | % Households |
| Under 35 Years | 109 | 15.4% |
| 35 to 44 Years | 254 | 36.0% |
| 45 to 54 Years | 80 | 11.3% |
| 55 to 64 Years | 37 | 5.2% |
| 65 to 74 Years | 91 | 12.9% |
| 75 to 84 Years | 116 | 16.4% |
| 85 Years and Over | 19 | 2.7% |
| Total | 706 | 100.0% |
Housing Finances in Prince George
Median Income by Occupancy in Prince George
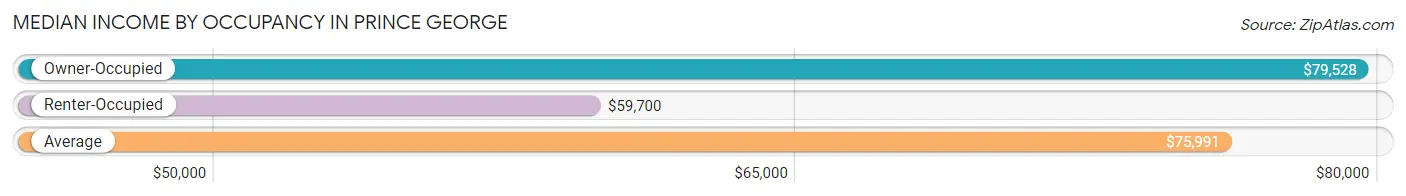
| Occupancy Type | # Households | Median Income |
| Owner-Occupied | 382 (54.1%) | $79,528 |
| Renter-Occupied | 324 (45.9%) | $59,700 |
| Average | 706 (100.0%) | $75,991 |
Occupancy by Householder Income Bracket in Prince George
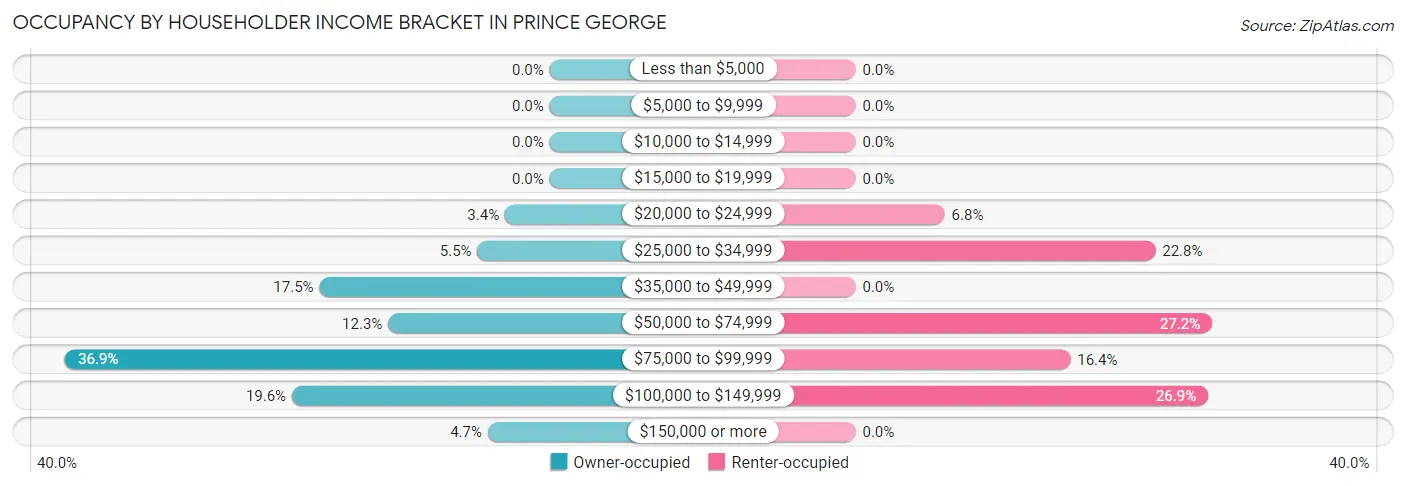
| Income Bracket | Owner-occupied | Renter-occupied |
| Less than $5,000 | 0 (0.0%) | 0 (0.0%) |
| $5,000 to $9,999 | 0 (0.0%) | 0 (0.0%) |
| $10,000 to $14,999 | 0 (0.0%) | 0 (0.0%) |
| $15,000 to $19,999 | 0 (0.0%) | 0 (0.0%) |
| $20,000 to $24,999 | 13 (3.4%) | 22 (6.8%) |
| $25,000 to $34,999 | 21 (5.5%) | 74 (22.8%) |
| $35,000 to $49,999 | 67 (17.5%) | 0 (0.0%) |
| $50,000 to $74,999 | 47 (12.3%) | 88 (27.2%) |
| $75,000 to $99,999 | 141 (36.9%) | 53 (16.4%) |
| $100,000 to $149,999 | 75 (19.6%) | 87 (26.9%) |
| $150,000 or more | 18 (4.7%) | 0 (0.0%) |
| Total | 382 (100.0%) | 324 (100.0%) |
Monthly Housing Cost Tiers in Prince George
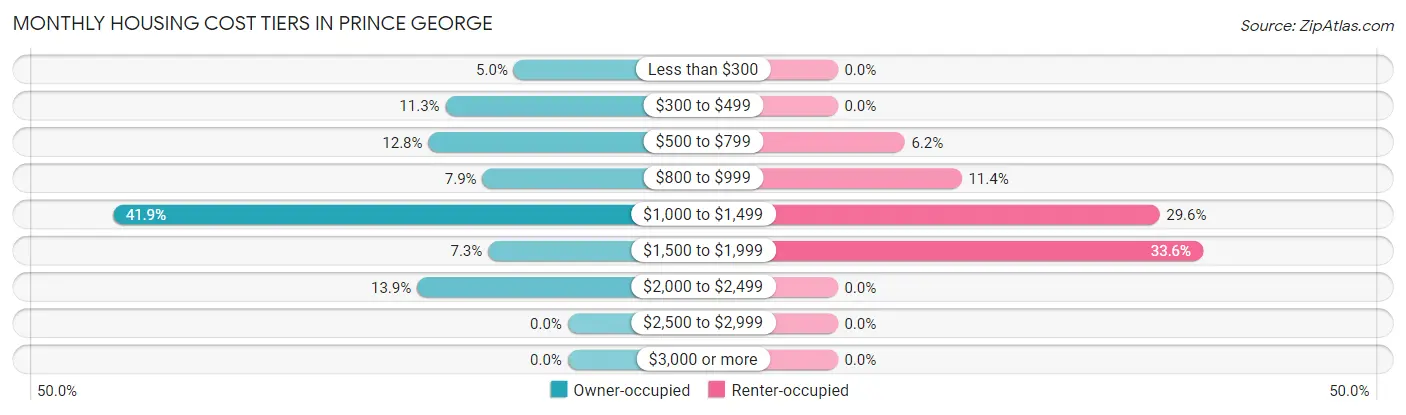
| Monthly Cost | Owner-occupied | Renter-occupied |
| Less than $300 | 19 (5.0%) | 0 (0.0%) |
| $300 to $499 | 43 (11.3%) | 0 (0.0%) |
| $500 to $799 | 49 (12.8%) | 20 (6.2%) |
| $800 to $999 | 30 (7.9%) | 37 (11.4%) |
| $1,000 to $1,499 | 160 (41.9%) | 96 (29.6%) |
| $1,500 to $1,999 | 28 (7.3%) | 109 (33.6%) |
| $2,000 to $2,499 | 53 (13.9%) | 0 (0.0%) |
| $2,500 to $2,999 | 0 (0.0%) | 0 (0.0%) |
| $3,000 or more | 0 (0.0%) | 0 (0.0%) |
| Total | 382 (100.0%) | 324 (100.0%) |
Physical Housing Characteristics in Prince George
Housing Structures in Prince George
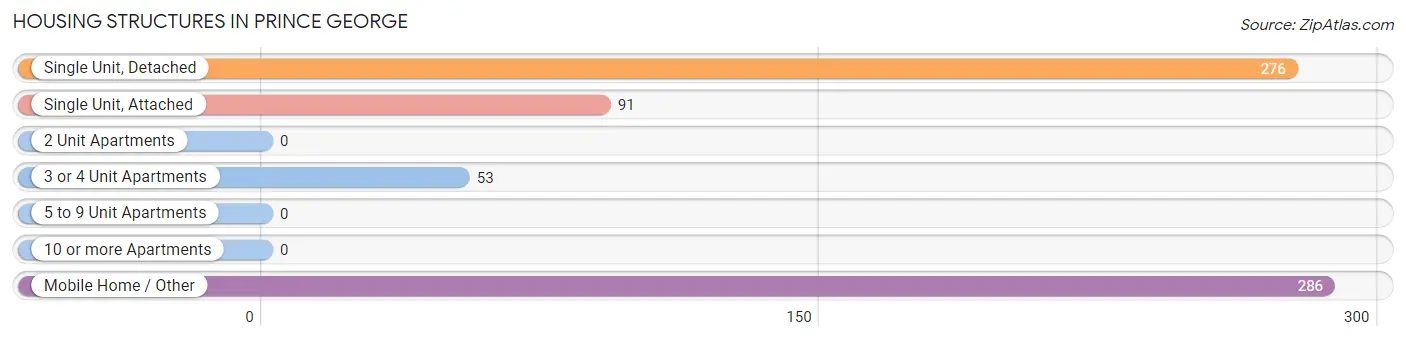
| Structure Type | # Housing Units | % Housing Units |
| Single Unit, Detached | 276 | 39.1% |
| Single Unit, Attached | 91 | 12.9% |
| 2 Unit Apartments | 0 | 0.0% |
| 3 or 4 Unit Apartments | 53 | 7.5% |
| 5 to 9 Unit Apartments | 0 | 0.0% |
| 10 or more Apartments | 0 | 0.0% |
| Mobile Home / Other | 286 | 40.5% |
| Total | 706 | 100.0% |
Housing Structures by Occupancy in Prince George
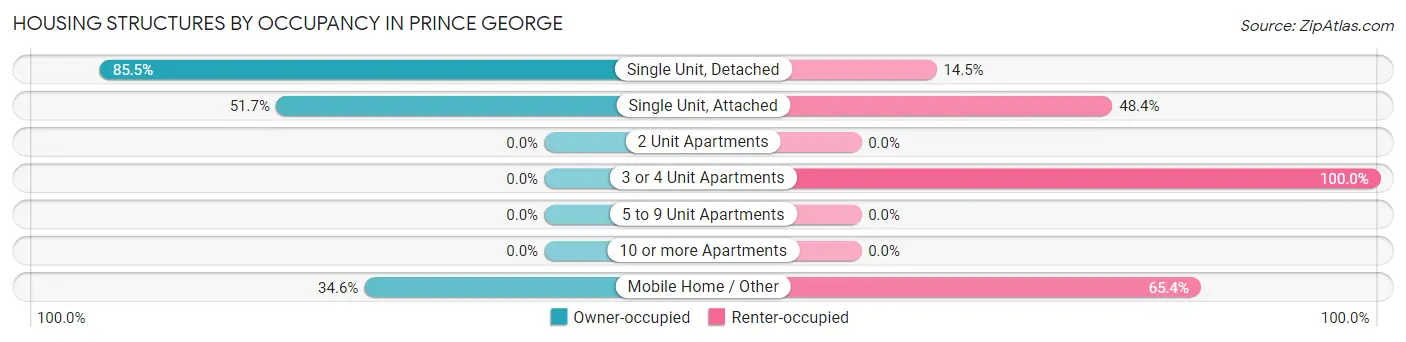
| Structure Type | Owner-occupied | Renter-occupied |
| Single Unit, Detached | 236 (85.5%) | 40 (14.5%) |
| Single Unit, Attached | 47 (51.6%) | 44 (48.3%) |
| 2 Unit Apartments | 0 (0.0%) | 0 (0.0%) |
| 3 or 4 Unit Apartments | 0 (0.0%) | 53 (100.0%) |
| 5 to 9 Unit Apartments | 0 (0.0%) | 0 (0.0%) |
| 10 or more Apartments | 0 (0.0%) | 0 (0.0%) |
| Mobile Home / Other | 99 (34.6%) | 187 (65.4%) |
| Total | 382 (54.1%) | 324 (45.9%) |
Housing Structures by Number of Rooms in Prince George
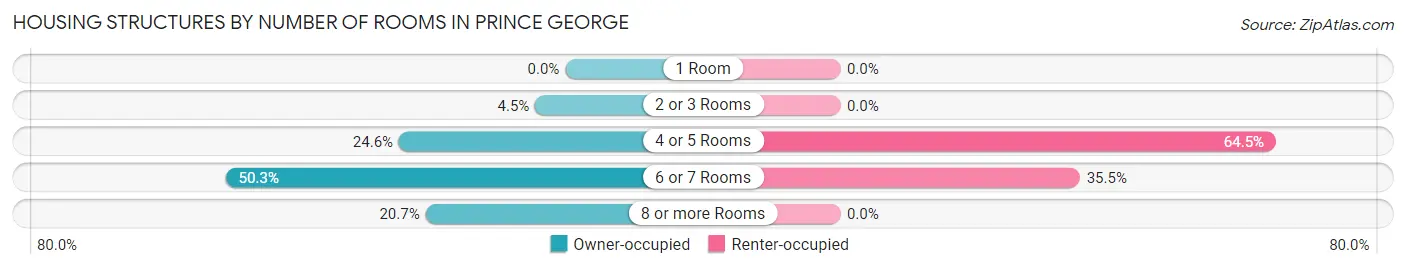
| Number of Rooms | Owner-occupied | Renter-occupied |
| 1 Room | 0 (0.0%) | 0 (0.0%) |
| 2 or 3 Rooms | 17 (4.4%) | 0 (0.0%) |
| 4 or 5 Rooms | 94 (24.6%) | 209 (64.5%) |
| 6 or 7 Rooms | 192 (50.3%) | 115 (35.5%) |
| 8 or more Rooms | 79 (20.7%) | 0 (0.0%) |
| Total | 382 (100.0%) | 324 (100.0%) |
Housing Structure by Heating Type in Prince George
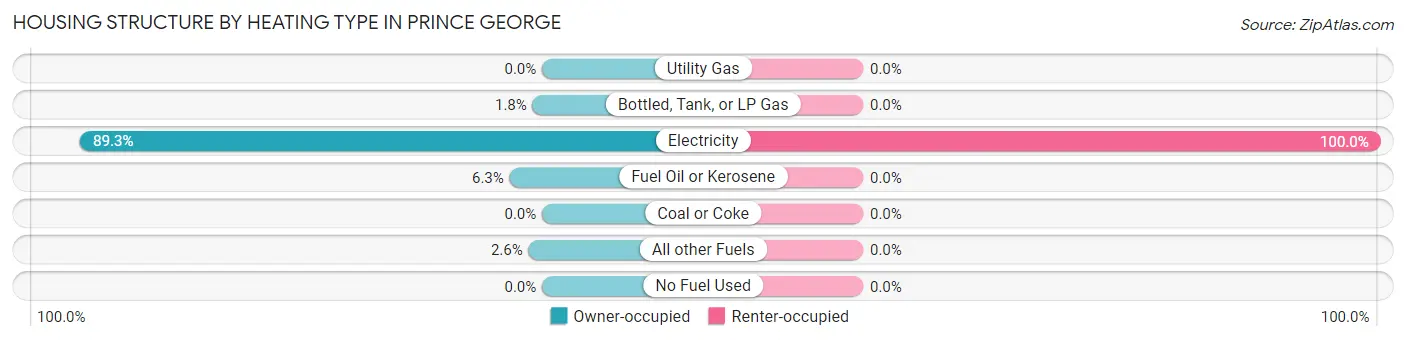
| Heating Type | Owner-occupied | Renter-occupied |
| Utility Gas | 0 (0.0%) | 0 (0.0%) |
| Bottled, Tank, or LP Gas | 7 (1.8%) | 0 (0.0%) |
| Electricity | 341 (89.3%) | 324 (100.0%) |
| Fuel Oil or Kerosene | 24 (6.3%) | 0 (0.0%) |
| Coal or Coke | 0 (0.0%) | 0 (0.0%) |
| All other Fuels | 10 (2.6%) | 0 (0.0%) |
| No Fuel Used | 0 (0.0%) | 0 (0.0%) |
| Total | 382 (100.0%) | 324 (100.0%) |
Household Vehicle Usage in Prince George
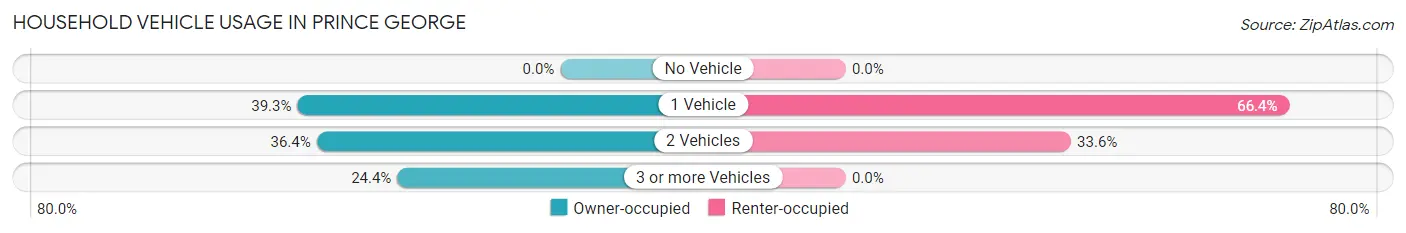
| Vehicles per Household | Owner-occupied | Renter-occupied |
| No Vehicle | 0 (0.0%) | 0 (0.0%) |
| 1 Vehicle | 150 (39.3%) | 215 (66.4%) |
| 2 Vehicles | 139 (36.4%) | 109 (33.6%) |
| 3 or more Vehicles | 93 (24.3%) | 0 (0.0%) |
| Total | 382 (100.0%) | 324 (100.0%) |
Real Estate & Mortgages in Prince George
Real Estate and Mortgage Overview in Prince George
| Characteristic | Without Mortgage | With Mortgage |
| Housing Units | 118 | 264 |
| Median Property Value | $213,200 | $272,400 |
| Median Household Income | $84,079 | $0 |
| Monthly Housing Costs | $550 | $0 |
| Real Estate Taxes | $1,500 | $66 |
Property Value by Mortgage Status in Prince George
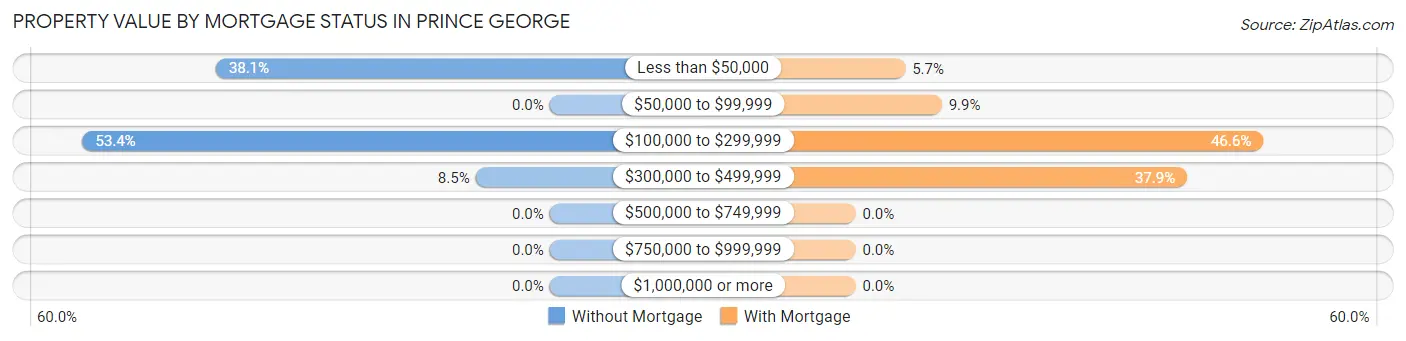
| Property Value | Without Mortgage | With Mortgage |
| Less than $50,000 | 45 (38.1%) | 15 (5.7%) |
| $50,000 to $99,999 | 0 (0.0%) | 26 (9.9%) |
| $100,000 to $299,999 | 63 (53.4%) | 123 (46.6%) |
| $300,000 to $499,999 | 10 (8.5%) | 100 (37.9%) |
| $500,000 to $749,999 | 0 (0.0%) | 0 (0.0%) |
| $750,000 to $999,999 | 0 (0.0%) | 0 (0.0%) |
| $1,000,000 or more | 0 (0.0%) | 0 (0.0%) |
| Total | 118 (100.0%) | 264 (100.0%) |
Household Income by Mortgage Status in Prince George
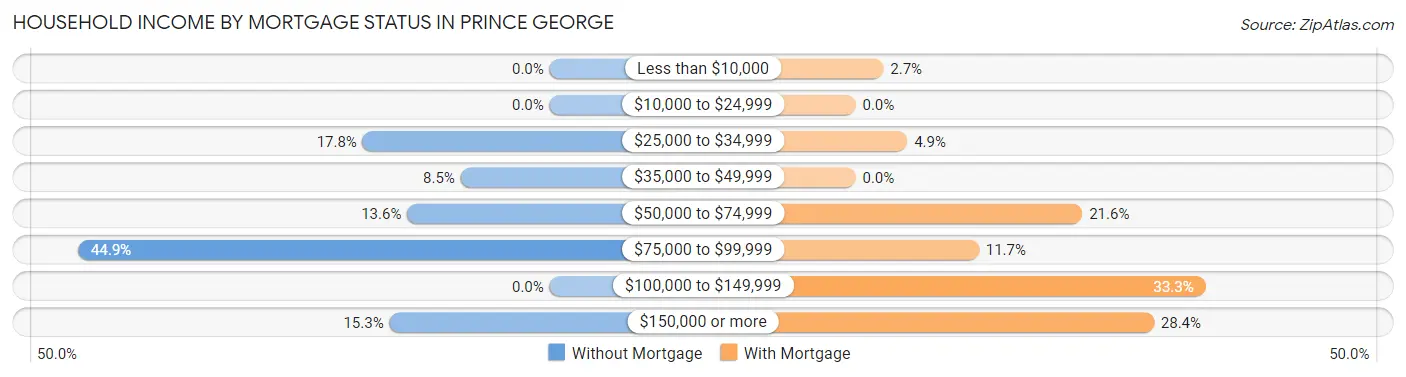
| Household Income | Without Mortgage | With Mortgage |
| Less than $10,000 | 0 (0.0%) | 7 (2.6%) |
| $10,000 to $24,999 | 0 (0.0%) | 0 (0.0%) |
| $25,000 to $34,999 | 21 (17.8%) | 13 (4.9%) |
| $35,000 to $49,999 | 10 (8.5%) | 0 (0.0%) |
| $50,000 to $74,999 | 16 (13.6%) | 57 (21.6%) |
| $75,000 to $99,999 | 53 (44.9%) | 31 (11.7%) |
| $100,000 to $149,999 | 0 (0.0%) | 88 (33.3%) |
| $150,000 or more | 18 (15.2%) | 75 (28.4%) |
| Total | 118 (100.0%) | 264 (100.0%) |
Property Value to Household Income Ratio in Prince George
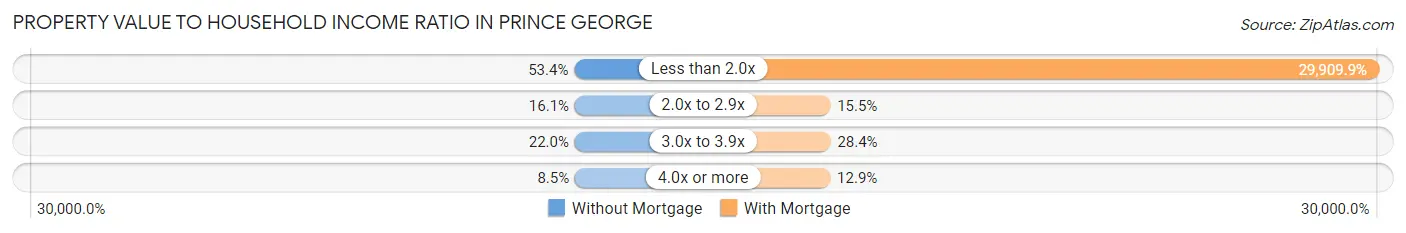
| Value-to-Income Ratio | Without Mortgage | With Mortgage |
| Less than 2.0x | 63 (53.4%) | 78,962 (29,909.9%) |
| 2.0x to 2.9x | 19 (16.1%) | 41 (15.5%) |
| 3.0x to 3.9x | 26 (22.0%) | 75 (28.4%) |
| 4.0x or more | 10 (8.5%) | 34 (12.9%) |
| Total | 118 (100.0%) | 264 (100.0%) |
Real Estate Taxes by Mortgage Status in Prince George
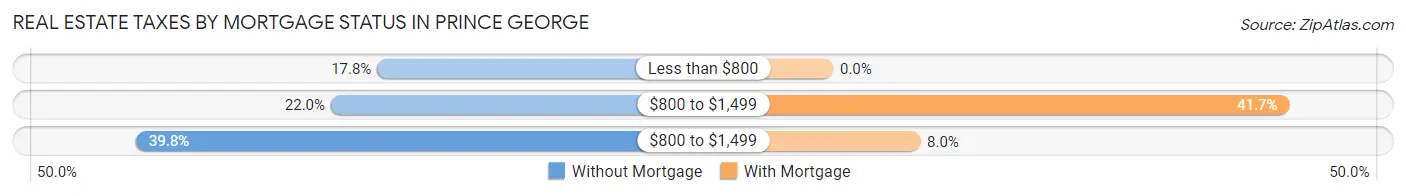
| Property Taxes | Without Mortgage | With Mortgage |
| Less than $800 | 21 (17.8%) | 0 (0.0%) |
| $800 to $1,499 | 26 (22.0%) | 110 (41.7%) |
| $800 to $1,499 | 47 (39.8%) | 21 (8.0%) |
| Total | 118 (100.0%) | 264 (100.0%) |
Health & Disability in Prince George
Health Insurance Coverage by Age in Prince George
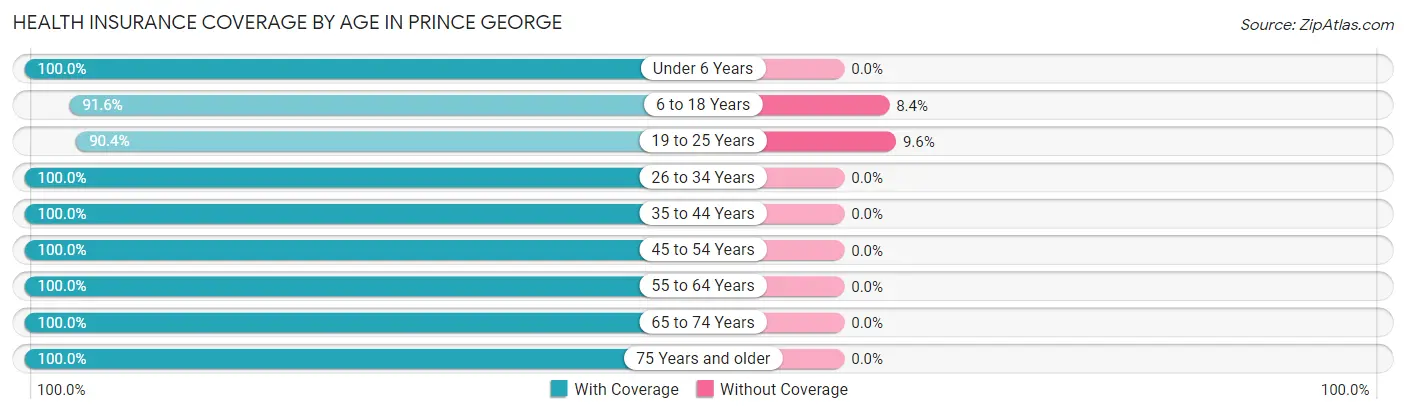
| Age Bracket | With Coverage | Without Coverage |
| Under 6 Years | 132 (100.0%) | 0 (0.0%) |
| 6 to 18 Years | 482 (91.6%) | 44 (8.4%) |
| 19 to 25 Years | 169 (90.4%) | 18 (9.6%) |
| 26 to 34 Years | 181 (100.0%) | 0 (0.0%) |
| 35 to 44 Years | 318 (100.0%) | 0 (0.0%) |
| 45 to 54 Years | 196 (100.0%) | 0 (0.0%) |
| 55 to 64 Years | 66 (100.0%) | 0 (0.0%) |
| 65 to 74 Years | 132 (100.0%) | 0 (0.0%) |
| 75 Years and older | 226 (100.0%) | 0 (0.0%) |
| Total | 1,902 (96.8%) | 62 (3.2%) |
Health Insurance Coverage by Citizenship Status in Prince George
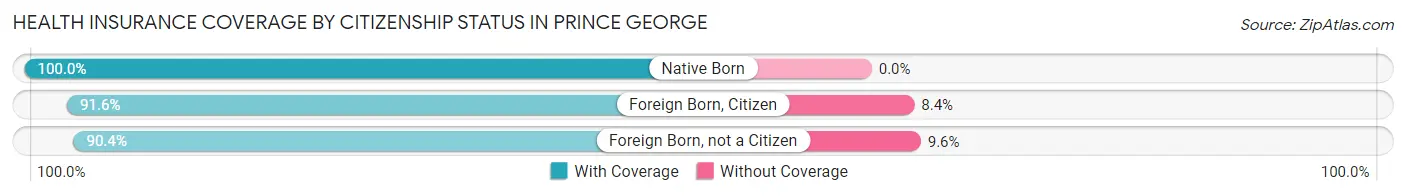
| Citizenship Status | With Coverage | Without Coverage |
| Native Born | 132 (100.0%) | 0 (0.0%) |
| Foreign Born, Citizen | 482 (91.6%) | 44 (8.4%) |
| Foreign Born, not a Citizen | 169 (90.4%) | 18 (9.6%) |
Health Insurance Coverage by Household Income in Prince George
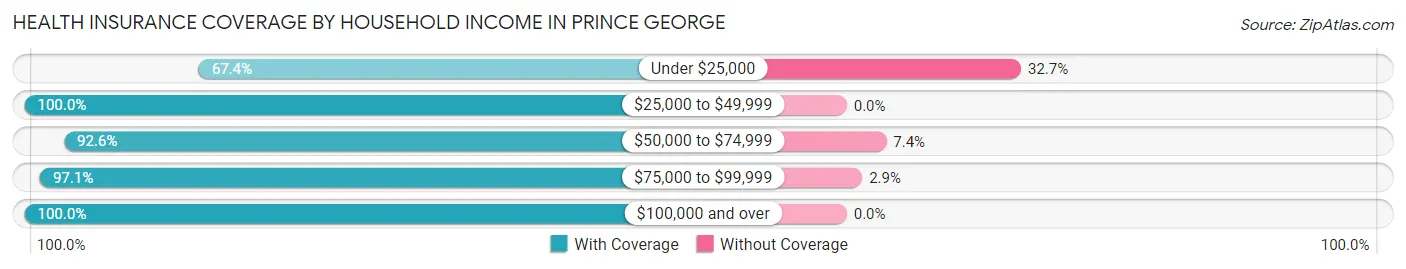
| Household Income | With Coverage | Without Coverage |
| Under $25,000 | 66 (67.3%) | 32 (32.7%) |
| $25,000 to $49,999 | 495 (100.0%) | 0 (0.0%) |
| $50,000 to $74,999 | 150 (92.6%) | 12 (7.4%) |
| $75,000 to $99,999 | 605 (97.1%) | 18 (2.9%) |
| $100,000 and over | 586 (100.0%) | 0 (0.0%) |
Public vs Private Health Insurance Coverage by Age in Prince George
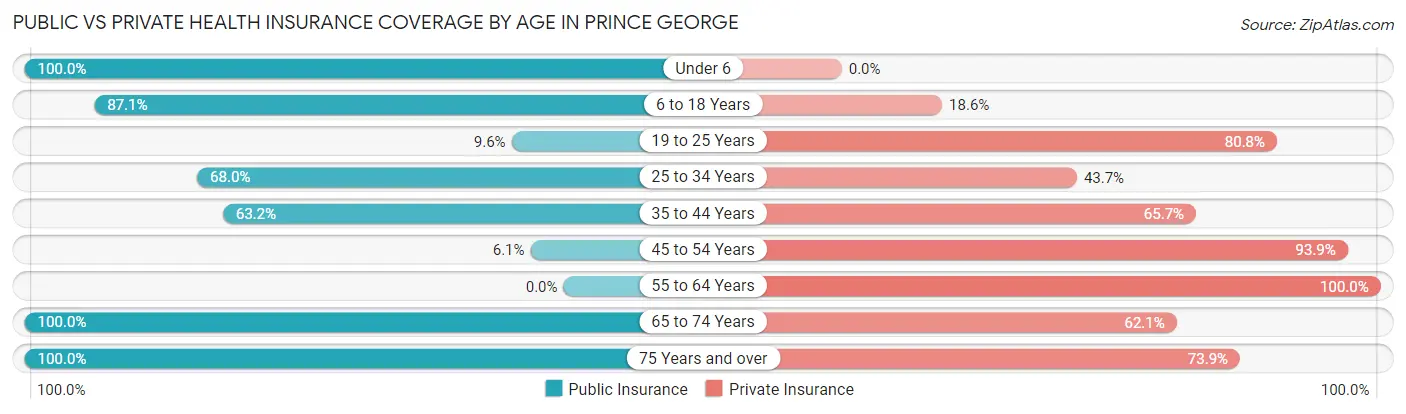
| Age Bracket | Public Insurance | Private Insurance |
| Under 6 | 132 (100.0%) | 0 (0.0%) |
| 6 to 18 Years | 458 (87.1%) | 98 (18.6%) |
| 19 to 25 Years | 18 (9.6%) | 151 (80.7%) |
| 25 to 34 Years | 123 (68.0%) | 79 (43.6%) |
| 35 to 44 Years | 201 (63.2%) | 209 (65.7%) |
| 45 to 54 Years | 12 (6.1%) | 184 (93.9%) |
| 55 to 64 Years | 0 (0.0%) | 66 (100.0%) |
| 65 to 74 Years | 132 (100.0%) | 82 (62.1%) |
| 75 Years and over | 226 (100.0%) | 167 (73.9%) |
| Total | 1,302 (66.3%) | 1,036 (52.7%) |
Disability Status by Sex by Age in Prince George
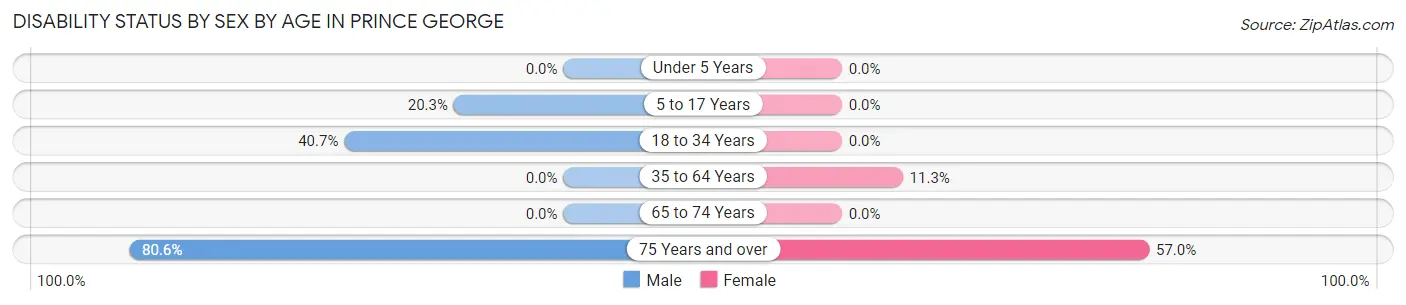
| Age Bracket | Male | Female |
| Under 5 Years | 0 (0.0%) | 0 (0.0%) |
| 5 to 17 Years | 37 (20.3%) | 0 (0.0%) |
| 18 to 34 Years | 85 (40.7%) | 0 (0.0%) |
| 35 to 64 Years | 0 (0.0%) | 40 (11.3%) |
| 65 to 74 Years | 0 (0.0%) | 0 (0.0%) |
| 75 Years and over | 79 (80.6%) | 73 (57.0%) |
Disability Class by Sex by Age in Prince George
Disability Class: Hearing Difficulty
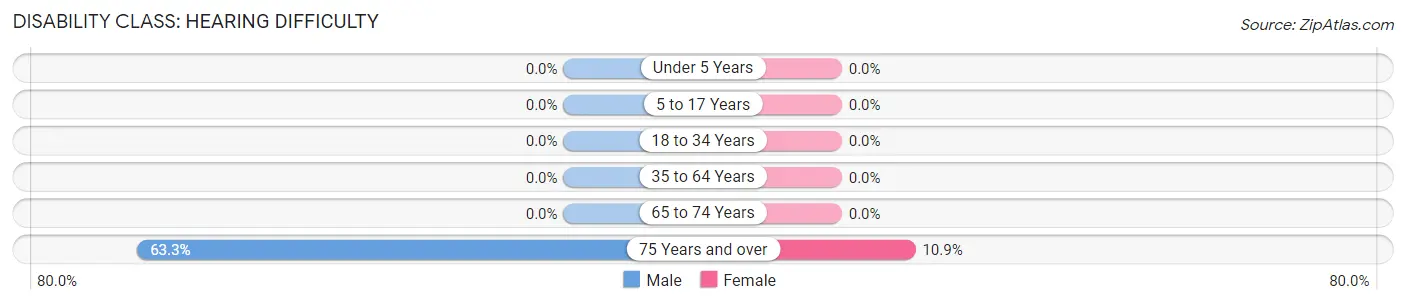
| Age Bracket | Male | Female |
| Under 5 Years | 0 (0.0%) | 0 (0.0%) |
| 5 to 17 Years | 0 (0.0%) | 0 (0.0%) |
| 18 to 34 Years | 0 (0.0%) | 0 (0.0%) |
| 35 to 64 Years | 0 (0.0%) | 0 (0.0%) |
| 65 to 74 Years | 0 (0.0%) | 0 (0.0%) |
| 75 Years and over | 62 (63.3%) | 14 (10.9%) |
Disability Class: Vision Difficulty
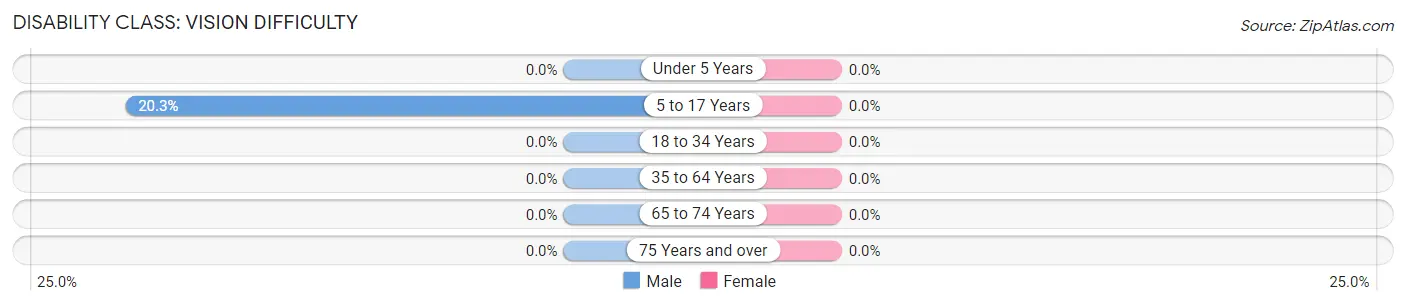
| Age Bracket | Male | Female |
| Under 5 Years | 0 (0.0%) | 0 (0.0%) |
| 5 to 17 Years | 37 (20.3%) | 0 (0.0%) |
| 18 to 34 Years | 0 (0.0%) | 0 (0.0%) |
| 35 to 64 Years | 0 (0.0%) | 0 (0.0%) |
| 65 to 74 Years | 0 (0.0%) | 0 (0.0%) |
| 75 Years and over | 0 (0.0%) | 0 (0.0%) |
Disability Class: Cognitive Difficulty
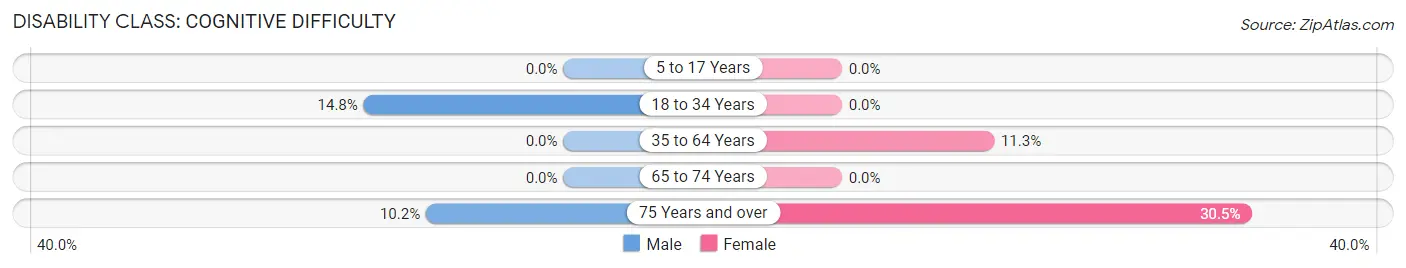
| Age Bracket | Male | Female |
| 5 to 17 Years | 0 (0.0%) | 0 (0.0%) |
| 18 to 34 Years | 31 (14.8%) | 0 (0.0%) |
| 35 to 64 Years | 0 (0.0%) | 40 (11.3%) |
| 65 to 74 Years | 0 (0.0%) | 0 (0.0%) |
| 75 Years and over | 10 (10.2%) | 39 (30.5%) |
Disability Class: Ambulatory Difficulty
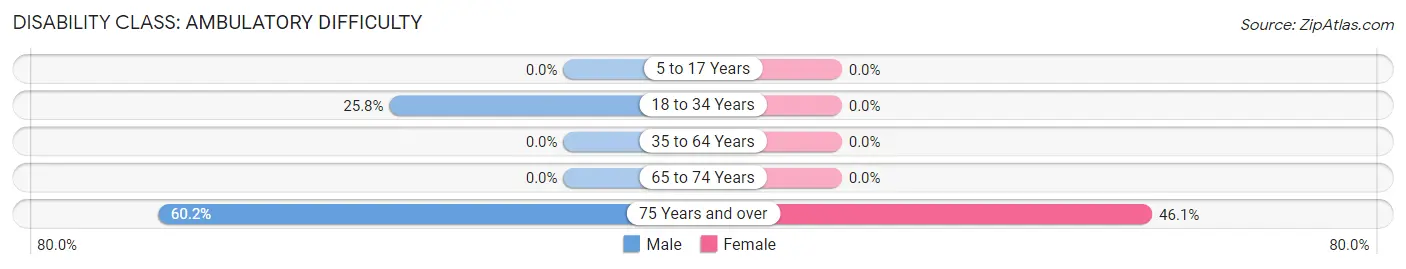
| Age Bracket | Male | Female |
| 5 to 17 Years | 0 (0.0%) | 0 (0.0%) |
| 18 to 34 Years | 54 (25.8%) | 0 (0.0%) |
| 35 to 64 Years | 0 (0.0%) | 0 (0.0%) |
| 65 to 74 Years | 0 (0.0%) | 0 (0.0%) |
| 75 Years and over | 59 (60.2%) | 59 (46.1%) |
Disability Class: Self-Care Difficulty
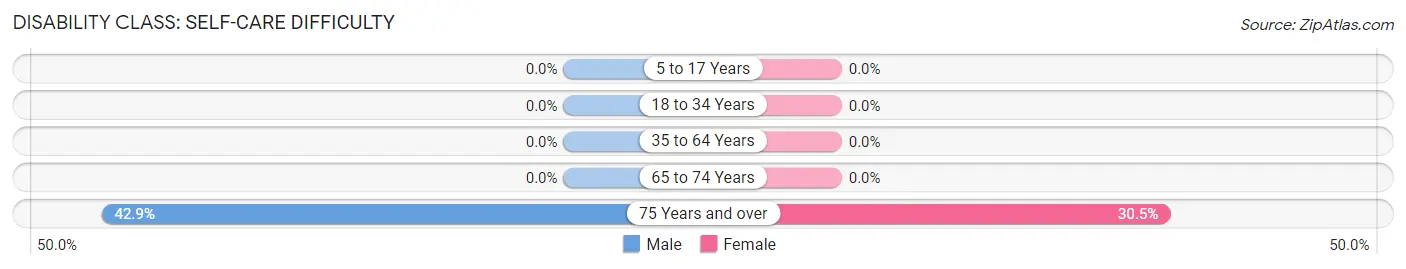
| Age Bracket | Male | Female |
| 5 to 17 Years | 0 (0.0%) | 0 (0.0%) |
| 18 to 34 Years | 0 (0.0%) | 0 (0.0%) |
| 35 to 64 Years | 0 (0.0%) | 0 (0.0%) |
| 65 to 74 Years | 0 (0.0%) | 0 (0.0%) |
| 75 Years and over | 42 (42.9%) | 39 (30.5%) |
Technology Access in Prince George
Computing Device Access in Prince George
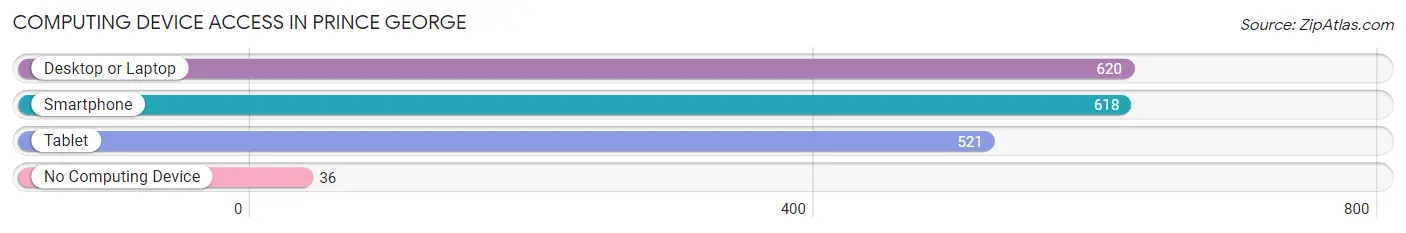
| Device Type | # Households | % Households |
| Desktop or Laptop | 620 | 87.8% |
| Smartphone | 618 | 87.5% |
| Tablet | 521 | 73.8% |
| No Computing Device | 36 | 5.1% |
| Total | 706 | 100.0% |
Internet Access in Prince George
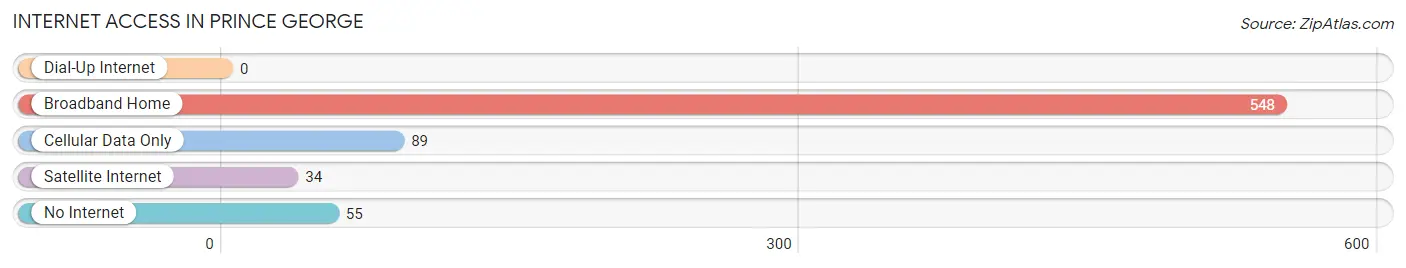
| Internet Type | # Households | % Households |
| Dial-Up Internet | 0 | 0.0% |
| Broadband Home | 548 | 77.6% |
| Cellular Data Only | 89 | 12.6% |
| Satellite Internet | 34 | 4.8% |
| No Internet | 55 | 7.8% |
| Total | 706 | 100.0% |
Prince George Summary
George, Virginia is a small town located in the southeastern part of the state, in Prince George County. It is situated on the Appomattox River, about 25 miles south of Richmond. The town was founded in 1702 and is one of the oldest towns in the state. It is also the county seat of Prince George County.
Geography
Prince George is located in the southeastern part of Virginia, in Prince George County. It is situated on the Appomattox River, about 25 miles south of Richmond. The town is located in the Coastal Plain region of the state, and is surrounded by a number of small towns and rural areas. The town is located in a flat area, with the Appomattox River providing a natural boundary to the east. The town is also located near the James River, which provides a natural boundary to the west.
The town is located in a humid subtropical climate zone, with hot, humid summers and mild winters. The average annual temperature is around 60 degrees Fahrenheit, with the average high temperature in the summer months reaching around 90 degrees Fahrenheit. The average low temperature in the winter months is around 30 degrees Fahrenheit.
Economy
Prince George has a diverse economy, with a variety of industries providing employment opportunities. The largest employers in the town are the local government, the school system, and the health care industry. Other major employers include manufacturing, retail, and hospitality.
The town is also home to a number of small businesses, including restaurants, shops, and other services. The town is also home to a number of farms, which provide a variety of agricultural products.
Demographics
As of the 2010 census, the population of Prince George was 8,819. The population is predominantly white, with African Americans making up the largest minority group. The median household income is $50,845, and the median age is 38.
The town is served by the Prince George County Public Schools system, which includes four elementary schools, one middle school, and one high school. The town is also home to a number of private schools, including the Prince George Christian Academy and the Prince George Montessori School.
Conclusion
Prince George, Virginia is a small town located in the southeastern part of the state, in Prince George County. It is situated on the Appomattox River, about 25 miles south of Richmond. The town was founded in 1702 and is one of the oldest towns in the state. It is also the county seat of Prince George County. The town has a diverse economy, with a variety of industries providing employment opportunities. The population is predominantly white, with African Americans making up the largest minority group. The town is served by the Prince George County Public Schools system, and is home to a number of private schools.
Common Questions
What is Per Capita Income in Prince George?
Per Capita income in Prince George is $29,675.
What is the Median Family Income in Prince George?
Median Family Income in Prince George is $76,038.
What is the Median Household income in Prince George?
Median Household Income in Prince George is $75,991.
What is Income or Wage Gap in Prince George?
Income or Wage Gap in Prince George is 37.9%.
Women in Prince George earn 62.1 cents for every dollar earned by a man.
What is Inequality or Gini Index in Prince George?
Inequality or Gini Index in Prince George is 0.28.
What is the Total Population of Prince George?
Total Population of Prince George is 1,964.
What is the Total Male Population of Prince George?
Total Male Population of Prince George is 781.
What is the Total Female Population of Prince George?
Total Female Population of Prince George is 1,183.
What is the Ratio of Males per 100 Females in Prince George?
There are 66.02 Males per 100 Females in Prince George.
What is the Ratio of Females per 100 Males in Prince George?
There are 151.47 Females per 100 Males in Prince George.
What is the Median Population Age in Prince George?
Median Population Age in Prince George is 34.4 Years.
What is the Average Family Size in Prince George
Average Family Size in Prince George is 3.4 People.
What is the Average Household Size in Prince George
Average Household Size in Prince George is 2.8 People.
How Large is the Labor Force in Prince George?
There are 991 People in the Labor Forcein in Prince George.
What is the Percentage of People in the Labor Force in Prince George?
66.4% of People are in the Labor Force in Prince George.