Pennington Gap, VA Map & Demographics
Pennington Gap Map
Pennington Gap Overview
$17,779
PER CAPITA INCOME
$32,500
AVG FAMILY INCOME
$24,222
AVG HOUSEHOLD INCOME
0.61
INEQUALITY / GINI INDEX
2,254
TOTAL POPULATION
964
MALE POPULATION
1,290
FEMALE POPULATION
74.73
MALES / 100 FEMALES
133.82
FEMALES / 100 MALES
32.2
MEDIAN AGE
3.6
AVG FAMILY SIZE
2.8
AVG HOUSEHOLD SIZE
630
LABOR FORCE [ PEOPLE ]
40.4%
PERCENT IN LABOR FORCE
21.2%
UNEMPLOYMENT RATE
Pennington Gap Zip Codes
Pennington Gap Area Codes
Income in Pennington Gap
Income Overview in Pennington Gap
Per Capita Income in Pennington Gap is $17,779, while median incomes of families and households are $32,500 and $24,222 respectively.
| Characteristic | Number | Measure |
| Per Capita Income | 2,254 | $17,779 |
| Median Family Income | 496 | $32,500 |
| Mean Family Income | 496 | $57,281 |
| Median Household Income | 750 | $24,222 |
| Mean Household Income | 750 | $47,021 |
| Income Deficit | 496 | $0 |
| Wage / Income Gap (%) | 2,254 | 0.00% |
| Wage / Income Gap ($) | 2,254 | 100.00¢ per $1 |
| Gini / Inequality Index | 2,254 | 0.61 |
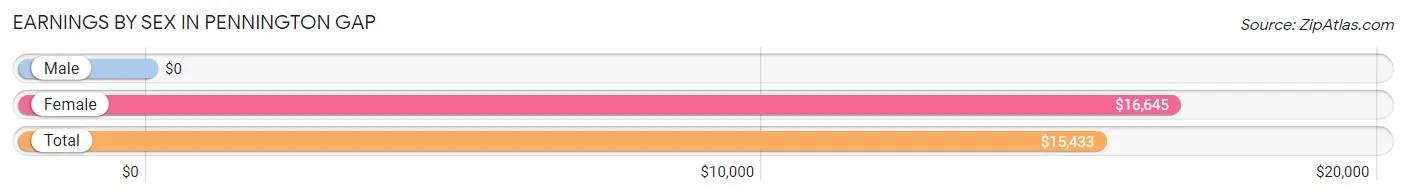
Earnings by Sex in Pennington Gap
| Sex | Number | Average Earnings |
| Male | 214 (31.4%) | $0 |
| Female | 467 (68.6%) | $16,645 |
| Total | 681 (100.0%) | $15,433 |
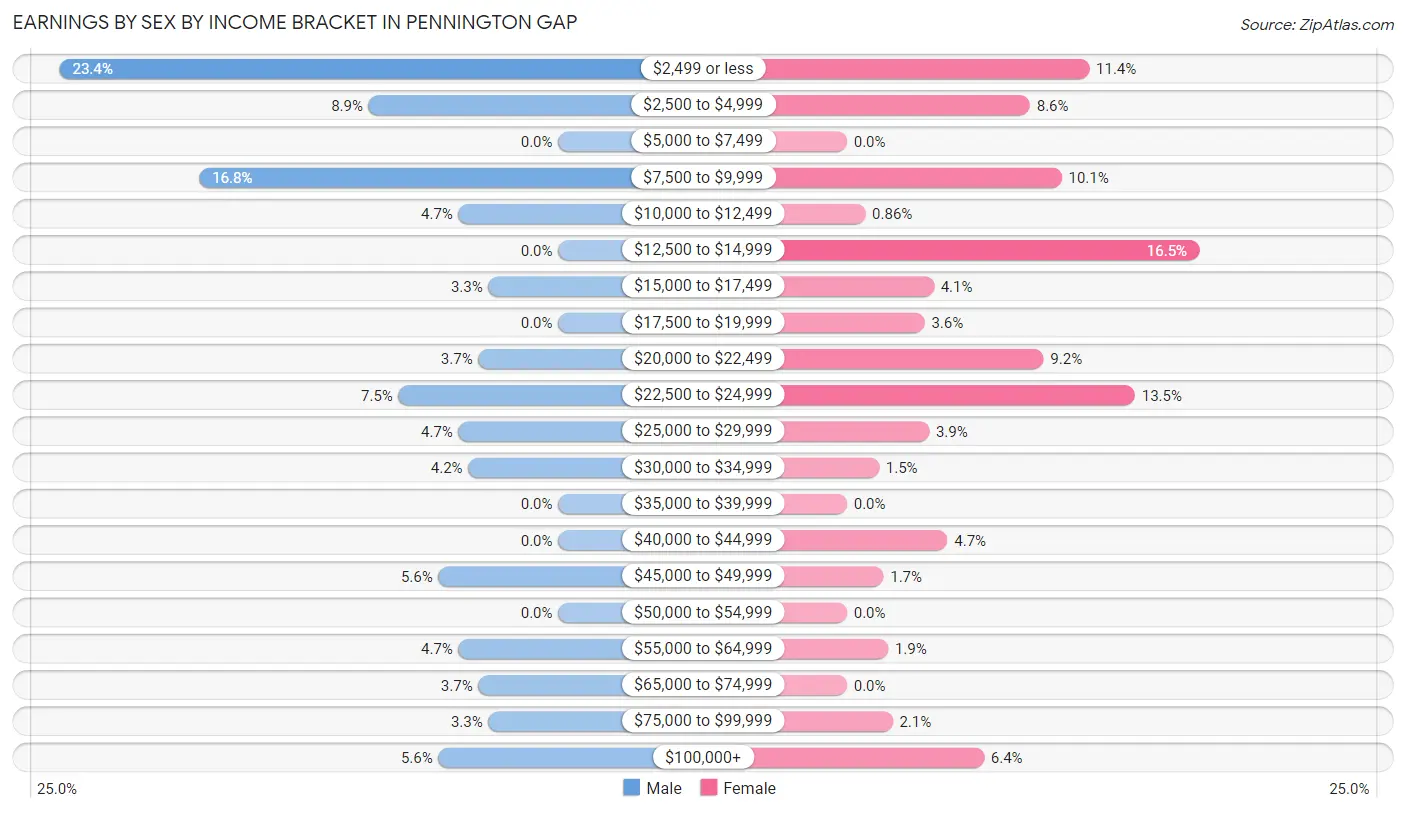
Earnings by Sex by Income Bracket in Pennington Gap
The most common earnings brackets in Pennington Gap are $2,499 or less for men (50 | 23.4%) and $12,500 to $14,999 for women (77 | 16.5%).
| Income | Male | Female |
| $2,499 or less | 50 (23.4%) | 53 (11.4%) |
| $2,500 to $4,999 | 19 (8.9%) | 40 (8.6%) |
| $5,000 to $7,499 | 0 (0.0%) | 0 (0.0%) |
| $7,500 to $9,999 | 36 (16.8%) | 47 (10.1%) |
| $10,000 to $12,499 | 10 (4.7%) | 4 (0.9%) |
| $12,500 to $14,999 | 0 (0.0%) | 77 (16.5%) |
| $15,000 to $17,499 | 7 (3.3%) | 19 (4.1%) |
| $17,500 to $19,999 | 0 (0.0%) | 17 (3.6%) |
| $20,000 to $22,499 | 8 (3.7%) | 43 (9.2%) |
| $22,500 to $24,999 | 16 (7.5%) | 63 (13.5%) |
| $25,000 to $29,999 | 10 (4.7%) | 18 (3.8%) |
| $30,000 to $34,999 | 9 (4.2%) | 7 (1.5%) |
| $35,000 to $39,999 | 0 (0.0%) | 0 (0.0%) |
| $40,000 to $44,999 | 0 (0.0%) | 22 (4.7%) |
| $45,000 to $49,999 | 12 (5.6%) | 8 (1.7%) |
| $50,000 to $54,999 | 0 (0.0%) | 0 (0.0%) |
| $55,000 to $64,999 | 10 (4.7%) | 9 (1.9%) |
| $65,000 to $74,999 | 8 (3.7%) | 0 (0.0%) |
| $75,000 to $99,999 | 7 (3.3%) | 10 (2.1%) |
| $100,000+ | 12 (5.6%) | 30 (6.4%) |
| Total | 214 (100.0%) | 467 (100.0%) |
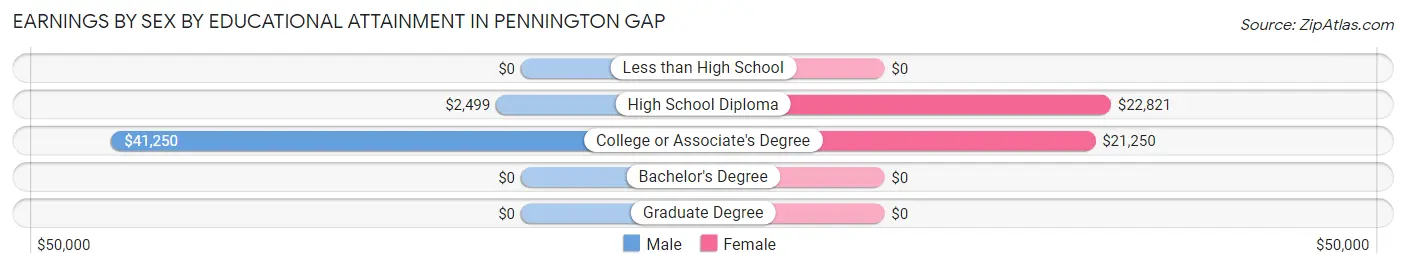
Earnings by Sex by Educational Attainment in Pennington Gap
Average earnings in Pennington Gap are $24,453 for men and $14,919 for women, a difference of 39.0%. Men with an educational attainment of college or associate's degree enjoy the highest average annual earnings of $41,250, while those with high school diploma education earn the least with $2,499. Women with an educational attainment of high school diploma earn the most with the average annual earnings of $22,821, while those with college or associate's degree education have the smallest earnings of $21,250.
| Educational Attainment | Male Income | Female Income |
| Less than High School | - | - |
| High School Diploma | $2,499 | $22,821 |
| College or Associate's Degree | $41,250 | $21,250 |
| Bachelor's Degree | - | - |
| Graduate Degree | - | - |
| Total | $24,453 | $14,919 |
Family Income in Pennington Gap
Family Income Brackets in Pennington Gap
According to the Pennington Gap family income data, there are 118 families falling into the $15,000 to $24,999 income range, which is the most common income bracket and makes up 23.8% of all families. Conversely, the $150,000 to $199,999 income bracket is the least frequent group with only 5 families (1.0%) belonging to this category.
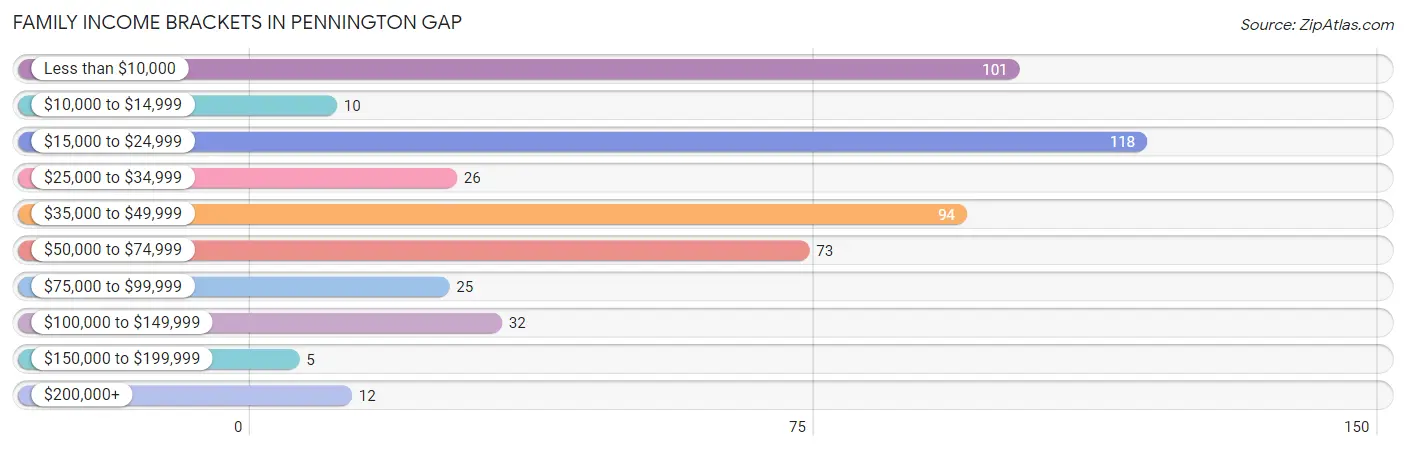
| Income Bracket | # Families | % Families |
| Less than $10,000 | 101 | 20.4% |
| $10,000 to $14,999 | 10 | 2.0% |
| $15,000 to $24,999 | 118 | 23.8% |
| $25,000 to $34,999 | 26 | 5.2% |
| $35,000 to $49,999 | 94 | 19.0% |
| $50,000 to $74,999 | 73 | 14.7% |
| $75,000 to $99,999 | 25 | 5.0% |
| $100,000 to $149,999 | 32 | 6.5% |
| $150,000 to $199,999 | 5 | 1.0% |
| $200,000+ | 12 | 2.4% |
Family Income by Famaliy Size in Pennington Gap
2-person families (206 | 41.5%) account for the highest median family income in Pennington Gap with $38,333 per family, while 2-person families (206 | 41.5%) have the highest median income of $19,166 per family member.
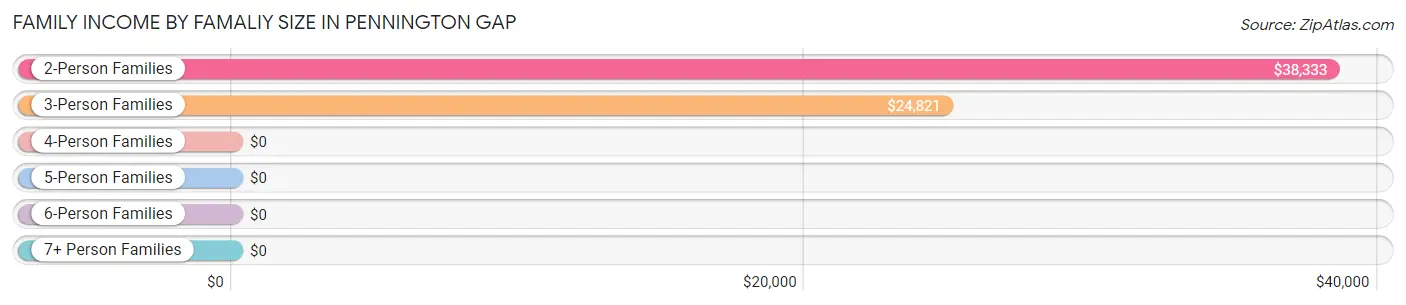
| Income Bracket | # Families | Median Income |
| 2-Person Families | 206 (41.5%) | $38,333 |
| 3-Person Families | 148 (29.8%) | $24,821 |
| 4-Person Families | 82 (16.5%) | $0 |
| 5-Person Families | 32 (6.5%) | $0 |
| 6-Person Families | 0 (0.0%) | $0 |
| 7+ Person Families | 28 (5.7%) | $0 |
| Total | 496 (100.0%) | $32,500 |
Family Income by Number of Earners in Pennington Gap
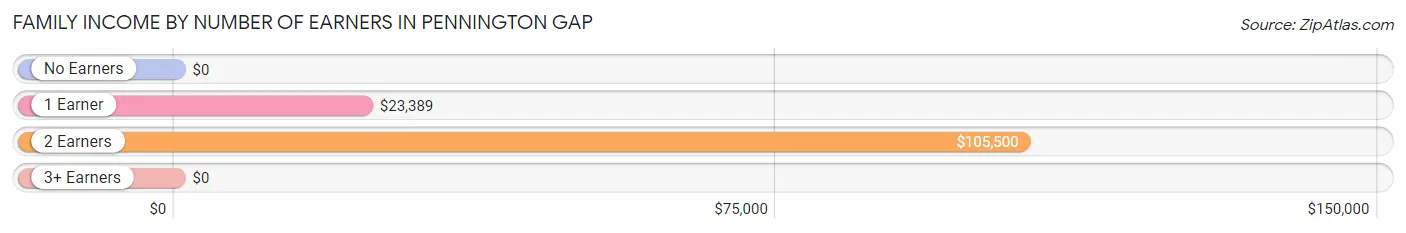
| Number of Earners | # Families | Median Income |
| No Earners | 188 (37.9%) | $0 |
| 1 Earner | 208 (41.9%) | $23,389 |
| 2 Earners | 72 (14.5%) | $105,500 |
| 3+ Earners | 28 (5.7%) | $0 |
| Total | 496 (100.0%) | $32,500 |
Household Income in Pennington Gap
Household Income Brackets in Pennington Gap
With 144 households falling in the category, the $15,000 to $24,999 income range is the most frequent in Pennington Gap, accounting for 19.2% of all households. In contrast, only 5 households (0.7%) fall into the $150,000 to $199,999 income bracket, making it the least populous group.
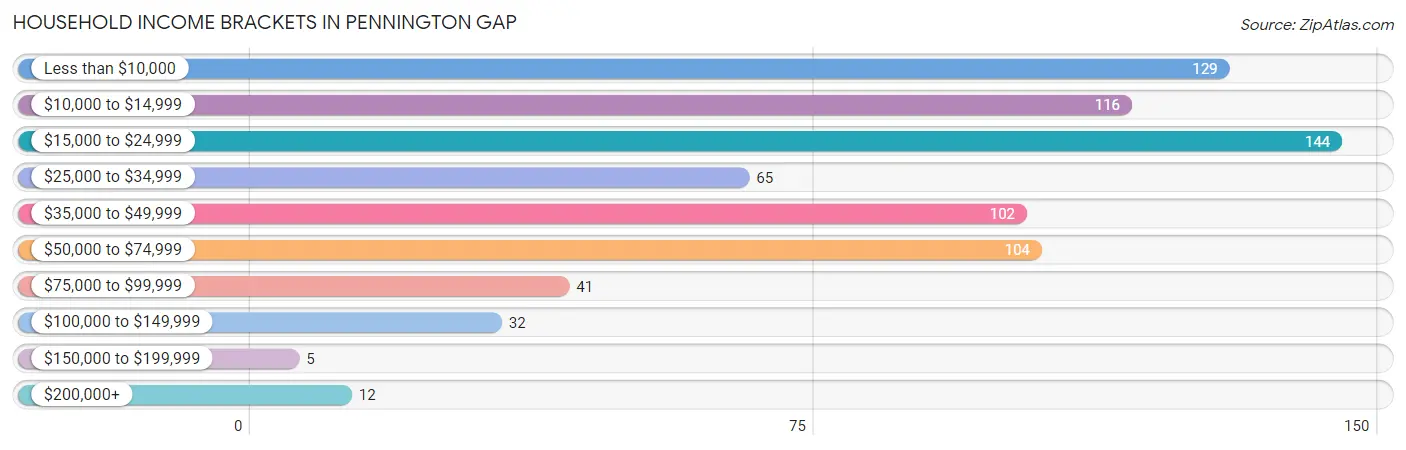
| Income Bracket | # Households | % Households |
| Less than $10,000 | 129 | 17.2% |
| $10,000 to $14,999 | 116 | 15.5% |
| $15,000 to $24,999 | 144 | 19.2% |
| $25,000 to $34,999 | 65 | 8.7% |
| $35,000 to $49,999 | 102 | 13.6% |
| $50,000 to $74,999 | 104 | 13.9% |
| $75,000 to $99,999 | 41 | 5.5% |
| $100,000 to $149,999 | 32 | 4.3% |
| $150,000 to $199,999 | 5 | 0.7% |
| $200,000+ | 12 | 1.6% |
Household Income by Householder Age in Pennington Gap
The median household income in Pennington Gap is $24,222, with the highest median household income of $32,917 found in the 65+ years age bracket for the primary householder. A total of 183 households (24.4%) fall into this category. Meanwhile, the 15 to 24 years age bracket for the primary householder has the lowest median household income of $0, with 12 households (1.6%) in this group.
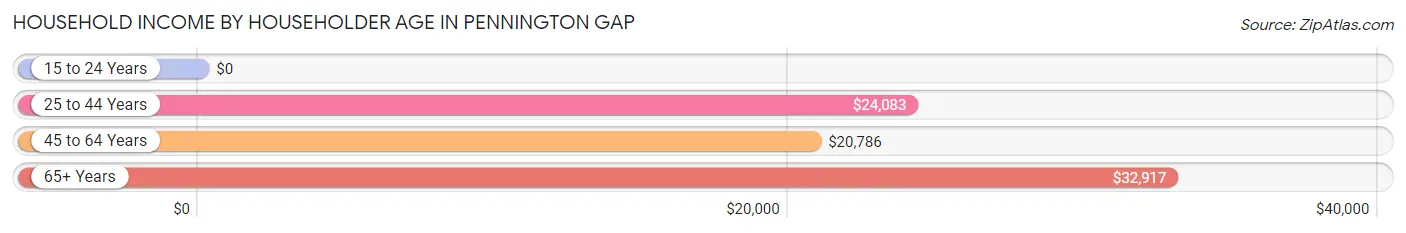
| Income Bracket | # Households | Median Income |
| 15 to 24 Years | 12 (1.6%) | $0 |
| 25 to 44 Years | 277 (36.9%) | $24,083 |
| 45 to 64 Years | 278 (37.1%) | $20,786 |
| 65+ Years | 183 (24.4%) | $32,917 |
| Total | 750 (100.0%) | $24,222 |
Poverty in Pennington Gap
Income Below Poverty by Sex and Age in Pennington Gap
With 65.8% poverty level for males and 50.1% for females among the residents of Pennington Gap, 6 to 11 year old males and 5 year old females are the most vulnerable to poverty, with 188 males (100.0%) and 20 females (100.0%) in their respective age groups living below the poverty level.
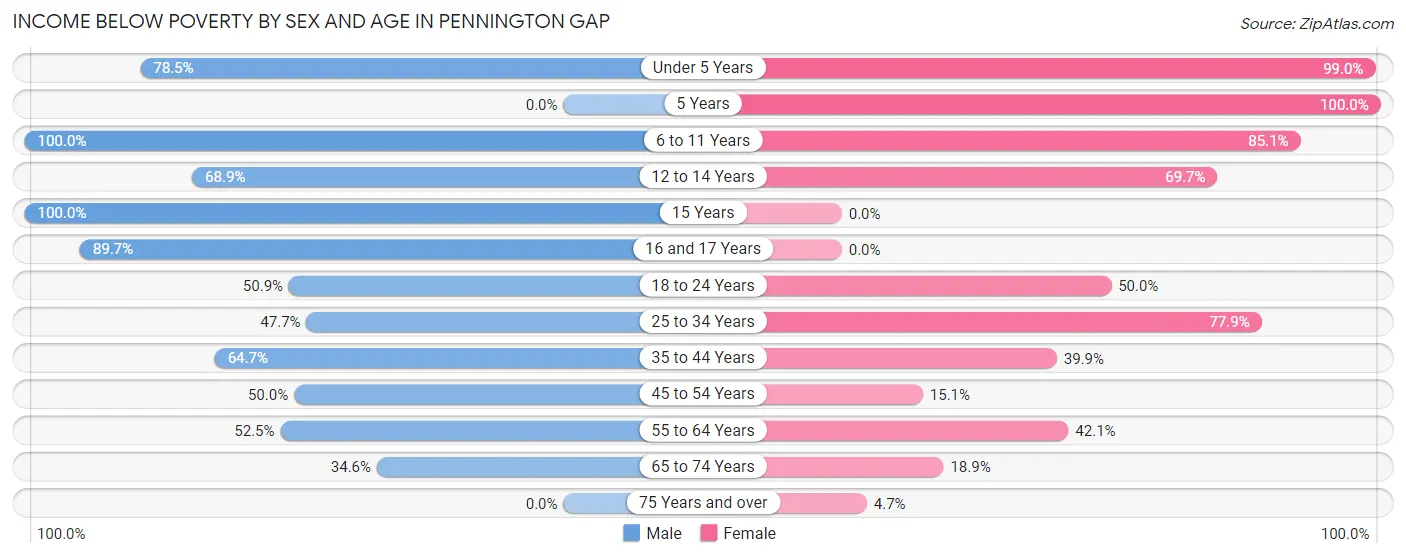
| Age Bracket | Male | Female |
| Under 5 Years | 95 (78.5%) | 99 (99.0%) |
| 5 Years | 0 (0.0%) | 20 (100.0%) |
| 6 to 11 Years | 188 (100.0%) | 103 (85.1%) |
| 12 to 14 Years | 62 (68.9%) | 23 (69.7%) |
| 15 Years | 6 (100.0%) | 0 (0.0%) |
| 16 and 17 Years | 35 (89.7%) | 0 (0.0%) |
| 18 to 24 Years | 54 (50.9%) | 57 (50.0%) |
| 25 to 34 Years | 31 (47.7%) | 127 (77.9%) |
| 35 to 44 Years | 22 (64.7%) | 89 (39.9%) |
| 45 to 54 Years | 55 (50.0%) | 14 (15.0%) |
| 55 to 64 Years | 52 (52.5%) | 45 (42.1%) |
| 65 to 74 Years | 9 (34.6%) | 20 (18.9%) |
| 75 Years and over | 0 (0.0%) | 4 (4.6%) |
| Total | 609 (65.8%) | 601 (50.1%) |
Income Above Poverty by Sex and Age in Pennington Gap
According to the poverty statistics in Pennington Gap, males aged 5 years and females aged 15 years are the age groups that are most secure financially, with 100.0% of males and 100.0% of females in these age groups living above the poverty line.
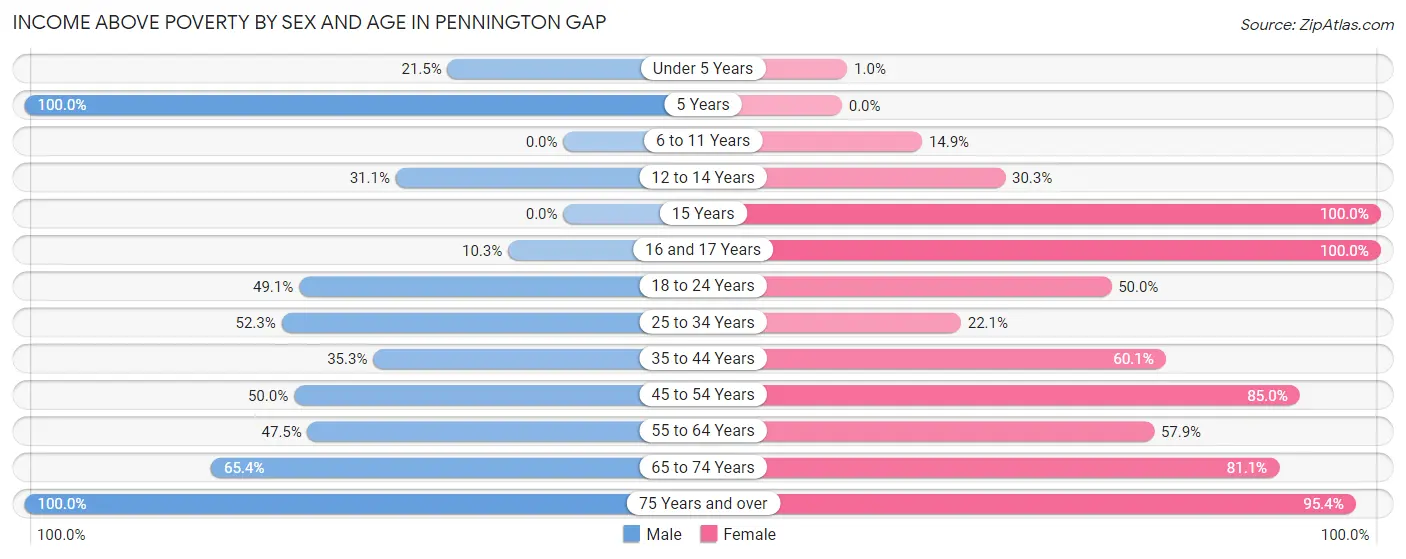
| Age Bracket | Male | Female |
| Under 5 Years | 26 (21.5%) | 1 (1.0%) |
| 5 Years | 8 (100.0%) | 0 (0.0%) |
| 6 to 11 Years | 0 (0.0%) | 18 (14.9%) |
| 12 to 14 Years | 28 (31.1%) | 10 (30.3%) |
| 15 Years | 0 (0.0%) | 5 (100.0%) |
| 16 and 17 Years | 4 (10.3%) | 29 (100.0%) |
| 18 to 24 Years | 52 (49.1%) | 57 (50.0%) |
| 25 to 34 Years | 34 (52.3%) | 36 (22.1%) |
| 35 to 44 Years | 12 (35.3%) | 134 (60.1%) |
| 45 to 54 Years | 55 (50.0%) | 79 (85.0%) |
| 55 to 64 Years | 47 (47.5%) | 62 (57.9%) |
| 65 to 74 Years | 17 (65.4%) | 86 (81.1%) |
| 75 Years and over | 33 (100.0%) | 82 (95.4%) |
| Total | 316 (34.2%) | 599 (49.9%) |
Income Below Poverty Among Married-Couple Families in Pennington Gap
The poverty statistics for married-couple families in Pennington Gap show that 26.4% or 37 of the total 140 families live below the poverty line. Families with 5 or more children have the highest poverty rate of 100.0%, comprising of 10 families. On the other hand, families with 1 or 2 children have the lowest poverty rate of 0.0%, which includes 0 families.
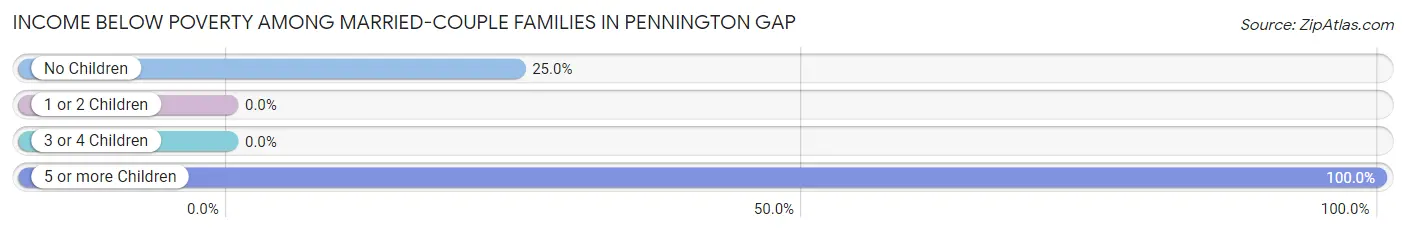
| Children | Above Poverty | Below Poverty |
| No Children | 81 (75.0%) | 27 (25.0%) |
| 1 or 2 Children | 22 (100.0%) | 0 (0.0%) |
| 3 or 4 Children | 0 (0.0%) | 0 (0.0%) |
| 5 or more Children | 0 (0.0%) | 10 (100.0%) |
| Total | 103 (73.6%) | 37 (26.4%) |
Income Below Poverty Among Single-Parent Households in Pennington Gap
According to the poverty data in Pennington Gap, 35.1% or 27 single-father households and 44.4% or 124 single-mother households are living below the poverty line. Among single-father households, those with 5 or more children have the highest poverty rate, with 18 households (100.0%) experiencing poverty. Likewise, among single-mother households, those with 3 or 4 children have the highest poverty rate, with 56 households (100.0%) falling below the poverty line.
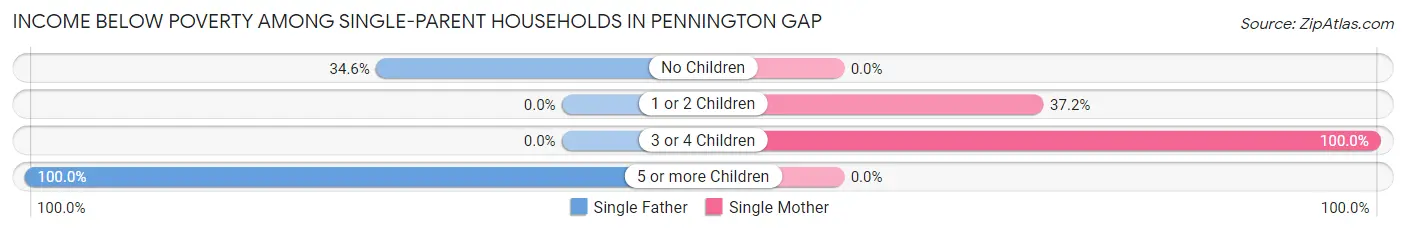
| Children | Single Father | Single Mother |
| No Children | 9 (34.6%) | 0 (0.0%) |
| 1 or 2 Children | 0 (0.0%) | 68 (37.2%) |
| 3 or 4 Children | 0 (0.0%) | 56 (100.0%) |
| 5 or more Children | 18 (100.0%) | 0 (0.0%) |
| Total | 27 (35.1%) | 124 (44.4%) |
Income Below Poverty Among Married-Couple vs Single-Parent Households in Pennington Gap
The poverty data for Pennington Gap shows that 37 of the married-couple family households (26.4%) and 151 of the single-parent households (42.4%) are living below the poverty level. Within the married-couple family households, those with 5 or more children have the highest poverty rate, with 10 households (100.0%) falling below the poverty line. Among the single-parent households, those with 3 or 4 children have the highest poverty rate, with 56 household (100.0%) living below poverty.
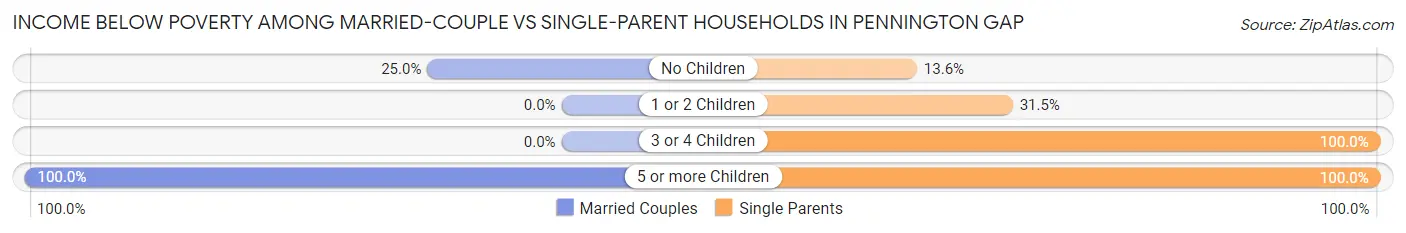
| Children | Married-Couple Families | Single-Parent Households |
| No Children | 27 (25.0%) | 9 (13.6%) |
| 1 or 2 Children | 0 (0.0%) | 68 (31.5%) |
| 3 or 4 Children | 0 (0.0%) | 56 (100.0%) |
| 5 or more Children | 10 (100.0%) | 18 (100.0%) |
| Total | 37 (26.4%) | 151 (42.4%) |
Race in Pennington Gap
The most populous races in Pennington Gap are White / Caucasian (2,049 | 90.9%), Two or more Races (136 | 6.0%), and Black / African American (67 | 3.0%).
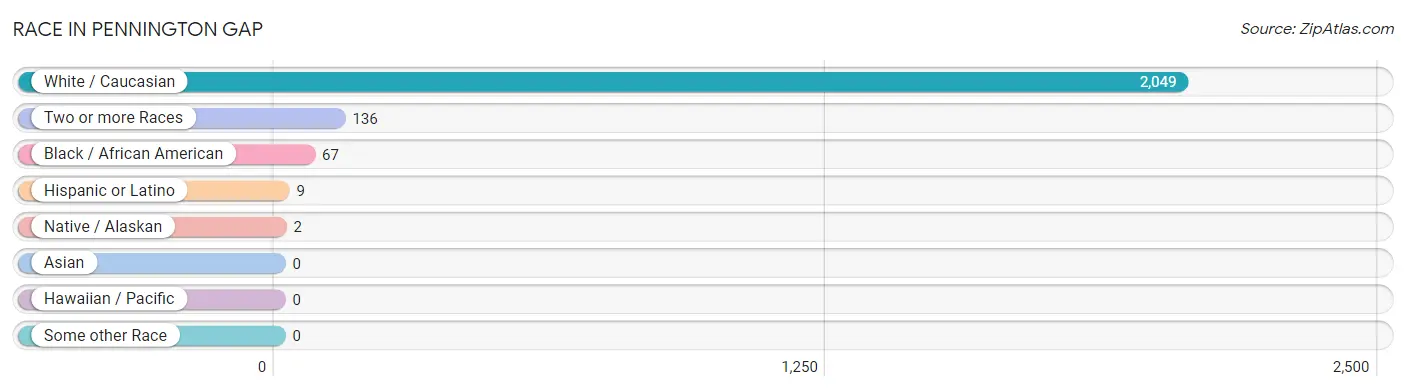
| Race | # Population | % Population |
| Asian | 0 | 0.0% |
| Black / African American | 67 | 3.0% |
| Hawaiian / Pacific | 0 | 0.0% |
| Hispanic or Latino | 9 | 0.4% |
| Native / Alaskan | 2 | 0.1% |
| White / Caucasian | 2,049 | 90.9% |
| Two or more Races | 136 | 6.0% |
| Some other Race | 0 | 0.0% |
| Total | 2,254 | 100.0% |
Ancestry in Pennington Gap
The most populous ancestries reported in Pennington Gap are Irish (662 | 29.4%), American (567 | 25.2%), German (149 | 6.6%), English (79 | 3.5%), and Italian (44 | 1.9%), together accounting for 66.6% of all Pennington Gap residents.
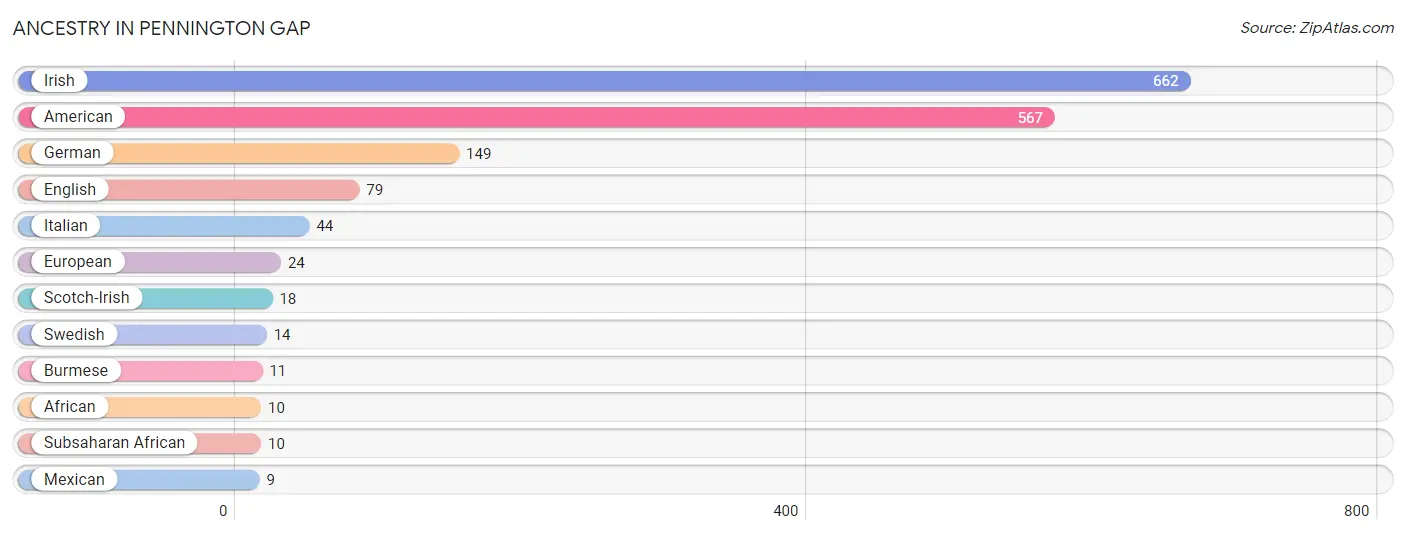
| Ancestry | # Population | % Population |
| African | 10 | 0.4% |
| American | 567 | 25.2% |
| Burmese | 11 | 0.5% |
| English | 79 | 3.5% |
| European | 24 | 1.1% |
| German | 149 | 6.6% |
| Irish | 662 | 29.4% |
| Italian | 44 | 1.9% |
| Mexican | 9 | 0.4% |
| Scotch-Irish | 18 | 0.8% |
| Subsaharan African | 10 | 0.4% |
| Swedish | 14 | 0.6% | View All 12 Rows |
Immigrants in Pennington Gap
The most numerous immigrant groups reported in Pennington Gap came from Europe (9 | 0.4%), Germany (9 | 0.4%), and Western Europe (9 | 0.4%), together accounting for 1.2% of all Pennington Gap residents.
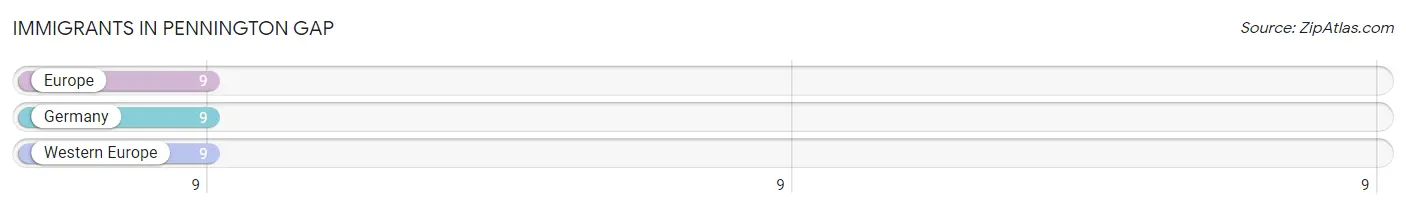
| Immigration Origin | # Population | % Population |
| Europe | 9 | 0.4% |
| Germany | 9 | 0.4% |
| Western Europe | 9 | 0.4% | View All 3 Rows |
Sex and Age in Pennington Gap
Sex and Age in Pennington Gap
The most populous age groups in Pennington Gap are 5 to 9 Years (198 | 20.5%) for men and 40 to 44 Years (151 | 11.7%) for women.
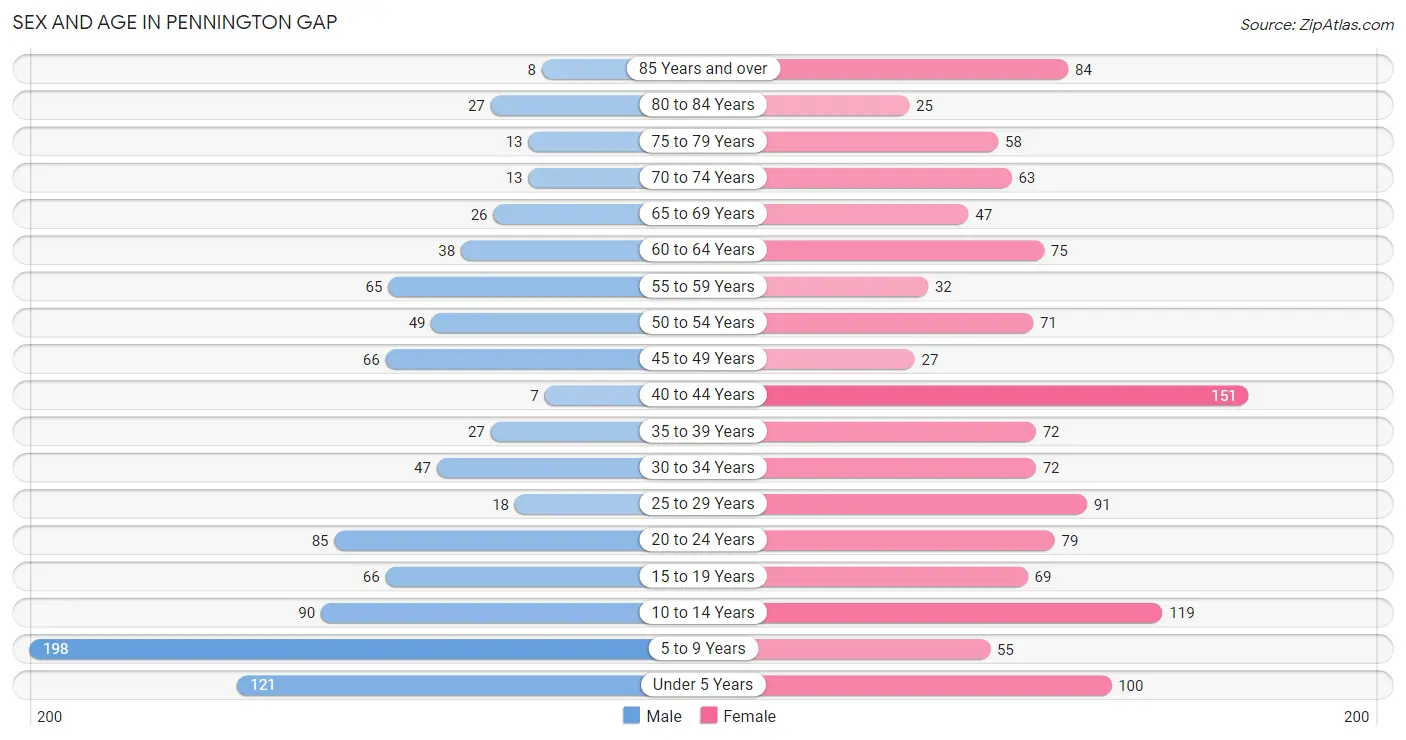
| Age Bracket | Male | Female |
| Under 5 Years | 121 (12.6%) | 100 (7.7%) |
| 5 to 9 Years | 198 (20.5%) | 55 (4.3%) |
| 10 to 14 Years | 90 (9.3%) | 119 (9.2%) |
| 15 to 19 Years | 66 (6.9%) | 69 (5.3%) |
| 20 to 24 Years | 85 (8.8%) | 79 (6.1%) |
| 25 to 29 Years | 18 (1.9%) | 91 (7.0%) |
| 30 to 34 Years | 47 (4.9%) | 72 (5.6%) |
| 35 to 39 Years | 27 (2.8%) | 72 (5.6%) |
| 40 to 44 Years | 7 (0.7%) | 151 (11.7%) |
| 45 to 49 Years | 66 (6.9%) | 27 (2.1%) |
| 50 to 54 Years | 49 (5.1%) | 71 (5.5%) |
| 55 to 59 Years | 65 (6.7%) | 32 (2.5%) |
| 60 to 64 Years | 38 (3.9%) | 75 (5.8%) |
| 65 to 69 Years | 26 (2.7%) | 47 (3.6%) |
| 70 to 74 Years | 13 (1.3%) | 63 (4.9%) |
| 75 to 79 Years | 13 (1.3%) | 58 (4.5%) |
| 80 to 84 Years | 27 (2.8%) | 25 (1.9%) |
| 85 Years and over | 8 (0.8%) | 84 (6.5%) |
| Total | 964 (100.0%) | 1,290 (100.0%) |
Families and Households in Pennington Gap
Median Family Size in Pennington Gap
The median family size in Pennington Gap is 3.63 persons per family, with single male/father families (77 | 15.5%) accounting for the largest median family size of 5.39 persons per family. On the other hand, single female/mother families (279 | 56.2%) represent the smallest median family size with 2.97 persons per family.
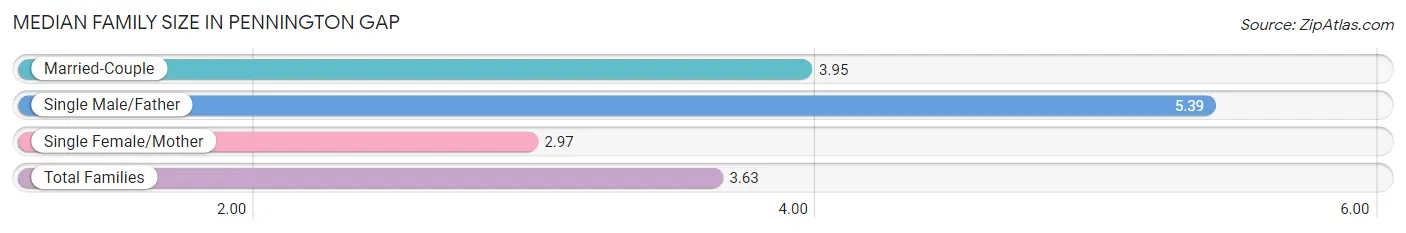
| Family Type | # Families | Family Size |
| Married-Couple | 140 (28.2%) | 3.95 |
| Single Male/Father | 77 (15.5%) | 5.39 |
| Single Female/Mother | 279 (56.2%) | 2.97 |
| Total Families | 496 (100.0%) | 3.63 |
Median Household Size in Pennington Gap
The median household size in Pennington Gap is 2.84 persons per household, with single male/father households (77 | 10.3%) accounting for the largest median household size of 5.82 persons per household. non-family households (254 | 33.9%) represent the smallest median household size with 1.08 persons per household.
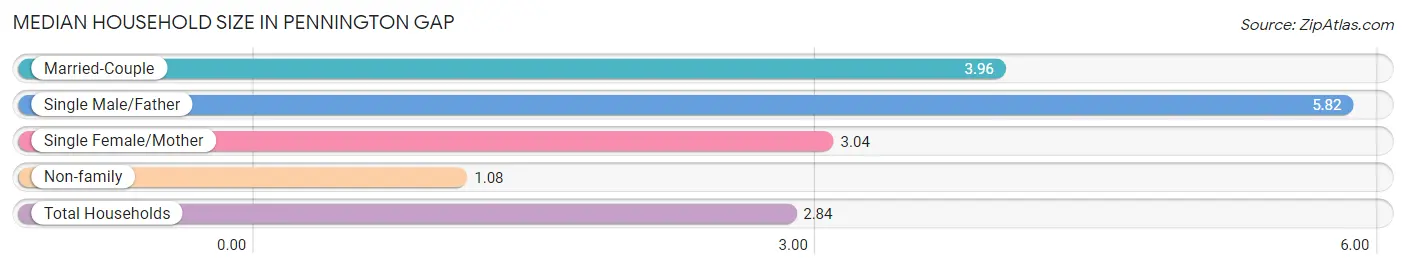
| Household Type | # Households | Household Size |
| Married-Couple | 140 (18.7%) | 3.96 |
| Single Male/Father | 77 (10.3%) | 5.82 |
| Single Female/Mother | 279 (37.2%) | 3.04 |
| Non-family | 254 (33.9%) | 1.08 |
| Total Households | 750 (100.0%) | 2.84 |
Household Size by Marriage Status in Pennington Gap
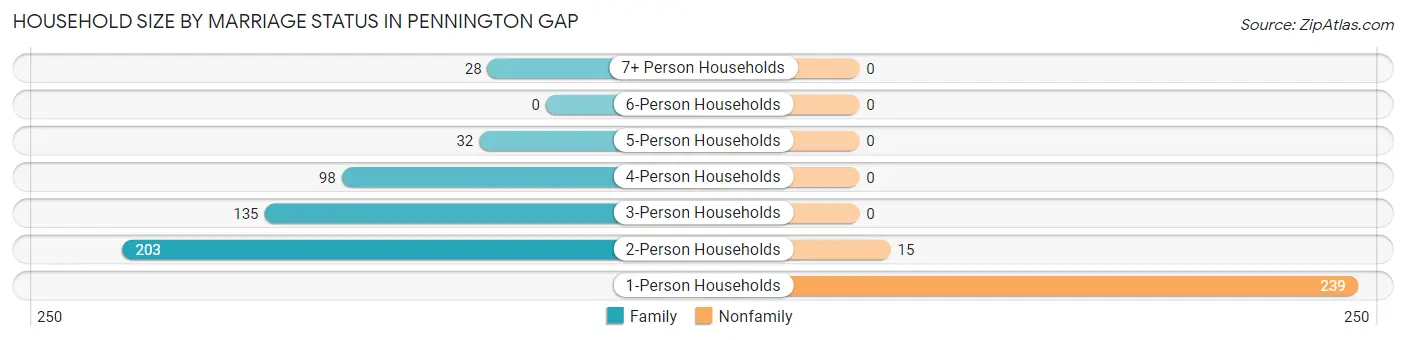
Out of a total of 750 households in Pennington Gap, 496 (66.1%) are family households, while 254 (33.9%) are nonfamily households. The most numerous type of family households are 2-person households, comprising 203, and the most common type of nonfamily households are 1-person households, comprising 239.
| Household Size | Family Households | Nonfamily Households |
| 1-Person Households | - | 239 (31.9%) |
| 2-Person Households | 203 (27.1%) | 15 (2.0%) |
| 3-Person Households | 135 (18.0%) | 0 (0.0%) |
| 4-Person Households | 98 (13.1%) | 0 (0.0%) |
| 5-Person Households | 32 (4.3%) | 0 (0.0%) |
| 6-Person Households | 0 (0.0%) | 0 (0.0%) |
| 7+ Person Households | 28 (3.7%) | 0 (0.0%) |
| Total | 496 (66.1%) | 254 (33.9%) |
Female Fertility in Pennington Gap
Fertility by Age in Pennington Gap
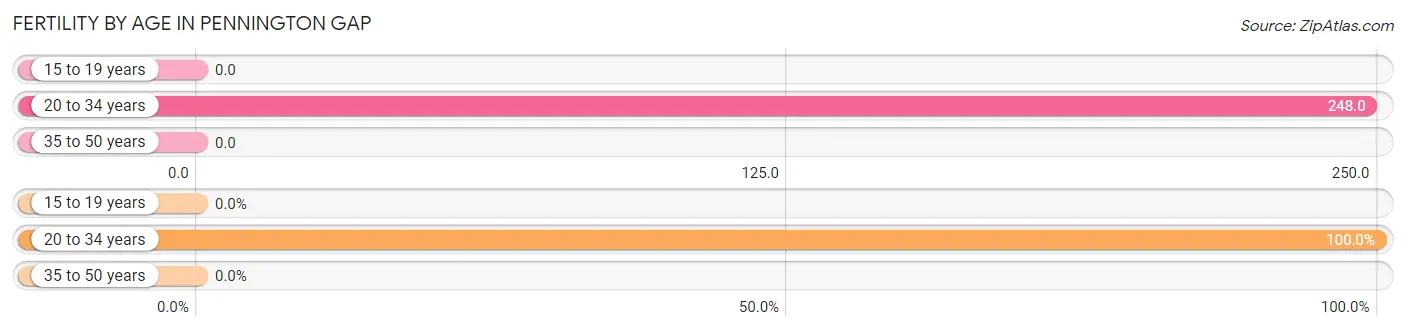
Average fertility rate in Pennington Gap is 101.0 births per 1,000 women. Women in the age bracket of 20 to 34 years have the highest fertility rate with 248.0 births per 1,000 women. Women in the age bracket of 20 to 34 years acount for 100.0% of all women with births.
| Age Bracket | Women with Births | Births / 1,000 Women |
| 15 to 19 years | 0 (0.0%) | 0.0 |
| 20 to 34 years | 60 (100.0%) | 248.0 |
| 35 to 50 years | 0 (0.0%) | 0.0 |
| Total | 60 (100.0%) | 101.0 |
Fertility by Age by Marriage Status in Pennington Gap
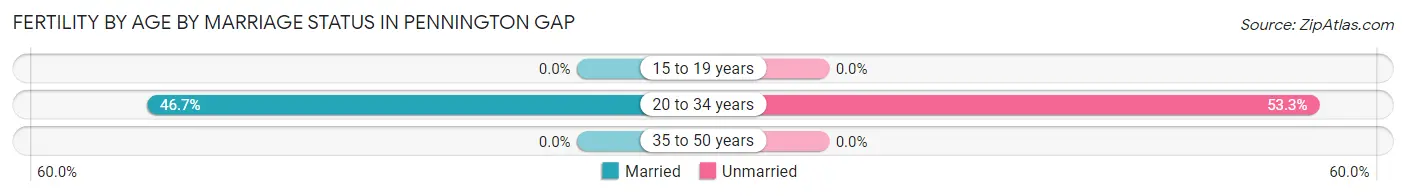
46.7% of women with births (60) in Pennington Gap are married. The highest percentage of unmarried women with births falls into 20 to 34 years age bracket with 53.3% of them unmarried at the time of birth, while the lowest percentage of unmarried women with births belong to 20 to 34 years age bracket with 53.3% of them unmarried.
| Age Bracket | Married | Unmarried |
| 15 to 19 years | 0 (0.0%) | 0 (0.0%) |
| 20 to 34 years | 28 (46.7%) | 32 (53.3%) |
| 35 to 50 years | 0 (0.0%) | 0 (0.0%) |
| Total | 28 (46.7%) | 32 (53.3%) |
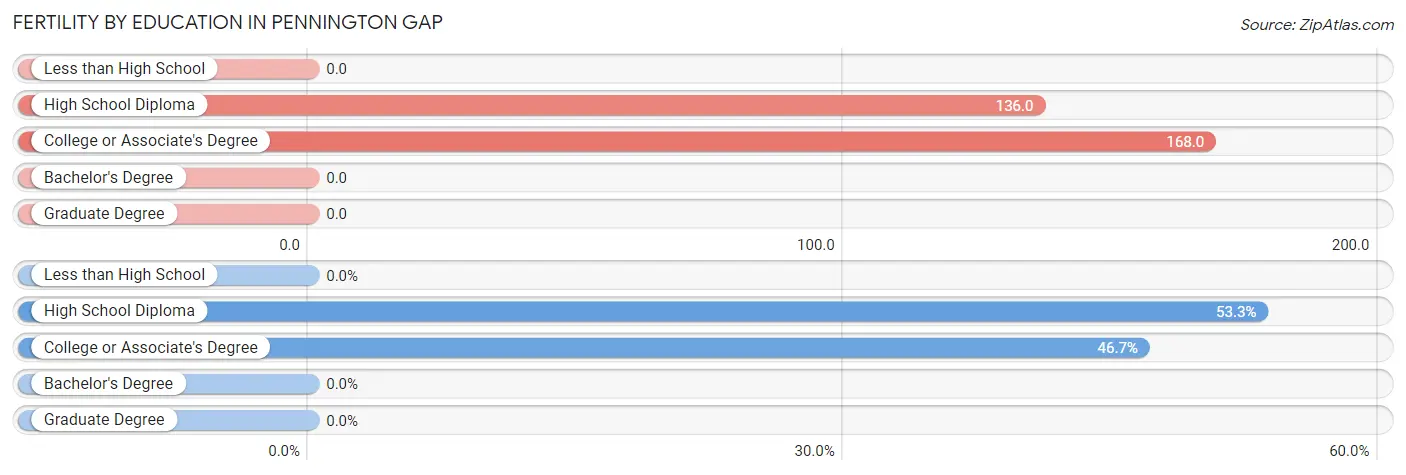
Fertility by Education in Pennington Gap
| Educational Attainment | Women with Births | Births / 1,000 Women |
| Less than High School | 0 (0.0%) | 0.0 |
| High School Diploma | 32 (53.3%) | 136.0 |
| College or Associate's Degree | 28 (46.7%) | 168.0 |
| Bachelor's Degree | 0 (0.0%) | 0.0 |
| Graduate Degree | 0 (0.0%) | 0.0 |
| Total | 60 (100.0%) | 101.0 |
Fertility by Education by Marriage Status in Pennington Gap
53.3% of women with births in Pennington Gap are unmarried. Women with the educational attainment of college or associate's degree are most likely to be married with 100.0% of them married at childbirth, while women with the educational attainment of high school diploma are least likely to be married with 100.0% of them unmarried at childbirth.
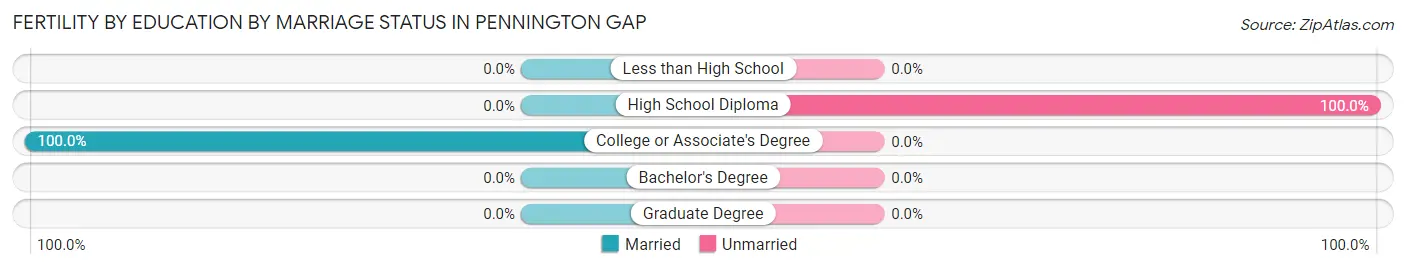
| Educational Attainment | Married | Unmarried |
| Less than High School | 0 (0.0%) | 0 (0.0%) |
| High School Diploma | 0 (0.0%) | 32 (100.0%) |
| College or Associate's Degree | 28 (100.0%) | 0 (0.0%) |
| Bachelor's Degree | 0 (0.0%) | 0 (0.0%) |
| Graduate Degree | 0 (0.0%) | 0 (0.0%) |
| Total | 28 (46.7%) | 32 (53.3%) |
Employment Characteristics in Pennington Gap
Employment by Class of Employer in Pennington Gap
Among the 473 employed individuals in Pennington Gap, private company employees (398 | 84.1%), self-employed (incorporated) (19 | 4.0%), and self-employed (not incorporated) (16 | 3.4%) make up the most common classes of employment.
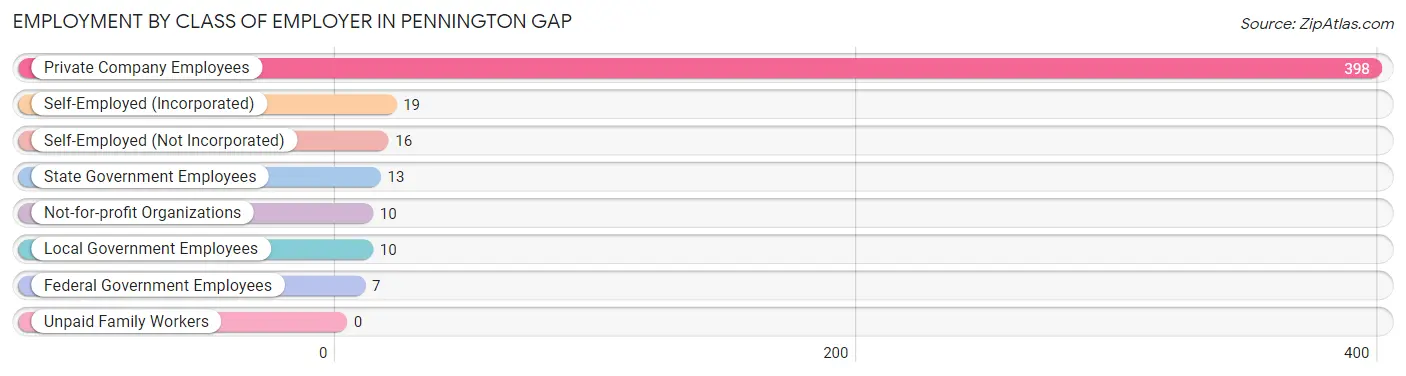
| Employer Class | # Employees | % Employees |
| Private Company Employees | 398 | 84.1% |
| Self-Employed (Incorporated) | 19 | 4.0% |
| Self-Employed (Not Incorporated) | 16 | 3.4% |
| Not-for-profit Organizations | 10 | 2.1% |
| Local Government Employees | 10 | 2.1% |
| State Government Employees | 13 | 2.8% |
| Federal Government Employees | 7 | 1.5% |
| Unpaid Family Workers | 0 | 0.0% |
| Total | 473 | 100.0% |
Employment Status by Age in Pennington Gap
According to the labor force statistics for Pennington Gap, out of the total population over 16 years of age (1,560), 40.4% or 630 individuals are in the labor force, with 21.2% or 134 of them unemployed. The age group with the highest labor force participation rate is 20 to 24 years, with 94.5% or 155 individuals in the labor force. Within the labor force, the 20 to 24 years age range has the highest percentage of unemployed individuals, with 76.8% or 119 of them being unemployed.
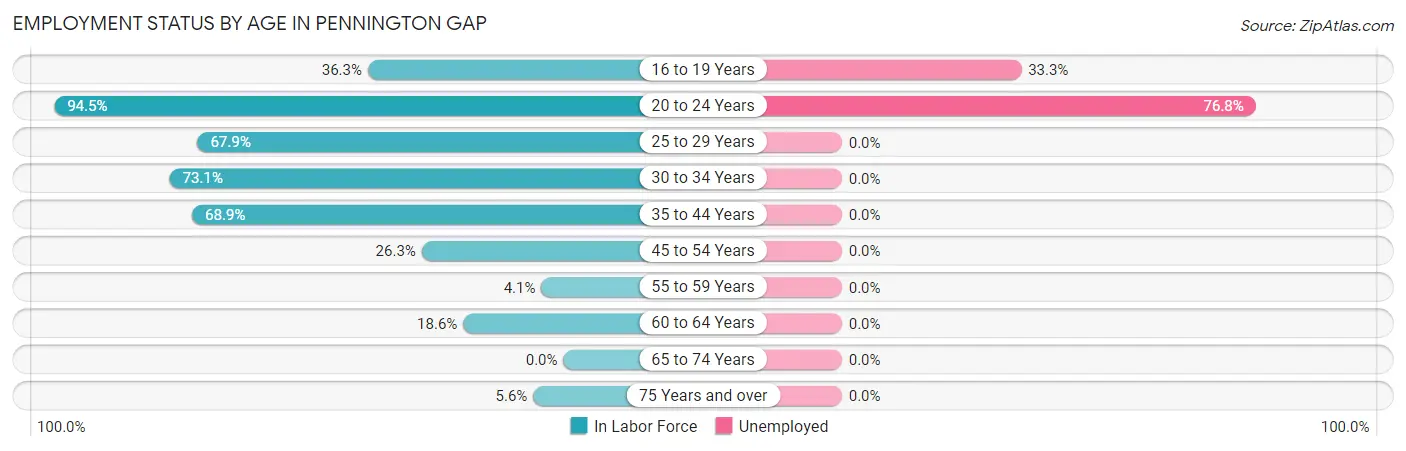
| Age Bracket | In Labor Force | Unemployed |
| 16 to 19 Years | 45 (36.3%) | 15 (33.3%) |
| 20 to 24 Years | 155 (94.5%) | 119 (76.8%) |
| 25 to 29 Years | 74 (67.9%) | 0 (0.0%) |
| 30 to 34 Years | 87 (73.1%) | 0 (0.0%) |
| 35 to 44 Years | 177 (68.9%) | 0 (0.0%) |
| 45 to 54 Years | 56 (26.3%) | 0 (0.0%) |
| 55 to 59 Years | 4 (4.1%) | 0 (0.0%) |
| 60 to 64 Years | 21 (18.6%) | 0 (0.0%) |
| 65 to 74 Years | 0 (0.0%) | 0 (0.0%) |
| 75 Years and over | 12 (5.6%) | 0 (0.0%) |
| Total | 630 (40.4%) | 134 (21.2%) |
Employment Status by Educational Attainment in Pennington Gap
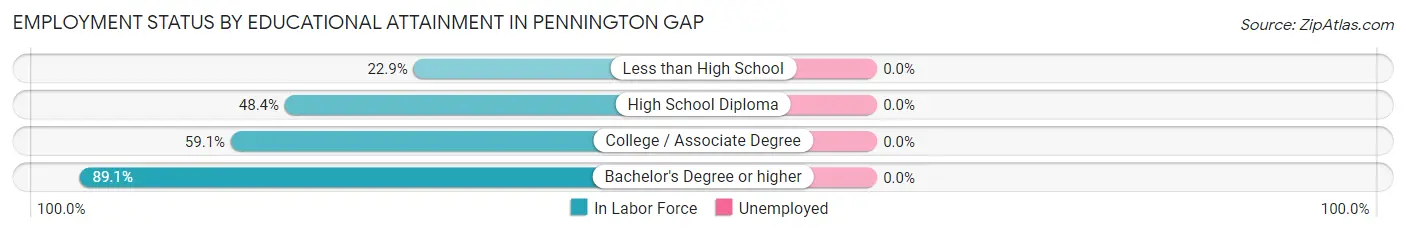
| Educational Attainment | In Labor Force | Unemployed |
| Less than High School | 64 (22.9%) | 0 (0.0%) |
| High School Diploma | 136 (48.4%) | 0 (0.0%) |
| College / Associate Degree | 178 (59.1%) | 0 (0.0%) |
| Bachelor's Degree or higher | 41 (89.1%) | 0 (0.0%) |
| Total | 419 (46.1%) | 0 (0.0%) |
Employment Occupations by Sex in Pennington Gap
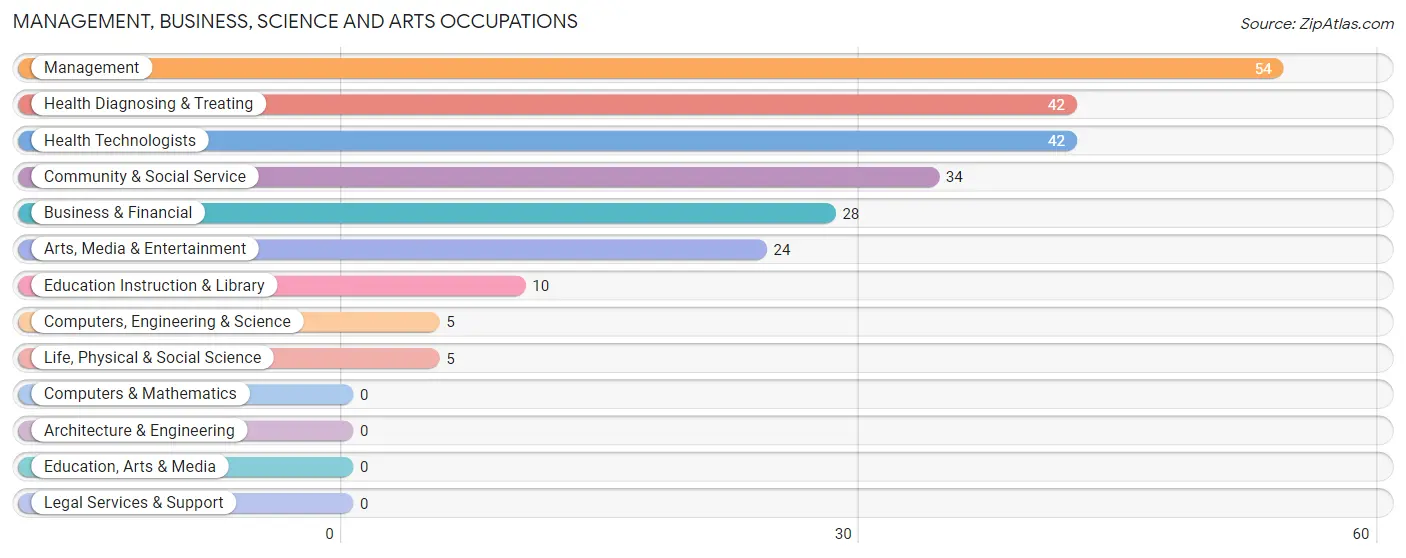
Management, Business, Science and Arts Occupations
The most common Management, Business, Science and Arts occupations in Pennington Gap are Management (54 | 10.9%), Health Diagnosing & Treating (42 | 8.5%), Health Technologists (42 | 8.5%), Community & Social Service (34 | 6.8%), and Business & Financial (28 | 5.6%).
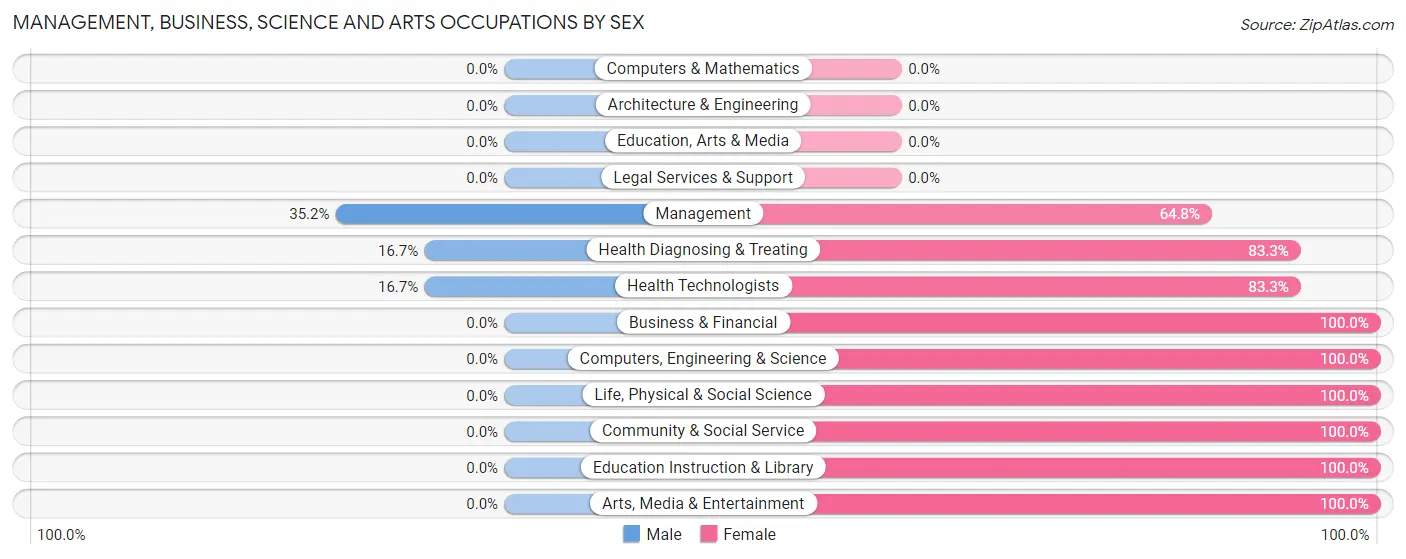
Management, Business, Science and Arts Occupations by Sex
Within the Management, Business, Science and Arts occupations in Pennington Gap, the most male-oriented occupations are Management (35.2%), Health Diagnosing & Treating (16.7%), and Health Technologists (16.7%), while the most female-oriented occupations are Business & Financial (100.0%), Computers, Engineering & Science (100.0%), and Life, Physical & Social Science (100.0%).
| Occupation | Male | Female |
| Management | 19 (35.2%) | 35 (64.8%) |
| Business & Financial | 0 (0.0%) | 28 (100.0%) |
| Computers, Engineering & Science | 0 (0.0%) | 5 (100.0%) |
| Computers & Mathematics | 0 (0.0%) | 0 (0.0%) |
| Architecture & Engineering | 0 (0.0%) | 0 (0.0%) |
| Life, Physical & Social Science | 0 (0.0%) | 5 (100.0%) |
| Community & Social Service | 0 (0.0%) | 34 (100.0%) |
| Education, Arts & Media | 0 (0.0%) | 0 (0.0%) |
| Legal Services & Support | 0 (0.0%) | 0 (0.0%) |
| Education Instruction & Library | 0 (0.0%) | 10 (100.0%) |
| Arts, Media & Entertainment | 0 (0.0%) | 24 (100.0%) |
| Health Diagnosing & Treating | 7 (16.7%) | 35 (83.3%) |
| Health Technologists | 7 (16.7%) | 35 (83.3%) |
| Total (Category) | 26 (16.0%) | 137 (84.1%) |
| Total (Overall) | 183 (36.8%) | 314 (63.2%) |
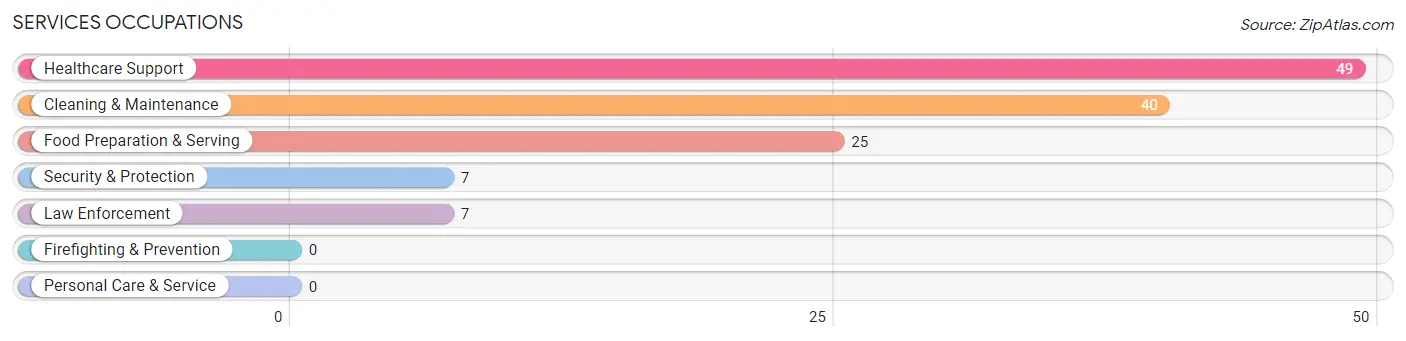
Services Occupations
The most common Services occupations in Pennington Gap are Healthcare Support (49 | 9.9%), Cleaning & Maintenance (40 | 8.1%), Food Preparation & Serving (25 | 5.0%), Security & Protection (7 | 1.4%), and Law Enforcement (7 | 1.4%).
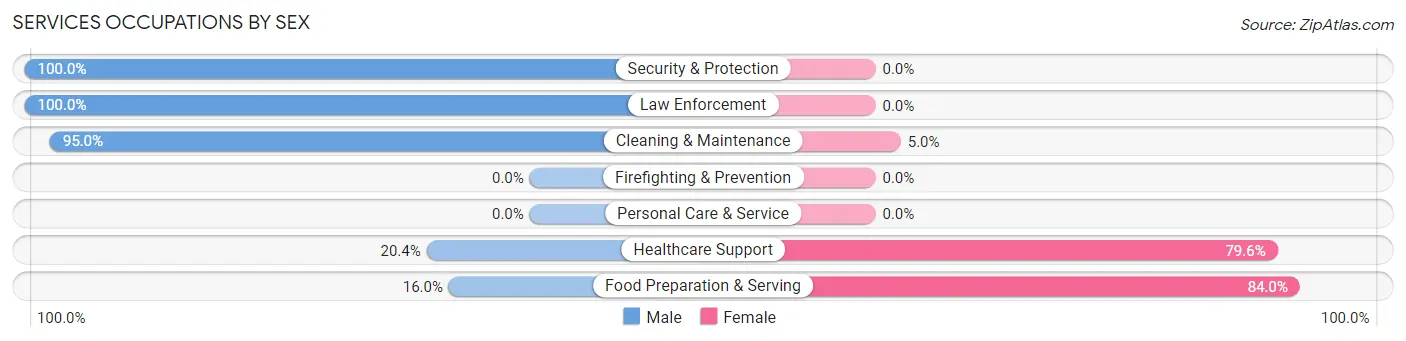
Services Occupations by Sex
Within the Services occupations in Pennington Gap, the most male-oriented occupations are Security & Protection (100.0%), Law Enforcement (100.0%), and Cleaning & Maintenance (95.0%), while the most female-oriented occupations are Food Preparation & Serving (84.0%), Healthcare Support (79.6%), and Cleaning & Maintenance (5.0%).
| Occupation | Male | Female |
| Healthcare Support | 10 (20.4%) | 39 (79.6%) |
| Security & Protection | 7 (100.0%) | 0 (0.0%) |
| Firefighting & Prevention | 0 (0.0%) | 0 (0.0%) |
| Law Enforcement | 7 (100.0%) | 0 (0.0%) |
| Food Preparation & Serving | 4 (16.0%) | 21 (84.0%) |
| Cleaning & Maintenance | 38 (95.0%) | 2 (5.0%) |
| Personal Care & Service | 0 (0.0%) | 0 (0.0%) |
| Total (Category) | 59 (48.8%) | 62 (51.2%) |
| Total (Overall) | 183 (36.8%) | 314 (63.2%) |
Sales and Office Occupations
The most common Sales and Office occupations in Pennington Gap are Sales & Related (60 | 12.1%), and Office & Administration (49 | 9.9%).
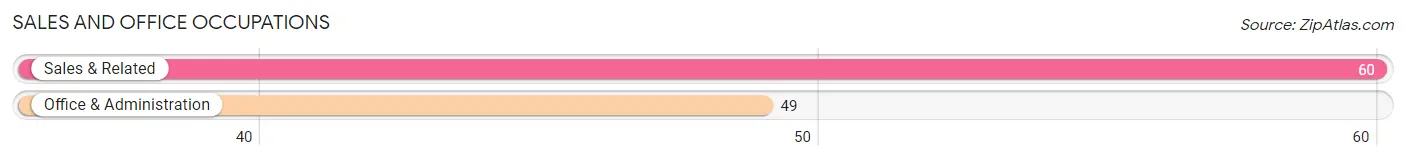
Sales and Office Occupations by Sex
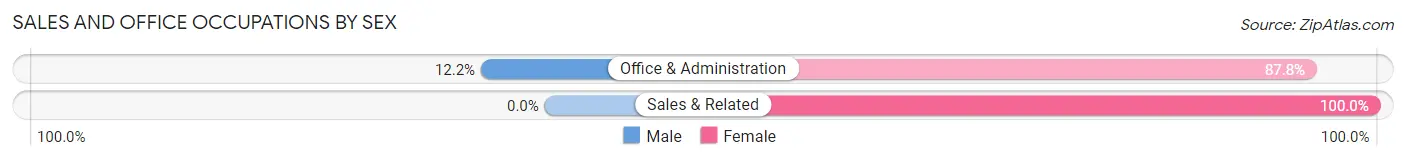
| Occupation | Male | Female |
| Sales & Related | 0 (0.0%) | 60 (100.0%) |
| Office & Administration | 6 (12.2%) | 43 (87.8%) |
| Total (Category) | 6 (5.5%) | 103 (94.5%) |
| Total (Overall) | 183 (36.8%) | 314 (63.2%) |
Natural Resources, Construction and Maintenance Occupations
The most common Natural Resources, Construction and Maintenance occupations in Pennington Gap are Construction & Extraction (28 | 5.6%), and Installation, Maintenance & Repair (19 | 3.8%).
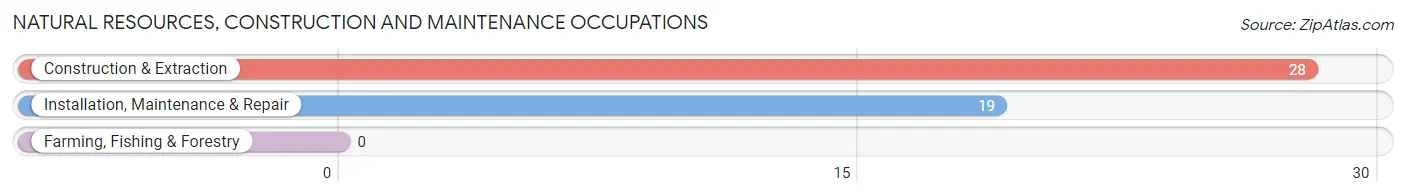
Natural Resources, Construction and Maintenance Occupations by Sex
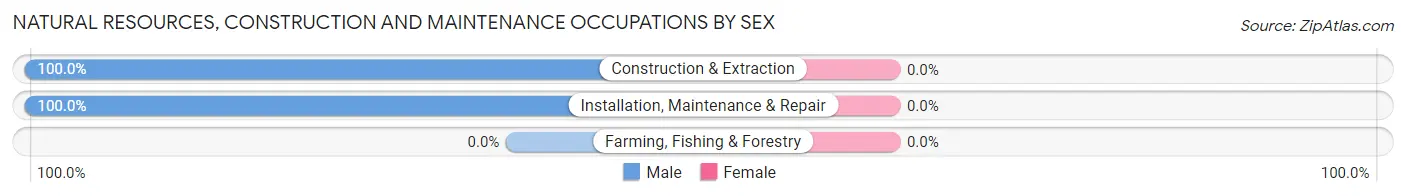
| Occupation | Male | Female |
| Farming, Fishing & Forestry | 0 (0.0%) | 0 (0.0%) |
| Construction & Extraction | 28 (100.0%) | 0 (0.0%) |
| Installation, Maintenance & Repair | 19 (100.0%) | 0 (0.0%) |
| Total (Category) | 47 (100.0%) | 0 (0.0%) |
| Total (Overall) | 183 (36.8%) | 314 (63.2%) |
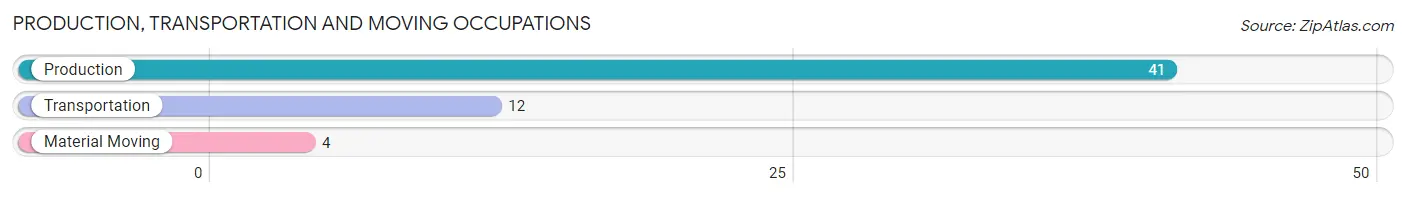
Production, Transportation and Moving Occupations
The most common Production, Transportation and Moving occupations in Pennington Gap are Production (41 | 8.3%), Transportation (12 | 2.4%), and Material Moving (4 | 0.8%).
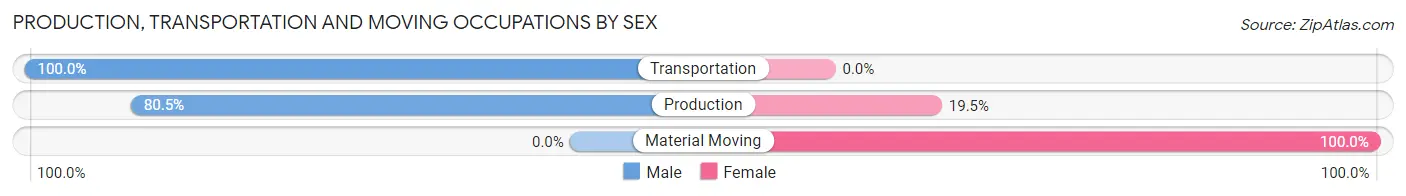
Production, Transportation and Moving Occupations by Sex
| Occupation | Male | Female |
| Production | 33 (80.5%) | 8 (19.5%) |
| Transportation | 12 (100.0%) | 0 (0.0%) |
| Material Moving | 0 (0.0%) | 4 (100.0%) |
| Total (Category) | 45 (78.9%) | 12 (21.0%) |
| Total (Overall) | 183 (36.8%) | 314 (63.2%) |
Employment Industries by Sex in Pennington Gap
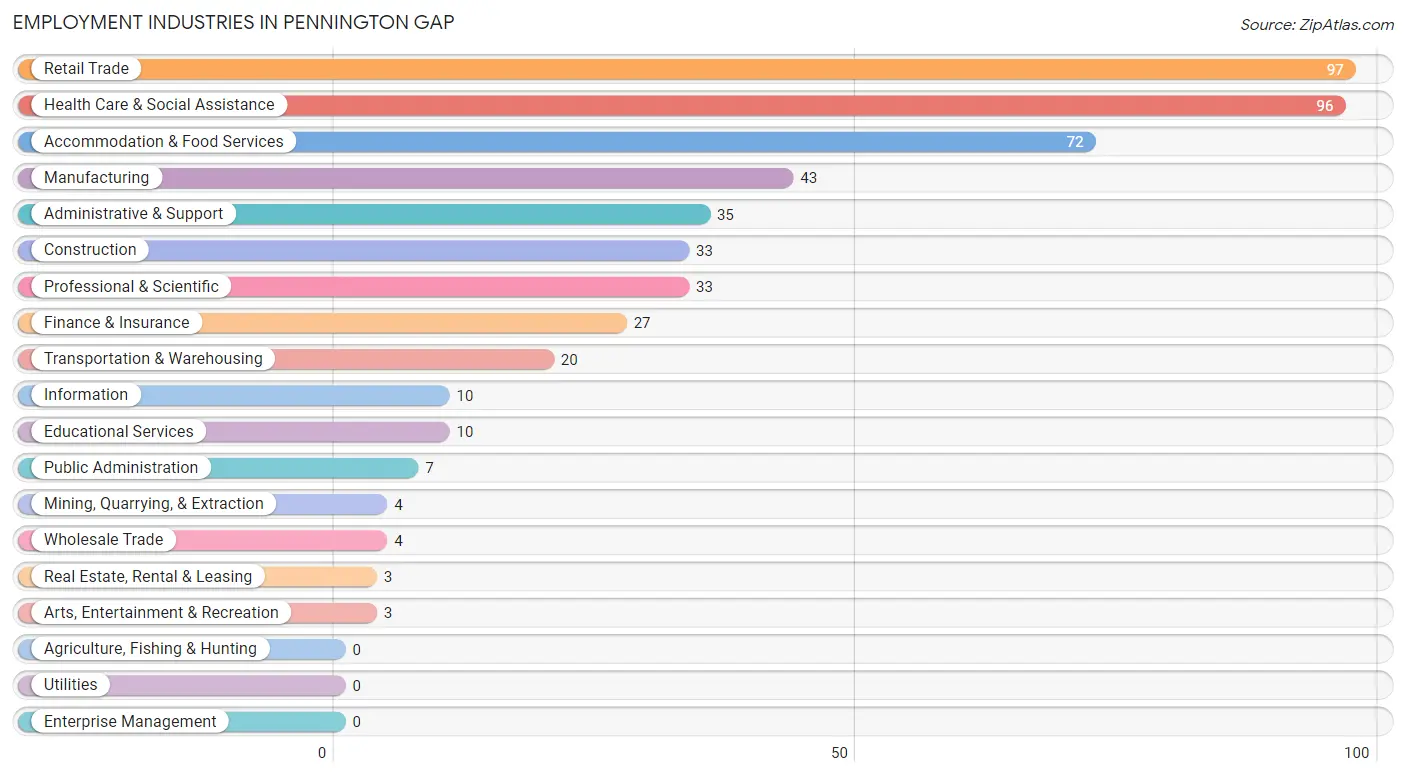
Employment Industries in Pennington Gap
The major employment industries in Pennington Gap include Retail Trade (97 | 19.5%), Health Care & Social Assistance (96 | 19.3%), Accommodation & Food Services (72 | 14.5%), Manufacturing (43 | 8.6%), and Administrative & Support (35 | 7.0%).
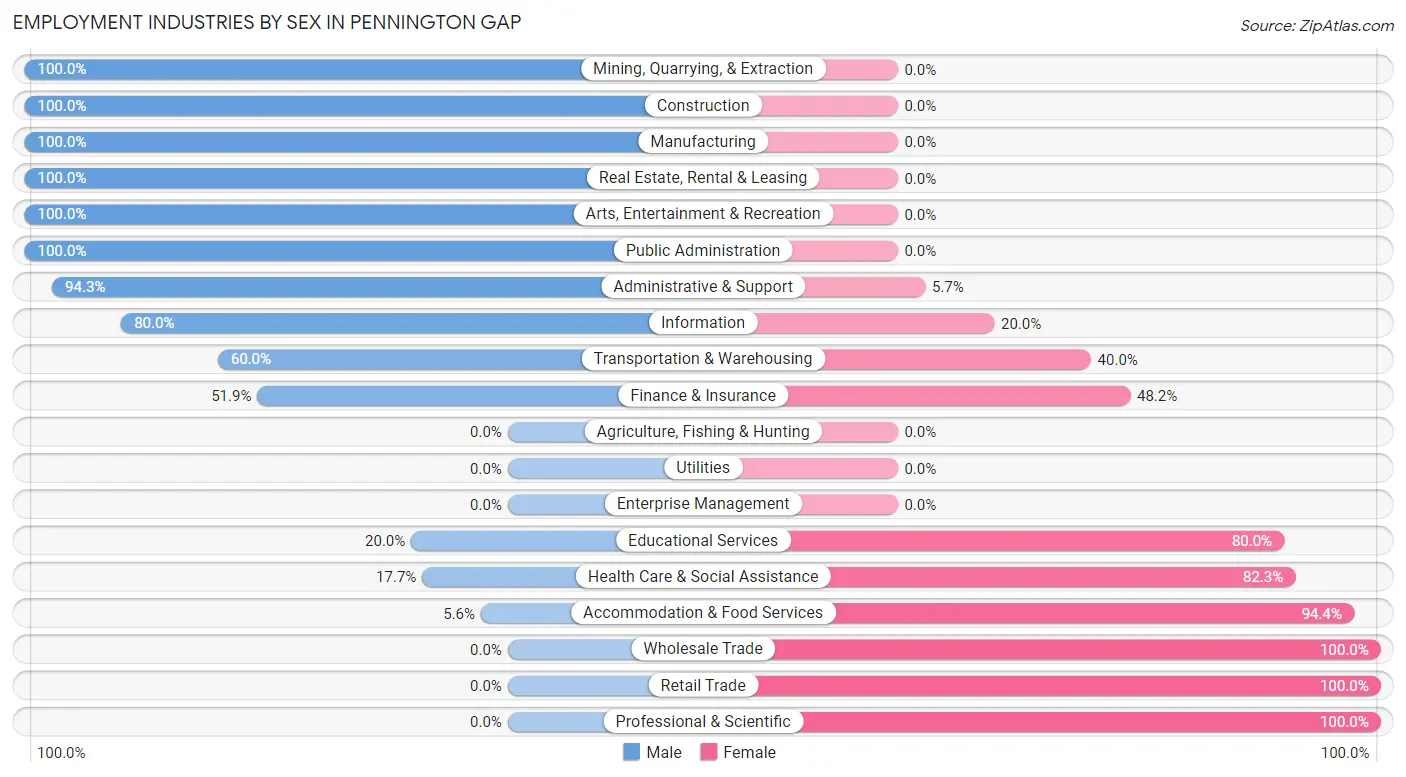
Employment Industries by Sex in Pennington Gap
The Pennington Gap industries that see more men than women are Mining, Quarrying, & Extraction (100.0%), Construction (100.0%), and Manufacturing (100.0%), whereas the industries that tend to have a higher number of women are Wholesale Trade (100.0%), Retail Trade (100.0%), and Professional & Scientific (100.0%).
| Industry | Male | Female |
| Agriculture, Fishing & Hunting | 0 (0.0%) | 0 (0.0%) |
| Mining, Quarrying, & Extraction | 4 (100.0%) | 0 (0.0%) |
| Construction | 33 (100.0%) | 0 (0.0%) |
| Manufacturing | 43 (100.0%) | 0 (0.0%) |
| Wholesale Trade | 0 (0.0%) | 4 (100.0%) |
| Retail Trade | 0 (0.0%) | 97 (100.0%) |
| Transportation & Warehousing | 12 (60.0%) | 8 (40.0%) |
| Utilities | 0 (0.0%) | 0 (0.0%) |
| Information | 8 (80.0%) | 2 (20.0%) |
| Finance & Insurance | 14 (51.8%) | 13 (48.1%) |
| Real Estate, Rental & Leasing | 3 (100.0%) | 0 (0.0%) |
| Professional & Scientific | 0 (0.0%) | 33 (100.0%) |
| Enterprise Management | 0 (0.0%) | 0 (0.0%) |
| Administrative & Support | 33 (94.3%) | 2 (5.7%) |
| Educational Services | 2 (20.0%) | 8 (80.0%) |
| Health Care & Social Assistance | 17 (17.7%) | 79 (82.3%) |
| Arts, Entertainment & Recreation | 3 (100.0%) | 0 (0.0%) |
| Accommodation & Food Services | 4 (5.6%) | 68 (94.4%) |
| Public Administration | 7 (100.0%) | 0 (0.0%) |
| Total | 183 (36.8%) | 314 (63.2%) |
Education in Pennington Gap
School Enrollment in Pennington Gap
The most common levels of schooling among the 493 students in Pennington Gap are elementary school (212 | 43.0%), middle school (131 | 26.6%), and high school (113 | 22.9%).
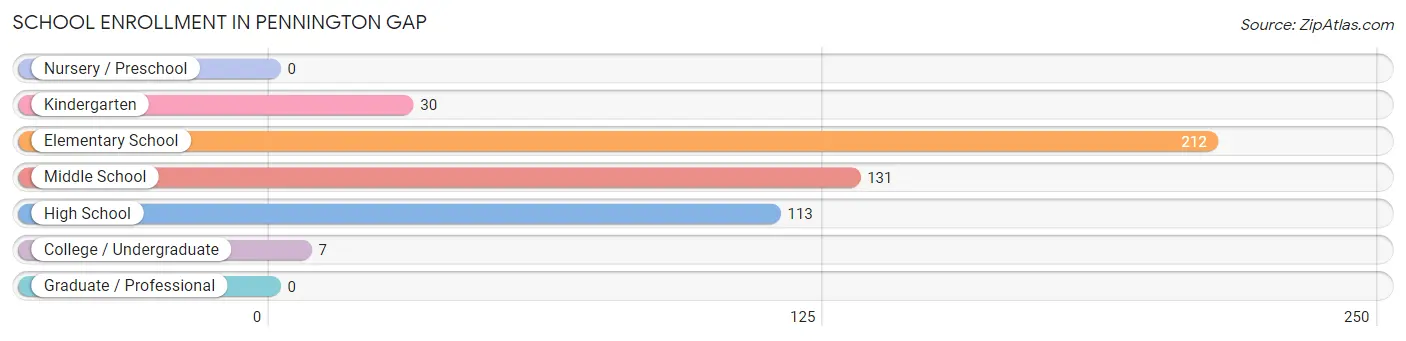
| School Level | # Students | % Students |
| Nursery / Preschool | 0 | 0.0% |
| Kindergarten | 30 | 6.1% |
| Elementary School | 212 | 43.0% |
| Middle School | 131 | 26.6% |
| High School | 113 | 22.9% |
| College / Undergraduate | 7 | 1.4% |
| Graduate / Professional | 0 | 0.0% |
| Total | 493 | 100.0% |
School Enrollment by Age by Funding Source in Pennington Gap
Out of a total of 493 students who are enrolled in schools in Pennington Gap, 12 (2.4%) attend a private institution, while the remaining 481 (97.6%) are enrolled in public schools. The age group of 18 to 19 year olds has the highest likelihood of being enrolled in private schools, with 12 (100.0% in the age bracket) enrolled. Conversely, the age group of 5 to 9 year old has the lowest likelihood of being enrolled in a private school, with 219 (100.0% in the age bracket) attending a public institution.
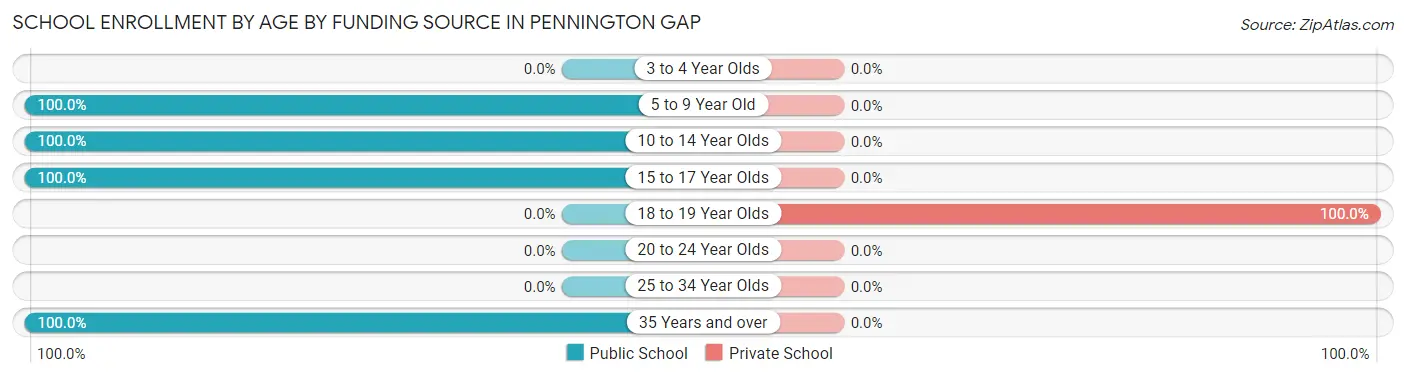
| Age Bracket | Public School | Private School |
| 3 to 4 Year Olds | 0 (0.0%) | 0 (0.0%) |
| 5 to 9 Year Old | 219 (100.0%) | 0 (0.0%) |
| 10 to 14 Year Olds | 175 (100.0%) | 0 (0.0%) |
| 15 to 17 Year Olds | 79 (100.0%) | 0 (0.0%) |
| 18 to 19 Year Olds | 0 (0.0%) | 12 (100.0%) |
| 20 to 24 Year Olds | 0 (0.0%) | 0 (0.0%) |
| 25 to 34 Year Olds | 0 (0.0%) | 0 (0.0%) |
| 35 Years and over | 8 (100.0%) | 0 (0.0%) |
| Total | 481 (97.6%) | 12 (2.4%) |
Educational Attainment by Field of Study in Pennington Gap
Liberal arts & history (28 | 27.7%), business (24 | 23.8%), science & technology (15 | 14.8%), multidisciplinary studies (8 | 7.9%), and education (8 | 7.9%) are the most common fields of study among 101 individuals in Pennington Gap who have obtained a bachelor's degree or higher.
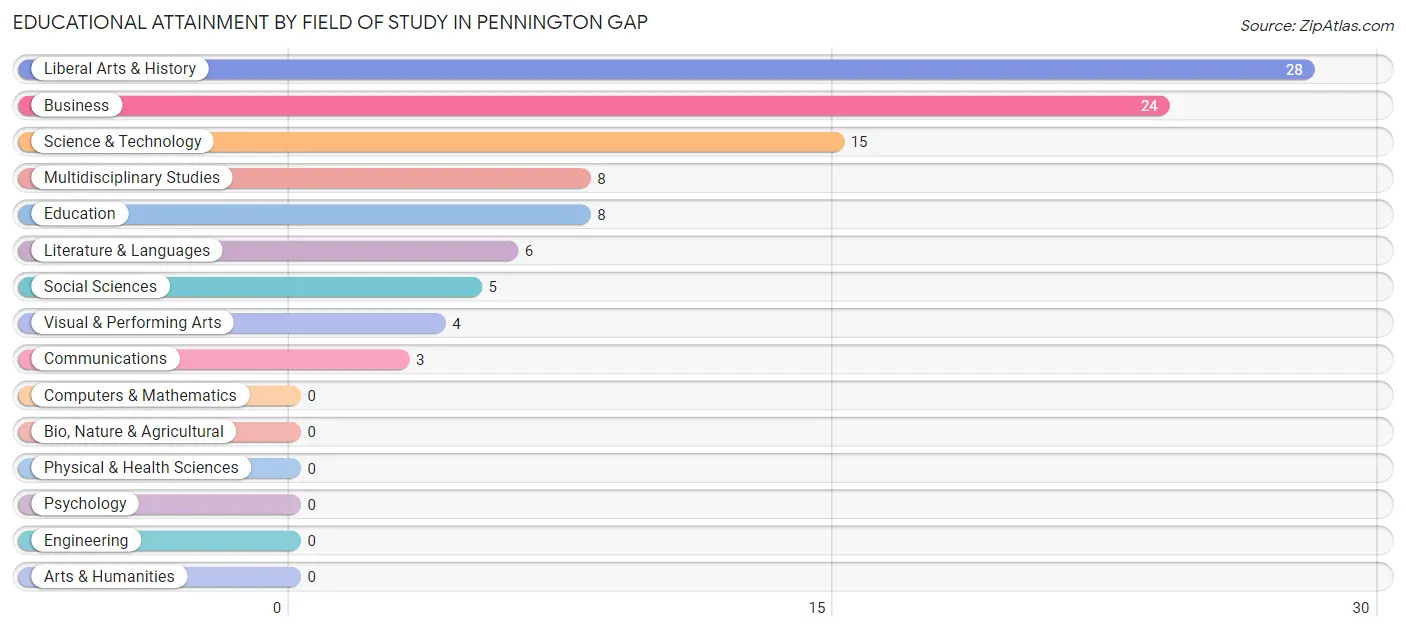
| Field of Study | # Graduates | % Graduates |
| Computers & Mathematics | 0 | 0.0% |
| Bio, Nature & Agricultural | 0 | 0.0% |
| Physical & Health Sciences | 0 | 0.0% |
| Psychology | 0 | 0.0% |
| Social Sciences | 5 | 5.0% |
| Engineering | 0 | 0.0% |
| Multidisciplinary Studies | 8 | 7.9% |
| Science & Technology | 15 | 14.8% |
| Business | 24 | 23.8% |
| Education | 8 | 7.9% |
| Literature & Languages | 6 | 5.9% |
| Liberal Arts & History | 28 | 27.7% |
| Visual & Performing Arts | 4 | 4.0% |
| Communications | 3 | 3.0% |
| Arts & Humanities | 0 | 0.0% |
| Total | 101 | 100.0% |
Transportation & Commute in Pennington Gap
Vehicle Availability by Sex in Pennington Gap
The most prevalent vehicle ownership categories in Pennington Gap are males with 1 vehicle (126, accounting for 68.9%) and females with 1 vehicle (153, making up 43.4%).
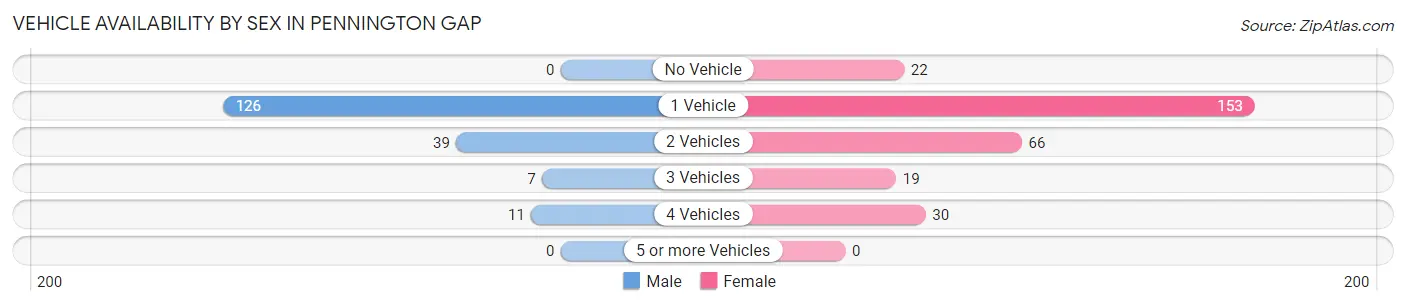
| Vehicles Available | Male | Female |
| No Vehicle | 0 (0.0%) | 22 (7.6%) |
| 1 Vehicle | 126 (68.9%) | 153 (52.8%) |
| 2 Vehicles | 39 (21.3%) | 66 (22.8%) |
| 3 Vehicles | 7 (3.8%) | 19 (6.6%) |
| 4 Vehicles | 11 (6.0%) | 30 (10.3%) |
| 5 or more Vehicles | 0 (0.0%) | 0 (0.0%) |
| Total | 183 (100.0%) | 290 (100.0%) |
Commute Time in Pennington Gap
The most frequently occuring commute durations in Pennington Gap are less than 5 minutes (98 commuters, 21.7%), 5 to 9 minutes (90 commuters, 20.0%), and 20 to 24 minutes (64 commuters, 14.2%).
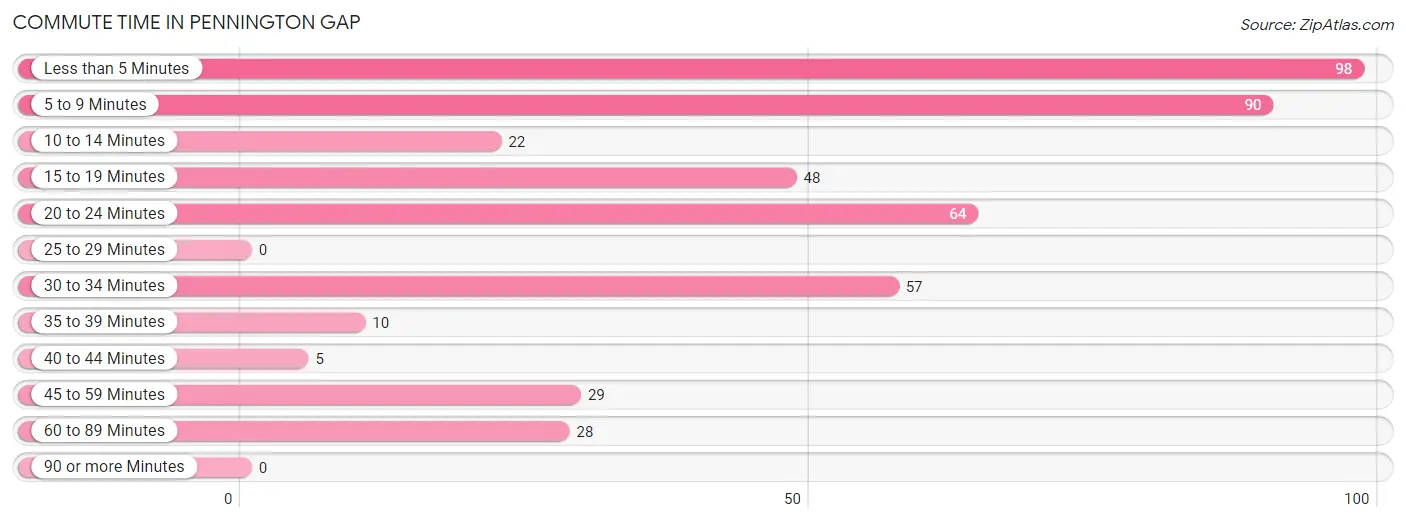
| Commute Time | # Commuters | % Commuters |
| Less than 5 Minutes | 98 | 21.7% |
| 5 to 9 Minutes | 90 | 20.0% |
| 10 to 14 Minutes | 22 | 4.9% |
| 15 to 19 Minutes | 48 | 10.6% |
| 20 to 24 Minutes | 64 | 14.2% |
| 25 to 29 Minutes | 0 | 0.0% |
| 30 to 34 Minutes | 57 | 12.6% |
| 35 to 39 Minutes | 10 | 2.2% |
| 40 to 44 Minutes | 5 | 1.1% |
| 45 to 59 Minutes | 29 | 6.4% |
| 60 to 89 Minutes | 28 | 6.2% |
| 90 or more Minutes | 0 | 0.0% |
Commute Time by Sex in Pennington Gap
The most common commute times in Pennington Gap are 20 to 24 minutes (64 commuters, 36.6%) for males and less than 5 minutes (98 commuters, 35.5%) for females.
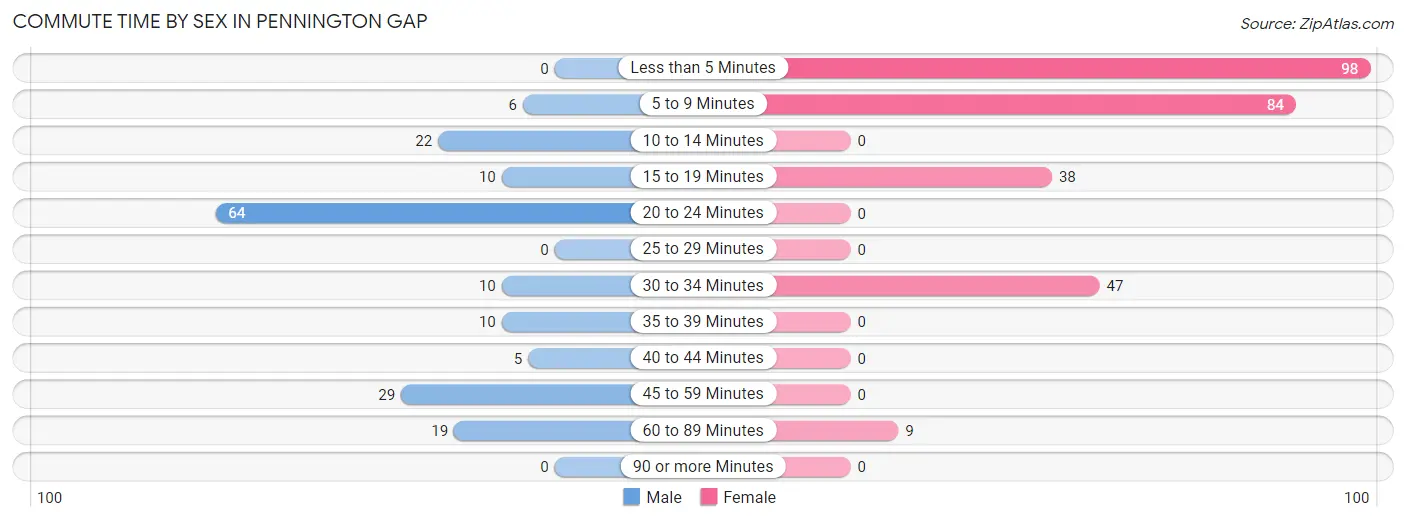
| Commute Time | Male | Female |
| Less than 5 Minutes | 0 (0.0%) | 98 (35.5%) |
| 5 to 9 Minutes | 6 (3.4%) | 84 (30.4%) |
| 10 to 14 Minutes | 22 (12.6%) | 0 (0.0%) |
| 15 to 19 Minutes | 10 (5.7%) | 38 (13.8%) |
| 20 to 24 Minutes | 64 (36.6%) | 0 (0.0%) |
| 25 to 29 Minutes | 0 (0.0%) | 0 (0.0%) |
| 30 to 34 Minutes | 10 (5.7%) | 47 (17.0%) |
| 35 to 39 Minutes | 10 (5.7%) | 0 (0.0%) |
| 40 to 44 Minutes | 5 (2.9%) | 0 (0.0%) |
| 45 to 59 Minutes | 29 (16.6%) | 0 (0.0%) |
| 60 to 89 Minutes | 19 (10.9%) | 9 (3.3%) |
| 90 or more Minutes | 0 (0.0%) | 0 (0.0%) |
Time of Departure to Work by Sex in Pennington Gap
The most frequent times of departure to work in Pennington Gap are 12:00 PM to 3:59 PM (81, 46.3%) for males and 7:00 AM to 7:29 AM (70, 25.4%) for females.
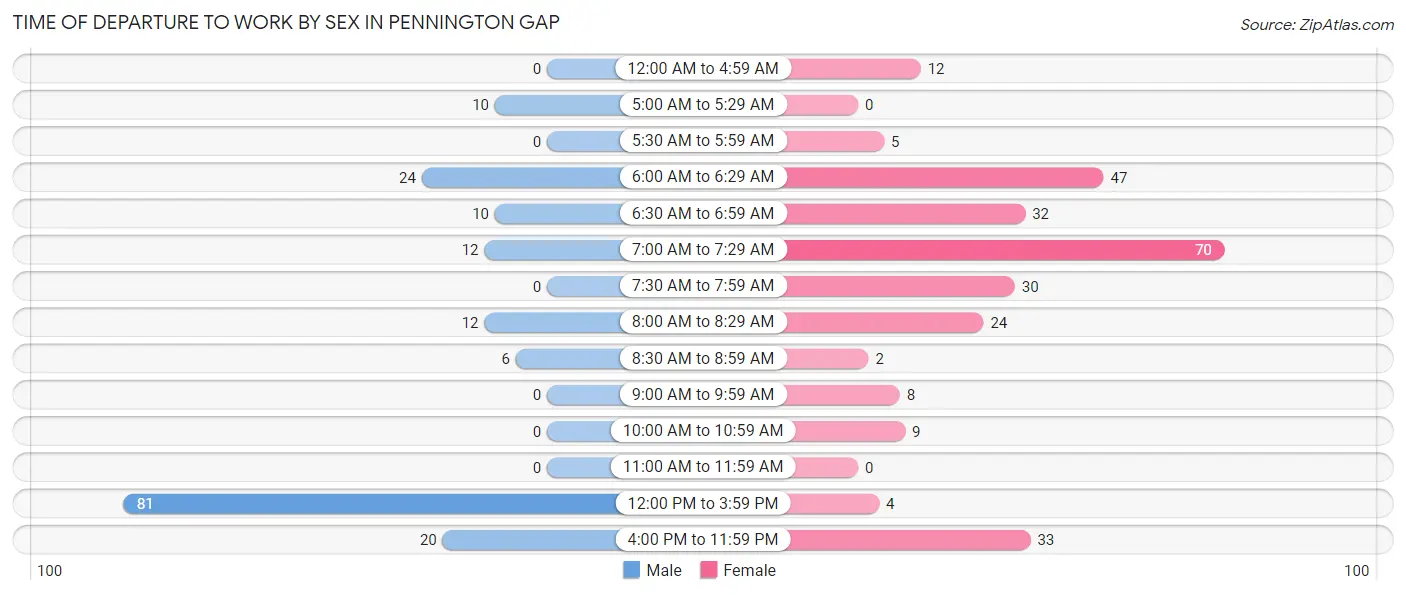
| Time of Departure | Male | Female |
| 12:00 AM to 4:59 AM | 0 (0.0%) | 12 (4.3%) |
| 5:00 AM to 5:29 AM | 10 (5.7%) | 0 (0.0%) |
| 5:30 AM to 5:59 AM | 0 (0.0%) | 5 (1.8%) |
| 6:00 AM to 6:29 AM | 24 (13.7%) | 47 (17.0%) |
| 6:30 AM to 6:59 AM | 10 (5.7%) | 32 (11.6%) |
| 7:00 AM to 7:29 AM | 12 (6.9%) | 70 (25.4%) |
| 7:30 AM to 7:59 AM | 0 (0.0%) | 30 (10.9%) |
| 8:00 AM to 8:29 AM | 12 (6.9%) | 24 (8.7%) |
| 8:30 AM to 8:59 AM | 6 (3.4%) | 2 (0.7%) |
| 9:00 AM to 9:59 AM | 0 (0.0%) | 8 (2.9%) |
| 10:00 AM to 10:59 AM | 0 (0.0%) | 9 (3.3%) |
| 11:00 AM to 11:59 AM | 0 (0.0%) | 0 (0.0%) |
| 12:00 PM to 3:59 PM | 81 (46.3%) | 4 (1.5%) |
| 4:00 PM to 11:59 PM | 20 (11.4%) | 33 (12.0%) |
| Total | 175 (100.0%) | 276 (100.0%) |
Housing Occupancy in Pennington Gap
Occupancy by Ownership in Pennington Gap
Of the total 750 dwellings in Pennington Gap, owner-occupied units account for 324 (43.2%), while renter-occupied units make up 426 (56.8%).
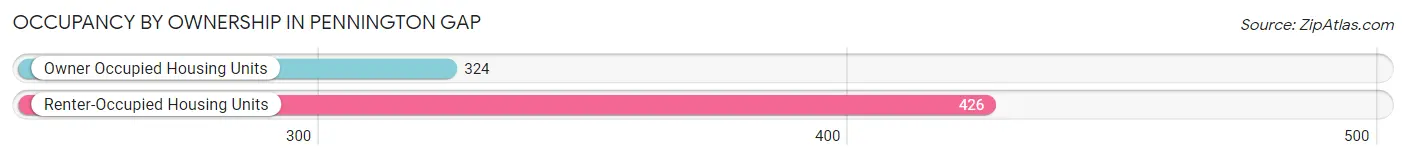
| Occupancy | # Housing Units | % Housing Units |
| Owner Occupied Housing Units | 324 | 43.2% |
| Renter-Occupied Housing Units | 426 | 56.8% |
| Total Occupied Housing Units | 750 | 100.0% |
Occupancy by Household Size in Pennington Gap
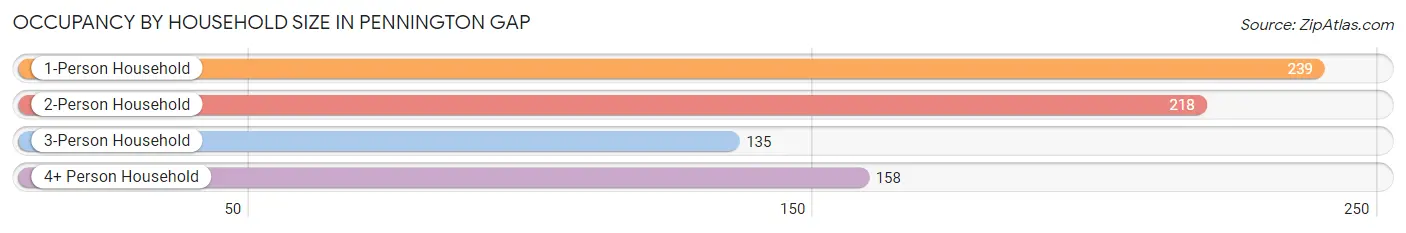
| Household Size | # Housing Units | % Housing Units |
| 1-Person Household | 239 | 31.9% |
| 2-Person Household | 218 | 29.1% |
| 3-Person Household | 135 | 18.0% |
| 4+ Person Household | 158 | 21.1% |
| Total Housing Units | 750 | 100.0% |
Occupancy by Ownership by Household Size in Pennington Gap
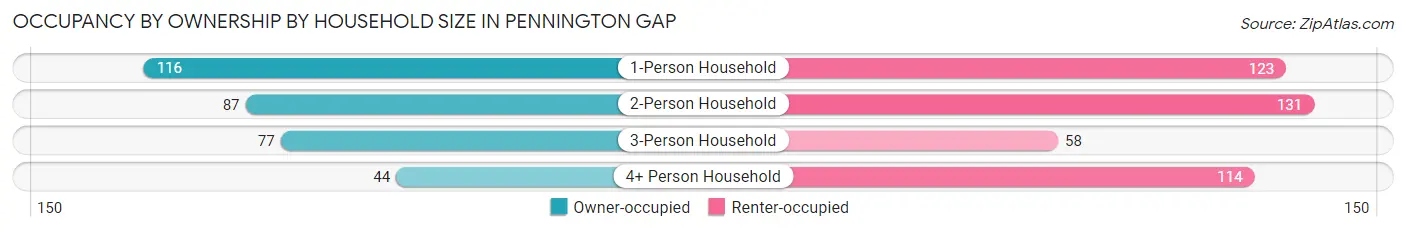
| Household Size | Owner-occupied | Renter-occupied |
| 1-Person Household | 116 (48.5%) | 123 (51.5%) |
| 2-Person Household | 87 (39.9%) | 131 (60.1%) |
| 3-Person Household | 77 (57.0%) | 58 (43.0%) |
| 4+ Person Household | 44 (27.9%) | 114 (72.2%) |
| Total Housing Units | 324 (43.2%) | 426 (56.8%) |
Occupancy by Educational Attainment in Pennington Gap
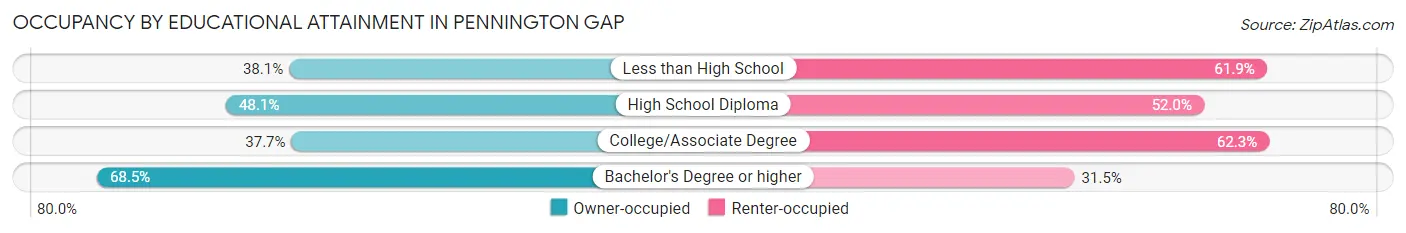
| Household Size | Owner-occupied | Renter-occupied |
| Less than High School | 75 (38.1%) | 122 (61.9%) |
| High School Diploma | 111 (48.0%) | 120 (51.9%) |
| College/Associate Degree | 101 (37.7%) | 167 (62.3%) |
| Bachelor's Degree or higher | 37 (68.5%) | 17 (31.5%) |
Occupancy by Age of Householder in Pennington Gap
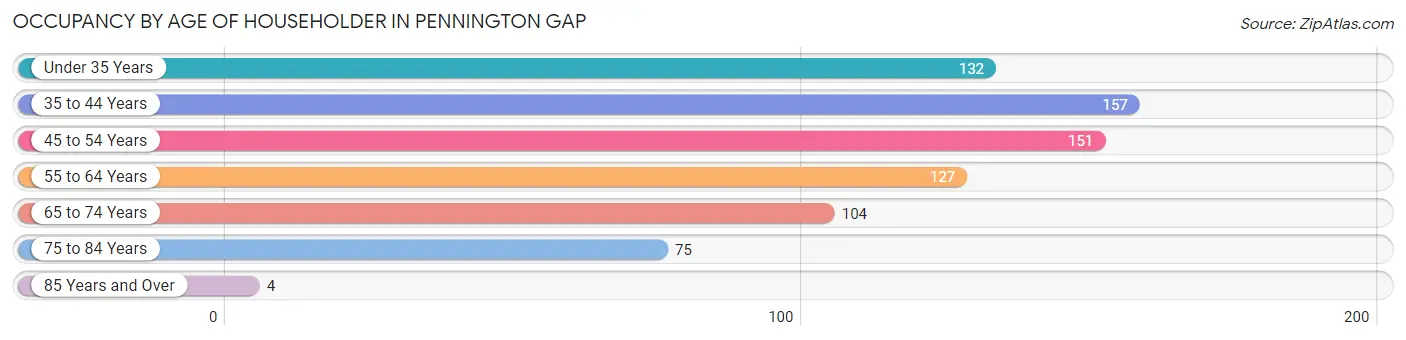
| Age Bracket | # Households | % Households |
| Under 35 Years | 132 | 17.6% |
| 35 to 44 Years | 157 | 20.9% |
| 45 to 54 Years | 151 | 20.1% |
| 55 to 64 Years | 127 | 16.9% |
| 65 to 74 Years | 104 | 13.9% |
| 75 to 84 Years | 75 | 10.0% |
| 85 Years and Over | 4 | 0.5% |
| Total | 750 | 100.0% |
Housing Finances in Pennington Gap
Median Income by Occupancy in Pennington Gap
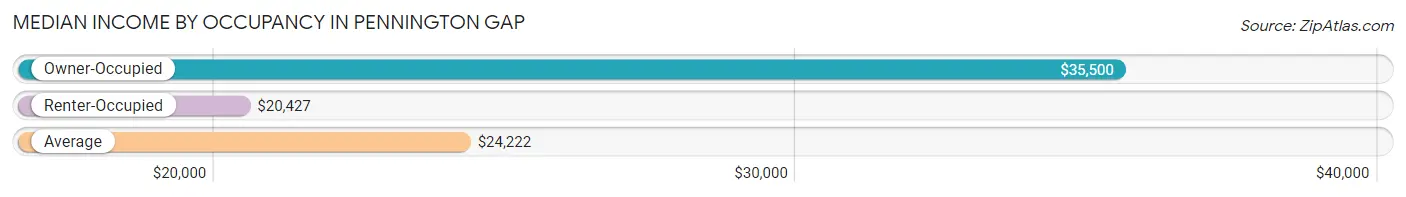
| Occupancy Type | # Households | Median Income |
| Owner-Occupied | 324 (43.2%) | $35,500 |
| Renter-Occupied | 426 (56.8%) | $20,427 |
| Average | 750 (100.0%) | $24,222 |
Occupancy by Householder Income Bracket in Pennington Gap
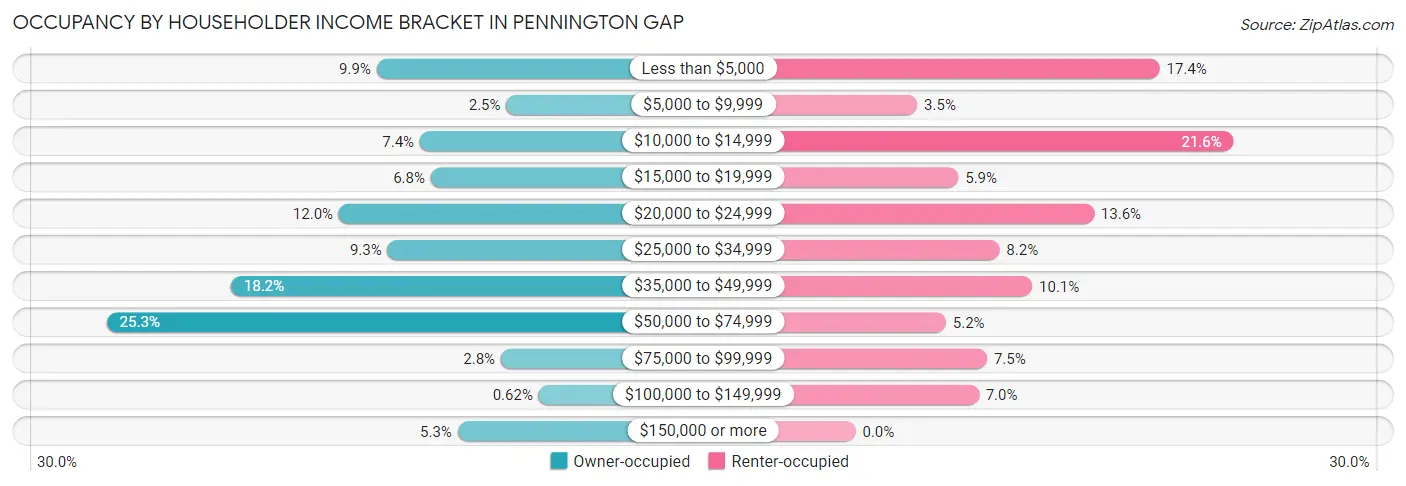
| Income Bracket | Owner-occupied | Renter-occupied |
| Less than $5,000 | 32 (9.9%) | 74 (17.4%) |
| $5,000 to $9,999 | 8 (2.5%) | 15 (3.5%) |
| $10,000 to $14,999 | 24 (7.4%) | 92 (21.6%) |
| $15,000 to $19,999 | 22 (6.8%) | 25 (5.9%) |
| $20,000 to $24,999 | 39 (12.0%) | 58 (13.6%) |
| $25,000 to $34,999 | 30 (9.3%) | 35 (8.2%) |
| $35,000 to $49,999 | 59 (18.2%) | 43 (10.1%) |
| $50,000 to $74,999 | 82 (25.3%) | 22 (5.2%) |
| $75,000 to $99,999 | 9 (2.8%) | 32 (7.5%) |
| $100,000 to $149,999 | 2 (0.6%) | 30 (7.0%) |
| $150,000 or more | 17 (5.2%) | 0 (0.0%) |
| Total | 324 (100.0%) | 426 (100.0%) |
Monthly Housing Cost Tiers in Pennington Gap
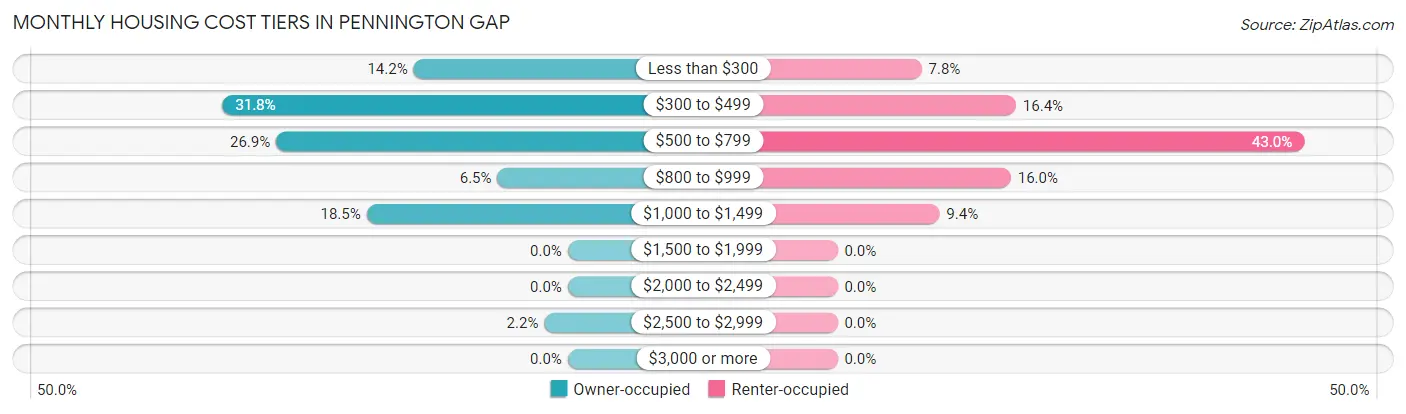
| Monthly Cost | Owner-occupied | Renter-occupied |
| Less than $300 | 46 (14.2%) | 33 (7.7%) |
| $300 to $499 | 103 (31.8%) | 70 (16.4%) |
| $500 to $799 | 87 (26.9%) | 183 (43.0%) |
| $800 to $999 | 21 (6.5%) | 68 (16.0%) |
| $1,000 to $1,499 | 60 (18.5%) | 40 (9.4%) |
| $1,500 to $1,999 | 0 (0.0%) | 0 (0.0%) |
| $2,000 to $2,499 | 0 (0.0%) | 0 (0.0%) |
| $2,500 to $2,999 | 7 (2.2%) | 0 (0.0%) |
| $3,000 or more | 0 (0.0%) | 0 (0.0%) |
| Total | 324 (100.0%) | 426 (100.0%) |
Physical Housing Characteristics in Pennington Gap
Housing Structures in Pennington Gap
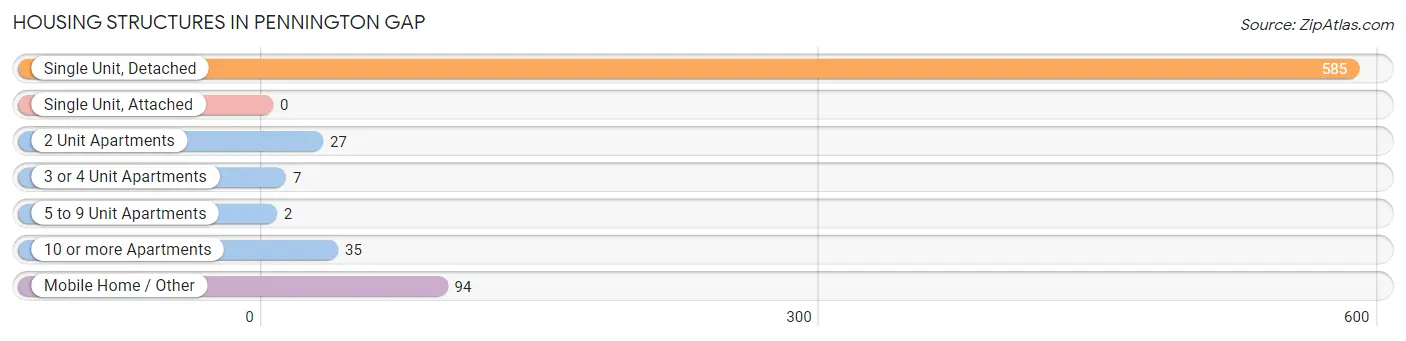
| Structure Type | # Housing Units | % Housing Units |
| Single Unit, Detached | 585 | 78.0% |
| Single Unit, Attached | 0 | 0.0% |
| 2 Unit Apartments | 27 | 3.6% |
| 3 or 4 Unit Apartments | 7 | 0.9% |
| 5 to 9 Unit Apartments | 2 | 0.3% |
| 10 or more Apartments | 35 | 4.7% |
| Mobile Home / Other | 94 | 12.5% |
| Total | 750 | 100.0% |
Housing Structures by Occupancy in Pennington Gap
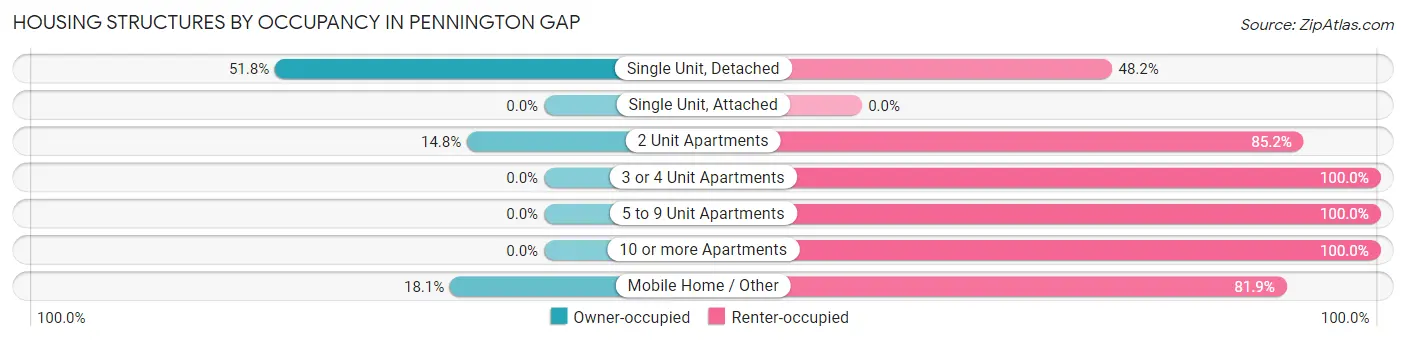
| Structure Type | Owner-occupied | Renter-occupied |
| Single Unit, Detached | 303 (51.8%) | 282 (48.2%) |
| Single Unit, Attached | 0 (0.0%) | 0 (0.0%) |
| 2 Unit Apartments | 4 (14.8%) | 23 (85.2%) |
| 3 or 4 Unit Apartments | 0 (0.0%) | 7 (100.0%) |
| 5 to 9 Unit Apartments | 0 (0.0%) | 2 (100.0%) |
| 10 or more Apartments | 0 (0.0%) | 35 (100.0%) |
| Mobile Home / Other | 17 (18.1%) | 77 (81.9%) |
| Total | 324 (43.2%) | 426 (56.8%) |
Housing Structures by Number of Rooms in Pennington Gap
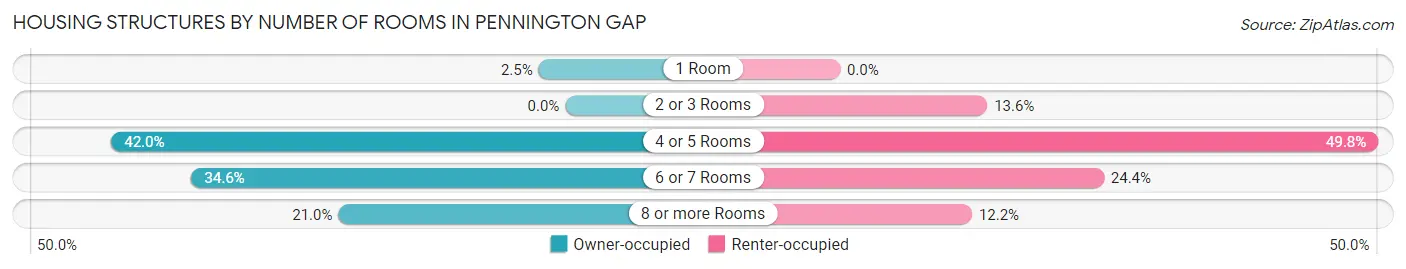
| Number of Rooms | Owner-occupied | Renter-occupied |
| 1 Room | 8 (2.5%) | 0 (0.0%) |
| 2 or 3 Rooms | 0 (0.0%) | 58 (13.6%) |
| 4 or 5 Rooms | 136 (42.0%) | 212 (49.8%) |
| 6 or 7 Rooms | 112 (34.6%) | 104 (24.4%) |
| 8 or more Rooms | 68 (21.0%) | 52 (12.2%) |
| Total | 324 (100.0%) | 426 (100.0%) |
Housing Structure by Heating Type in Pennington Gap
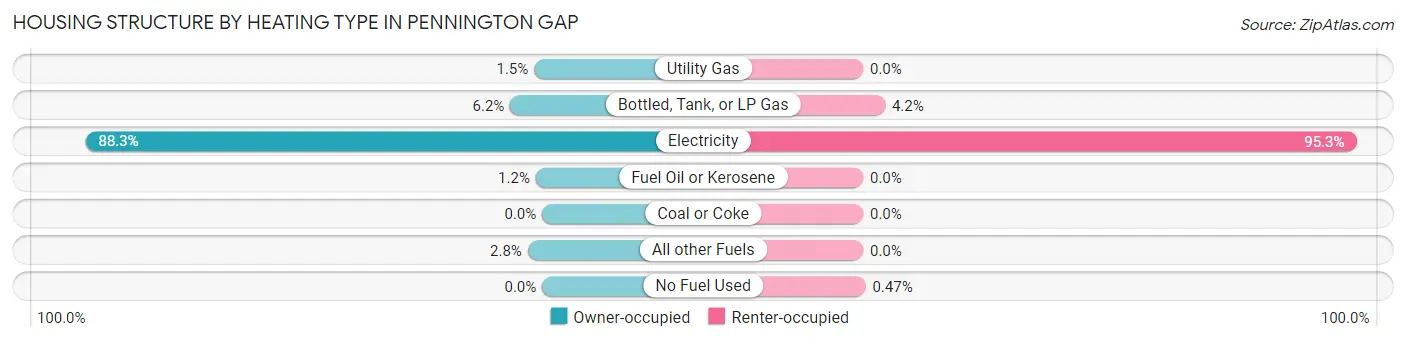
| Heating Type | Owner-occupied | Renter-occupied |
| Utility Gas | 5 (1.5%) | 0 (0.0%) |
| Bottled, Tank, or LP Gas | 20 (6.2%) | 18 (4.2%) |
| Electricity | 286 (88.3%) | 406 (95.3%) |
| Fuel Oil or Kerosene | 4 (1.2%) | 0 (0.0%) |
| Coal or Coke | 0 (0.0%) | 0 (0.0%) |
| All other Fuels | 9 (2.8%) | 0 (0.0%) |
| No Fuel Used | 0 (0.0%) | 2 (0.5%) |
| Total | 324 (100.0%) | 426 (100.0%) |
Household Vehicle Usage in Pennington Gap
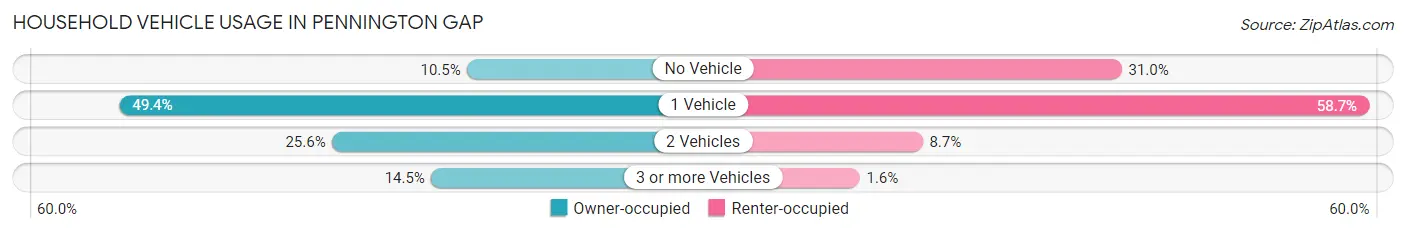
| Vehicles per Household | Owner-occupied | Renter-occupied |
| No Vehicle | 34 (10.5%) | 132 (31.0%) |
| 1 Vehicle | 160 (49.4%) | 250 (58.7%) |
| 2 Vehicles | 83 (25.6%) | 37 (8.7%) |
| 3 or more Vehicles | 47 (14.5%) | 7 (1.6%) |
| Total | 324 (100.0%) | 426 (100.0%) |
Real Estate & Mortgages in Pennington Gap
Real Estate and Mortgage Overview in Pennington Gap
| Characteristic | Without Mortgage | With Mortgage |
| Housing Units | 176 | 148 |
| Median Property Value | $83,700 | $98,400 |
| Median Household Income | $31,944 | $12 |
| Monthly Housing Costs | $344 | $0 |
| Real Estate Taxes | $697 | $0 |
Property Value by Mortgage Status in Pennington Gap
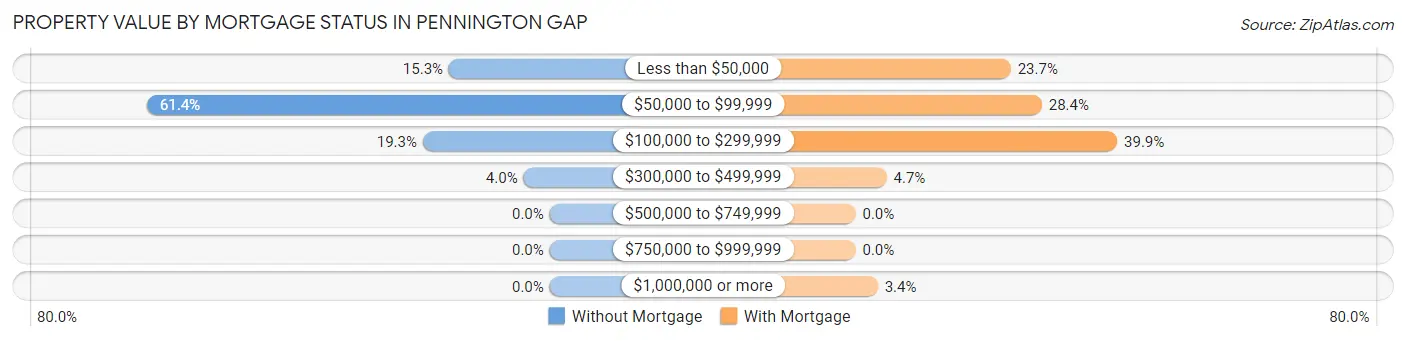
| Property Value | Without Mortgage | With Mortgage |
| Less than $50,000 | 27 (15.3%) | 35 (23.6%) |
| $50,000 to $99,999 | 108 (61.4%) | 42 (28.4%) |
| $100,000 to $299,999 | 34 (19.3%) | 59 (39.9%) |
| $300,000 to $499,999 | 7 (4.0%) | 7 (4.7%) |
| $500,000 to $749,999 | 0 (0.0%) | 0 (0.0%) |
| $750,000 to $999,999 | 0 (0.0%) | 0 (0.0%) |
| $1,000,000 or more | 0 (0.0%) | 5 (3.4%) |
| Total | 176 (100.0%) | 148 (100.0%) |
Household Income by Mortgage Status in Pennington Gap
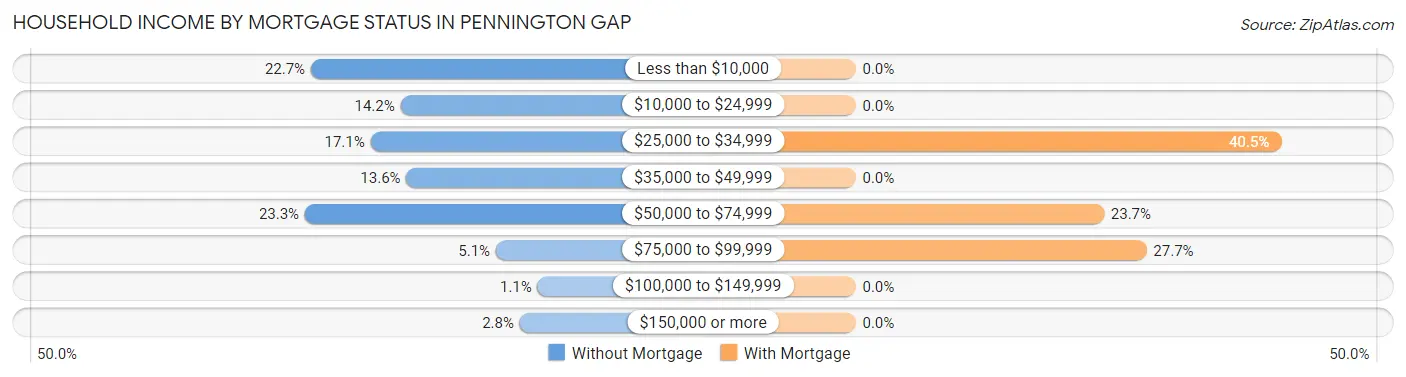
| Household Income | Without Mortgage | With Mortgage |
| Less than $10,000 | 40 (22.7%) | 0 (0.0%) |
| $10,000 to $24,999 | 25 (14.2%) | 0 (0.0%) |
| $25,000 to $34,999 | 30 (17.1%) | 60 (40.5%) |
| $35,000 to $49,999 | 24 (13.6%) | 0 (0.0%) |
| $50,000 to $74,999 | 41 (23.3%) | 35 (23.6%) |
| $75,000 to $99,999 | 9 (5.1%) | 41 (27.7%) |
| $100,000 to $149,999 | 2 (1.1%) | 0 (0.0%) |
| $150,000 or more | 5 (2.8%) | 0 (0.0%) |
| Total | 176 (100.0%) | 148 (100.0%) |
Property Value to Household Income Ratio in Pennington Gap
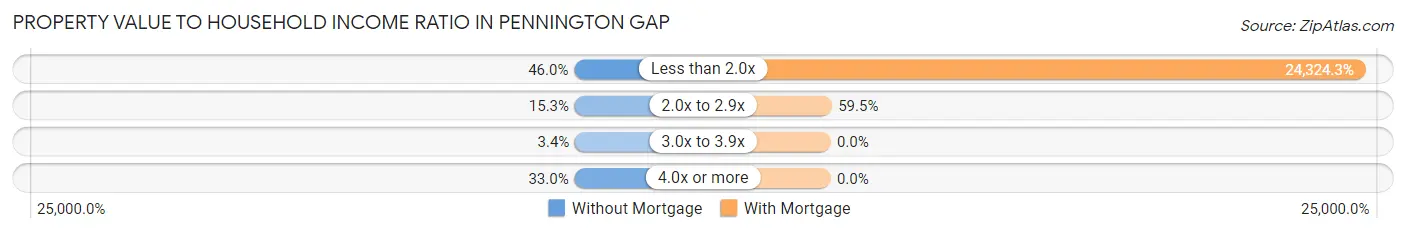
| Value-to-Income Ratio | Without Mortgage | With Mortgage |
| Less than 2.0x | 81 (46.0%) | 36,000 (24,324.3%) |
| 2.0x to 2.9x | 27 (15.3%) | 88 (59.5%) |
| 3.0x to 3.9x | 6 (3.4%) | 0 (0.0%) |
| 4.0x or more | 58 (33.0%) | 0 (0.0%) |
| Total | 176 (100.0%) | 148 (100.0%) |
Real Estate Taxes by Mortgage Status in Pennington Gap
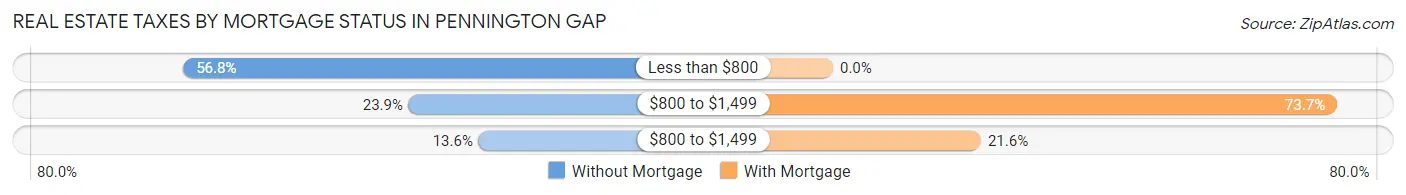
| Property Taxes | Without Mortgage | With Mortgage |
| Less than $800 | 100 (56.8%) | 0 (0.0%) |
| $800 to $1,499 | 42 (23.9%) | 109 (73.7%) |
| $800 to $1,499 | 24 (13.6%) | 32 (21.6%) |
| Total | 176 (100.0%) | 148 (100.0%) |
Health & Disability in Pennington Gap
Health Insurance Coverage by Age in Pennington Gap
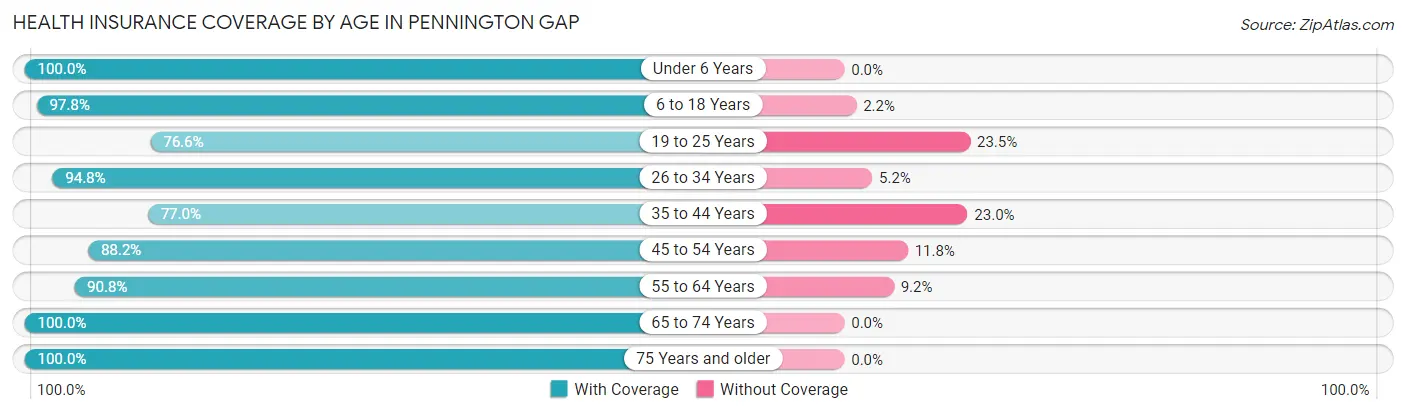
| Age Bracket | With Coverage | Without Coverage |
| Under 6 Years | 251 (100.0%) | 0 (0.0%) |
| 6 to 18 Years | 528 (97.8%) | 12 (2.2%) |
| 19 to 25 Years | 173 (76.5%) | 53 (23.4%) |
| 26 to 34 Years | 183 (94.8%) | 10 (5.2%) |
| 35 to 44 Years | 198 (77.0%) | 59 (23.0%) |
| 45 to 54 Years | 179 (88.2%) | 24 (11.8%) |
| 55 to 64 Years | 187 (90.8%) | 19 (9.2%) |
| 65 to 74 Years | 132 (100.0%) | 0 (0.0%) |
| 75 Years and older | 119 (100.0%) | 0 (0.0%) |
| Total | 1,950 (91.7%) | 177 (8.3%) |
Health Insurance Coverage by Citizenship Status in Pennington Gap
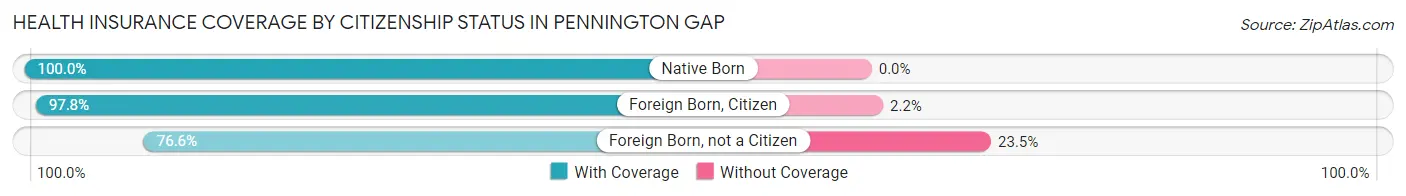
| Citizenship Status | With Coverage | Without Coverage |
| Native Born | 251 (100.0%) | 0 (0.0%) |
| Foreign Born, Citizen | 528 (97.8%) | 12 (2.2%) |
| Foreign Born, not a Citizen | 173 (76.5%) | 53 (23.4%) |
Health Insurance Coverage by Household Income in Pennington Gap
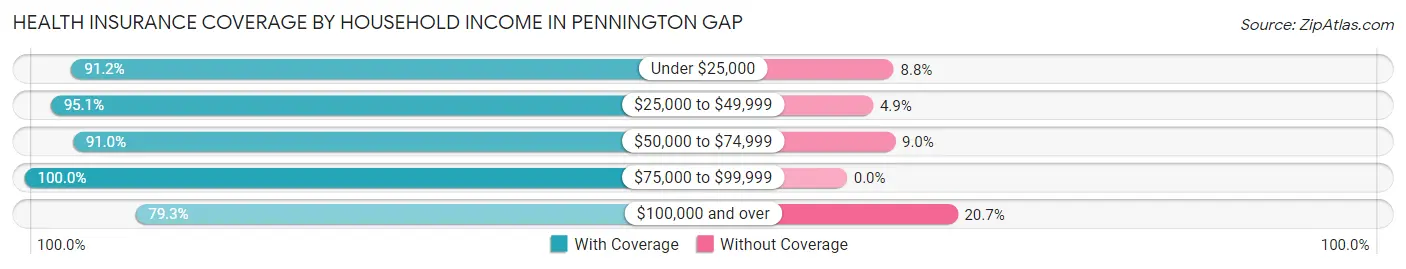
| Household Income | With Coverage | Without Coverage |
| Under $25,000 | 759 (91.2%) | 73 (8.8%) |
| $25,000 to $49,999 | 543 (95.1%) | 28 (4.9%) |
| $50,000 to $74,999 | 483 (91.0%) | 48 (9.0%) |
| $75,000 to $99,999 | 58 (100.0%) | 0 (0.0%) |
| $100,000 and over | 107 (79.3%) | 28 (20.7%) |
Public vs Private Health Insurance Coverage by Age in Pennington Gap

| Age Bracket | Public Insurance | Private Insurance |
| Under 6 | 251 (100.0%) | 0 (0.0%) |
| 6 to 18 Years | 504 (93.3%) | 62 (11.5%) |
| 19 to 25 Years | 162 (71.7%) | 11 (4.9%) |
| 25 to 34 Years | 121 (62.7%) | 70 (36.3%) |
| 35 to 44 Years | 109 (42.4%) | 94 (36.6%) |
| 45 to 54 Years | 139 (68.5%) | 78 (38.4%) |
| 55 to 64 Years | 167 (81.1%) | 20 (9.7%) |
| 65 to 74 Years | 132 (100.0%) | 53 (40.2%) |
| 75 Years and over | 119 (100.0%) | 61 (51.3%) |
| Total | 1,704 (80.1%) | 449 (21.1%) |
Disability Status by Sex by Age in Pennington Gap
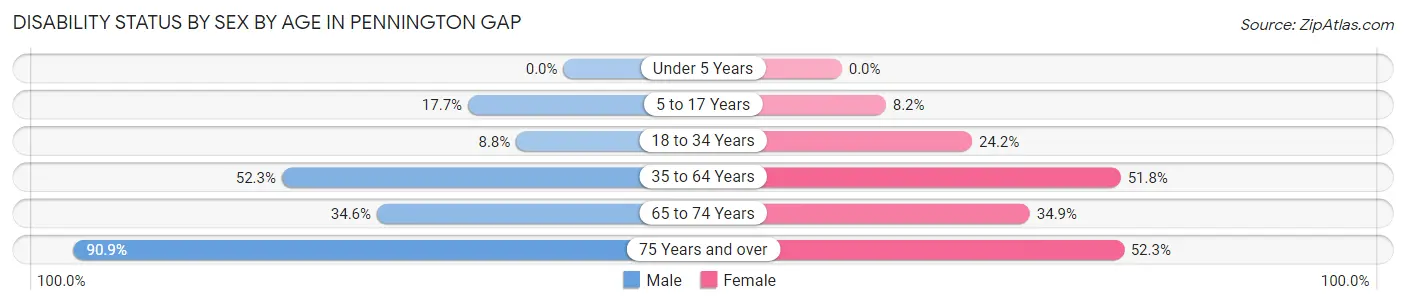
| Age Bracket | Male | Female |
| Under 5 Years | 0 (0.0%) | 0 (0.0%) |
| 5 to 17 Years | 59 (17.7%) | 17 (8.2%) |
| 18 to 34 Years | 15 (8.8%) | 67 (24.2%) |
| 35 to 64 Years | 127 (52.3%) | 219 (51.8%) |
| 65 to 74 Years | 9 (34.6%) | 37 (34.9%) |
| 75 Years and over | 30 (90.9%) | 45 (52.3%) |
Disability Class by Sex by Age in Pennington Gap
Disability Class: Hearing Difficulty
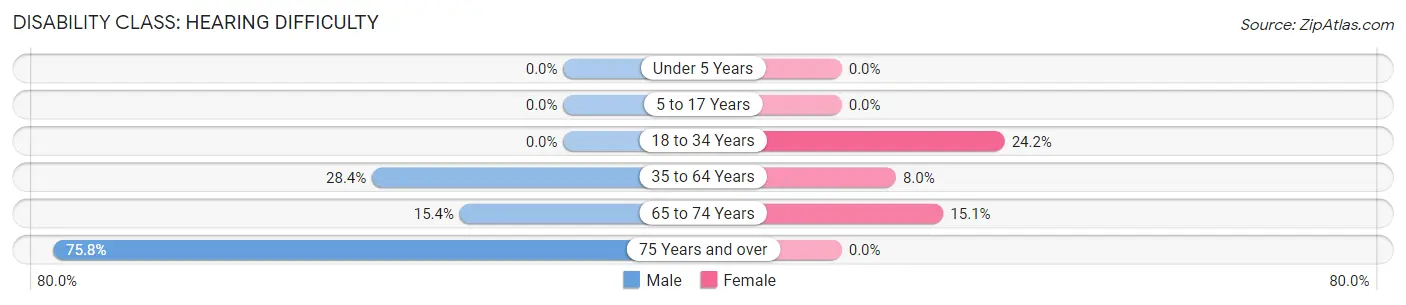
| Age Bracket | Male | Female |
| Under 5 Years | 0 (0.0%) | 0 (0.0%) |
| 5 to 17 Years | 0 (0.0%) | 0 (0.0%) |
| 18 to 34 Years | 0 (0.0%) | 67 (24.2%) |
| 35 to 64 Years | 69 (28.4%) | 34 (8.0%) |
| 65 to 74 Years | 4 (15.4%) | 16 (15.1%) |
| 75 Years and over | 25 (75.8%) | 0 (0.0%) |
Disability Class: Vision Difficulty
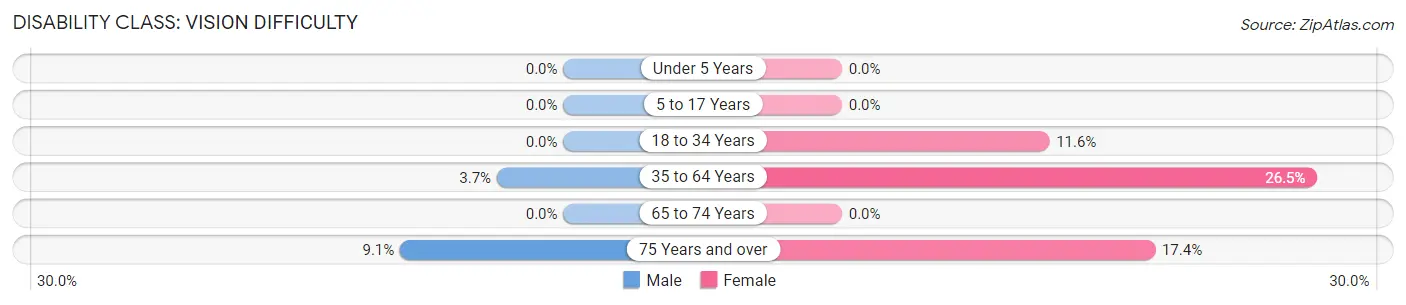
| Age Bracket | Male | Female |
| Under 5 Years | 0 (0.0%) | 0 (0.0%) |
| 5 to 17 Years | 0 (0.0%) | 0 (0.0%) |
| 18 to 34 Years | 0 (0.0%) | 32 (11.6%) |
| 35 to 64 Years | 9 (3.7%) | 112 (26.5%) |
| 65 to 74 Years | 0 (0.0%) | 0 (0.0%) |
| 75 Years and over | 3 (9.1%) | 15 (17.4%) |
Disability Class: Cognitive Difficulty
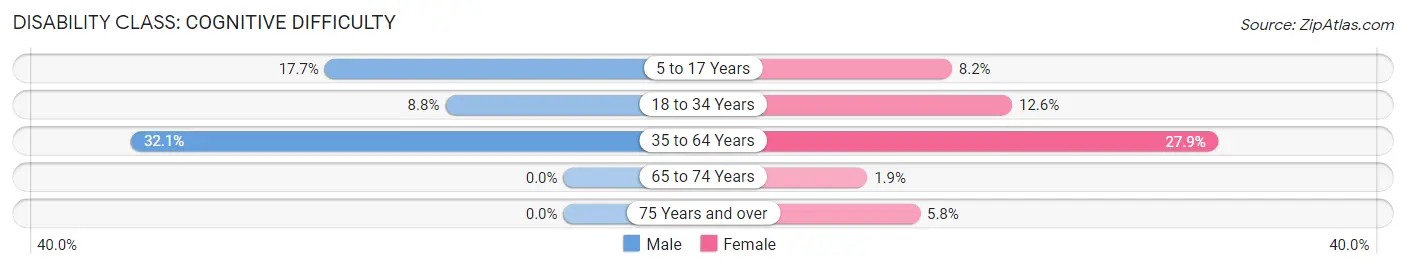
| Age Bracket | Male | Female |
| 5 to 17 Years | 59 (17.7%) | 17 (8.2%) |
| 18 to 34 Years | 15 (8.8%) | 35 (12.6%) |
| 35 to 64 Years | 78 (32.1%) | 118 (27.9%) |
| 65 to 74 Years | 0 (0.0%) | 2 (1.9%) |
| 75 Years and over | 0 (0.0%) | 5 (5.8%) |
Disability Class: Ambulatory Difficulty
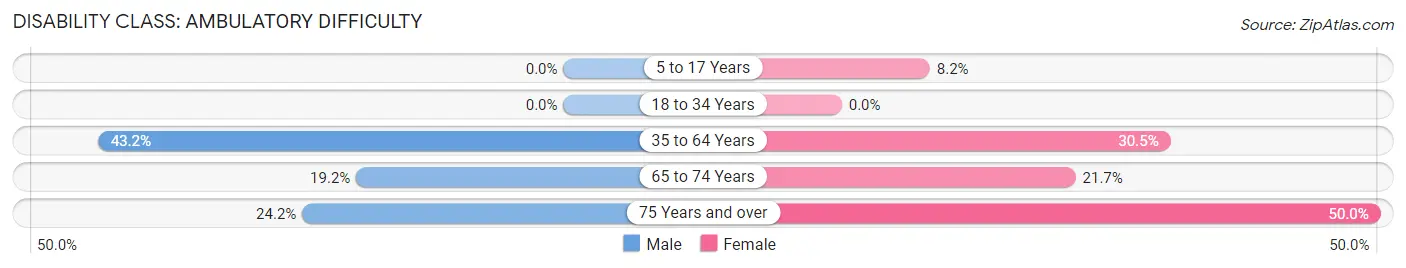
| Age Bracket | Male | Female |
| 5 to 17 Years | 0 (0.0%) | 17 (8.2%) |
| 18 to 34 Years | 0 (0.0%) | 0 (0.0%) |
| 35 to 64 Years | 105 (43.2%) | 129 (30.5%) |
| 65 to 74 Years | 5 (19.2%) | 23 (21.7%) |
| 75 Years and over | 8 (24.2%) | 43 (50.0%) |
Disability Class: Self-Care Difficulty
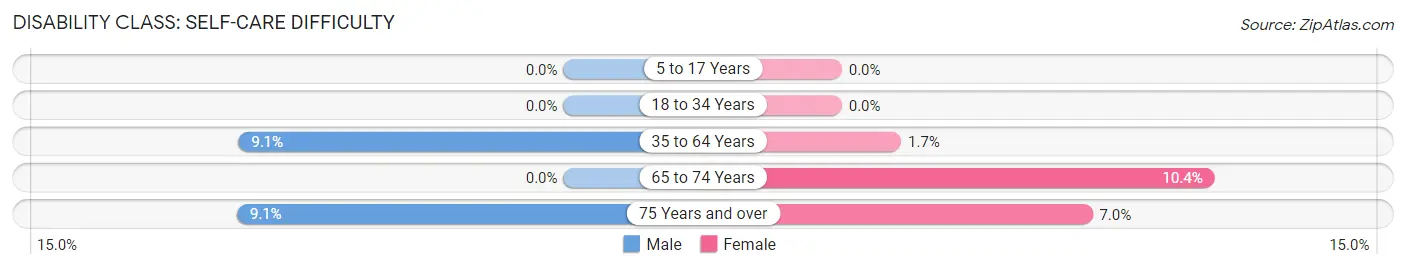
| Age Bracket | Male | Female |
| 5 to 17 Years | 0 (0.0%) | 0 (0.0%) |
| 18 to 34 Years | 0 (0.0%) | 0 (0.0%) |
| 35 to 64 Years | 22 (9.0%) | 7 (1.7%) |
| 65 to 74 Years | 0 (0.0%) | 11 (10.4%) |
| 75 Years and over | 3 (9.1%) | 6 (7.0%) |
Technology Access in Pennington Gap
Computing Device Access in Pennington Gap
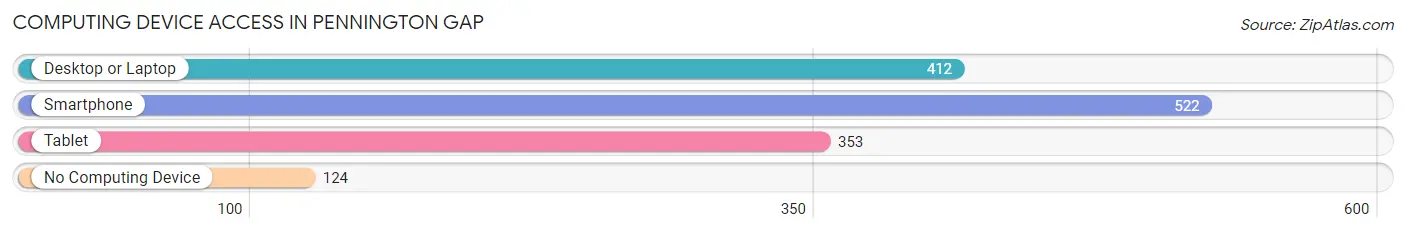
| Device Type | # Households | % Households |
| Desktop or Laptop | 412 | 54.9% |
| Smartphone | 522 | 69.6% |
| Tablet | 353 | 47.1% |
| No Computing Device | 124 | 16.5% |
| Total | 750 | 100.0% |
Internet Access in Pennington Gap
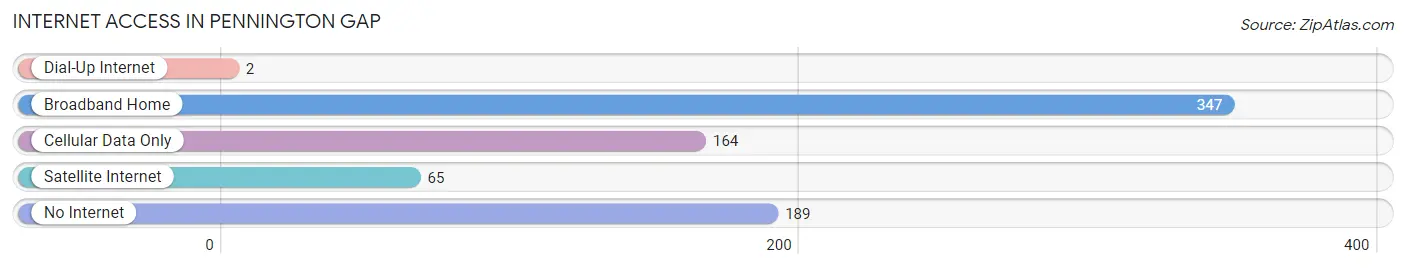
| Internet Type | # Households | % Households |
| Dial-Up Internet | 2 | 0.3% |
| Broadband Home | 347 | 46.3% |
| Cellular Data Only | 164 | 21.9% |
| Satellite Internet | 65 | 8.7% |
| No Internet | 189 | 25.2% |
| Total | 750 | 100.0% |
Pennington Gap Summary
Pennington Gap is a town located in Lee County, Virginia, United States. It is part of the Appalachian Mountains region and is situated in the Cumberland Plateau. The town is located along the Powell River and is the county seat of Lee County. As of the 2010 census, the population of Pennington Gap was 1,781.
History
The area that is now Pennington Gap was first settled in the late 1700s by settlers from North Carolina and Tennessee. The town was originally known as "Powell's Valley" and was named after the Powell River, which runs through the area. The town was officially incorporated in 1891 and was named after the Pennington family, who were early settlers in the area.
The town was an important stop on the Clinchfield Railroad, which ran from Elkhorn City, Kentucky to Spartanburg, South Carolina. The railroad was built in the early 1900s and was a major factor in the growth of the town.
Geography
Pennington Gap is located in the Appalachian Mountains region of Virginia. It is situated in the Cumberland Plateau, which is a large plateau that stretches from southwestern Virginia to northeastern Tennessee. The town is located along the Powell River, which is a tributary of the Clinch River. The town is located at an elevation of 1,845 feet (562 m).
The climate in Pennington Gap is humid subtropical, with hot, humid summers and mild winters. The average annual temperature is 57°F (14°C). The average annual precipitation is 44 inches (112 cm).
Economy
The economy of Pennington Gap is largely based on agriculture and manufacturing. The town is home to several manufacturing companies, including a furniture factory, a paper mill, and a plastics factory. The town is also home to several agricultural businesses, including a dairy farm, a poultry farm, and a beef cattle farm.
The town is also home to several retail stores, restaurants, and other businesses. The town is served by the Lee County Airport, which is located just outside of town.
Demographics
As of the 2010 census, the population of Pennington Gap was 1,781. The racial makeup of the town was 95.3% White, 2.2% African American, 0.3% Native American, 0.2% Asian, 0.1% Pacific Islander, 0.7% from other races, and 1.3% from two or more races. Hispanic or Latino of any race were 1.7% of the population.
The median income for a household in Pennington Gap was $30,938, and the median income for a family was $37,917. The per capita income for the town was $15,945. About 17.2% of families and 20.2% of the population were below the poverty line, including 28.2% of those under age 18 and 16.2% of those age 65 or over.
Common Questions
What is Per Capita Income in Pennington Gap?
Per Capita income in Pennington Gap is $17,779.
What is the Median Family Income in Pennington Gap?
Median Family Income in Pennington Gap is $32,500.
What is the Median Household income in Pennington Gap?
Median Household Income in Pennington Gap is $24,222.
What is Inequality or Gini Index in Pennington Gap?
Inequality or Gini Index in Pennington Gap is 0.61.
What is the Total Population of Pennington Gap?
Total Population of Pennington Gap is 2,254.
What is the Total Male Population of Pennington Gap?
Total Male Population of Pennington Gap is 964.
What is the Total Female Population of Pennington Gap?
Total Female Population of Pennington Gap is 1,290.
What is the Ratio of Males per 100 Females in Pennington Gap?
There are 74.73 Males per 100 Females in Pennington Gap.
What is the Ratio of Females per 100 Males in Pennington Gap?
There are 133.82 Females per 100 Males in Pennington Gap.
What is the Median Population Age in Pennington Gap?
Median Population Age in Pennington Gap is 32.2 Years.
What is the Average Family Size in Pennington Gap
Average Family Size in Pennington Gap is 3.6 People.
What is the Average Household Size in Pennington Gap
Average Household Size in Pennington Gap is 2.8 People.
How Large is the Labor Force in Pennington Gap?
There are 630 People in the Labor Forcein in Pennington Gap.
What is the Percentage of People in the Labor Force in Pennington Gap?
40.4% of People are in the Labor Force in Pennington Gap.
What is the Unemployment Rate in Pennington Gap?
Unemployment Rate in Pennington Gap is 21.2%.