Nickelsville, VA Map & Demographics
Nickelsville Map
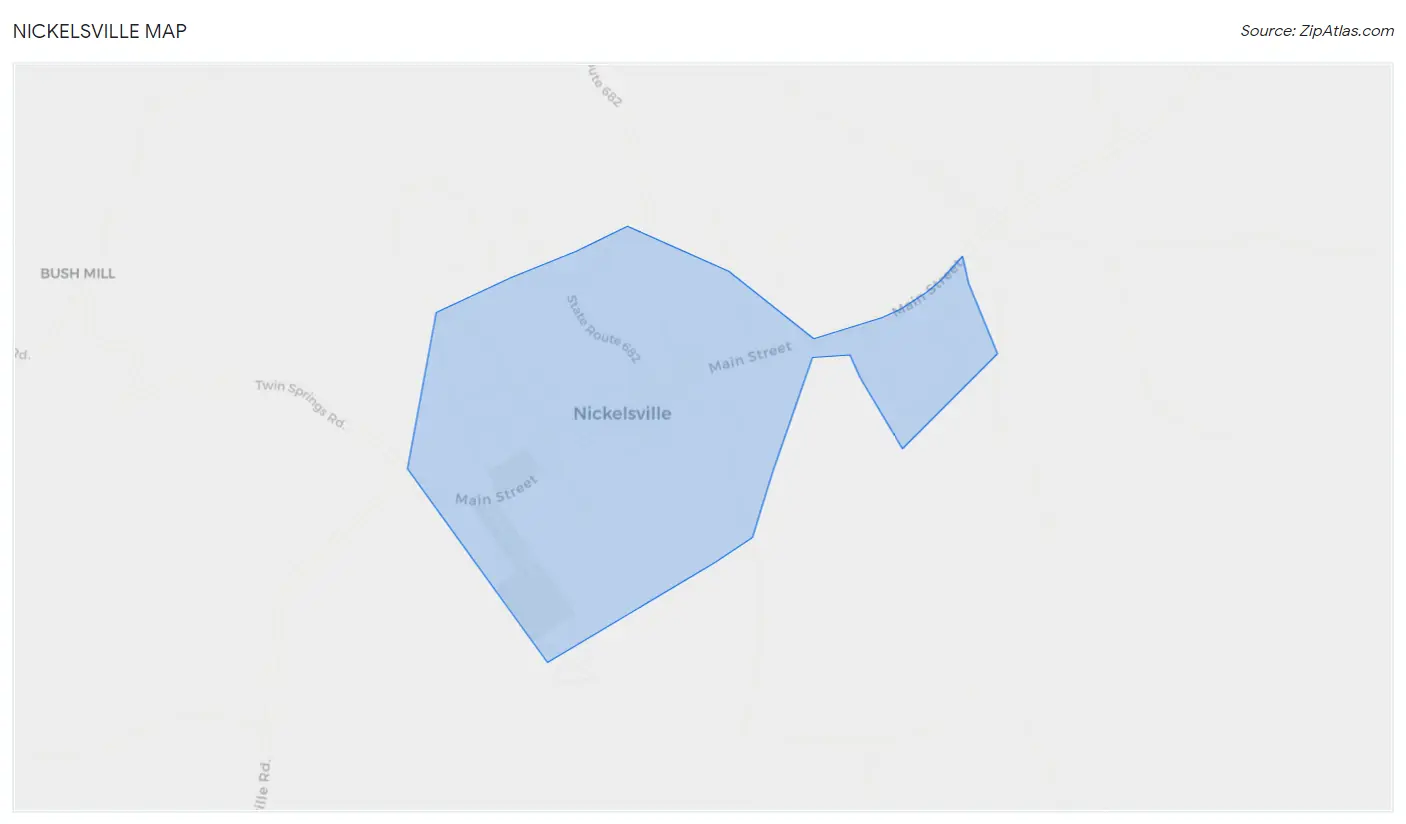
Nickelsville Overview
$23,216
PER CAPITA INCOME
$44,083
AVG FAMILY INCOME
$30,000
AVG HOUSEHOLD INCOME
0.56
INEQUALITY / GINI INDEX
360
TOTAL POPULATION
161
MALE POPULATION
199
FEMALE POPULATION
80.90
MALES / 100 FEMALES
123.60
FEMALES / 100 MALES
53.5
MEDIAN AGE
3.0
AVG FAMILY SIZE
2.1
AVG HOUSEHOLD SIZE
93
LABOR FORCE [ PEOPLE ]
30.7%
PERCENT IN LABOR FORCE
11.8%
UNEMPLOYMENT RATE
Nickelsville Zip Codes
Nickelsville Area Codes
Income in Nickelsville
Income Overview in Nickelsville
Per Capita Income in Nickelsville is $23,216, while median incomes of families and households are $44,083 and $30,000 respectively.
| Characteristic | Number | Measure |
| Per Capita Income | 360 | $23,216 |
| Median Family Income | 93 | $44,083 |
| Mean Family Income | 93 | $68,372 |
| Median Household Income | 170 | $30,000 |
| Mean Household Income | 170 | $47,678 |
| Income Deficit | 93 | $0 |
| Wage / Income Gap (%) | 360 | 0.00% |
| Wage / Income Gap ($) | 360 | 100.00¢ per $1 |
| Gini / Inequality Index | 360 | 0.56 |
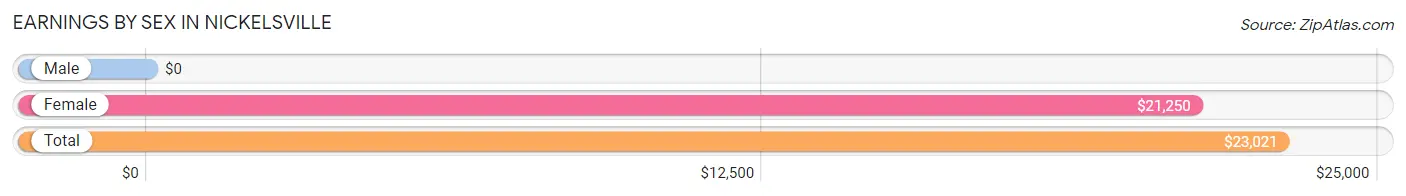
Earnings by Sex in Nickelsville
| Sex | Number | Average Earnings |
| Male | 48 (41.7%) | $0 |
| Female | 67 (58.3%) | $21,250 |
| Total | 115 (100.0%) | $23,021 |
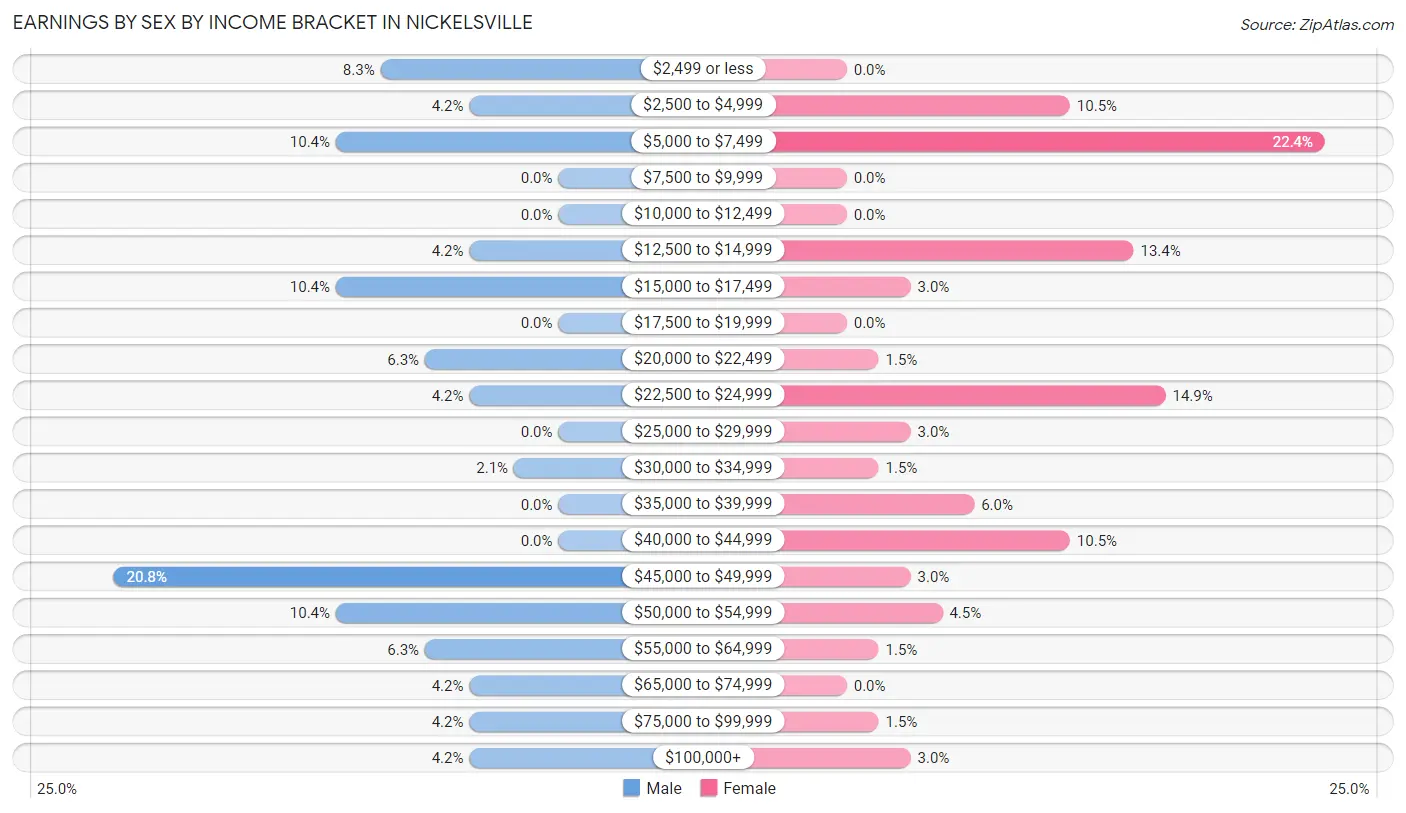
Earnings by Sex by Income Bracket in Nickelsville
The most common earnings brackets in Nickelsville are $45,000 to $49,999 for men (10 | 20.8%) and $5,000 to $7,499 for women (15 | 22.4%).
| Income | Male | Female |
| $2,499 or less | 4 (8.3%) | 0 (0.0%) |
| $2,500 to $4,999 | 2 (4.2%) | 7 (10.4%) |
| $5,000 to $7,499 | 5 (10.4%) | 15 (22.4%) |
| $7,500 to $9,999 | 0 (0.0%) | 0 (0.0%) |
| $10,000 to $12,499 | 0 (0.0%) | 0 (0.0%) |
| $12,500 to $14,999 | 2 (4.2%) | 9 (13.4%) |
| $15,000 to $17,499 | 5 (10.4%) | 2 (3.0%) |
| $17,500 to $19,999 | 0 (0.0%) | 0 (0.0%) |
| $20,000 to $22,499 | 3 (6.2%) | 1 (1.5%) |
| $22,500 to $24,999 | 2 (4.2%) | 10 (14.9%) |
| $25,000 to $29,999 | 0 (0.0%) | 2 (3.0%) |
| $30,000 to $34,999 | 1 (2.1%) | 1 (1.5%) |
| $35,000 to $39,999 | 0 (0.0%) | 4 (6.0%) |
| $40,000 to $44,999 | 0 (0.0%) | 7 (10.4%) |
| $45,000 to $49,999 | 10 (20.8%) | 2 (3.0%) |
| $50,000 to $54,999 | 5 (10.4%) | 3 (4.5%) |
| $55,000 to $64,999 | 3 (6.2%) | 1 (1.5%) |
| $65,000 to $74,999 | 2 (4.2%) | 0 (0.0%) |
| $75,000 to $99,999 | 2 (4.2%) | 1 (1.5%) |
| $100,000+ | 2 (4.2%) | 2 (3.0%) |
| Total | 48 (100.0%) | 67 (100.0%) |
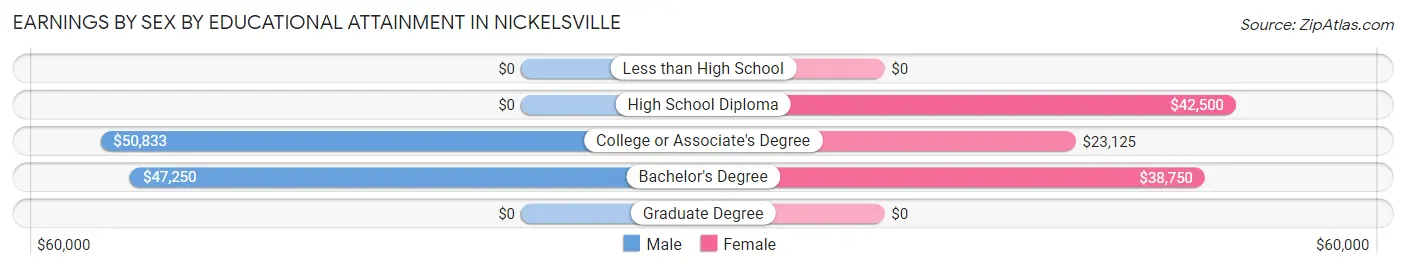
Earnings by Sex by Educational Attainment in Nickelsville
| Educational Attainment | Male Income | Female Income |
| Less than High School | - | - |
| High School Diploma | - | - |
| College or Associate's Degree | $50,833 | $23,125 |
| Bachelor's Degree | $47,250 | $38,750 |
| Graduate Degree | - | - |
| Total | $46,125 | $0 |
Family Income in Nickelsville
Family Income Brackets in Nickelsville
According to the Nickelsville family income data, there are 26 families falling into the $35,000 to $49,999 income range, which is the most common income bracket and makes up 28.0% of all families. Conversely, the $200,000+ income bracket is the least frequent group with only 2 families (2.1%) belonging to this category.
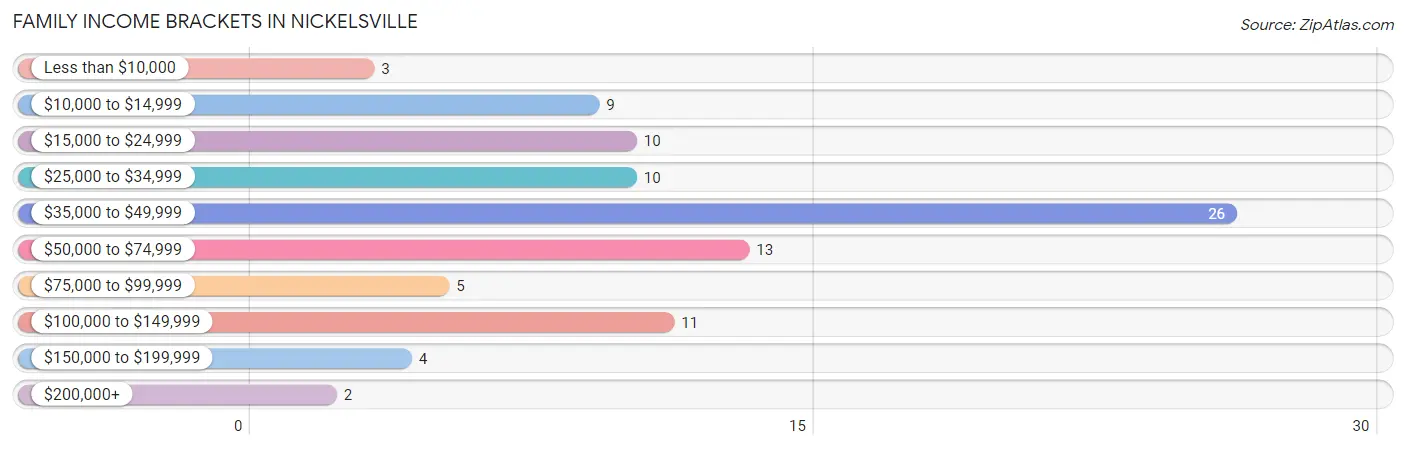
| Income Bracket | # Families | % Families |
| Less than $10,000 | 3 | 3.2% |
| $10,000 to $14,999 | 9 | 9.7% |
| $15,000 to $24,999 | 10 | 10.8% |
| $25,000 to $34,999 | 10 | 10.8% |
| $35,000 to $49,999 | 26 | 28.0% |
| $50,000 to $74,999 | 13 | 14.0% |
| $75,000 to $99,999 | 5 | 5.4% |
| $100,000 to $149,999 | 11 | 11.8% |
| $150,000 to $199,999 | 4 | 4.3% |
| $200,000+ | 2 | 2.2% |
Family Income by Famaliy Size in Nickelsville
4-person families (11 | 11.8%) account for the highest median family income in Nickelsville with $85,625 per family, while 2-person families (60 | 64.5%) have the highest median income of $21,518 per family member.
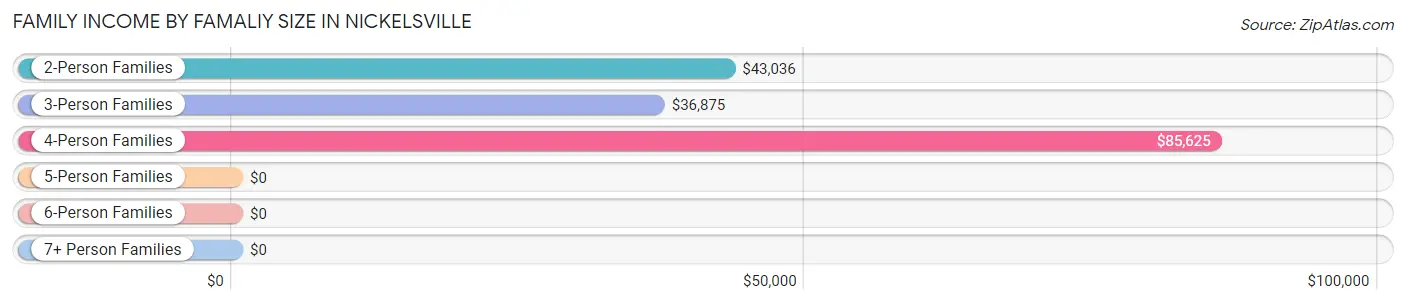
| Income Bracket | # Families | Median Income |
| 2-Person Families | 60 (64.5%) | $43,036 |
| 3-Person Families | 13 (14.0%) | $36,875 |
| 4-Person Families | 11 (11.8%) | $85,625 |
| 5-Person Families | 9 (9.7%) | $0 |
| 6-Person Families | 0 (0.0%) | $0 |
| 7+ Person Families | 0 (0.0%) | $0 |
| Total | 93 (100.0%) | $44,083 |
Family Income by Number of Earners in Nickelsville
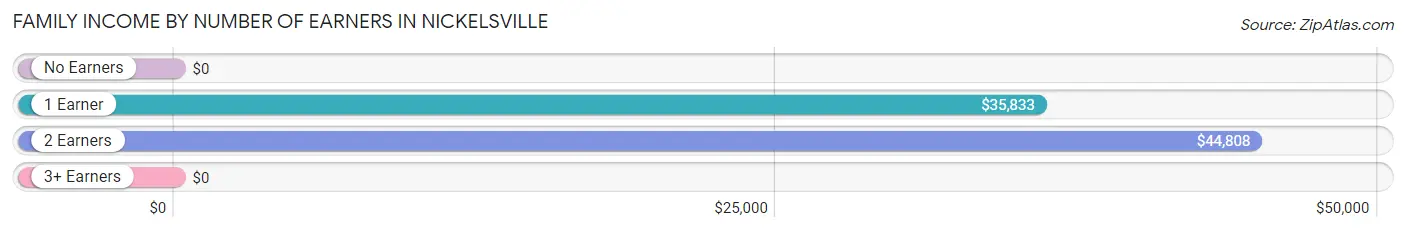
| Number of Earners | # Families | Median Income |
| No Earners | 24 (25.8%) | $0 |
| 1 Earner | 38 (40.9%) | $35,833 |
| 2 Earners | 28 (30.1%) | $44,808 |
| 3+ Earners | 3 (3.2%) | $0 |
| Total | 93 (100.0%) | $44,083 |
Household Income in Nickelsville
Household Income Brackets in Nickelsville
With 32 households falling in the category, the less than $10,000 income range is the most frequent in Nickelsville, accounting for 18.8% of all households. In contrast, only 2 households (1.2%) fall into the $200,000+ income bracket, making it the least populous group.
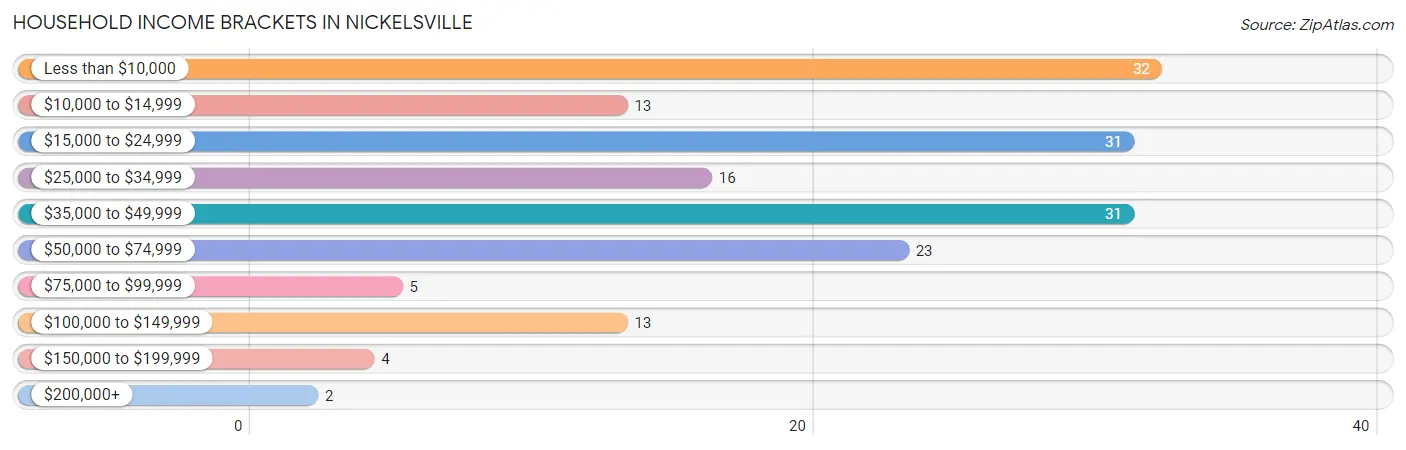
| Income Bracket | # Households | % Households |
| Less than $10,000 | 32 | 18.8% |
| $10,000 to $14,999 | 13 | 7.6% |
| $15,000 to $24,999 | 31 | 18.2% |
| $25,000 to $34,999 | 16 | 9.4% |
| $35,000 to $49,999 | 31 | 18.2% |
| $50,000 to $74,999 | 23 | 13.5% |
| $75,000 to $99,999 | 5 | 2.9% |
| $100,000 to $149,999 | 13 | 7.6% |
| $150,000 to $199,999 | 4 | 2.4% |
| $200,000+ | 2 | 1.2% |
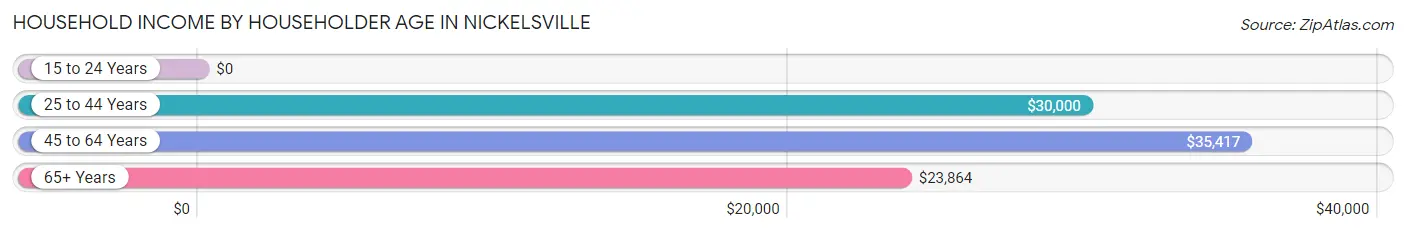
Household Income by Householder Age in Nickelsville
The median household income in Nickelsville is $30,000, with the highest median household income of $35,417 found in the 45 to 64 years age bracket for the primary householder. A total of 65 households (38.2%) fall into this category. Meanwhile, the 15 to 24 years age bracket for the primary householder has the lowest median household income of $0, with 9 households (5.3%) in this group.
| Income Bracket | # Households | Median Income |
| 15 to 24 Years | 9 (5.3%) | $0 |
| 25 to 44 Years | 36 (21.2%) | $30,000 |
| 45 to 64 Years | 65 (38.2%) | $35,417 |
| 65+ Years | 60 (35.3%) | $23,864 |
| Total | 170 (100.0%) | $30,000 |
Poverty in Nickelsville
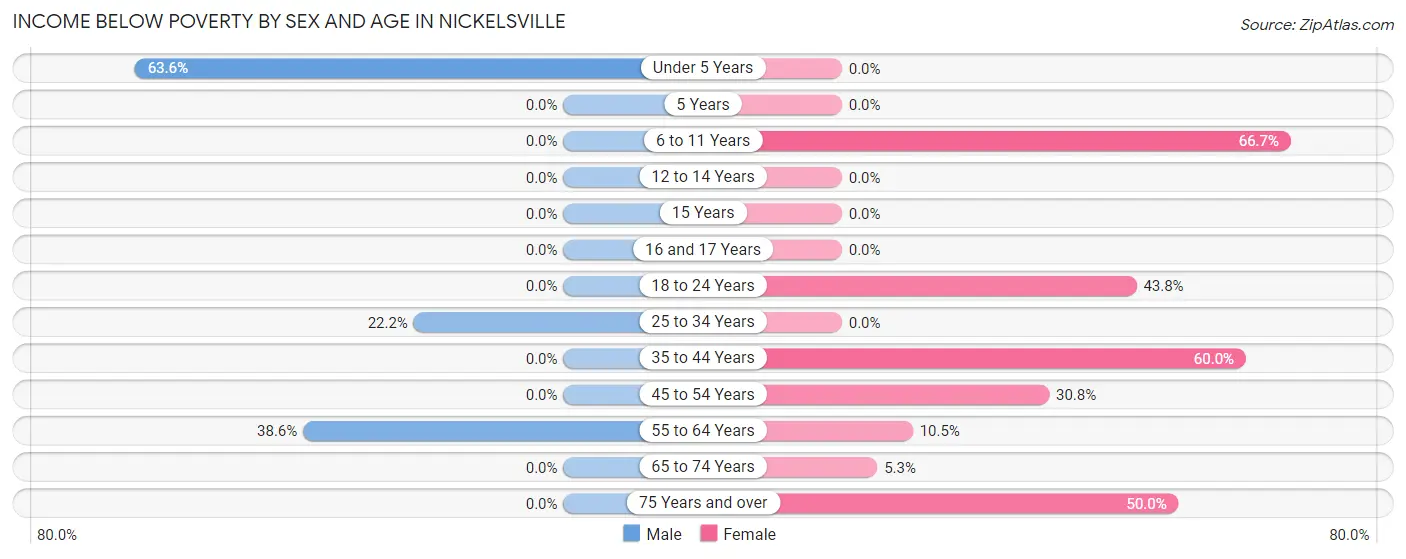
Income Below Poverty by Sex and Age in Nickelsville
With 16.2% poverty level for males and 28.6% for females among the residents of Nickelsville, under 5 year old males and 6 to 11 year old females are the most vulnerable to poverty, with 7 males (63.6%) and 2 females (66.7%) in their respective age groups living below the poverty level.
| Age Bracket | Male | Female |
| Under 5 Years | 7 (63.6%) | 0 (0.0%) |
| 5 Years | 0 (0.0%) | 0 (0.0%) |
| 6 to 11 Years | 0 (0.0%) | 2 (66.7%) |
| 12 to 14 Years | 0 (0.0%) | 0 (0.0%) |
| 15 Years | 0 (0.0%) | 0 (0.0%) |
| 16 and 17 Years | 0 (0.0%) | 0 (0.0%) |
| 18 to 24 Years | 0 (0.0%) | 14 (43.8%) |
| 25 to 34 Years | 2 (22.2%) | 0 (0.0%) |
| 35 to 44 Years | 0 (0.0%) | 12 (60.0%) |
| 45 to 54 Years | 0 (0.0%) | 4 (30.8%) |
| 55 to 64 Years | 17 (38.6%) | 4 (10.5%) |
| 65 to 74 Years | 0 (0.0%) | 1 (5.3%) |
| 75 Years and over | 0 (0.0%) | 20 (50.0%) |
| Total | 26 (16.2%) | 57 (28.6%) |
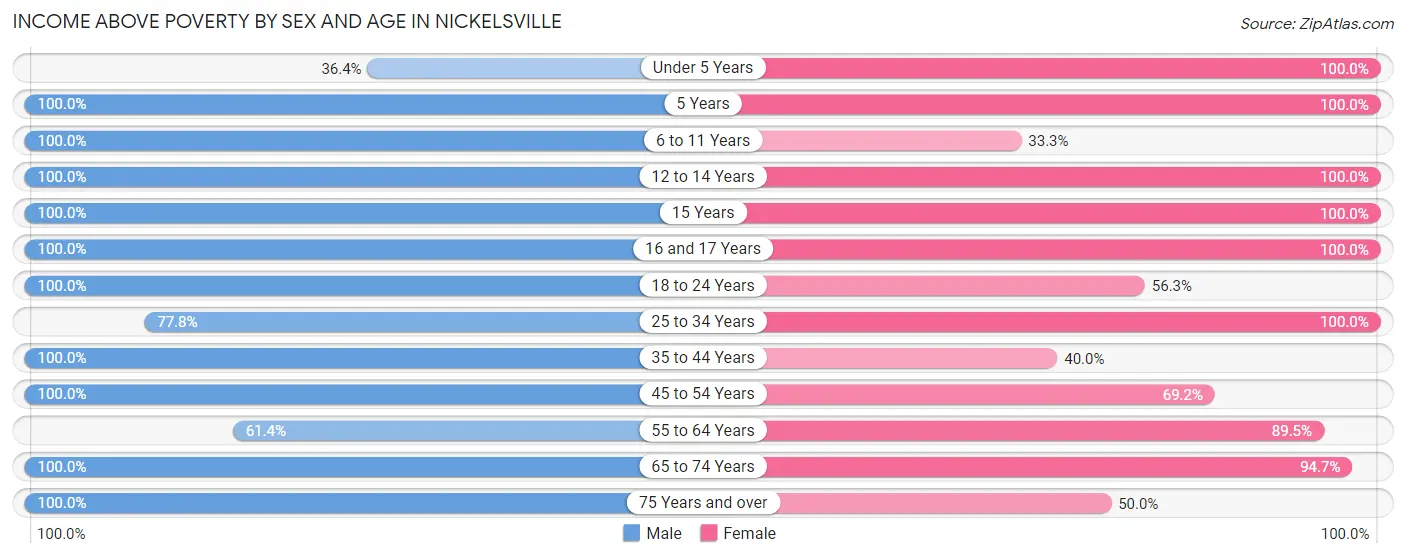
Income Above Poverty by Sex and Age in Nickelsville
According to the poverty statistics in Nickelsville, males aged 5 years and females aged under 5 years are the age groups that are most secure financially, with 100.0% of males and 100.0% of females in these age groups living above the poverty line.
| Age Bracket | Male | Female |
| Under 5 Years | 4 (36.4%) | 11 (100.0%) |
| 5 Years | 9 (100.0%) | 2 (100.0%) |
| 6 to 11 Years | 8 (100.0%) | 1 (33.3%) |
| 12 to 14 Years | 2 (100.0%) | 4 (100.0%) |
| 15 Years | 2 (100.0%) | 5 (100.0%) |
| 16 and 17 Years | 1 (100.0%) | 1 (100.0%) |
| 18 to 24 Years | 12 (100.0%) | 18 (56.2%) |
| 25 to 34 Years | 7 (77.8%) | 11 (100.0%) |
| 35 to 44 Years | 26 (100.0%) | 8 (40.0%) |
| 45 to 54 Years | 9 (100.0%) | 9 (69.2%) |
| 55 to 64 Years | 27 (61.4%) | 34 (89.5%) |
| 65 to 74 Years | 18 (100.0%) | 18 (94.7%) |
| 75 Years and over | 10 (100.0%) | 20 (50.0%) |
| Total | 135 (83.9%) | 142 (71.4%) |
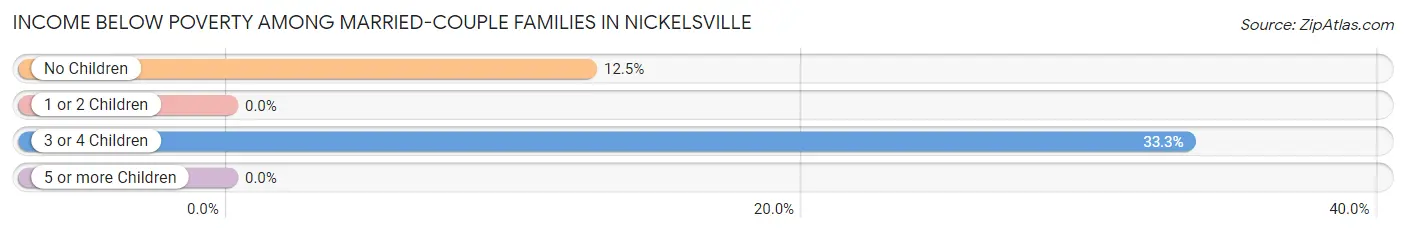
Income Below Poverty Among Married-Couple Families in Nickelsville
The poverty statistics for married-couple families in Nickelsville show that 12.0% or 6 of the total 50 families live below the poverty line. Families with 3 or 4 children have the highest poverty rate of 33.3%, comprising of 2 families. On the other hand, families with 1 or 2 children have the lowest poverty rate of 0.0%, which includes 0 families.
| Children | Above Poverty | Below Poverty |
| No Children | 28 (87.5%) | 4 (12.5%) |
| 1 or 2 Children | 12 (100.0%) | 0 (0.0%) |
| 3 or 4 Children | 4 (66.7%) | 2 (33.3%) |
| 5 or more Children | 0 (0.0%) | 0 (0.0%) |
| Total | 44 (88.0%) | 6 (12.0%) |
Income Below Poverty Among Single-Parent Households in Nickelsville
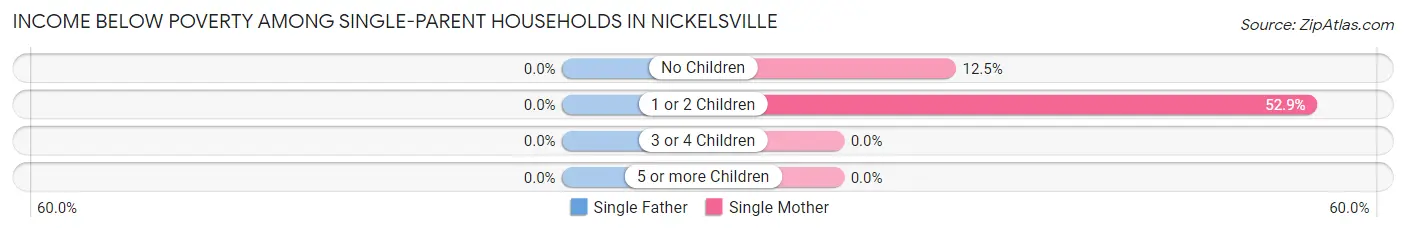
| Children | Single Father | Single Mother |
| No Children | 0 (0.0%) | 3 (12.5%) |
| 1 or 2 Children | 0 (0.0%) | 9 (52.9%) |
| 3 or 4 Children | 0 (0.0%) | 0 (0.0%) |
| 5 or more Children | 0 (0.0%) | 0 (0.0%) |
| Total | 0 (0.0%) | 12 (28.6%) |
Income Below Poverty Among Married-Couple vs Single-Parent Households in Nickelsville
The poverty data for Nickelsville shows that 6 of the married-couple family households (12.0%) and 12 of the single-parent households (27.9%) are living below the poverty level. Within the married-couple family households, those with 3 or 4 children have the highest poverty rate, with 2 households (33.3%) falling below the poverty line. Among the single-parent households, those with 1 or 2 children have the highest poverty rate, with 9 household (52.9%) living below poverty.
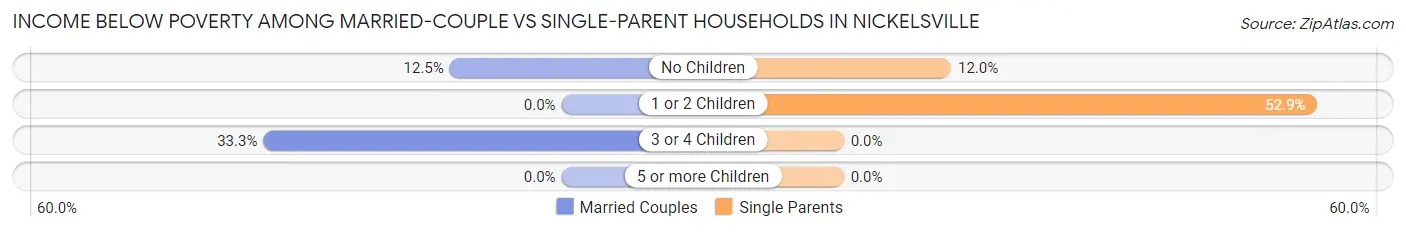
| Children | Married-Couple Families | Single-Parent Households |
| No Children | 4 (12.5%) | 3 (12.0%) |
| 1 or 2 Children | 0 (0.0%) | 9 (52.9%) |
| 3 or 4 Children | 2 (33.3%) | 0 (0.0%) |
| 5 or more Children | 0 (0.0%) | 0 (0.0%) |
| Total | 6 (12.0%) | 12 (27.9%) |
Race in Nickelsville
The most populous races in Nickelsville are White / Caucasian (345 | 95.8%), Hispanic or Latino (17 | 4.7%), and Two or more Races (15 | 4.2%).
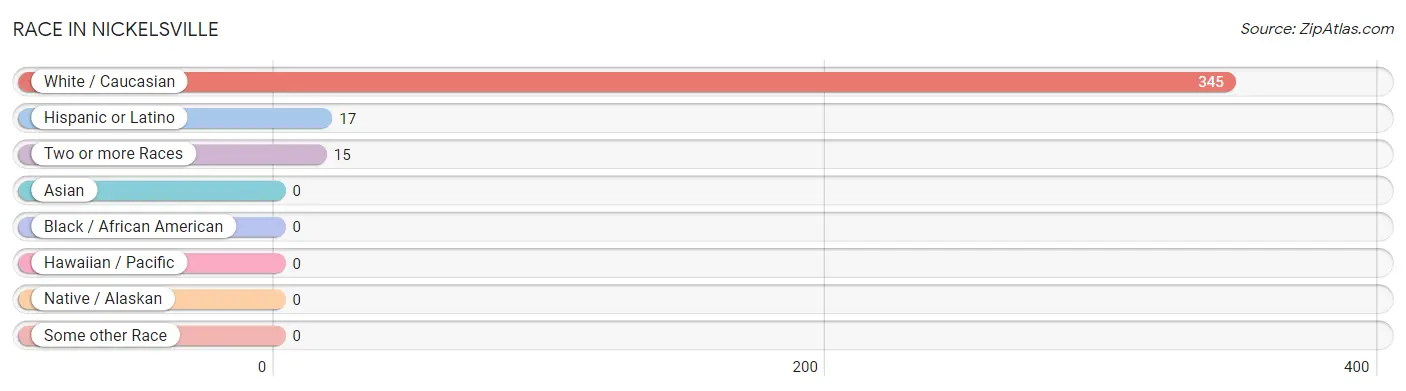
| Race | # Population | % Population |
| Asian | 0 | 0.0% |
| Black / African American | 0 | 0.0% |
| Hawaiian / Pacific | 0 | 0.0% |
| Hispanic or Latino | 17 | 4.7% |
| Native / Alaskan | 0 | 0.0% |
| White / Caucasian | 345 | 95.8% |
| Two or more Races | 15 | 4.2% |
| Some other Race | 0 | 0.0% |
| Total | 360 | 100.0% |
Ancestry in Nickelsville
The most populous ancestries reported in Nickelsville are American (207 | 57.5%), Irish (25 | 6.9%), Scotch-Irish (21 | 5.8%), English (17 | 4.7%), and Mexican (9 | 2.5%), together accounting for 77.5% of all Nickelsville residents.
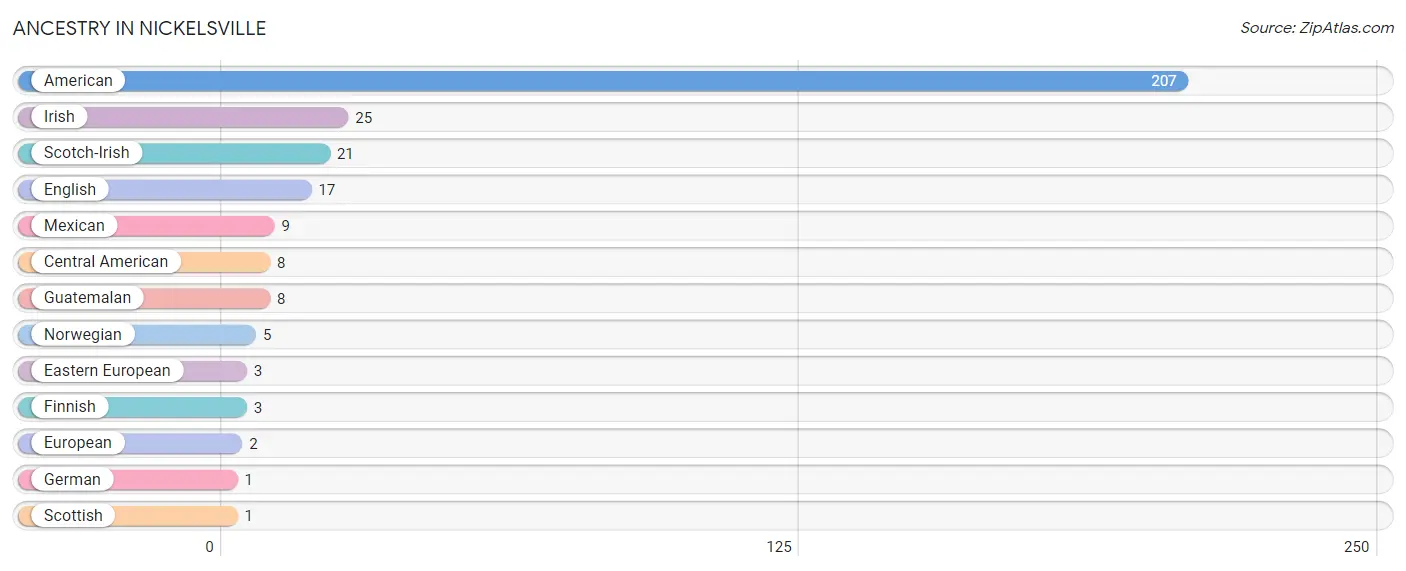
| Ancestry | # Population | % Population |
| American | 207 | 57.5% |
| Central American | 8 | 2.2% |
| Eastern European | 3 | 0.8% |
| English | 17 | 4.7% |
| European | 2 | 0.6% |
| Finnish | 3 | 0.8% |
| German | 1 | 0.3% |
| Guatemalan | 8 | 2.2% |
| Irish | 25 | 6.9% |
| Mexican | 9 | 2.5% |
| Norwegian | 5 | 1.4% |
| Scotch-Irish | 21 | 5.8% |
| Scottish | 1 | 0.3% | View All 13 Rows |
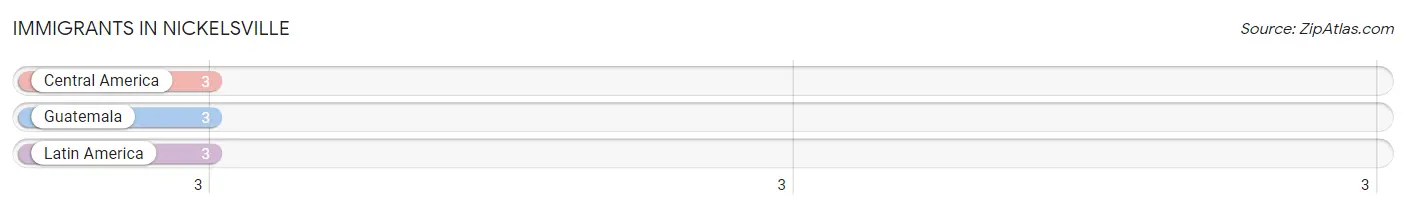
Immigrants in Nickelsville
The most numerous immigrant groups reported in Nickelsville came from Central America (3 | 0.8%), Guatemala (3 | 0.8%), and Latin America (3 | 0.8%), together accounting for 2.5% of all Nickelsville residents.
| Immigration Origin | # Population | % Population |
| Central America | 3 | 0.8% |
| Guatemala | 3 | 0.8% |
| Latin America | 3 | 0.8% | View All 3 Rows |
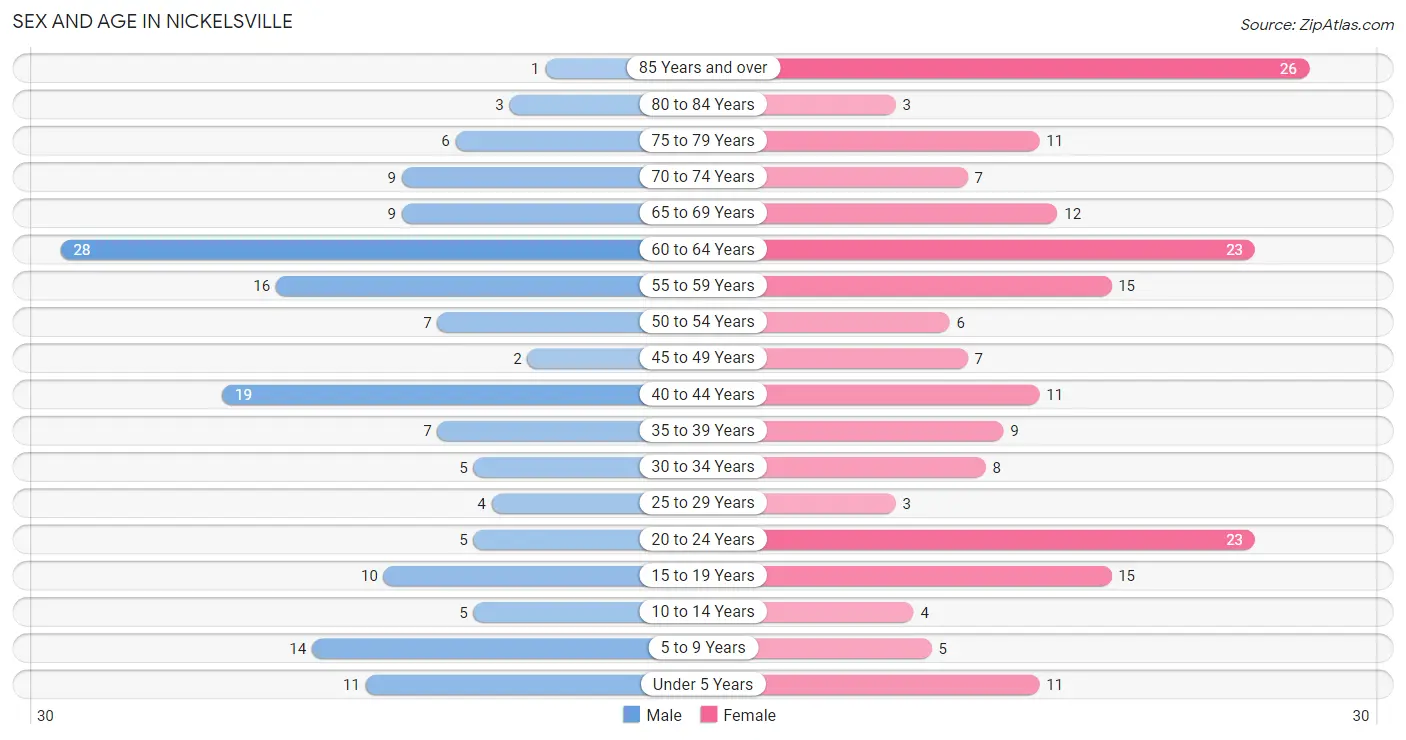
Sex and Age in Nickelsville
Sex and Age in Nickelsville
The most populous age groups in Nickelsville are 60 to 64 Years (28 | 17.4%) for men and 85 Years and over (26 | 13.1%) for women.
| Age Bracket | Male | Female |
| Under 5 Years | 11 (6.8%) | 11 (5.5%) |
| 5 to 9 Years | 14 (8.7%) | 5 (2.5%) |
| 10 to 14 Years | 5 (3.1%) | 4 (2.0%) |
| 15 to 19 Years | 10 (6.2%) | 15 (7.5%) |
| 20 to 24 Years | 5 (3.1%) | 23 (11.6%) |
| 25 to 29 Years | 4 (2.5%) | 3 (1.5%) |
| 30 to 34 Years | 5 (3.1%) | 8 (4.0%) |
| 35 to 39 Years | 7 (4.3%) | 9 (4.5%) |
| 40 to 44 Years | 19 (11.8%) | 11 (5.5%) |
| 45 to 49 Years | 2 (1.2%) | 7 (3.5%) |
| 50 to 54 Years | 7 (4.3%) | 6 (3.0%) |
| 55 to 59 Years | 16 (9.9%) | 15 (7.5%) |
| 60 to 64 Years | 28 (17.4%) | 23 (11.6%) |
| 65 to 69 Years | 9 (5.6%) | 12 (6.0%) |
| 70 to 74 Years | 9 (5.6%) | 7 (3.5%) |
| 75 to 79 Years | 6 (3.7%) | 11 (5.5%) |
| 80 to 84 Years | 3 (1.9%) | 3 (1.5%) |
| 85 Years and over | 1 (0.6%) | 26 (13.1%) |
| Total | 161 (100.0%) | 199 (100.0%) |
Families and Households in Nickelsville
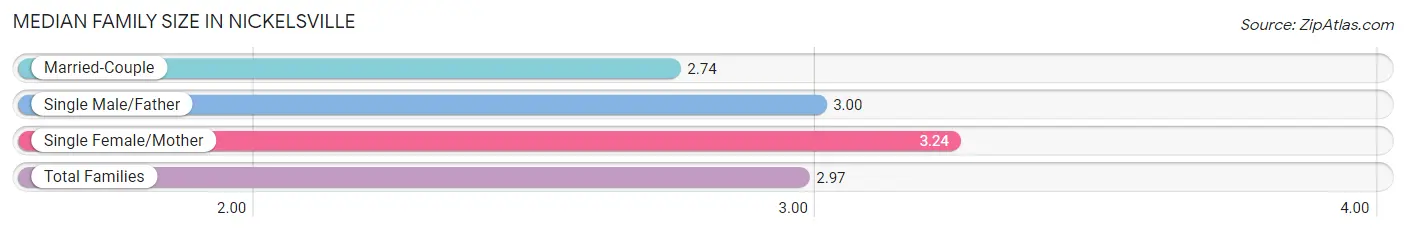
Median Family Size in Nickelsville
The median family size in Nickelsville is 2.97 persons per family, with single female/mother families (42 | 45.2%) accounting for the largest median family size of 3.24 persons per family. On the other hand, married-couple families (50 | 53.8%) represent the smallest median family size with 2.74 persons per family.
| Family Type | # Families | Family Size |
| Married-Couple | 50 (53.8%) | 2.74 |
| Single Male/Father | 1 (1.1%) | 3.00 |
| Single Female/Mother | 42 (45.2%) | 3.24 |
| Total Families | 93 (100.0%) | 2.97 |
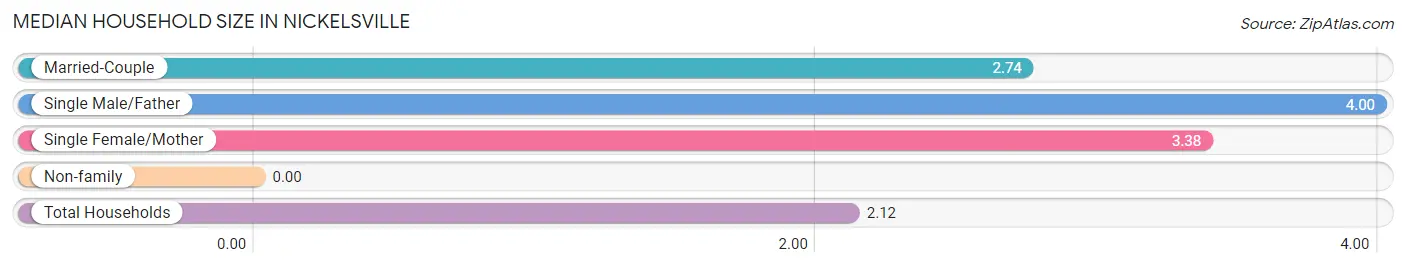
Median Household Size in Nickelsville
| Household Type | # Households | Household Size |
| Married-Couple | 50 (29.4%) | 2.74 |
| Single Male/Father | 1 (0.6%) | 4.00 |
| Single Female/Mother | 42 (24.7%) | 3.38 |
| Non-family | 77 (45.3%) | - |
| Total Households | 170 (100.0%) | 2.12 |
Household Size by Marriage Status in Nickelsville
Out of a total of 170 households in Nickelsville, 93 (54.7%) are family households, while 77 (45.3%) are nonfamily households. The most numerous type of family households are 2-person households, comprising 50, and the most common type of nonfamily households are 1-person households, comprising 77.
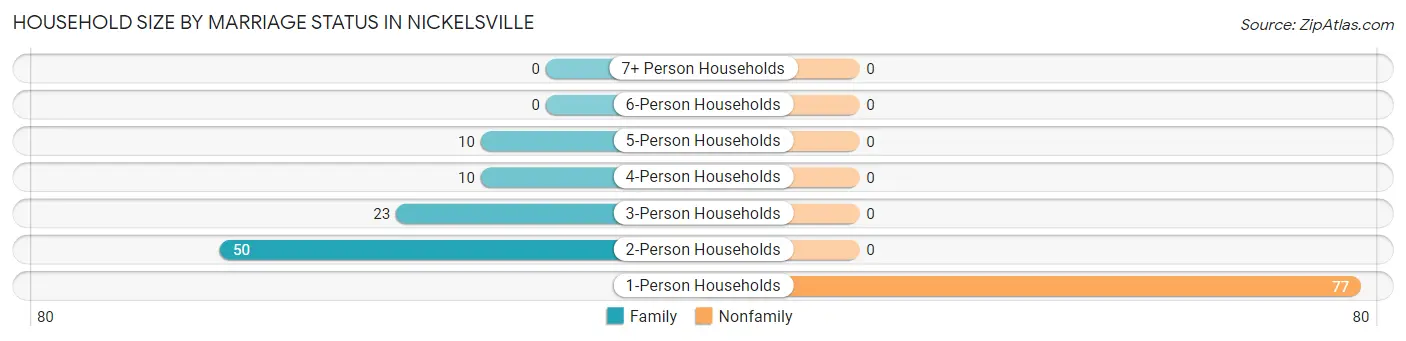
| Household Size | Family Households | Nonfamily Households |
| 1-Person Households | - | 77 (45.3%) |
| 2-Person Households | 50 (29.4%) | 0 (0.0%) |
| 3-Person Households | 23 (13.5%) | 0 (0.0%) |
| 4-Person Households | 10 (5.9%) | 0 (0.0%) |
| 5-Person Households | 10 (5.9%) | 0 (0.0%) |
| 6-Person Households | 0 (0.0%) | 0 (0.0%) |
| 7+ Person Households | 0 (0.0%) | 0 (0.0%) |
| Total | 93 (54.7%) | 77 (45.3%) |
Female Fertility in Nickelsville
Fertility by Age in Nickelsville
Average fertility rate in Nickelsville is 13.0 births per 1,000 women. Women in the age bracket of 20 to 34 years have the highest fertility rate with 29.0 births per 1,000 women. Women in the age bracket of 20 to 34 years acount for 100.0% of all women with births.
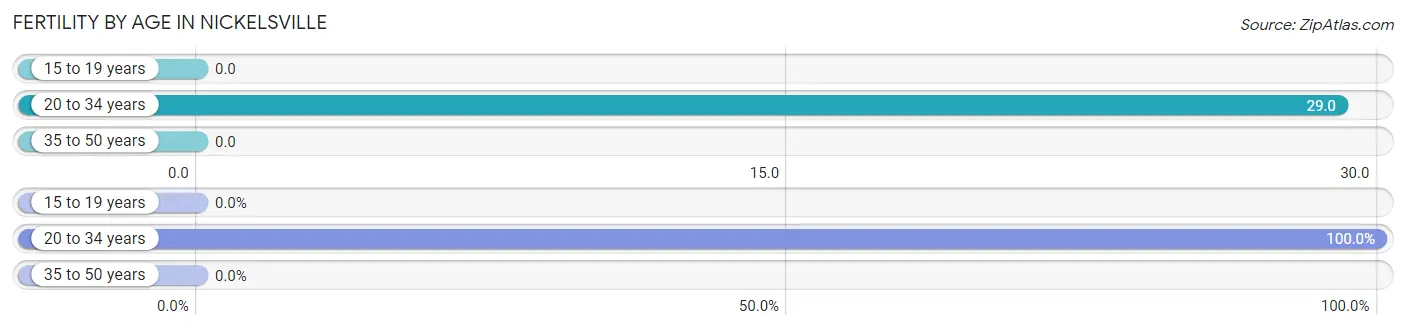
| Age Bracket | Women with Births | Births / 1,000 Women |
| 15 to 19 years | 0 (0.0%) | 0.0 |
| 20 to 34 years | 1 (100.0%) | 29.0 |
| 35 to 50 years | 0 (0.0%) | 0.0 |
| Total | 1 (100.0%) | 13.0 |
Fertility by Age by Marriage Status in Nickelsville
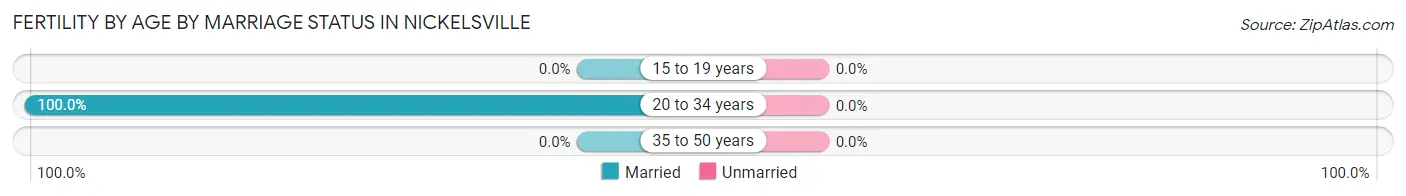
| Age Bracket | Married | Unmarried |
| 15 to 19 years | 0 (0.0%) | 0 (0.0%) |
| 20 to 34 years | 1 (100.0%) | 0 (0.0%) |
| 35 to 50 years | 0 (0.0%) | 0 (0.0%) |
| Total | 1 (100.0%) | 0 (0.0%) |
Fertility by Education in Nickelsville
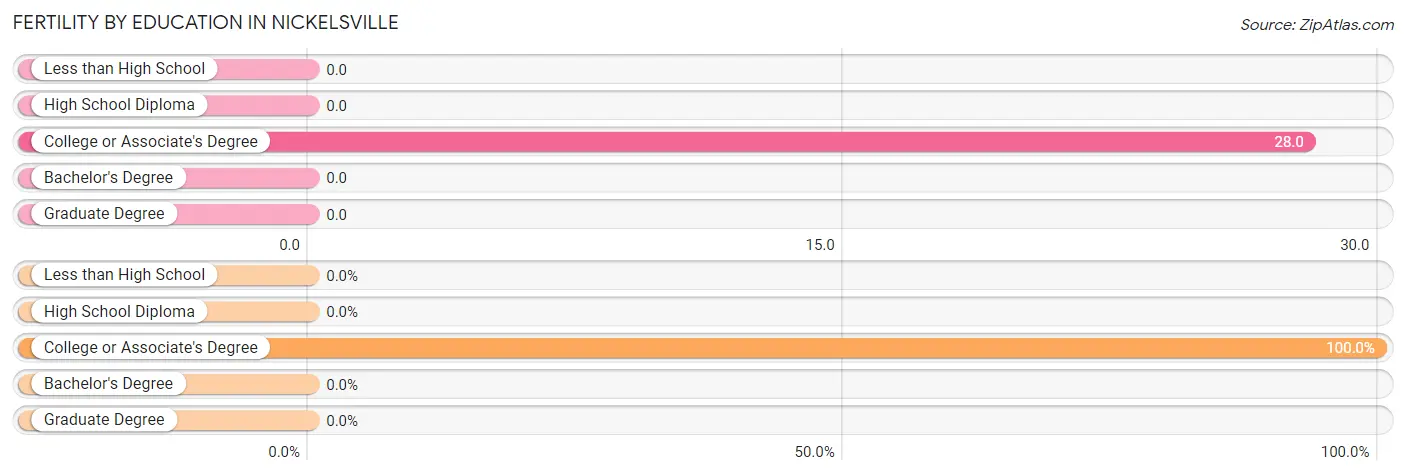
| Educational Attainment | Women with Births | Births / 1,000 Women |
| Less than High School | 0 (0.0%) | 0.0 |
| High School Diploma | 0 (0.0%) | 0.0 |
| College or Associate's Degree | 1 (100.0%) | 28.0 |
| Bachelor's Degree | 0 (0.0%) | 0.0 |
| Graduate Degree | 0 (0.0%) | 0.0 |
| Total | 1 (100.0%) | 13.0 |
Fertility by Education by Marriage Status in Nickelsville
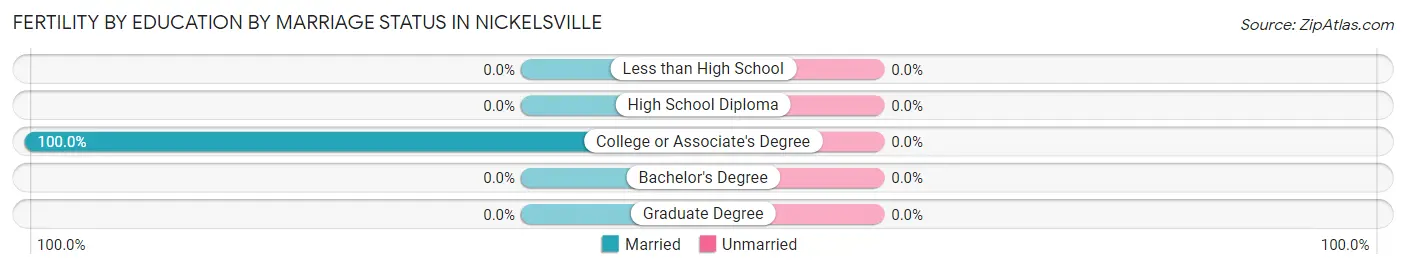
| Educational Attainment | Married | Unmarried |
| Less than High School | 0 (0.0%) | 0 (0.0%) |
| High School Diploma | 0 (0.0%) | 0 (0.0%) |
| College or Associate's Degree | 1 (100.0%) | 0 (0.0%) |
| Bachelor's Degree | 0 (0.0%) | 0 (0.0%) |
| Graduate Degree | 0 (0.0%) | 0 (0.0%) |
| Total | 1 (100.0%) | 0 (0.0%) |
Employment Characteristics in Nickelsville
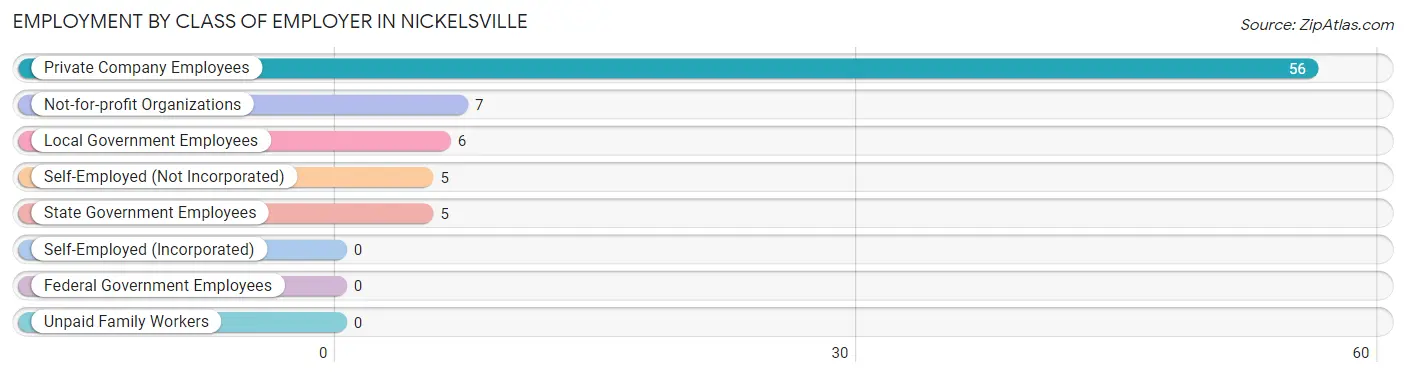
Employment by Class of Employer in Nickelsville
Among the 79 employed individuals in Nickelsville, private company employees (56 | 70.9%), not-for-profit organizations (7 | 8.9%), and local government employees (6 | 7.6%) make up the most common classes of employment.
| Employer Class | # Employees | % Employees |
| Private Company Employees | 56 | 70.9% |
| Self-Employed (Incorporated) | 0 | 0.0% |
| Self-Employed (Not Incorporated) | 5 | 6.3% |
| Not-for-profit Organizations | 7 | 8.9% |
| Local Government Employees | 6 | 7.6% |
| State Government Employees | 5 | 6.3% |
| Federal Government Employees | 0 | 0.0% |
| Unpaid Family Workers | 0 | 0.0% |
| Total | 79 | 100.0% |
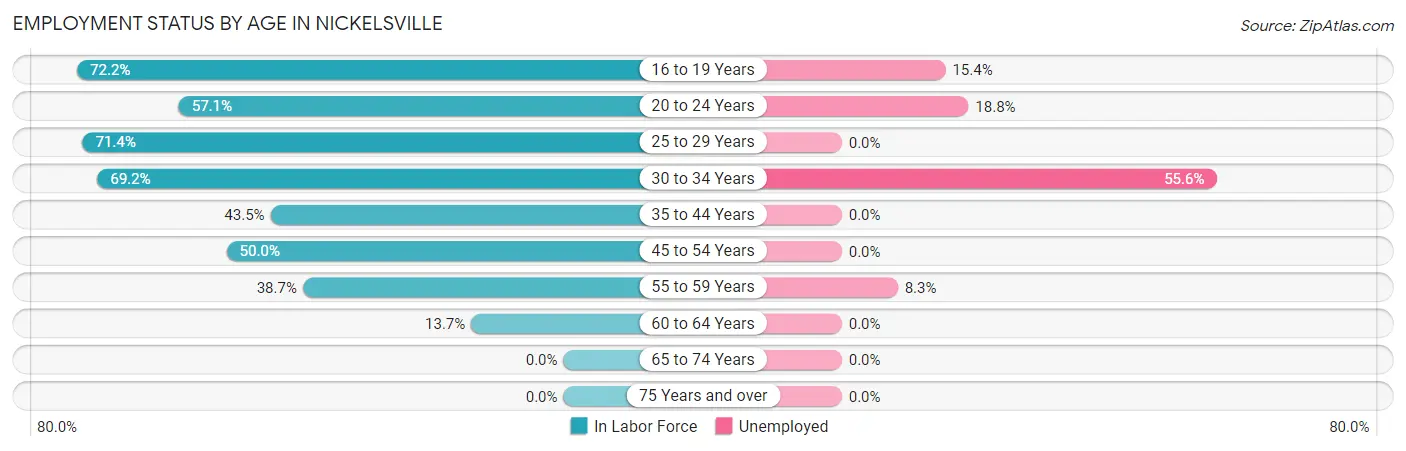
Employment Status by Age in Nickelsville
According to the labor force statistics for Nickelsville, out of the total population over 16 years of age (303), 30.7% or 93 individuals are in the labor force, with 11.8% or 11 of them unemployed. The age group with the highest labor force participation rate is 16 to 19 years, with 72.2% or 13 individuals in the labor force. Within the labor force, the 30 to 34 years age range has the highest percentage of unemployed individuals, with 55.6% or 5 of them being unemployed.
| Age Bracket | In Labor Force | Unemployed |
| 16 to 19 Years | 13 (72.2%) | 2 (15.4%) |
| 20 to 24 Years | 16 (57.1%) | 3 (18.8%) |
| 25 to 29 Years | 5 (71.4%) | 0 (0.0%) |
| 30 to 34 Years | 9 (69.2%) | 5 (55.6%) |
| 35 to 44 Years | 20 (43.5%) | 0 (0.0%) |
| 45 to 54 Years | 11 (50.0%) | 0 (0.0%) |
| 55 to 59 Years | 12 (38.7%) | 1 (8.3%) |
| 60 to 64 Years | 7 (13.7%) | 0 (0.0%) |
| 65 to 74 Years | 0 (0.0%) | 0 (0.0%) |
| 75 Years and over | 0 (0.0%) | 0 (0.0%) |
| Total | 93 (30.7%) | 11 (11.8%) |
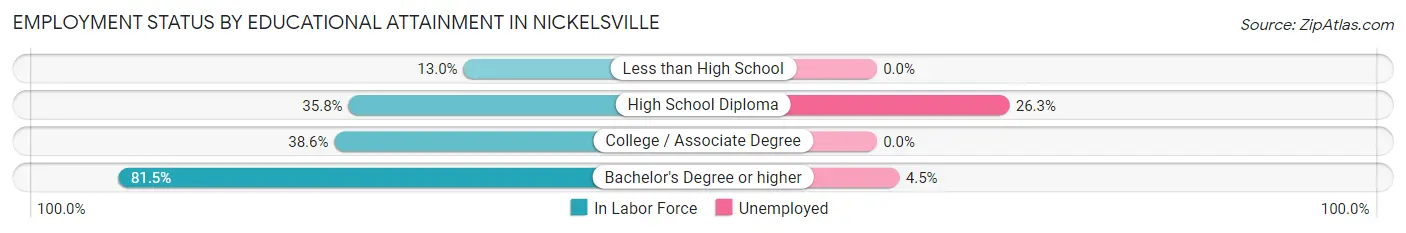
Employment Status by Educational Attainment in Nickelsville
According to labor force statistics for Nickelsville, 37.6% of individuals (64) out of the total population between 25 and 64 years of age (170) are in the labor force, with 9.4% or 6 of them being unemployed. The group with the highest labor force participation rate are those with the educational attainment of bachelor's degree or higher, with 81.5% or 22 individuals in the labor force. Within the labor force, individuals with high school diploma education have the highest percentage of unemployment, with 26.3% or 5 of them being unemployed.
| Educational Attainment | In Labor Force | Unemployed |
| Less than High School | 6 (13.0%) | 0 (0.0%) |
| High School Diploma | 19 (35.8%) | 14 (26.3%) |
| College / Associate Degree | 17 (38.6%) | 0 (0.0%) |
| Bachelor's Degree or higher | 22 (81.5%) | 1 (4.5%) |
| Total | 64 (37.6%) | 16 (9.4%) |
Employment Occupations by Sex in Nickelsville
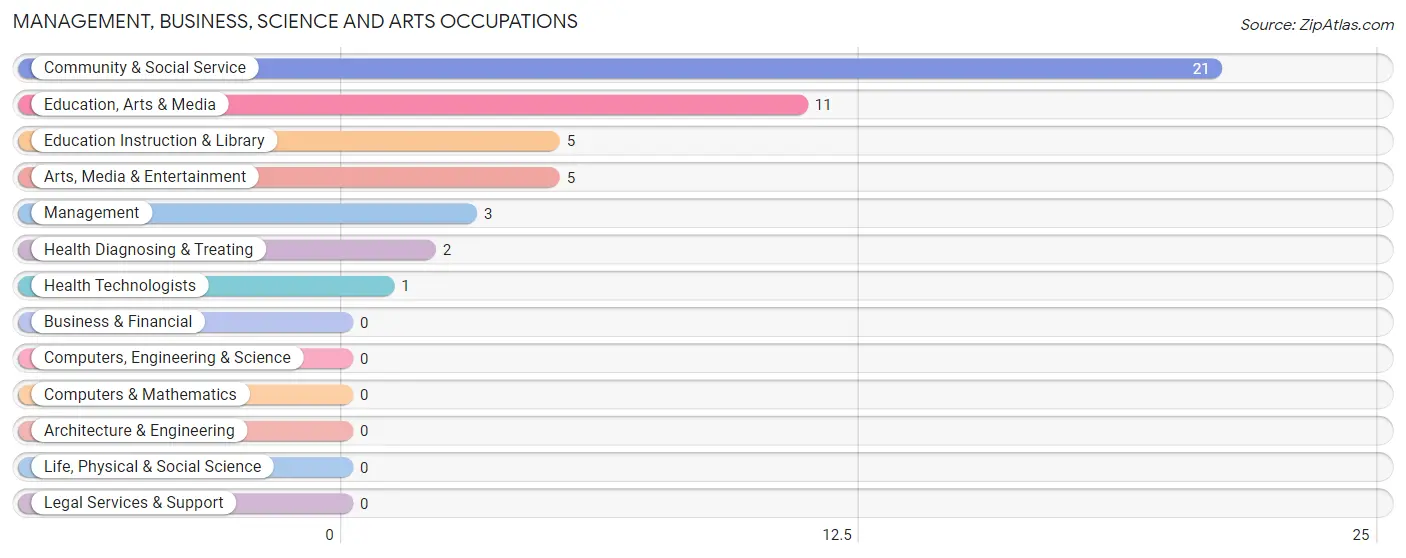
Management, Business, Science and Arts Occupations
The most common Management, Business, Science and Arts occupations in Nickelsville are Community & Social Service (21 | 25.6%), Education, Arts & Media (11 | 13.4%), Education Instruction & Library (5 | 6.1%), Arts, Media & Entertainment (5 | 6.1%), and Management (3 | 3.7%).
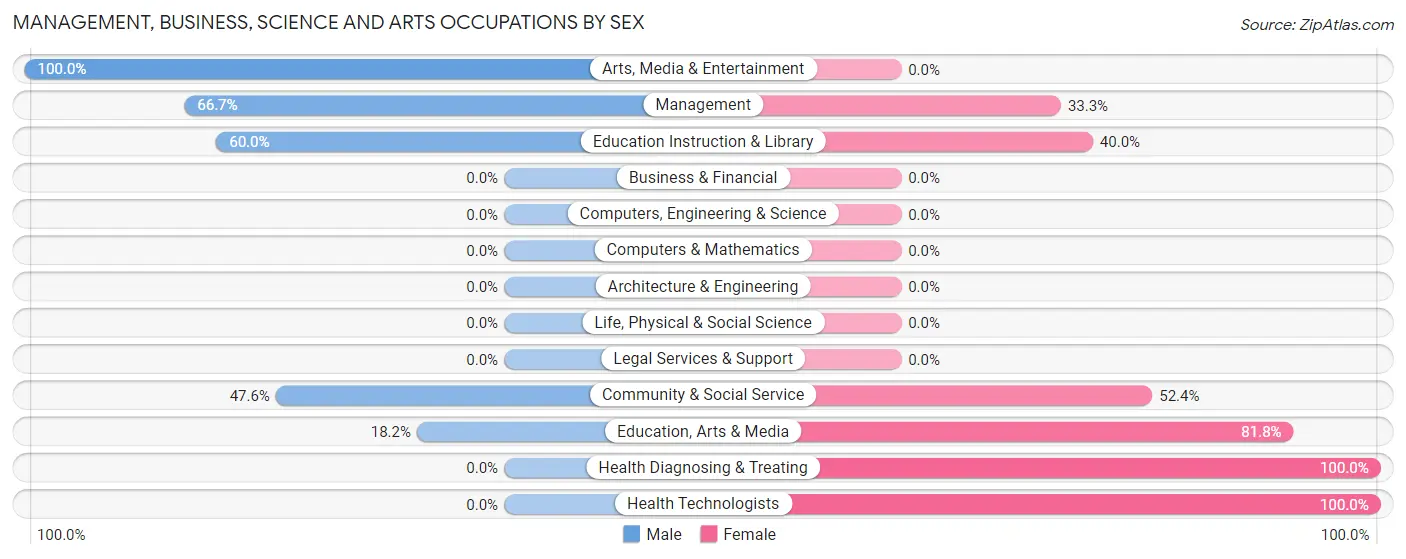
Management, Business, Science and Arts Occupations by Sex
Within the Management, Business, Science and Arts occupations in Nickelsville, the most male-oriented occupations are Arts, Media & Entertainment (100.0%), Management (66.7%), and Education Instruction & Library (60.0%), while the most female-oriented occupations are Health Diagnosing & Treating (100.0%), Health Technologists (100.0%), and Education, Arts & Media (81.8%).
| Occupation | Male | Female |
| Management | 2 (66.7%) | 1 (33.3%) |
| Business & Financial | 0 (0.0%) | 0 (0.0%) |
| Computers, Engineering & Science | 0 (0.0%) | 0 (0.0%) |
| Computers & Mathematics | 0 (0.0%) | 0 (0.0%) |
| Architecture & Engineering | 0 (0.0%) | 0 (0.0%) |
| Life, Physical & Social Science | 0 (0.0%) | 0 (0.0%) |
| Community & Social Service | 10 (47.6%) | 11 (52.4%) |
| Education, Arts & Media | 2 (18.2%) | 9 (81.8%) |
| Legal Services & Support | 0 (0.0%) | 0 (0.0%) |
| Education Instruction & Library | 3 (60.0%) | 2 (40.0%) |
| Arts, Media & Entertainment | 5 (100.0%) | 0 (0.0%) |
| Health Diagnosing & Treating | 0 (0.0%) | 2 (100.0%) |
| Health Technologists | 0 (0.0%) | 1 (100.0%) |
| Total (Category) | 12 (46.2%) | 14 (53.8%) |
| Total (Overall) | 30 (36.6%) | 52 (63.4%) |
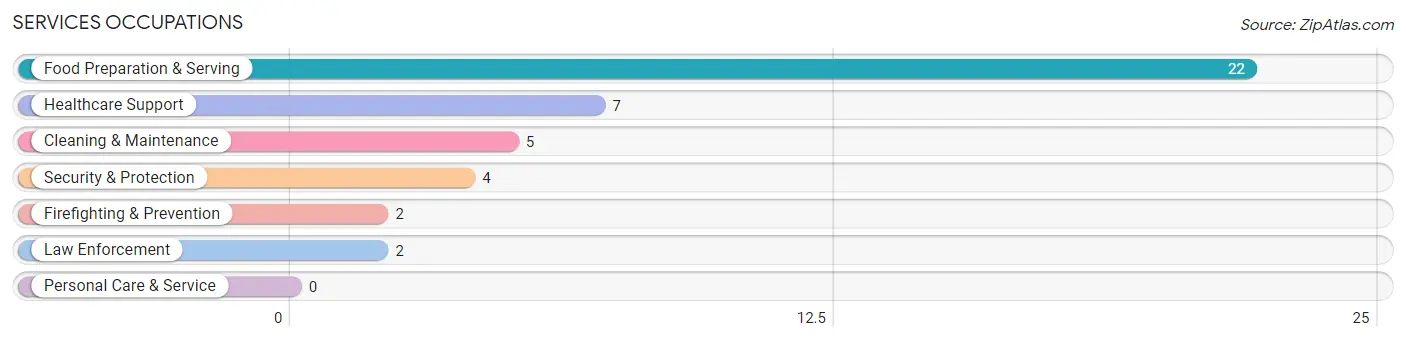
Services Occupations
The most common Services occupations in Nickelsville are Food Preparation & Serving (22 | 26.8%), Healthcare Support (7 | 8.5%), Cleaning & Maintenance (5 | 6.1%), Security & Protection (4 | 4.9%), and Firefighting & Prevention (2 | 2.4%).
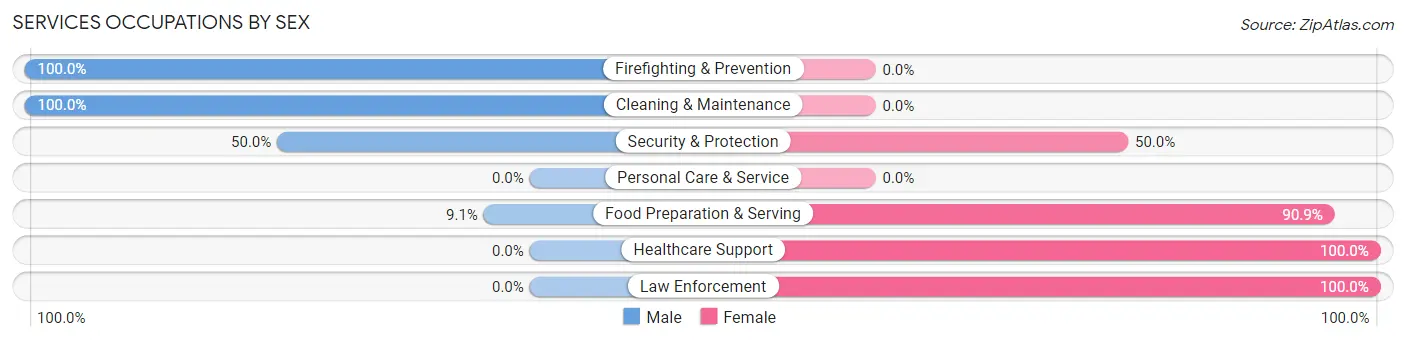
Services Occupations by Sex
Within the Services occupations in Nickelsville, the most male-oriented occupations are Firefighting & Prevention (100.0%), Cleaning & Maintenance (100.0%), and Security & Protection (50.0%), while the most female-oriented occupations are Healthcare Support (100.0%), Law Enforcement (100.0%), and Food Preparation & Serving (90.9%).
| Occupation | Male | Female |
| Healthcare Support | 0 (0.0%) | 7 (100.0%) |
| Security & Protection | 2 (50.0%) | 2 (50.0%) |
| Firefighting & Prevention | 2 (100.0%) | 0 (0.0%) |
| Law Enforcement | 0 (0.0%) | 2 (100.0%) |
| Food Preparation & Serving | 2 (9.1%) | 20 (90.9%) |
| Cleaning & Maintenance | 5 (100.0%) | 0 (0.0%) |
| Personal Care & Service | 0 (0.0%) | 0 (0.0%) |
| Total (Category) | 9 (23.7%) | 29 (76.3%) |
| Total (Overall) | 30 (36.6%) | 52 (63.4%) |
Sales and Office Occupations
The most common Sales and Office occupations in Nickelsville are Office & Administration (5 | 6.1%), and Sales & Related (4 | 4.9%).
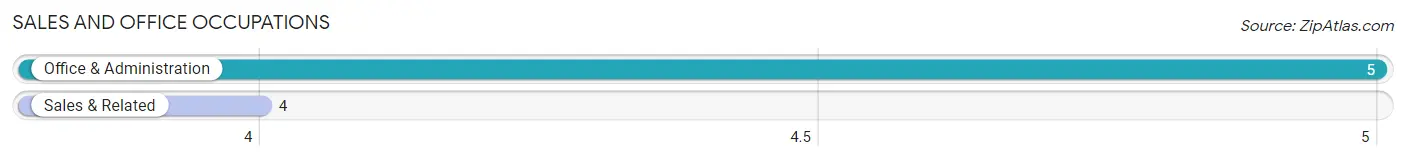
Sales and Office Occupations by Sex
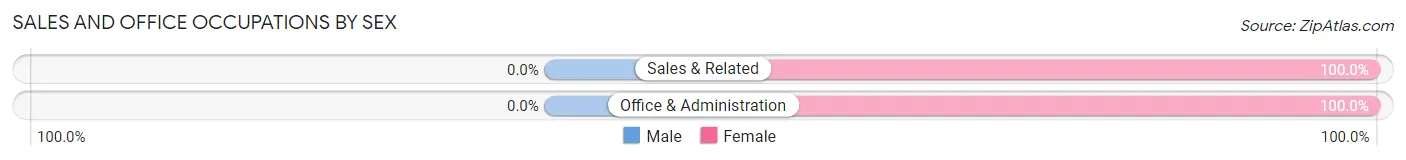
| Occupation | Male | Female |
| Sales & Related | 0 (0.0%) | 4 (100.0%) |
| Office & Administration | 0 (0.0%) | 5 (100.0%) |
| Total (Category) | 0 (0.0%) | 9 (100.0%) |
| Total (Overall) | 30 (36.6%) | 52 (63.4%) |
Natural Resources, Construction and Maintenance Occupations
The most common Natural Resources, Construction and Maintenance occupations in Nickelsville are Construction & Extraction (7 | 8.5%), and Installation, Maintenance & Repair (1 | 1.2%).
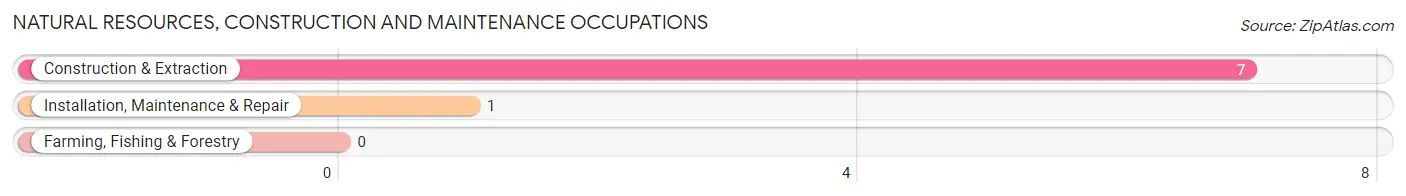
Natural Resources, Construction and Maintenance Occupations by Sex
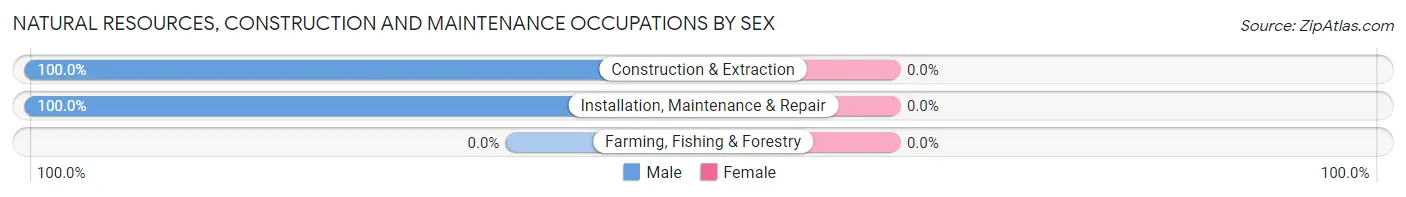
| Occupation | Male | Female |
| Farming, Fishing & Forestry | 0 (0.0%) | 0 (0.0%) |
| Construction & Extraction | 7 (100.0%) | 0 (0.0%) |
| Installation, Maintenance & Repair | 1 (100.0%) | 0 (0.0%) |
| Total (Category) | 8 (100.0%) | 0 (0.0%) |
| Total (Overall) | 30 (36.6%) | 52 (63.4%) |
Production, Transportation and Moving Occupations
The most common Production, Transportation and Moving occupations in Nickelsville are , and Material Moving (1 | 1.2%).
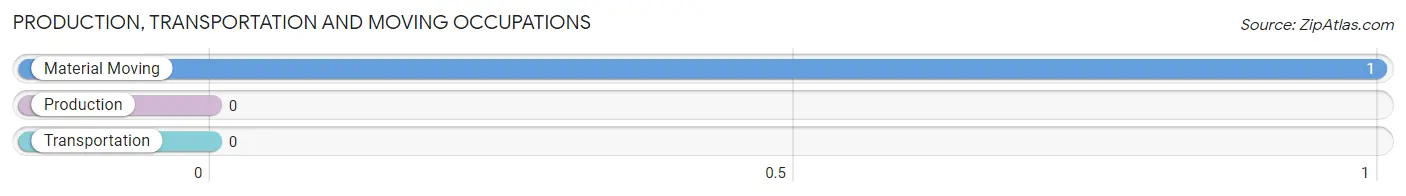
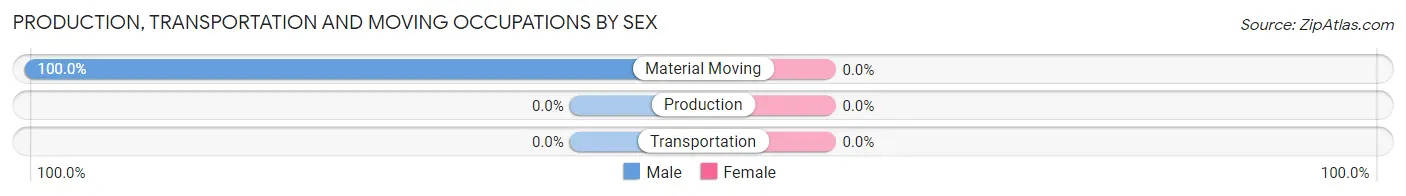
Production, Transportation and Moving Occupations by Sex
| Occupation | Male | Female |
| Production | 0 (0.0%) | 0 (0.0%) |
| Transportation | 0 (0.0%) | 0 (0.0%) |
| Material Moving | 1 (100.0%) | 0 (0.0%) |
| Total (Category) | 1 (100.0%) | 0 (0.0%) |
| Total (Overall) | 30 (36.6%) | 52 (63.4%) |
Employment Industries by Sex in Nickelsville
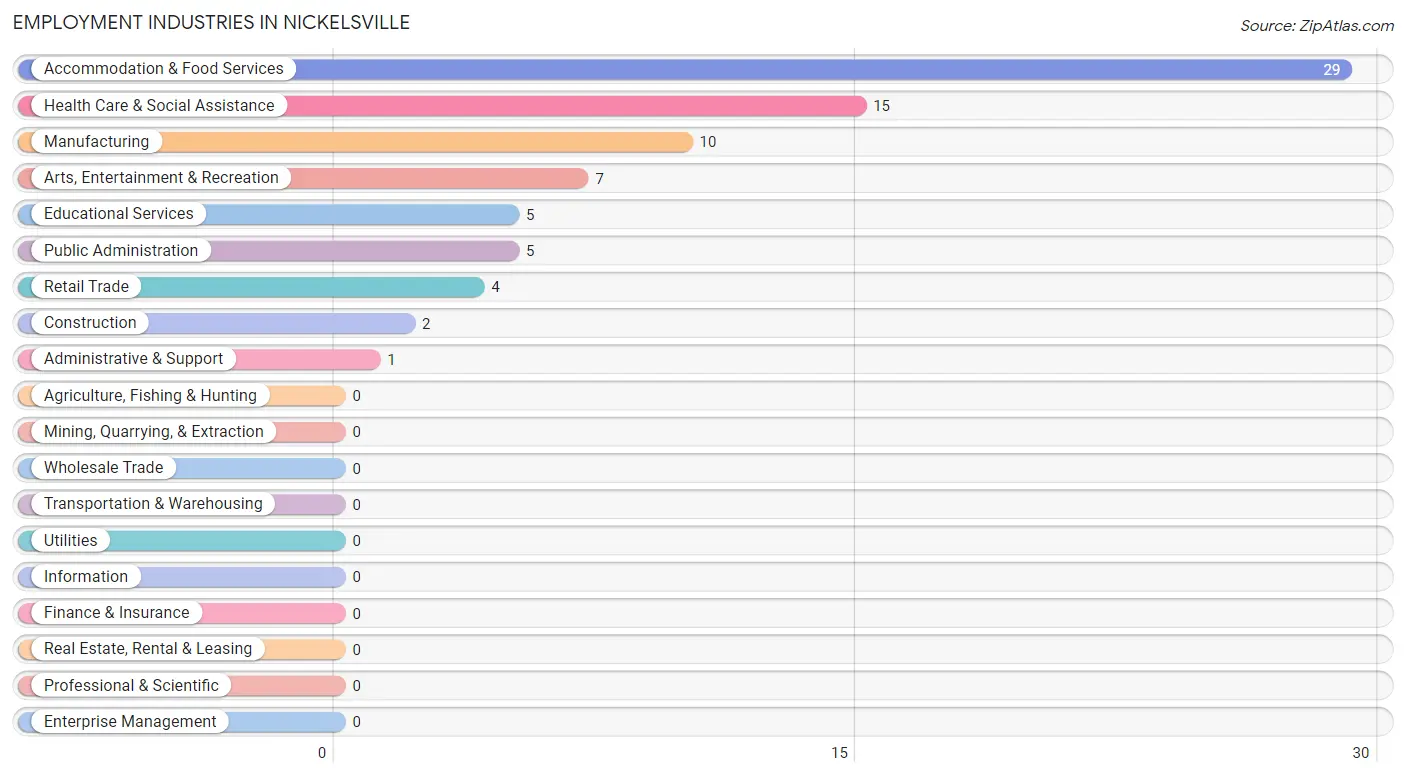
Employment Industries in Nickelsville
The major employment industries in Nickelsville include Accommodation & Food Services (29 | 35.4%), Health Care & Social Assistance (15 | 18.3%), Manufacturing (10 | 12.2%), Arts, Entertainment & Recreation (7 | 8.5%), and Educational Services (5 | 6.1%).
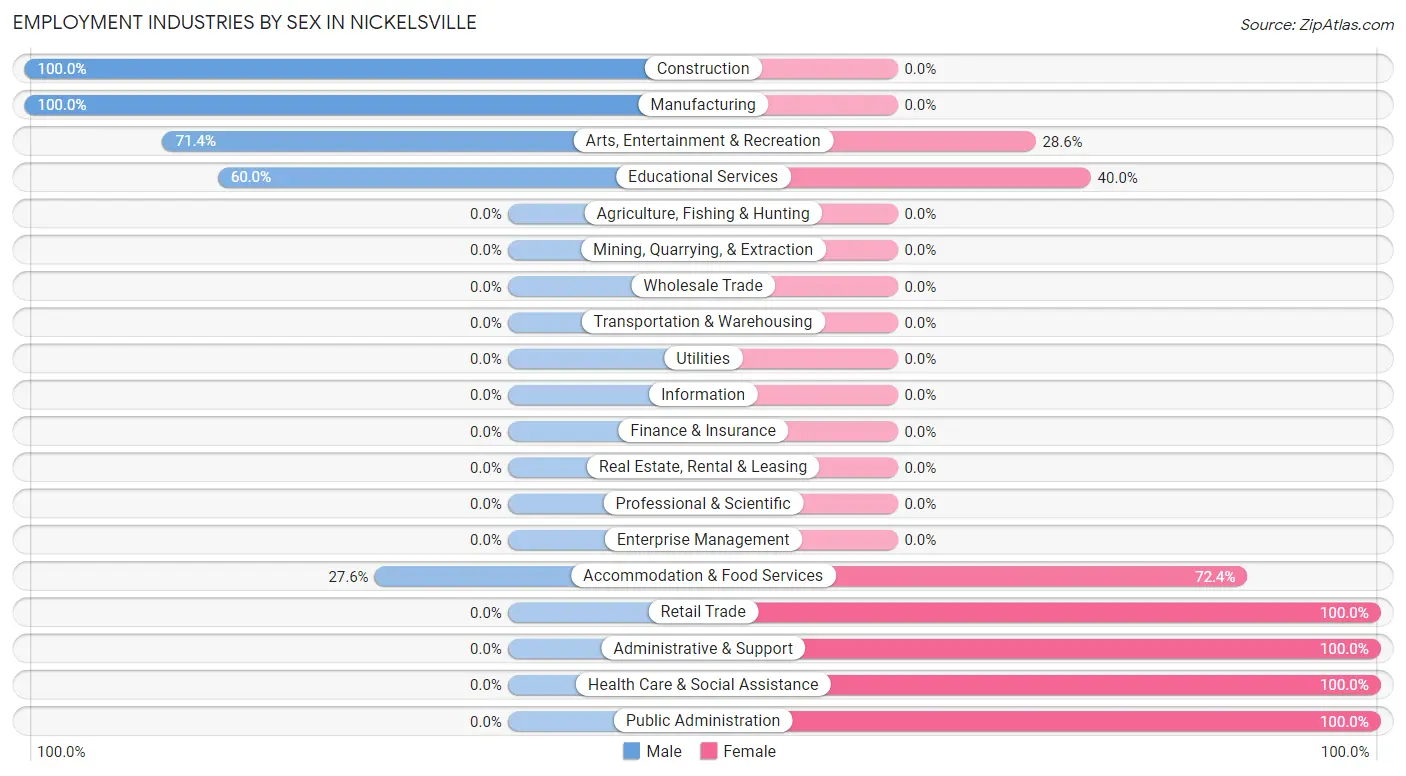
Employment Industries by Sex in Nickelsville
The Nickelsville industries that see more men than women are Construction (100.0%), Manufacturing (100.0%), and Arts, Entertainment & Recreation (71.4%), whereas the industries that tend to have a higher number of women are Retail Trade (100.0%), Administrative & Support (100.0%), and Health Care & Social Assistance (100.0%).
| Industry | Male | Female |
| Agriculture, Fishing & Hunting | 0 (0.0%) | 0 (0.0%) |
| Mining, Quarrying, & Extraction | 0 (0.0%) | 0 (0.0%) |
| Construction | 2 (100.0%) | 0 (0.0%) |
| Manufacturing | 10 (100.0%) | 0 (0.0%) |
| Wholesale Trade | 0 (0.0%) | 0 (0.0%) |
| Retail Trade | 0 (0.0%) | 4 (100.0%) |
| Transportation & Warehousing | 0 (0.0%) | 0 (0.0%) |
| Utilities | 0 (0.0%) | 0 (0.0%) |
| Information | 0 (0.0%) | 0 (0.0%) |
| Finance & Insurance | 0 (0.0%) | 0 (0.0%) |
| Real Estate, Rental & Leasing | 0 (0.0%) | 0 (0.0%) |
| Professional & Scientific | 0 (0.0%) | 0 (0.0%) |
| Enterprise Management | 0 (0.0%) | 0 (0.0%) |
| Administrative & Support | 0 (0.0%) | 1 (100.0%) |
| Educational Services | 3 (60.0%) | 2 (40.0%) |
| Health Care & Social Assistance | 0 (0.0%) | 15 (100.0%) |
| Arts, Entertainment & Recreation | 5 (71.4%) | 2 (28.6%) |
| Accommodation & Food Services | 8 (27.6%) | 21 (72.4%) |
| Public Administration | 0 (0.0%) | 5 (100.0%) |
| Total | 30 (36.6%) | 52 (63.4%) |
Education in Nickelsville
School Enrollment in Nickelsville
The most common levels of schooling among the 45 students in Nickelsville are high school (12 | 26.7%), nursery / preschool (11 | 24.4%), and elementary school (7 | 15.6%).
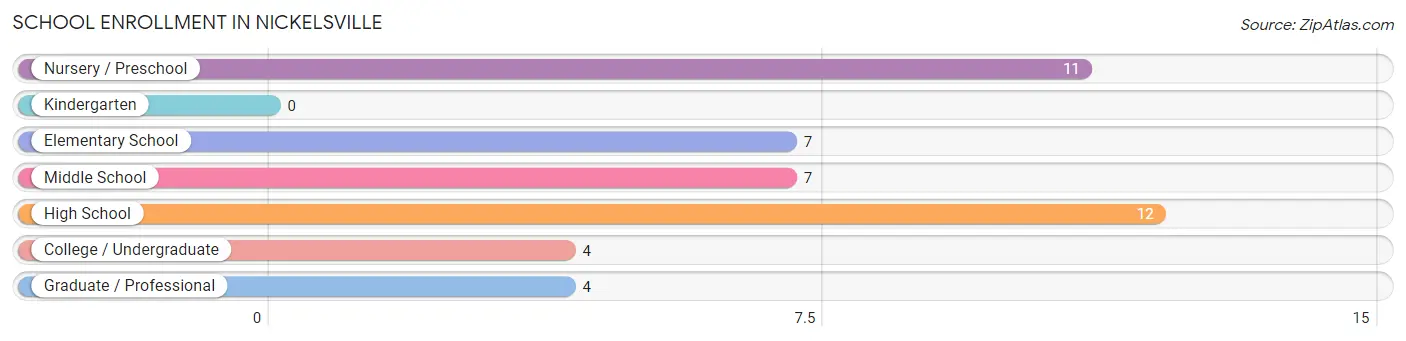
| School Level | # Students | % Students |
| Nursery / Preschool | 11 | 24.4% |
| Kindergarten | 0 | 0.0% |
| Elementary School | 7 | 15.6% |
| Middle School | 7 | 15.6% |
| High School | 12 | 26.7% |
| College / Undergraduate | 4 | 8.9% |
| Graduate / Professional | 4 | 8.9% |
| Total | 45 | 100.0% |
School Enrollment by Age by Funding Source in Nickelsville
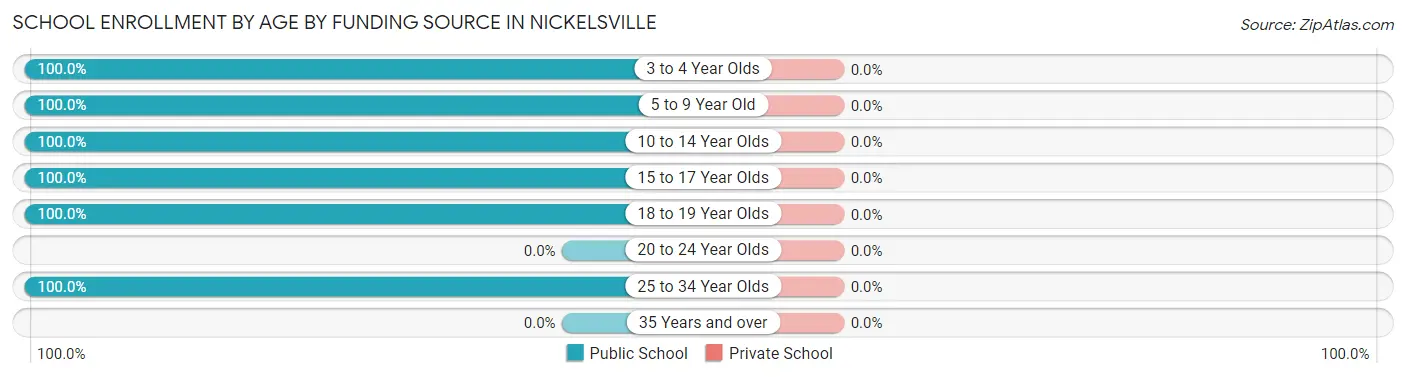
| Age Bracket | Public School | Private School |
| 3 to 4 Year Olds | 2 (100.0%) | 0 (0.0%) |
| 5 to 9 Year Old | 16 (100.0%) | 0 (0.0%) |
| 10 to 14 Year Olds | 9 (100.0%) | 0 (0.0%) |
| 15 to 17 Year Olds | 9 (100.0%) | 0 (0.0%) |
| 18 to 19 Year Olds | 5 (100.0%) | 0 (0.0%) |
| 20 to 24 Year Olds | 0 (0.0%) | 0 (0.0%) |
| 25 to 34 Year Olds | 4 (100.0%) | 0 (0.0%) |
| 35 Years and over | 0 (0.0%) | 0 (0.0%) |
| Total | 45 (100.0%) | 0 (0.0%) |
Educational Attainment by Field of Study in Nickelsville
Business (8 | 25.8%), computers & mathematics (5 | 16.1%), education (5 | 16.1%), psychology (4 | 12.9%), and arts & humanities (3 | 9.7%) are the most common fields of study among 31 individuals in Nickelsville who have obtained a bachelor's degree or higher.
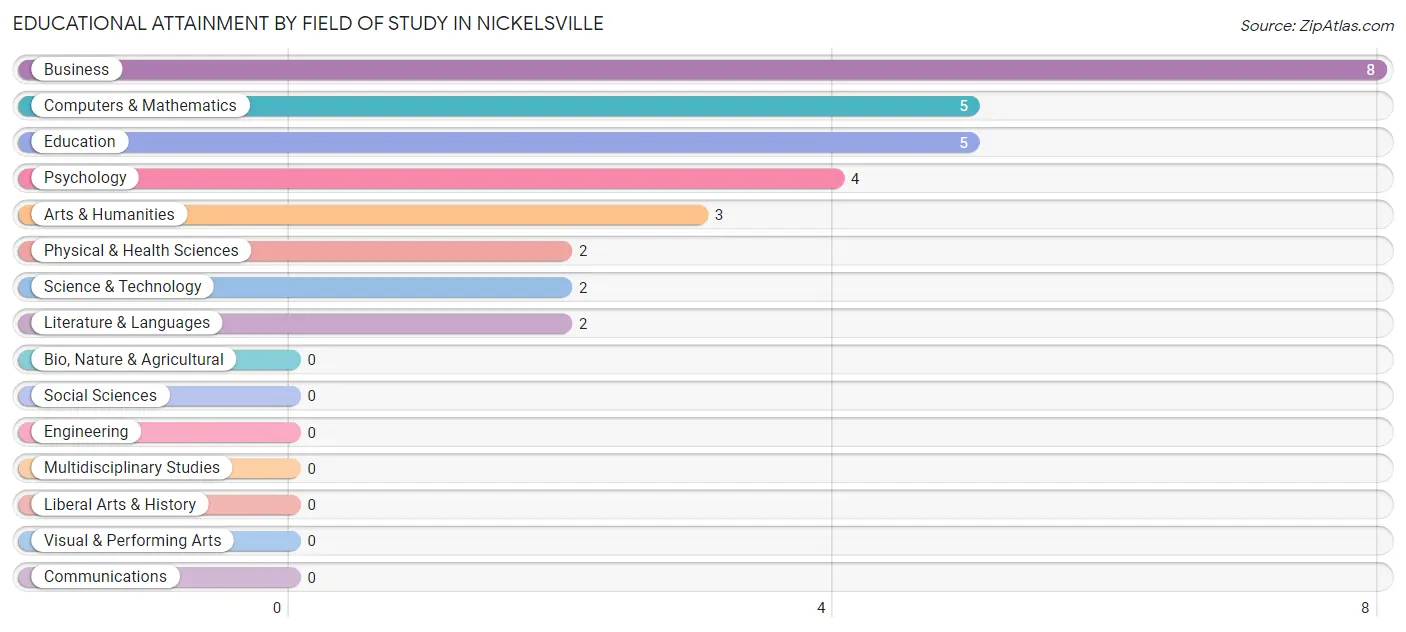
| Field of Study | # Graduates | % Graduates |
| Computers & Mathematics | 5 | 16.1% |
| Bio, Nature & Agricultural | 0 | 0.0% |
| Physical & Health Sciences | 2 | 6.5% |
| Psychology | 4 | 12.9% |
| Social Sciences | 0 | 0.0% |
| Engineering | 0 | 0.0% |
| Multidisciplinary Studies | 0 | 0.0% |
| Science & Technology | 2 | 6.5% |
| Business | 8 | 25.8% |
| Education | 5 | 16.1% |
| Literature & Languages | 2 | 6.5% |
| Liberal Arts & History | 0 | 0.0% |
| Visual & Performing Arts | 0 | 0.0% |
| Communications | 0 | 0.0% |
| Arts & Humanities | 3 | 9.7% |
| Total | 31 | 100.0% |
Transportation & Commute in Nickelsville
Vehicle Availability by Sex in Nickelsville
The most prevalent vehicle ownership categories in Nickelsville are males with 2 vehicles (11, accounting for 36.7%) and females with 2 vehicles (12, making up 22.5%).
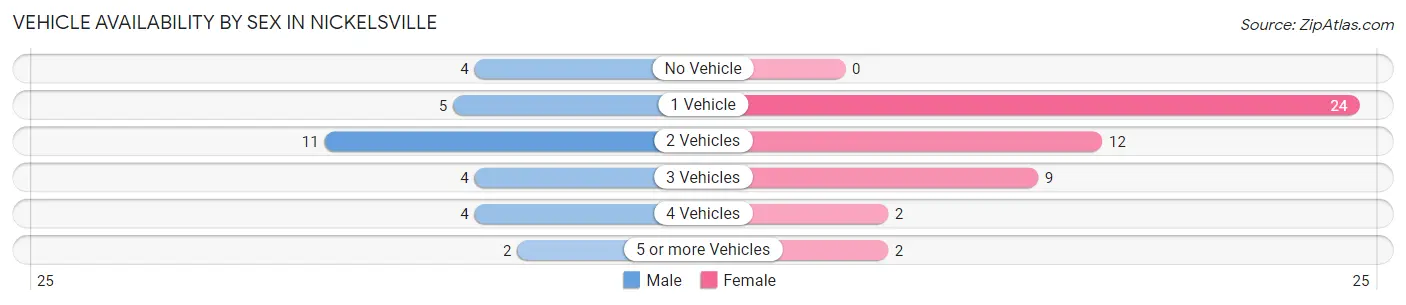
| Vehicles Available | Male | Female |
| No Vehicle | 4 (13.3%) | 0 (0.0%) |
| 1 Vehicle | 5 (16.7%) | 24 (49.0%) |
| 2 Vehicles | 11 (36.7%) | 12 (24.5%) |
| 3 Vehicles | 4 (13.3%) | 9 (18.4%) |
| 4 Vehicles | 4 (13.3%) | 2 (4.1%) |
| 5 or more Vehicles | 2 (6.7%) | 2 (4.1%) |
| Total | 30 (100.0%) | 49 (100.0%) |
Commute Time in Nickelsville
The most frequently occuring commute durations in Nickelsville are 45 to 59 minutes (32 commuters, 42.7%), 40 to 44 minutes (12 commuters, 16.0%), and 30 to 34 minutes (9 commuters, 12.0%).
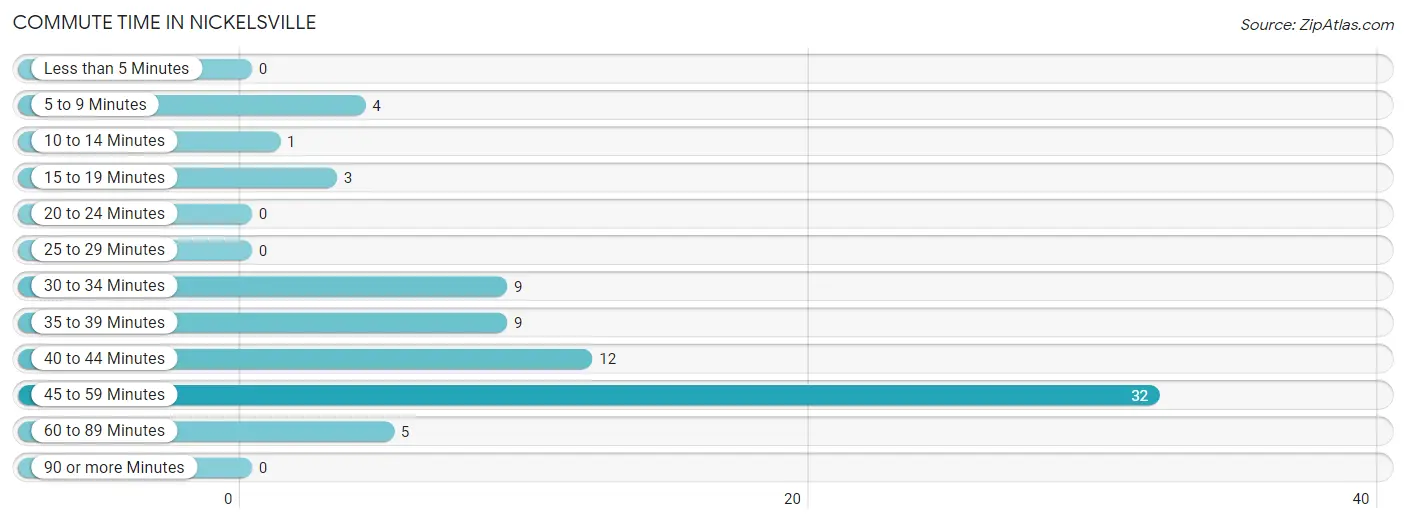
| Commute Time | # Commuters | % Commuters |
| Less than 5 Minutes | 0 | 0.0% |
| 5 to 9 Minutes | 4 | 5.3% |
| 10 to 14 Minutes | 1 | 1.3% |
| 15 to 19 Minutes | 3 | 4.0% |
| 20 to 24 Minutes | 0 | 0.0% |
| 25 to 29 Minutes | 0 | 0.0% |
| 30 to 34 Minutes | 9 | 12.0% |
| 35 to 39 Minutes | 9 | 12.0% |
| 40 to 44 Minutes | 12 | 16.0% |
| 45 to 59 Minutes | 32 | 42.7% |
| 60 to 89 Minutes | 5 | 6.7% |
| 90 or more Minutes | 0 | 0.0% |
Commute Time by Sex in Nickelsville
The most common commute times in Nickelsville are 45 to 59 minutes (9 commuters, 32.1%) for males and 45 to 59 minutes (23 commuters, 48.9%) for females.
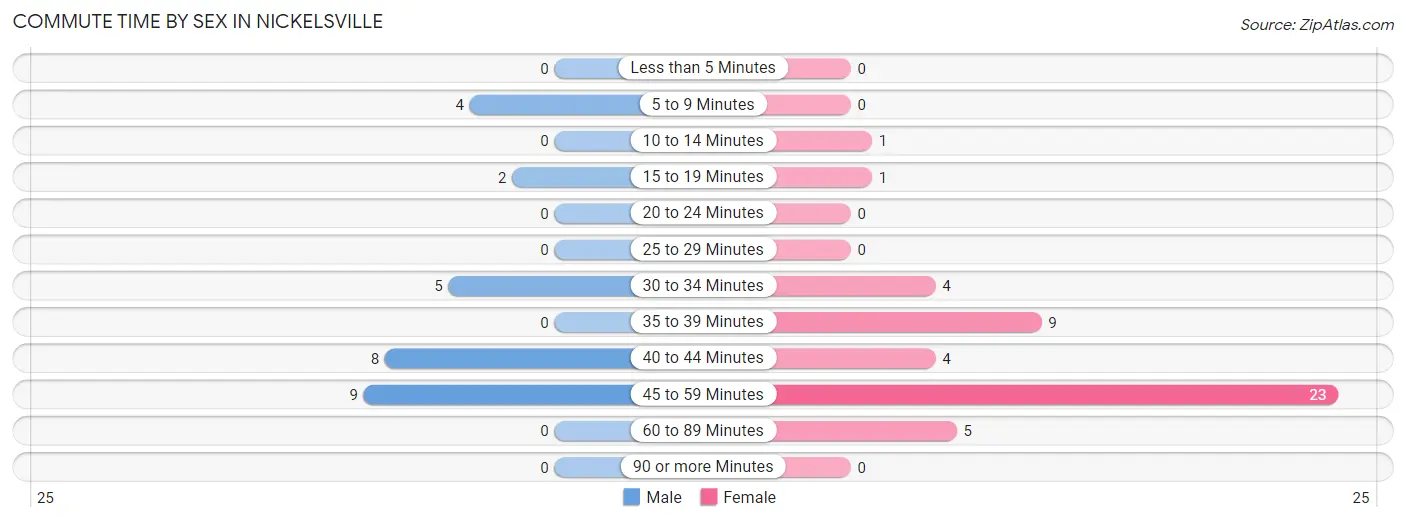
| Commute Time | Male | Female |
| Less than 5 Minutes | 0 (0.0%) | 0 (0.0%) |
| 5 to 9 Minutes | 4 (14.3%) | 0 (0.0%) |
| 10 to 14 Minutes | 0 (0.0%) | 1 (2.1%) |
| 15 to 19 Minutes | 2 (7.1%) | 1 (2.1%) |
| 20 to 24 Minutes | 0 (0.0%) | 0 (0.0%) |
| 25 to 29 Minutes | 0 (0.0%) | 0 (0.0%) |
| 30 to 34 Minutes | 5 (17.9%) | 4 (8.5%) |
| 35 to 39 Minutes | 0 (0.0%) | 9 (19.2%) |
| 40 to 44 Minutes | 8 (28.6%) | 4 (8.5%) |
| 45 to 59 Minutes | 9 (32.1%) | 23 (48.9%) |
| 60 to 89 Minutes | 0 (0.0%) | 5 (10.6%) |
| 90 or more Minutes | 0 (0.0%) | 0 (0.0%) |
Time of Departure to Work by Sex in Nickelsville
The most frequent times of departure to work in Nickelsville are 12:00 AM to 4:59 AM (8, 28.6%) for males and 12:00 PM to 3:59 PM (12, 25.5%) for females.
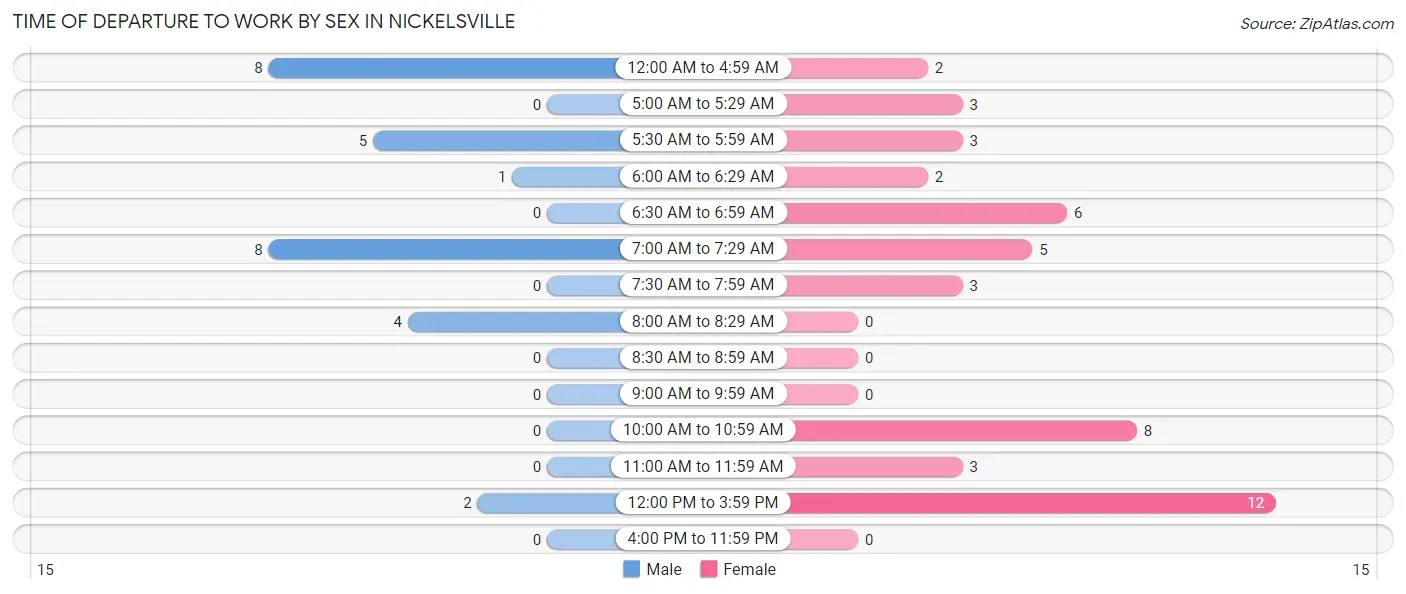
| Time of Departure | Male | Female |
| 12:00 AM to 4:59 AM | 8 (28.6%) | 2 (4.3%) |
| 5:00 AM to 5:29 AM | 0 (0.0%) | 3 (6.4%) |
| 5:30 AM to 5:59 AM | 5 (17.9%) | 3 (6.4%) |
| 6:00 AM to 6:29 AM | 1 (3.6%) | 2 (4.3%) |
| 6:30 AM to 6:59 AM | 0 (0.0%) | 6 (12.8%) |
| 7:00 AM to 7:29 AM | 8 (28.6%) | 5 (10.6%) |
| 7:30 AM to 7:59 AM | 0 (0.0%) | 3 (6.4%) |
| 8:00 AM to 8:29 AM | 4 (14.3%) | 0 (0.0%) |
| 8:30 AM to 8:59 AM | 0 (0.0%) | 0 (0.0%) |
| 9:00 AM to 9:59 AM | 0 (0.0%) | 0 (0.0%) |
| 10:00 AM to 10:59 AM | 0 (0.0%) | 8 (17.0%) |
| 11:00 AM to 11:59 AM | 0 (0.0%) | 3 (6.4%) |
| 12:00 PM to 3:59 PM | 2 (7.1%) | 12 (25.5%) |
| 4:00 PM to 11:59 PM | 0 (0.0%) | 0 (0.0%) |
| Total | 28 (100.0%) | 47 (100.0%) |
Housing Occupancy in Nickelsville
Occupancy by Ownership in Nickelsville
Of the total 170 dwellings in Nickelsville, owner-occupied units account for 110 (64.7%), while renter-occupied units make up 60 (35.3%).
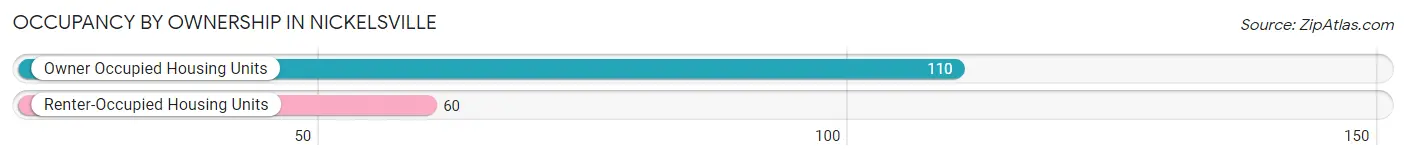
| Occupancy | # Housing Units | % Housing Units |
| Owner Occupied Housing Units | 110 | 64.7% |
| Renter-Occupied Housing Units | 60 | 35.3% |
| Total Occupied Housing Units | 170 | 100.0% |
Occupancy by Household Size in Nickelsville
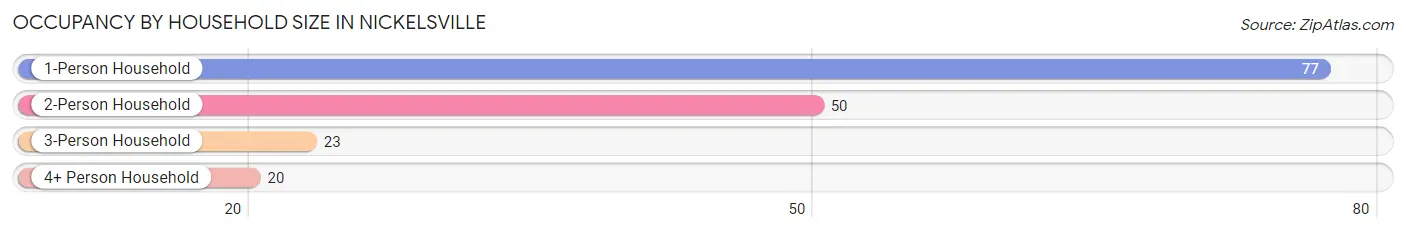
| Household Size | # Housing Units | % Housing Units |
| 1-Person Household | 77 | 45.3% |
| 2-Person Household | 50 | 29.4% |
| 3-Person Household | 23 | 13.5% |
| 4+ Person Household | 20 | 11.8% |
| Total Housing Units | 170 | 100.0% |
Occupancy by Ownership by Household Size in Nickelsville
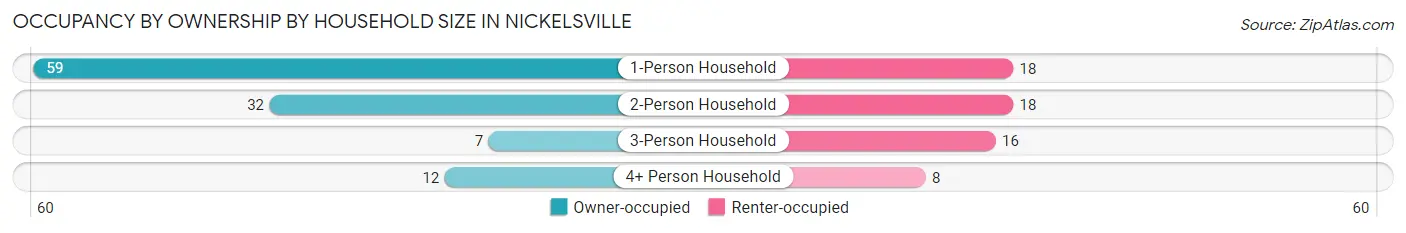
| Household Size | Owner-occupied | Renter-occupied |
| 1-Person Household | 59 (76.6%) | 18 (23.4%) |
| 2-Person Household | 32 (64.0%) | 18 (36.0%) |
| 3-Person Household | 7 (30.4%) | 16 (69.6%) |
| 4+ Person Household | 12 (60.0%) | 8 (40.0%) |
| Total Housing Units | 110 (64.7%) | 60 (35.3%) |
Occupancy by Educational Attainment in Nickelsville
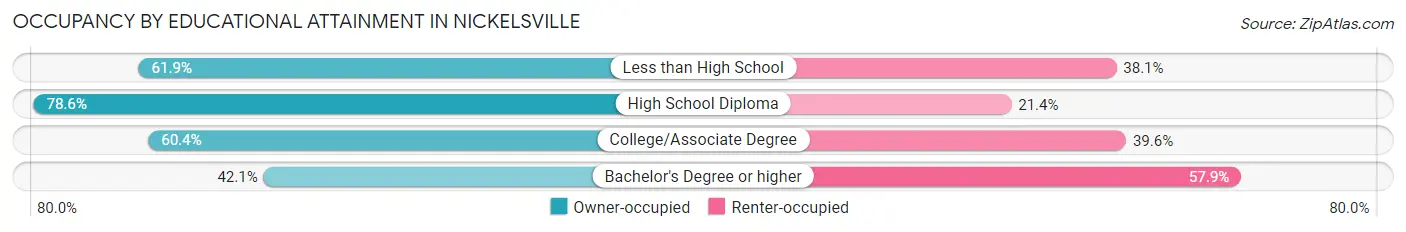
| Household Size | Owner-occupied | Renter-occupied |
| Less than High School | 26 (61.9%) | 16 (38.1%) |
| High School Diploma | 44 (78.6%) | 12 (21.4%) |
| College/Associate Degree | 32 (60.4%) | 21 (39.6%) |
| Bachelor's Degree or higher | 8 (42.1%) | 11 (57.9%) |
Occupancy by Age of Householder in Nickelsville
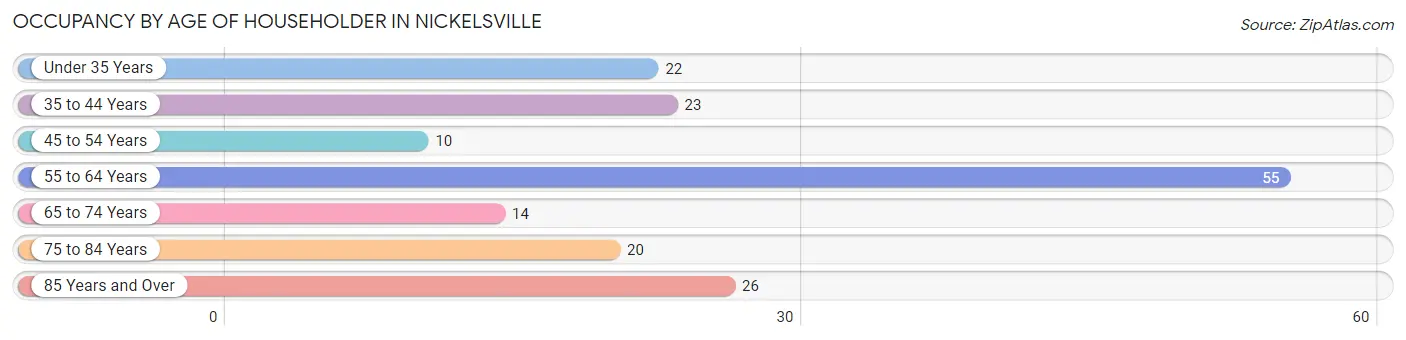
| Age Bracket | # Households | % Households |
| Under 35 Years | 22 | 12.9% |
| 35 to 44 Years | 23 | 13.5% |
| 45 to 54 Years | 10 | 5.9% |
| 55 to 64 Years | 55 | 32.4% |
| 65 to 74 Years | 14 | 8.2% |
| 75 to 84 Years | 20 | 11.8% |
| 85 Years and Over | 26 | 15.3% |
| Total | 170 | 100.0% |
Housing Finances in Nickelsville
Median Income by Occupancy in Nickelsville
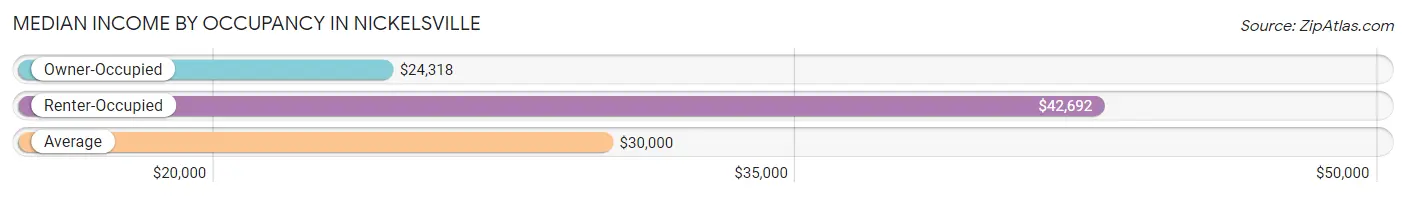
| Occupancy Type | # Households | Median Income |
| Owner-Occupied | 110 (64.7%) | $24,318 |
| Renter-Occupied | 60 (35.3%) | $42,692 |
| Average | 170 (100.0%) | $30,000 |
Occupancy by Householder Income Bracket in Nickelsville
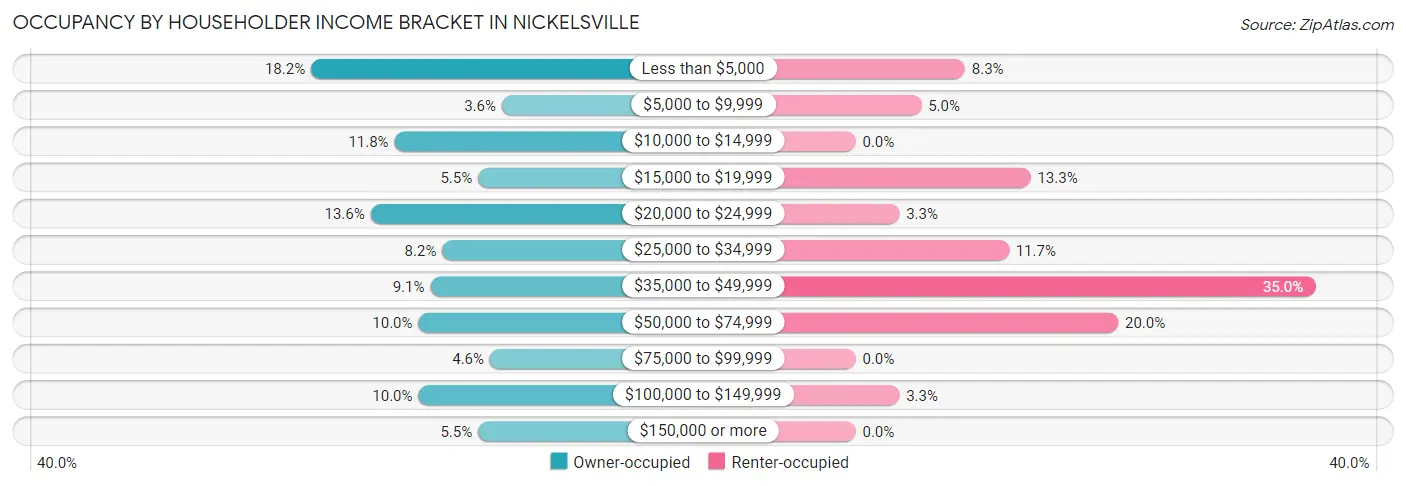
| Income Bracket | Owner-occupied | Renter-occupied |
| Less than $5,000 | 20 (18.2%) | 5 (8.3%) |
| $5,000 to $9,999 | 4 (3.6%) | 3 (5.0%) |
| $10,000 to $14,999 | 13 (11.8%) | 0 (0.0%) |
| $15,000 to $19,999 | 6 (5.4%) | 8 (13.3%) |
| $20,000 to $24,999 | 15 (13.6%) | 2 (3.3%) |
| $25,000 to $34,999 | 9 (8.2%) | 7 (11.7%) |
| $35,000 to $49,999 | 10 (9.1%) | 21 (35.0%) |
| $50,000 to $74,999 | 11 (10.0%) | 12 (20.0%) |
| $75,000 to $99,999 | 5 (4.5%) | 0 (0.0%) |
| $100,000 to $149,999 | 11 (10.0%) | 2 (3.3%) |
| $150,000 or more | 6 (5.4%) | 0 (0.0%) |
| Total | 110 (100.0%) | 60 (100.0%) |
Monthly Housing Cost Tiers in Nickelsville
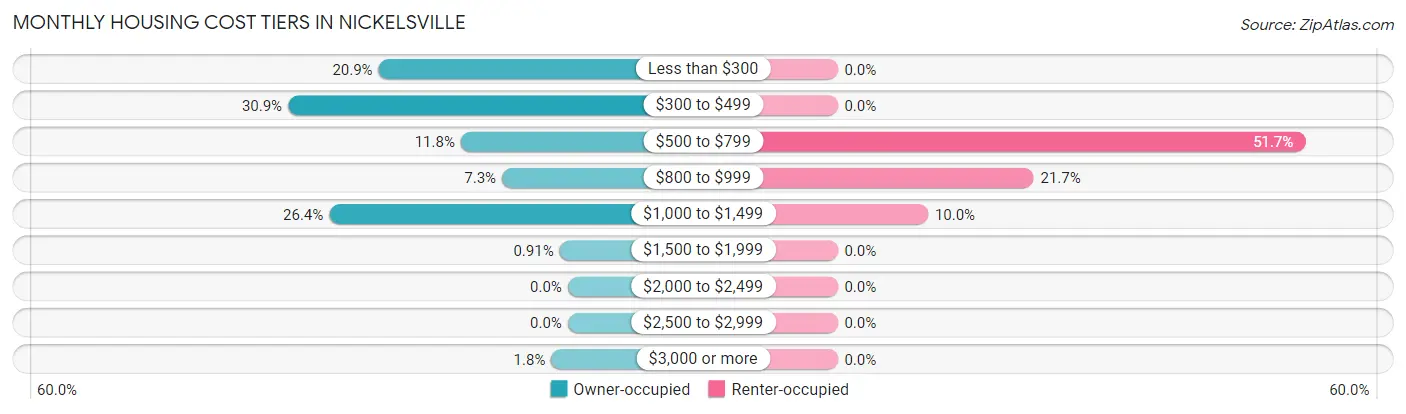
| Monthly Cost | Owner-occupied | Renter-occupied |
| Less than $300 | 23 (20.9%) | 0 (0.0%) |
| $300 to $499 | 34 (30.9%) | 0 (0.0%) |
| $500 to $799 | 13 (11.8%) | 31 (51.7%) |
| $800 to $999 | 8 (7.3%) | 13 (21.7%) |
| $1,000 to $1,499 | 29 (26.4%) | 6 (10.0%) |
| $1,500 to $1,999 | 1 (0.9%) | 0 (0.0%) |
| $2,000 to $2,499 | 0 (0.0%) | 0 (0.0%) |
| $2,500 to $2,999 | 0 (0.0%) | 0 (0.0%) |
| $3,000 or more | 2 (1.8%) | 0 (0.0%) |
| Total | 110 (100.0%) | 60 (100.0%) |
Physical Housing Characteristics in Nickelsville
Housing Structures in Nickelsville
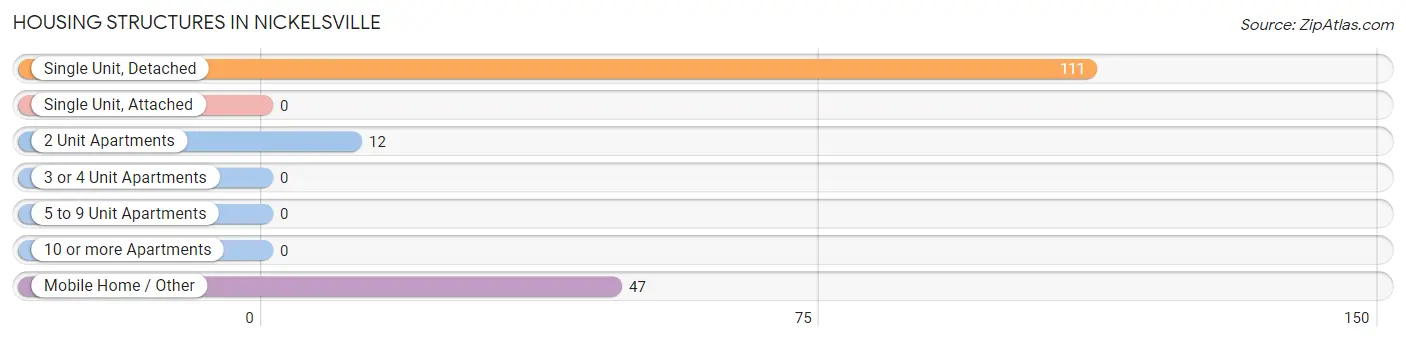
| Structure Type | # Housing Units | % Housing Units |
| Single Unit, Detached | 111 | 65.3% |
| Single Unit, Attached | 0 | 0.0% |
| 2 Unit Apartments | 12 | 7.1% |
| 3 or 4 Unit Apartments | 0 | 0.0% |
| 5 to 9 Unit Apartments | 0 | 0.0% |
| 10 or more Apartments | 0 | 0.0% |
| Mobile Home / Other | 47 | 27.7% |
| Total | 170 | 100.0% |
Housing Structures by Occupancy in Nickelsville
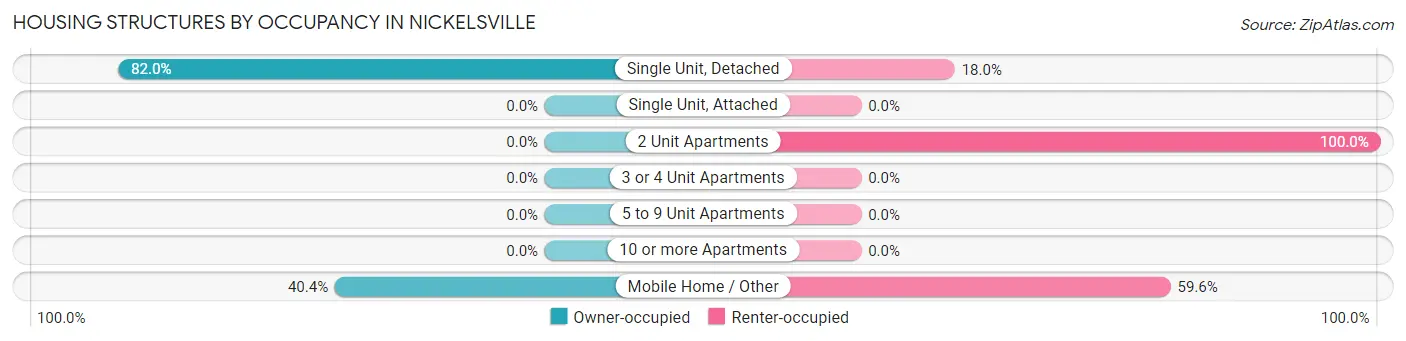
| Structure Type | Owner-occupied | Renter-occupied |
| Single Unit, Detached | 91 (82.0%) | 20 (18.0%) |
| Single Unit, Attached | 0 (0.0%) | 0 (0.0%) |
| 2 Unit Apartments | 0 (0.0%) | 12 (100.0%) |
| 3 or 4 Unit Apartments | 0 (0.0%) | 0 (0.0%) |
| 5 to 9 Unit Apartments | 0 (0.0%) | 0 (0.0%) |
| 10 or more Apartments | 0 (0.0%) | 0 (0.0%) |
| Mobile Home / Other | 19 (40.4%) | 28 (59.6%) |
| Total | 110 (64.7%) | 60 (35.3%) |
Housing Structures by Number of Rooms in Nickelsville
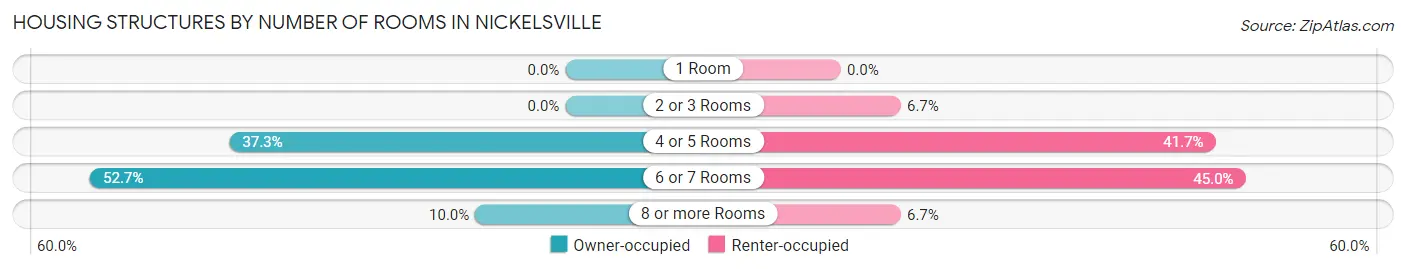
| Number of Rooms | Owner-occupied | Renter-occupied |
| 1 Room | 0 (0.0%) | 0 (0.0%) |
| 2 or 3 Rooms | 0 (0.0%) | 4 (6.7%) |
| 4 or 5 Rooms | 41 (37.3%) | 25 (41.7%) |
| 6 or 7 Rooms | 58 (52.7%) | 27 (45.0%) |
| 8 or more Rooms | 11 (10.0%) | 4 (6.7%) |
| Total | 110 (100.0%) | 60 (100.0%) |
Housing Structure by Heating Type in Nickelsville
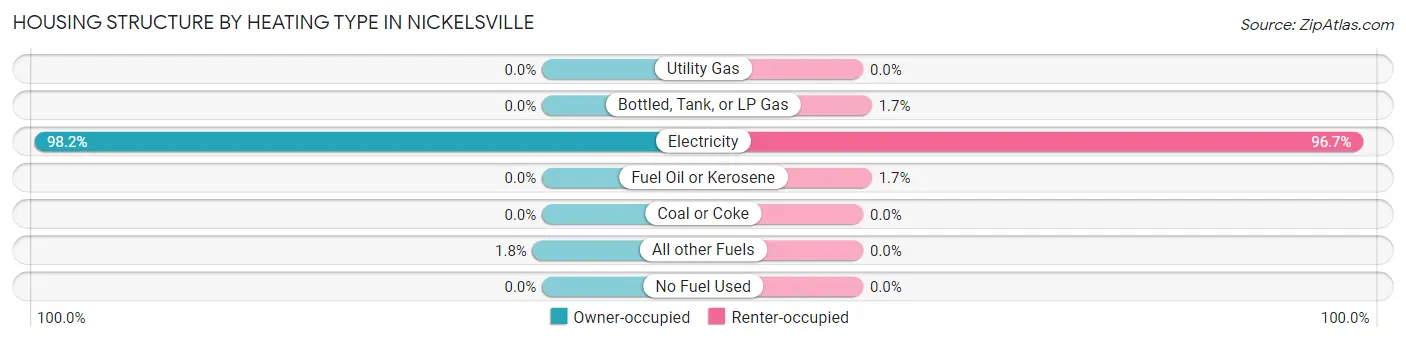
| Heating Type | Owner-occupied | Renter-occupied |
| Utility Gas | 0 (0.0%) | 0 (0.0%) |
| Bottled, Tank, or LP Gas | 0 (0.0%) | 1 (1.7%) |
| Electricity | 108 (98.2%) | 58 (96.7%) |
| Fuel Oil or Kerosene | 0 (0.0%) | 1 (1.7%) |
| Coal or Coke | 0 (0.0%) | 0 (0.0%) |
| All other Fuels | 2 (1.8%) | 0 (0.0%) |
| No Fuel Used | 0 (0.0%) | 0 (0.0%) |
| Total | 110 (100.0%) | 60 (100.0%) |
Household Vehicle Usage in Nickelsville
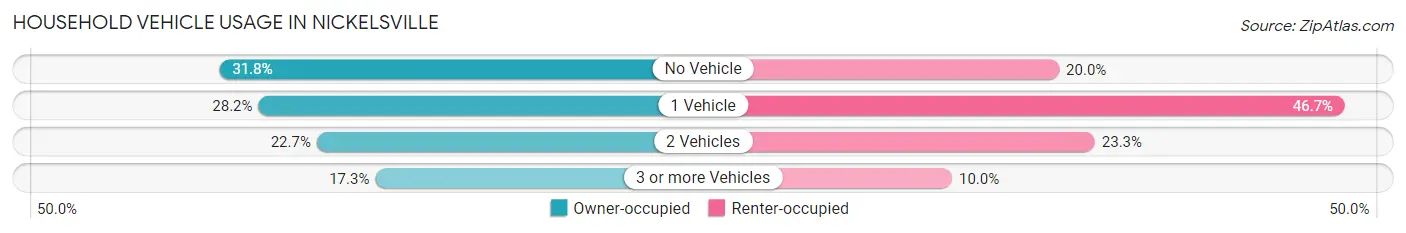
| Vehicles per Household | Owner-occupied | Renter-occupied |
| No Vehicle | 35 (31.8%) | 12 (20.0%) |
| 1 Vehicle | 31 (28.2%) | 28 (46.7%) |
| 2 Vehicles | 25 (22.7%) | 14 (23.3%) |
| 3 or more Vehicles | 19 (17.3%) | 6 (10.0%) |
| Total | 110 (100.0%) | 60 (100.0%) |
Real Estate & Mortgages in Nickelsville
Real Estate and Mortgage Overview in Nickelsville
| Characteristic | Without Mortgage | With Mortgage |
| Housing Units | 83 | 27 |
| Median Property Value | $131,300 | $192,500 |
| Median Household Income | $18,125 | $2 |
| Monthly Housing Costs | $389 | $0 |
| Real Estate Taxes | $564 | $0 |
Property Value by Mortgage Status in Nickelsville
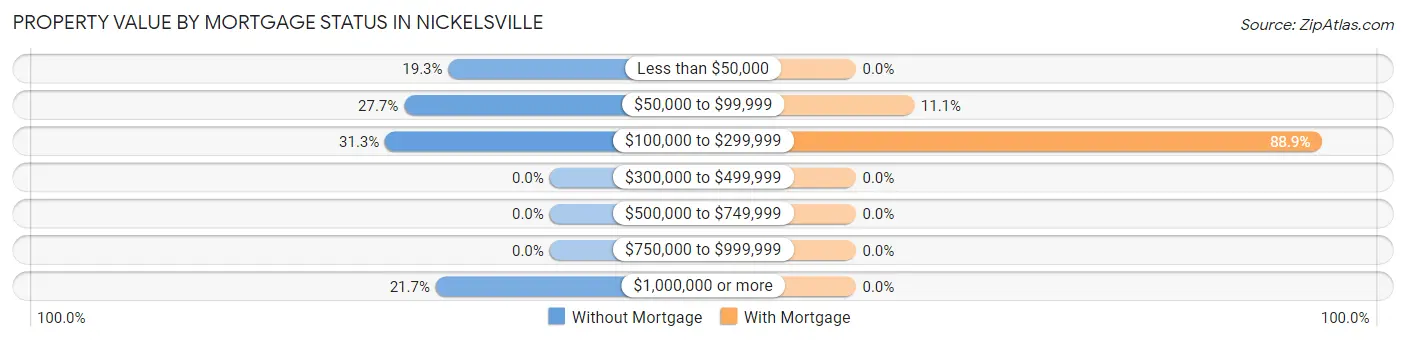
| Property Value | Without Mortgage | With Mortgage |
| Less than $50,000 | 16 (19.3%) | 0 (0.0%) |
| $50,000 to $99,999 | 23 (27.7%) | 3 (11.1%) |
| $100,000 to $299,999 | 26 (31.3%) | 24 (88.9%) |
| $300,000 to $499,999 | 0 (0.0%) | 0 (0.0%) |
| $500,000 to $749,999 | 0 (0.0%) | 0 (0.0%) |
| $750,000 to $999,999 | 0 (0.0%) | 0 (0.0%) |
| $1,000,000 or more | 18 (21.7%) | 0 (0.0%) |
| Total | 83 (100.0%) | 27 (100.0%) |
Household Income by Mortgage Status in Nickelsville
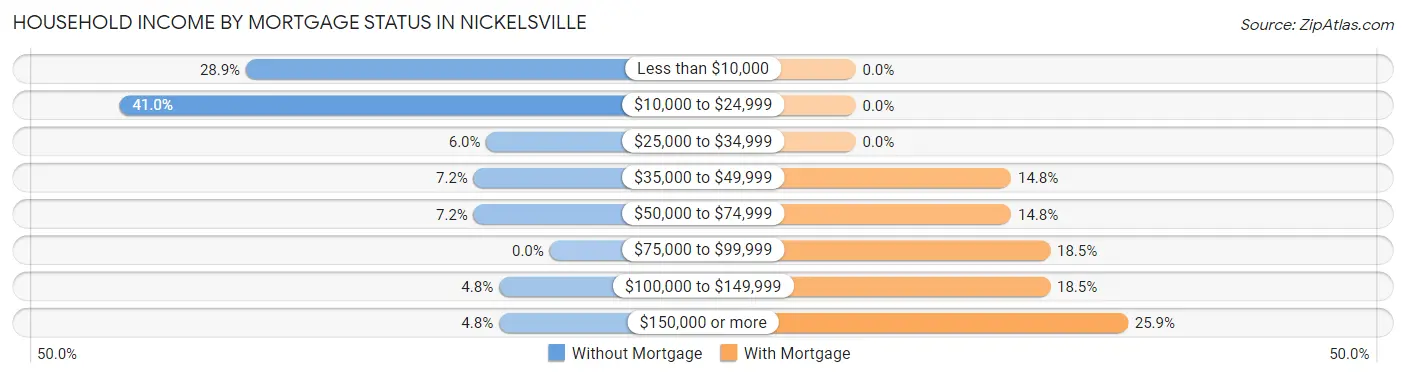
| Household Income | Without Mortgage | With Mortgage |
| Less than $10,000 | 24 (28.9%) | 0 (0.0%) |
| $10,000 to $24,999 | 34 (41.0%) | 0 (0.0%) |
| $25,000 to $34,999 | 5 (6.0%) | 0 (0.0%) |
| $35,000 to $49,999 | 6 (7.2%) | 4 (14.8%) |
| $50,000 to $74,999 | 6 (7.2%) | 4 (14.8%) |
| $75,000 to $99,999 | 0 (0.0%) | 5 (18.5%) |
| $100,000 to $149,999 | 4 (4.8%) | 5 (18.5%) |
| $150,000 or more | 4 (4.8%) | 7 (25.9%) |
| Total | 83 (100.0%) | 27 (100.0%) |
Property Value to Household Income Ratio in Nickelsville
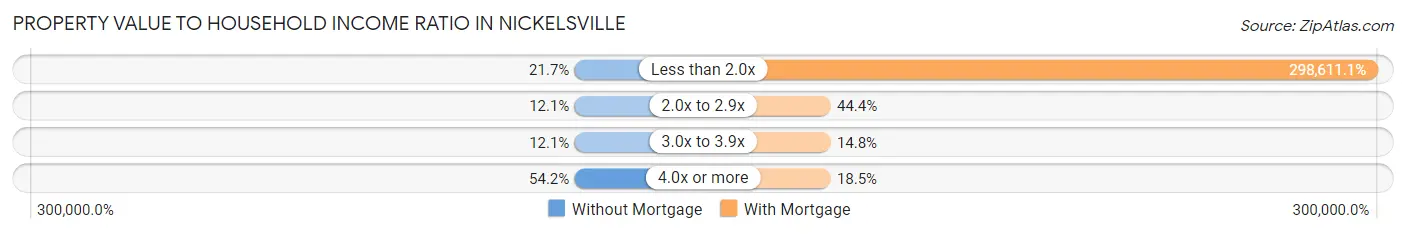
| Value-to-Income Ratio | Without Mortgage | With Mortgage |
| Less than 2.0x | 18 (21.7%) | 80,625 (298,611.1%) |
| 2.0x to 2.9x | 10 (12.0%) | 12 (44.4%) |
| 3.0x to 3.9x | 10 (12.0%) | 4 (14.8%) |
| 4.0x or more | 45 (54.2%) | 5 (18.5%) |
| Total | 83 (100.0%) | 27 (100.0%) |
Real Estate Taxes by Mortgage Status in Nickelsville
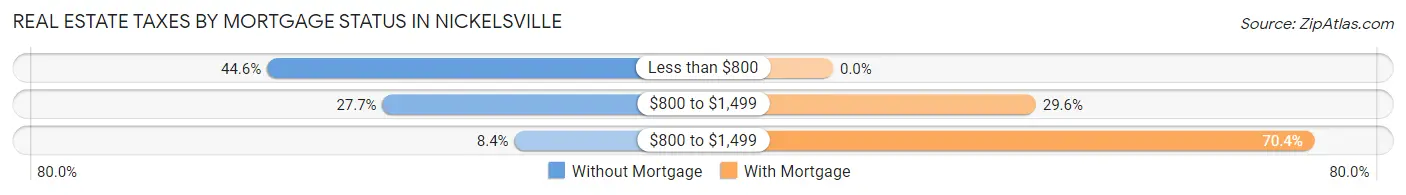
| Property Taxes | Without Mortgage | With Mortgage |
| Less than $800 | 37 (44.6%) | 0 (0.0%) |
| $800 to $1,499 | 23 (27.7%) | 8 (29.6%) |
| $800 to $1,499 | 7 (8.4%) | 19 (70.4%) |
| Total | 83 (100.0%) | 27 (100.0%) |
Health & Disability in Nickelsville
Health Insurance Coverage by Age in Nickelsville
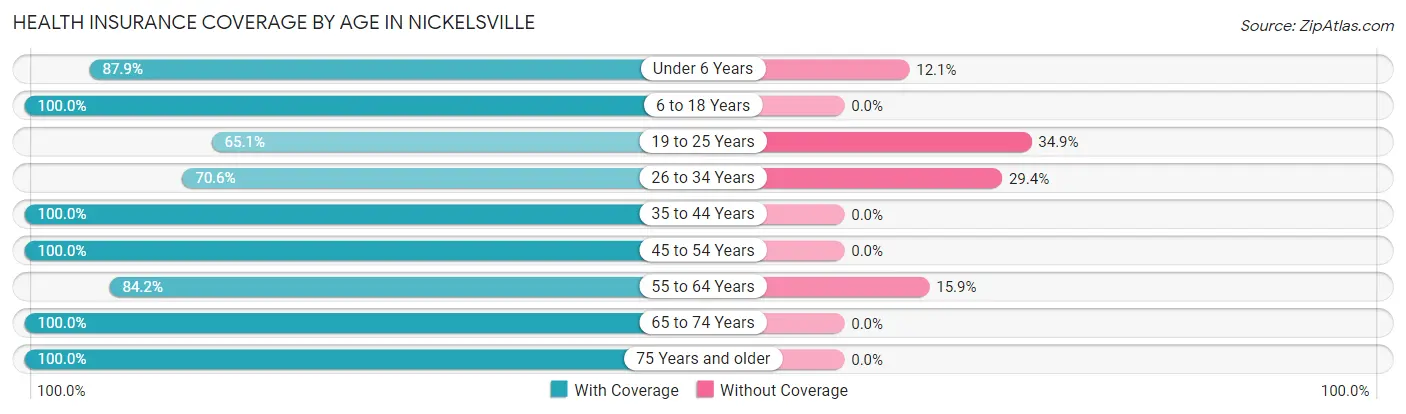
| Age Bracket | With Coverage | Without Coverage |
| Under 6 Years | 29 (87.9%) | 4 (12.1%) |
| 6 to 18 Years | 30 (100.0%) | 0 (0.0%) |
| 19 to 25 Years | 28 (65.1%) | 15 (34.9%) |
| 26 to 34 Years | 12 (70.6%) | 5 (29.4%) |
| 35 to 44 Years | 46 (100.0%) | 0 (0.0%) |
| 45 to 54 Years | 22 (100.0%) | 0 (0.0%) |
| 55 to 64 Years | 69 (84.2%) | 13 (15.9%) |
| 65 to 74 Years | 37 (100.0%) | 0 (0.0%) |
| 75 Years and older | 50 (100.0%) | 0 (0.0%) |
| Total | 323 (89.7%) | 37 (10.3%) |
Health Insurance Coverage by Citizenship Status in Nickelsville
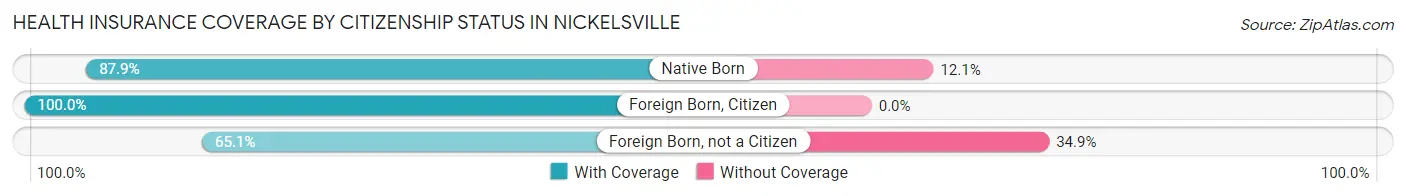
| Citizenship Status | With Coverage | Without Coverage |
| Native Born | 29 (87.9%) | 4 (12.1%) |
| Foreign Born, Citizen | 30 (100.0%) | 0 (0.0%) |
| Foreign Born, not a Citizen | 28 (65.1%) | 15 (34.9%) |
Health Insurance Coverage by Household Income in Nickelsville
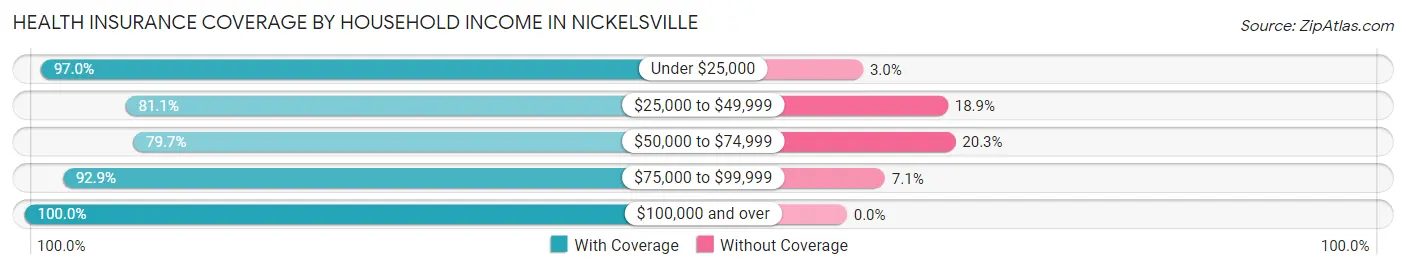
| Household Income | With Coverage | Without Coverage |
| Under $25,000 | 96 (97.0%) | 3 (3.0%) |
| $25,000 to $49,999 | 90 (81.1%) | 21 (18.9%) |
| $50,000 to $74,999 | 47 (79.7%) | 12 (20.3%) |
| $75,000 to $99,999 | 13 (92.9%) | 1 (7.1%) |
| $100,000 and over | 77 (100.0%) | 0 (0.0%) |
Public vs Private Health Insurance Coverage by Age in Nickelsville
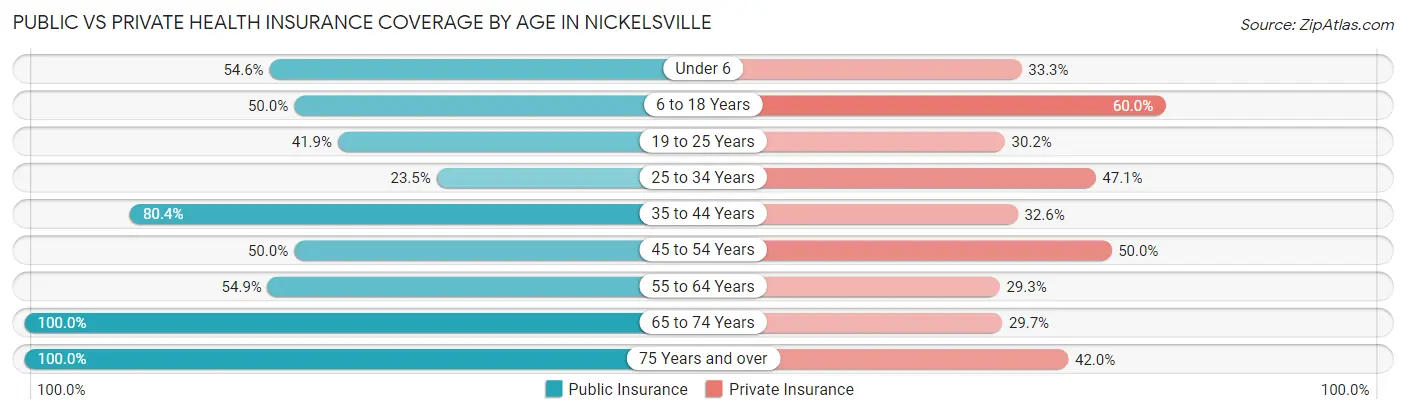
| Age Bracket | Public Insurance | Private Insurance |
| Under 6 | 18 (54.5%) | 11 (33.3%) |
| 6 to 18 Years | 15 (50.0%) | 18 (60.0%) |
| 19 to 25 Years | 18 (41.9%) | 13 (30.2%) |
| 25 to 34 Years | 4 (23.5%) | 8 (47.1%) |
| 35 to 44 Years | 37 (80.4%) | 15 (32.6%) |
| 45 to 54 Years | 11 (50.0%) | 11 (50.0%) |
| 55 to 64 Years | 45 (54.9%) | 24 (29.3%) |
| 65 to 74 Years | 37 (100.0%) | 11 (29.7%) |
| 75 Years and over | 50 (100.0%) | 21 (42.0%) |
| Total | 235 (65.3%) | 132 (36.7%) |
Disability Status by Sex by Age in Nickelsville
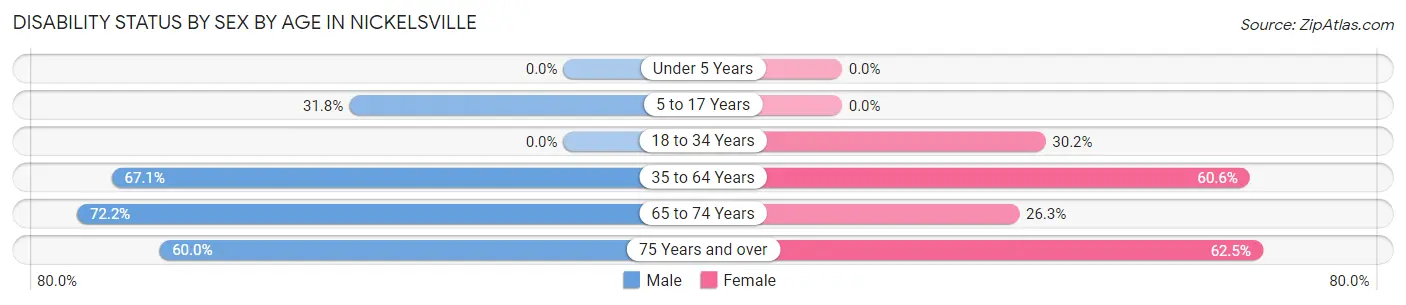
| Age Bracket | Male | Female |
| Under 5 Years | 0 (0.0%) | 0 (0.0%) |
| 5 to 17 Years | 7 (31.8%) | 0 (0.0%) |
| 18 to 34 Years | 0 (0.0%) | 13 (30.2%) |
| 35 to 64 Years | 53 (67.1%) | 43 (60.6%) |
| 65 to 74 Years | 13 (72.2%) | 5 (26.3%) |
| 75 Years and over | 6 (60.0%) | 25 (62.5%) |
Disability Class by Sex by Age in Nickelsville
Disability Class: Hearing Difficulty
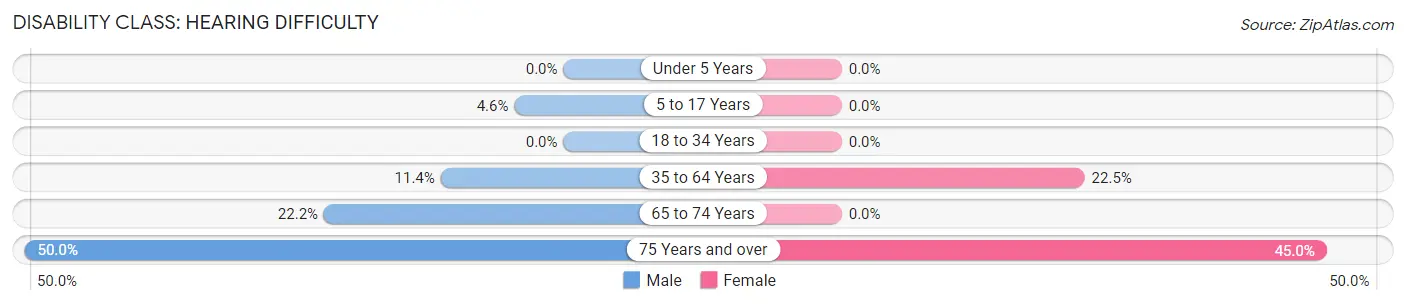
| Age Bracket | Male | Female |
| Under 5 Years | 0 (0.0%) | 0 (0.0%) |
| 5 to 17 Years | 1 (4.5%) | 0 (0.0%) |
| 18 to 34 Years | 0 (0.0%) | 0 (0.0%) |
| 35 to 64 Years | 9 (11.4%) | 16 (22.5%) |
| 65 to 74 Years | 4 (22.2%) | 0 (0.0%) |
| 75 Years and over | 5 (50.0%) | 18 (45.0%) |
Disability Class: Vision Difficulty
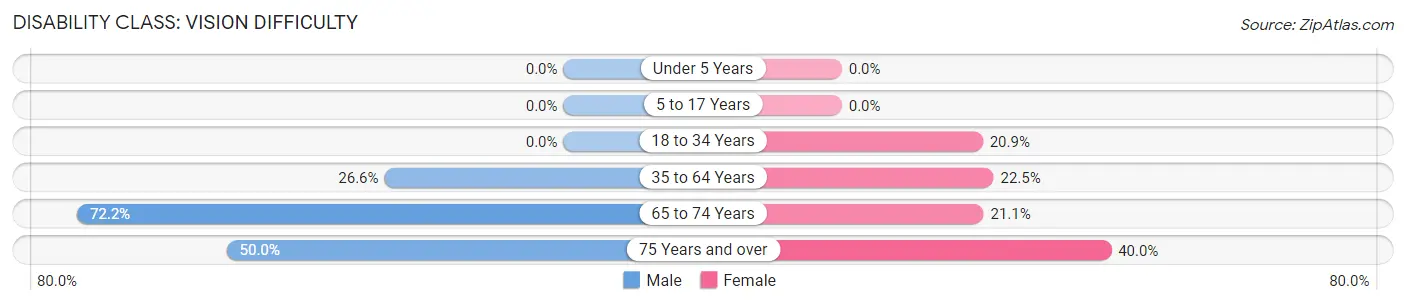
| Age Bracket | Male | Female |
| Under 5 Years | 0 (0.0%) | 0 (0.0%) |
| 5 to 17 Years | 0 (0.0%) | 0 (0.0%) |
| 18 to 34 Years | 0 (0.0%) | 9 (20.9%) |
| 35 to 64 Years | 21 (26.6%) | 16 (22.5%) |
| 65 to 74 Years | 13 (72.2%) | 4 (21.0%) |
| 75 Years and over | 5 (50.0%) | 16 (40.0%) |
Disability Class: Cognitive Difficulty
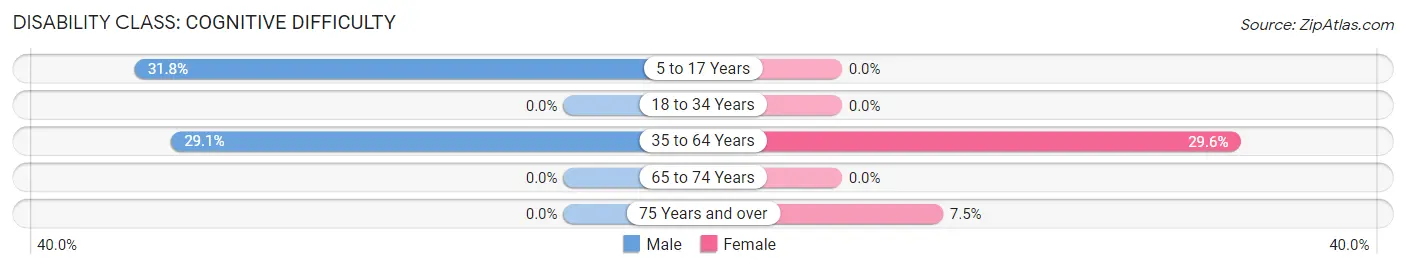
| Age Bracket | Male | Female |
| 5 to 17 Years | 7 (31.8%) | 0 (0.0%) |
| 18 to 34 Years | 0 (0.0%) | 0 (0.0%) |
| 35 to 64 Years | 23 (29.1%) | 21 (29.6%) |
| 65 to 74 Years | 0 (0.0%) | 0 (0.0%) |
| 75 Years and over | 0 (0.0%) | 3 (7.5%) |
Disability Class: Ambulatory Difficulty
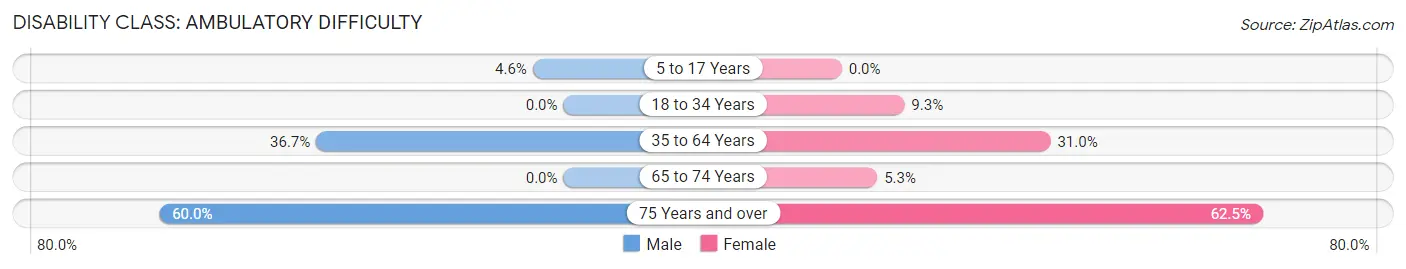
| Age Bracket | Male | Female |
| 5 to 17 Years | 1 (4.5%) | 0 (0.0%) |
| 18 to 34 Years | 0 (0.0%) | 4 (9.3%) |
| 35 to 64 Years | 29 (36.7%) | 22 (31.0%) |
| 65 to 74 Years | 0 (0.0%) | 1 (5.3%) |
| 75 Years and over | 6 (60.0%) | 25 (62.5%) |
Disability Class: Self-Care Difficulty
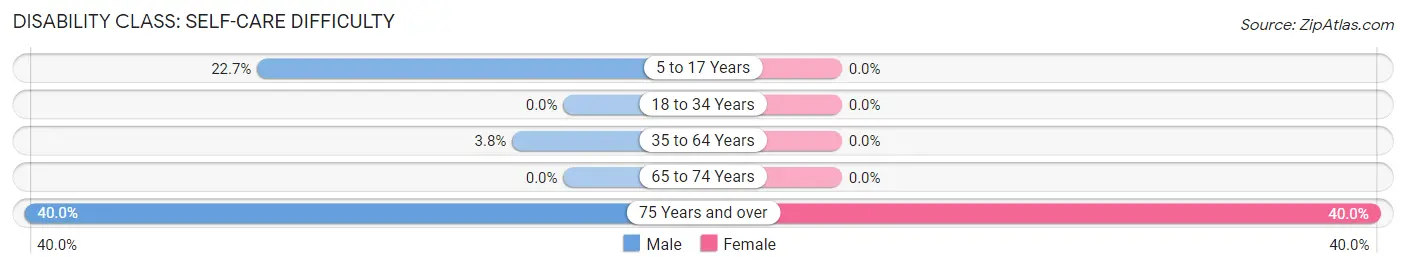
| Age Bracket | Male | Female |
| 5 to 17 Years | 5 (22.7%) | 0 (0.0%) |
| 18 to 34 Years | 0 (0.0%) | 0 (0.0%) |
| 35 to 64 Years | 3 (3.8%) | 0 (0.0%) |
| 65 to 74 Years | 0 (0.0%) | 0 (0.0%) |
| 75 Years and over | 4 (40.0%) | 16 (40.0%) |
Technology Access in Nickelsville
Computing Device Access in Nickelsville
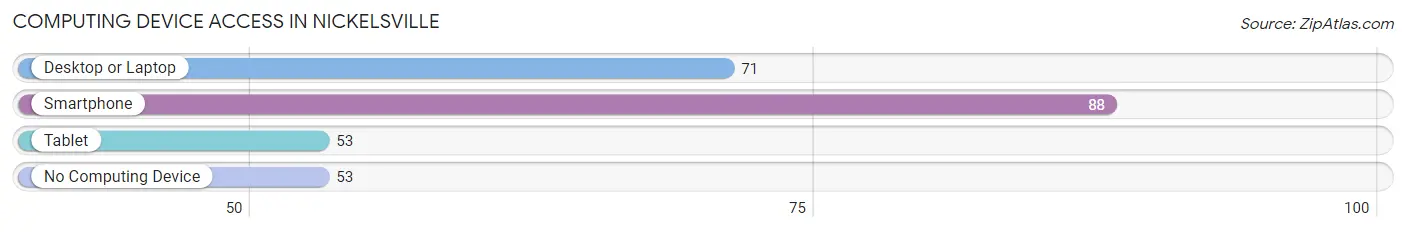
| Device Type | # Households | % Households |
| Desktop or Laptop | 71 | 41.8% |
| Smartphone | 88 | 51.8% |
| Tablet | 53 | 31.2% |
| No Computing Device | 53 | 31.2% |
| Total | 170 | 100.0% |
Internet Access in Nickelsville
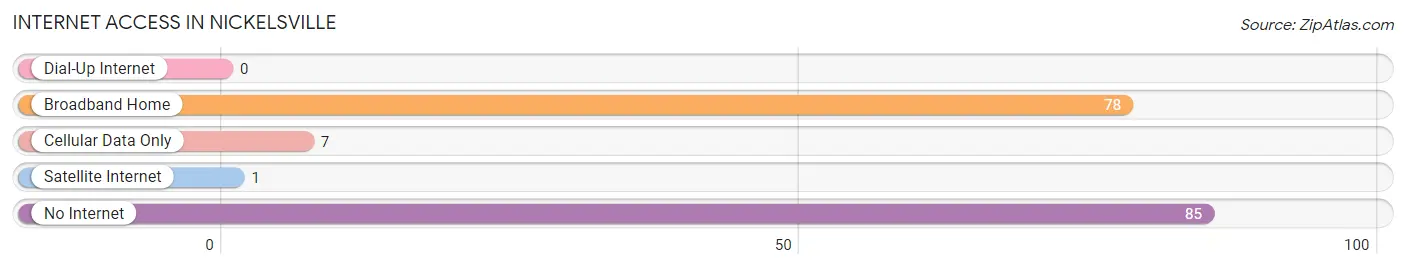
| Internet Type | # Households | % Households |
| Dial-Up Internet | 0 | 0.0% |
| Broadband Home | 78 | 45.9% |
| Cellular Data Only | 7 | 4.1% |
| Satellite Internet | 1 | 0.6% |
| No Internet | 85 | 50.0% |
| Total | 170 | 100.0% |
Nickelsville Summary
Nicklesville, VA is a small town located in the Shenandoah Valley of Virginia. It is situated in the foothills of the Blue Ridge Mountains and is part of the Shenandoah County. The town was founded in 1820 and has a population of approximately 1,000 people.
History
Nicklesville was founded in 1820 by a man named John Nickles. He was a farmer and a blacksmith who had moved to the area from Pennsylvania. He purchased a large tract of land and began to build a small village. He named the village after himself and it quickly grew in size and population.
The town was a popular stop for travelers on the Great Wagon Road, which ran through the Shenandoah Valley. It was also a popular stop for Confederate soldiers during the Civil War. After the war, the town began to decline in population and economic activity.
In the early 1900s, the town was revitalized by the arrival of the Norfolk and Western Railway. This allowed for increased trade and commerce in the area. The town also became a popular tourist destination due to its proximity to the Blue Ridge Mountains.
Geography
Nicklesville is located in the Shenandoah Valley of Virginia. It is situated in the foothills of the Blue Ridge Mountains and is part of the Shenandoah County. The town is located at an elevation of 1,000 feet and has a total area of 0.7 square miles.
The town is surrounded by rolling hills and lush forests. The climate is mild and humid with hot summers and cold winters. The average annual temperature is around 55 degrees Fahrenheit.
Economy
The economy of Nicklesville is largely based on agriculture and tourism. The town is home to several farms that produce a variety of crops, including corn, soybeans, wheat, and hay. The town is also home to several wineries and distilleries that produce a variety of wines and spirits.
Tourism is also an important part of the economy. The town is home to several historic sites, including the Nicklesville Historic District, which is listed on the National Register of Historic Places. The town is also home to several outdoor recreation areas, including the Shenandoah National Park and the George Washington National Forest.
Demographics
As of the 2010 census, the population of Nicklesville was 1,000 people. The racial makeup of the town was 97.2% White, 0.7% African American, 0.2% Native American, 0.2% Asian, 0.2% from other races, and 1.7% from two or more races. The median household income was $41,250 and the median family income was $50,000.
The town is home to several churches, including the Nicklesville United Methodist Church, the Nicklesville Baptist Church, and the Nicklesville Presbyterian Church. The town is also home to several schools, including the Nicklesville Elementary School and the Nicklesville High School.
Conclusion
Nicklesville, VA is a small town located in the Shenandoah Valley of Virginia. It was founded in 1820 and has a population of approximately 1,000 people. The town is surrounded by rolling hills and lush forests and is home to several farms, wineries, and distilleries. The economy of the town is largely based on agriculture and tourism. The town is also home to several historic sites and outdoor recreation areas. The population of the town is 97.2% White, 0.7% African American, 0.2% Native American, 0.2% Asian, and 1.7% from two or more races. The median household income is $41,250 and the median family income is $50,000.
Common Questions
What is Per Capita Income in Nickelsville?
Per Capita income in Nickelsville is $23,216.
What is the Median Family Income in Nickelsville?
Median Family Income in Nickelsville is $44,083.
What is the Median Household income in Nickelsville?
Median Household Income in Nickelsville is $30,000.
What is Inequality or Gini Index in Nickelsville?
Inequality or Gini Index in Nickelsville is 0.56.
What is the Total Population of Nickelsville?
Total Population of Nickelsville is 360.
What is the Total Male Population of Nickelsville?
Total Male Population of Nickelsville is 161.
What is the Total Female Population of Nickelsville?
Total Female Population of Nickelsville is 199.
What is the Ratio of Males per 100 Females in Nickelsville?
There are 80.90 Males per 100 Females in Nickelsville.
What is the Ratio of Females per 100 Males in Nickelsville?
There are 123.60 Females per 100 Males in Nickelsville.
What is the Median Population Age in Nickelsville?
Median Population Age in Nickelsville is 53.5 Years.
What is the Average Family Size in Nickelsville
Average Family Size in Nickelsville is 3.0 People.
What is the Average Household Size in Nickelsville
Average Household Size in Nickelsville is 2.1 People.
How Large is the Labor Force in Nickelsville?
There are 93 People in the Labor Forcein in Nickelsville.
What is the Percentage of People in the Labor Force in Nickelsville?
30.7% of People are in the Labor Force in Nickelsville.
What is the Unemployment Rate in Nickelsville?
Unemployment Rate in Nickelsville is 11.8%.