New Castle, VA Map & Demographics
New Castle Map
New Castle Overview
$42,015
PER CAPITA INCOME
$170,750
AVG FAMILY INCOME
59.6%
WAGE / INCOME GAP [ % ]
40.4¢/ $1
WAGE / INCOME GAP [ $ ]
0.36
INEQUALITY / GINI INDEX
224
TOTAL POPULATION
82
MALE POPULATION
142
FEMALE POPULATION
57.75
MALES / 100 FEMALES
173.17
FEMALES / 100 MALES
33.1
MEDIAN AGE
2.6
AVG FAMILY SIZE
2.3
AVG HOUSEHOLD SIZE
115
LABOR FORCE [ PEOPLE ]
73.2%
PERCENT IN LABOR FORCE
2.6%
UNEMPLOYMENT RATE
New Castle Zip Codes
New Castle Area Codes
Income in New Castle
Income Overview in New Castle
| Characteristic | Number | Measure |
| Per Capita Income | 224 | $42,015 |
| Median Family Income | 73 | $170,750 |
| Mean Family Income | 73 | $130,068 |
| Median Household Income | 97 | $0 |
| Mean Household Income | 97 | $109,035 |
| Income Deficit | 73 | $0 |
| Wage / Income Gap (%) | 224 | 59.62% |
| Wage / Income Gap ($) | 224 | 40.38¢ per $1 |
| Gini / Inequality Index | 224 | 0.36 |
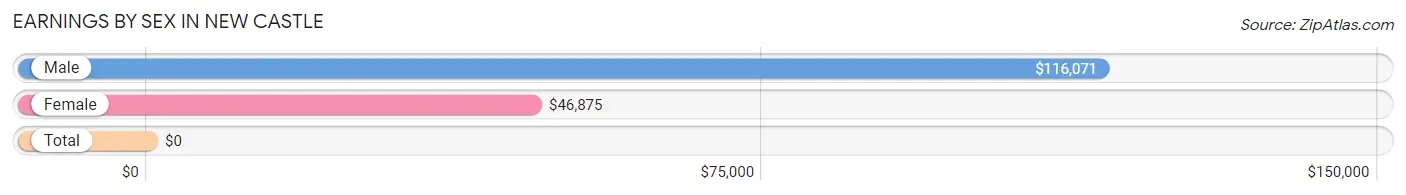
Earnings by Sex in New Castle
| Sex | Number | Average Earnings |
| Male | 60 (52.6%) | $116,071 |
| Female | 54 (47.4%) | $46,875 |
| Total | 114 (100.0%) | $0 |
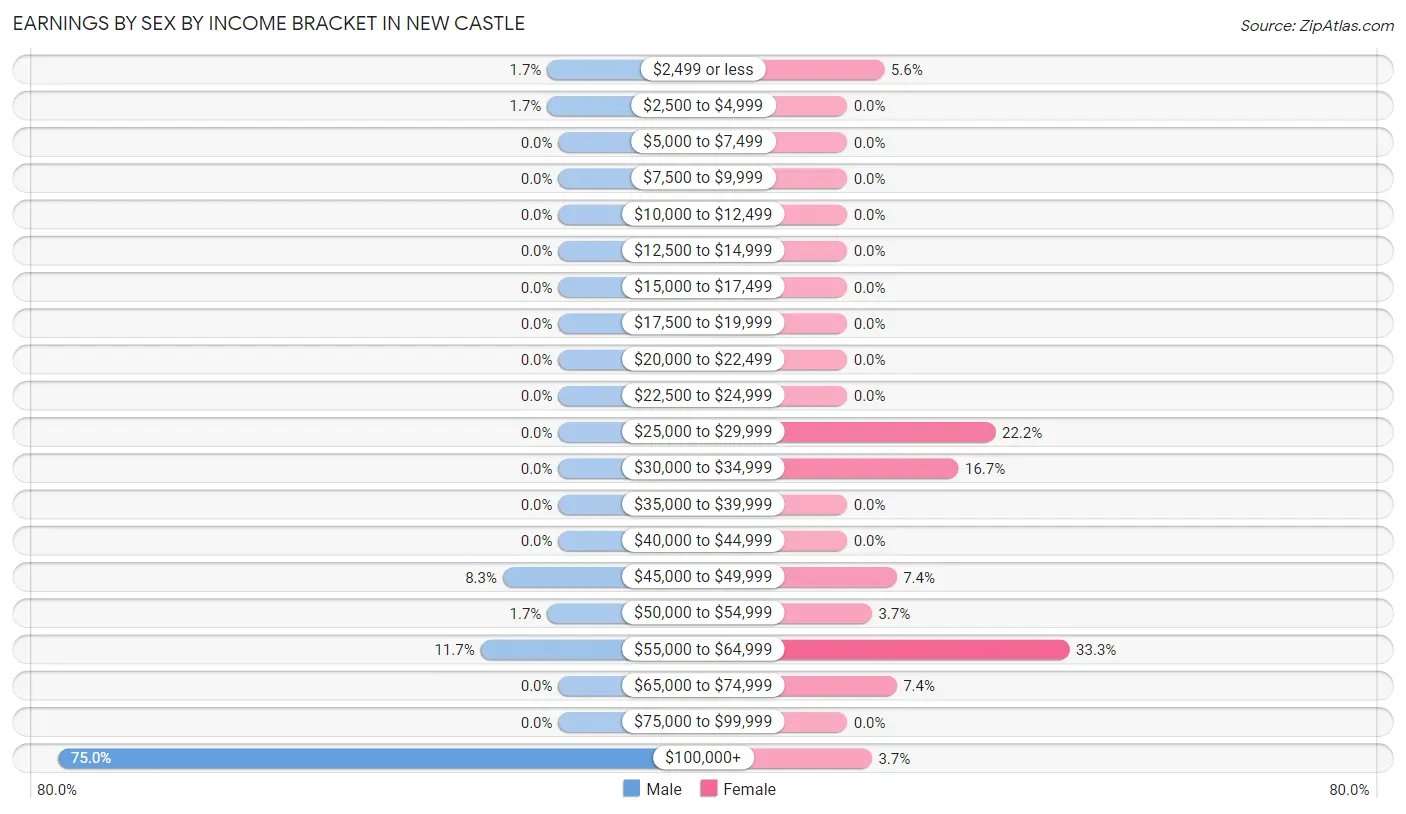
Earnings by Sex by Income Bracket in New Castle
The most common earnings brackets in New Castle are $100,000+ for men (45 | 75.0%) and $55,000 to $64,999 for women (18 | 33.3%).
| Income | Male | Female |
| $2,499 or less | 1 (1.7%) | 3 (5.6%) |
| $2,500 to $4,999 | 1 (1.7%) | 0 (0.0%) |
| $5,000 to $7,499 | 0 (0.0%) | 0 (0.0%) |
| $7,500 to $9,999 | 0 (0.0%) | 0 (0.0%) |
| $10,000 to $12,499 | 0 (0.0%) | 0 (0.0%) |
| $12,500 to $14,999 | 0 (0.0%) | 0 (0.0%) |
| $15,000 to $17,499 | 0 (0.0%) | 0 (0.0%) |
| $17,500 to $19,999 | 0 (0.0%) | 0 (0.0%) |
| $20,000 to $22,499 | 0 (0.0%) | 0 (0.0%) |
| $22,500 to $24,999 | 0 (0.0%) | 0 (0.0%) |
| $25,000 to $29,999 | 0 (0.0%) | 12 (22.2%) |
| $30,000 to $34,999 | 0 (0.0%) | 9 (16.7%) |
| $35,000 to $39,999 | 0 (0.0%) | 0 (0.0%) |
| $40,000 to $44,999 | 0 (0.0%) | 0 (0.0%) |
| $45,000 to $49,999 | 5 (8.3%) | 4 (7.4%) |
| $50,000 to $54,999 | 1 (1.7%) | 2 (3.7%) |
| $55,000 to $64,999 | 7 (11.7%) | 18 (33.3%) |
| $65,000 to $74,999 | 0 (0.0%) | 4 (7.4%) |
| $75,000 to $99,999 | 0 (0.0%) | 0 (0.0%) |
| $100,000+ | 45 (75.0%) | 2 (3.7%) |
| Total | 60 (100.0%) | 54 (100.0%) |
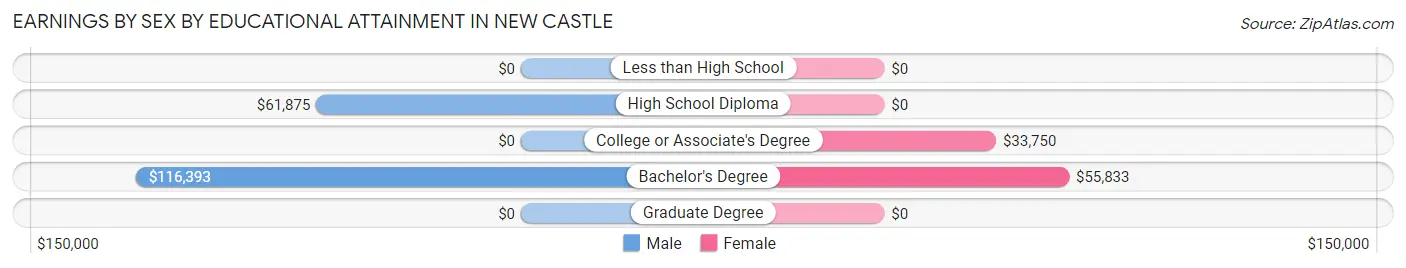
Earnings by Sex by Educational Attainment in New Castle
Average earnings in New Castle are $116,143 for men and $50,625 for women, a difference of 56.4%. Men with an educational attainment of bachelor's degree enjoy the highest average annual earnings of $116,393, while those with high school diploma education earn the least with $61,875. Women with an educational attainment of bachelor's degree earn the most with the average annual earnings of $55,833, while those with college or associate's degree education have the smallest earnings of $33,750.
| Educational Attainment | Male Income | Female Income |
| Less than High School | - | - |
| High School Diploma | $61,875 | $0 |
| College or Associate's Degree | - | - |
| Bachelor's Degree | $116,393 | $55,833 |
| Graduate Degree | - | - |
| Total | $116,143 | $50,625 |
Family Income in New Castle
Family Income Brackets in New Castle
According to the New Castle family income data, there are 47 families falling into the $150,000 to $199,999 income range, which is the most common income bracket and makes up 64.4% of all families.
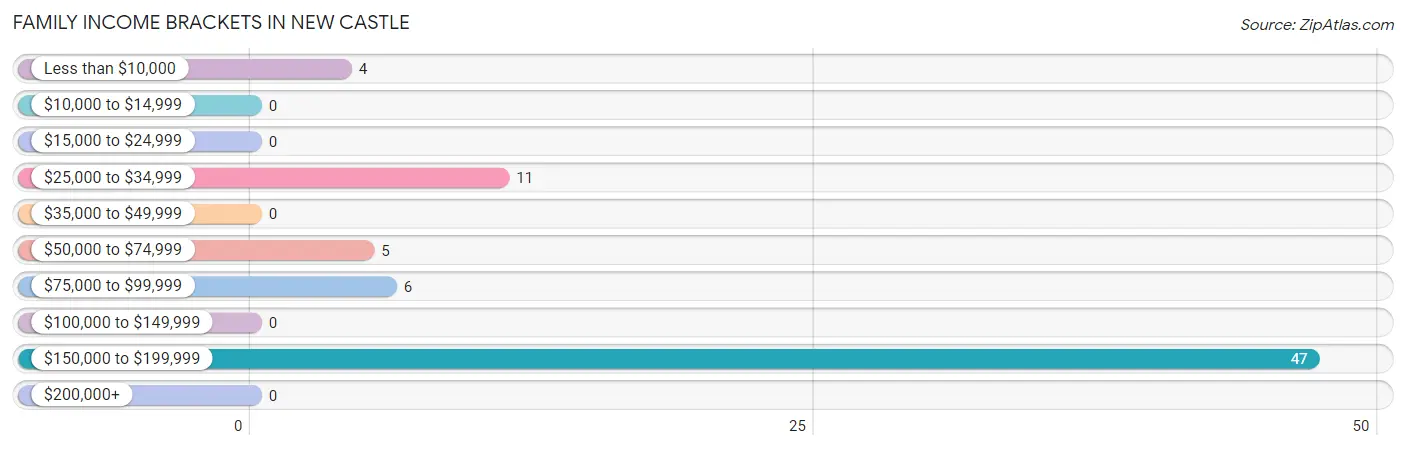
| Income Bracket | # Families | % Families |
| Less than $10,000 | 4 | 5.5% |
| $10,000 to $14,999 | 0 | 0.0% |
| $15,000 to $24,999 | 0 | 0.0% |
| $25,000 to $34,999 | 11 | 15.1% |
| $35,000 to $49,999 | 0 | 0.0% |
| $50,000 to $74,999 | 5 | 6.8% |
| $75,000 to $99,999 | 6 | 8.2% |
| $100,000 to $149,999 | 0 | 0.0% |
| $150,000 to $199,999 | 47 | 64.4% |
| $200,000+ | 0 | 0.0% |
Family Income by Famaliy Size in New Castle
4-person families (49 | 67.1%) account for the highest median family income in New Castle with $171,607 per family, while 4-person families (49 | 67.1%) have the highest median income of $42,902 per family member.
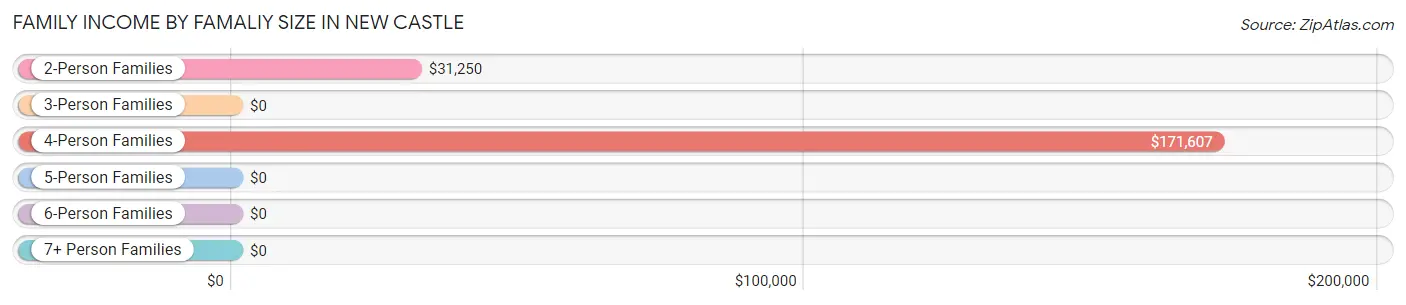
| Income Bracket | # Families | Median Income |
| 2-Person Families | 16 (21.9%) | $31,250 |
| 3-Person Families | 8 (11.0%) | $0 |
| 4-Person Families | 49 (67.1%) | $171,607 |
| 5-Person Families | 0 (0.0%) | $0 |
| 6-Person Families | 0 (0.0%) | $0 |
| 7+ Person Families | 0 (0.0%) | $0 |
| Total | 73 (100.0%) | $170,750 |
Family Income by Number of Earners in New Castle
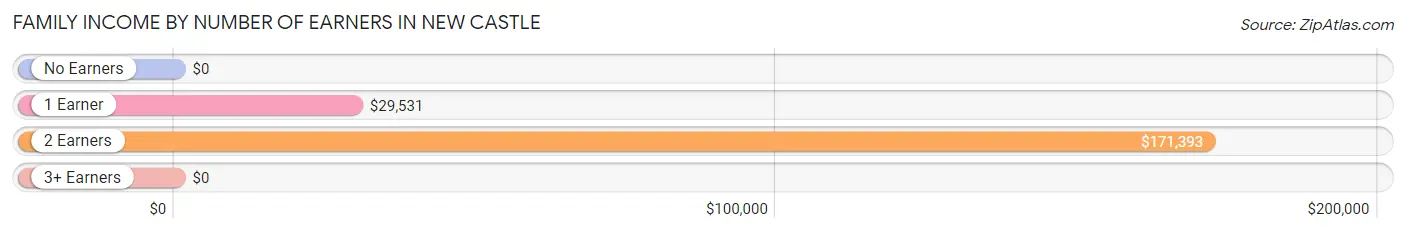
| Number of Earners | # Families | Median Income |
| No Earners | 1 (1.4%) | $0 |
| 1 Earner | 19 (26.0%) | $29,531 |
| 2 Earners | 51 (69.9%) | $171,393 |
| 3+ Earners | 2 (2.7%) | $0 |
| Total | 73 (100.0%) | $170,750 |
Household Income in New Castle
Household Income Brackets in New Castle
With 47 households falling in the category, the $150,000 to $199,999 income range is the most frequent in New Castle, accounting for 48.4% of all households.
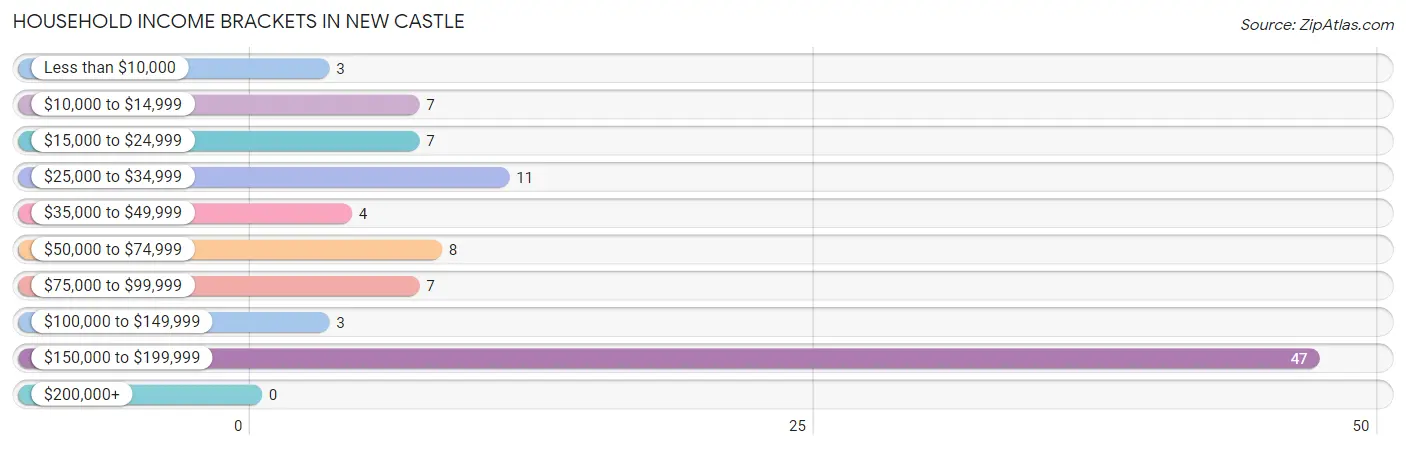
| Income Bracket | # Households | % Households |
| Less than $10,000 | 3 | 3.1% |
| $10,000 to $14,999 | 7 | 7.2% |
| $15,000 to $24,999 | 7 | 7.2% |
| $25,000 to $34,999 | 11 | 11.3% |
| $35,000 to $49,999 | 4 | 4.1% |
| $50,000 to $74,999 | 8 | 8.2% |
| $75,000 to $99,999 | 7 | 7.2% |
| $100,000 to $149,999 | 3 | 3.1% |
| $150,000 to $199,999 | 47 | 48.5% |
| $200,000+ | 0 | 0.0% |
Household Income by Householder Age in New Castle
The median household income in New Castle is $0, with the highest median household income of $170,464 found in the 25 to 44 years age bracket for the primary householder. A total of 57 households (58.8%) fall into this category. Meanwhile, the 15 to 24 years age bracket for the primary householder has the lowest median household income of $0, with 3 households (3.1%) in this group.
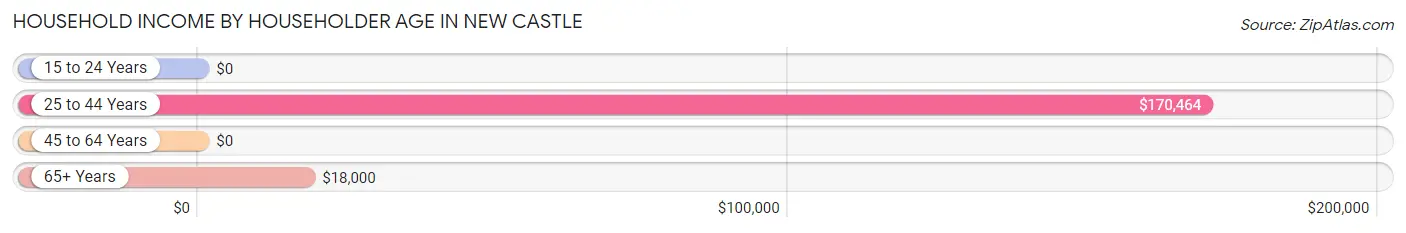
| Income Bracket | # Households | Median Income |
| 15 to 24 Years | 3 (3.1%) | $0 |
| 25 to 44 Years | 57 (58.8%) | $170,464 |
| 45 to 64 Years | 21 (21.6%) | $0 |
| 65+ Years | 16 (16.5%) | $18,000 |
| Total | 97 (100.0%) | $0 |
Poverty in New Castle
Income Below Poverty by Sex and Age in New Castle
With 9.8% poverty level for males and 14.8% for females among the residents of New Castle, under 5 year old males and 55 to 64 year old females are the most vulnerable to poverty, with 3 males (100.0%) and 4 females (100.0%) in their respective age groups living below the poverty level.
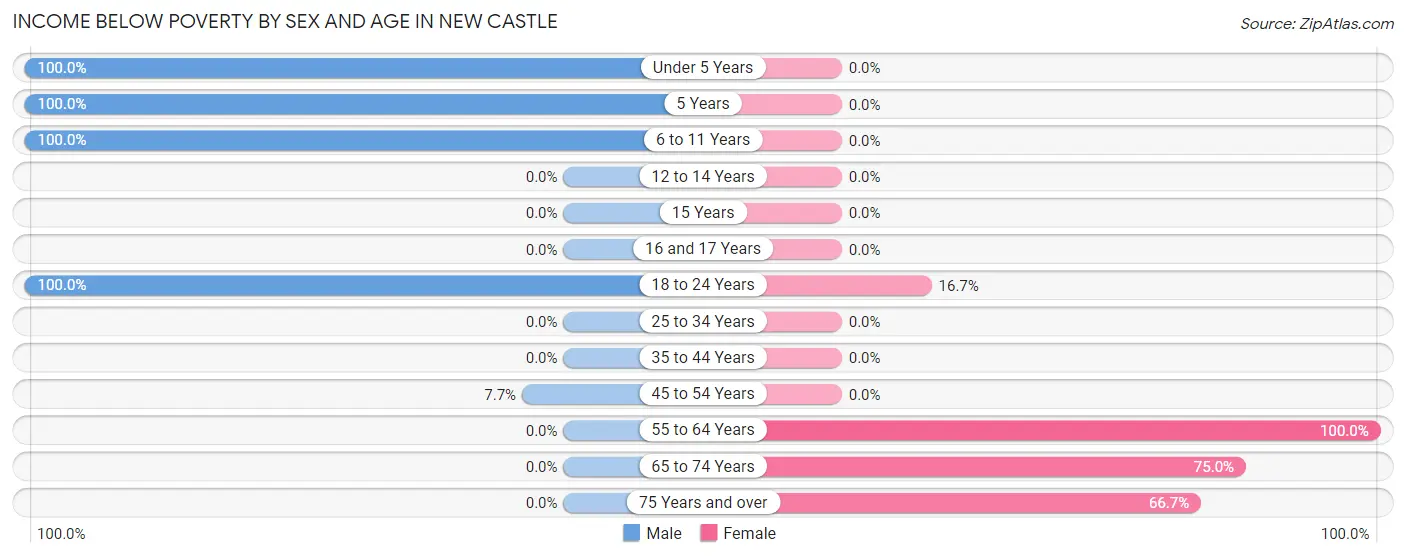
| Age Bracket | Male | Female |
| Under 5 Years | 3 (100.0%) | 0 (0.0%) |
| 5 Years | 2 (100.0%) | 0 (0.0%) |
| 6 to 11 Years | 1 (100.0%) | 0 (0.0%) |
| 12 to 14 Years | 0 (0.0%) | 0 (0.0%) |
| 15 Years | 0 (0.0%) | 0 (0.0%) |
| 16 and 17 Years | 0 (0.0%) | 0 (0.0%) |
| 18 to 24 Years | 1 (100.0%) | 3 (16.7%) |
| 25 to 34 Years | 0 (0.0%) | 0 (0.0%) |
| 35 to 44 Years | 0 (0.0%) | 0 (0.0%) |
| 45 to 54 Years | 1 (7.7%) | 0 (0.0%) |
| 55 to 64 Years | 0 (0.0%) | 4 (100.0%) |
| 65 to 74 Years | 0 (0.0%) | 12 (75.0%) |
| 75 Years and over | 0 (0.0%) | 2 (66.7%) |
| Total | 8 (9.8%) | 21 (14.8%) |
Income Above Poverty by Sex and Age in New Castle
According to the poverty statistics in New Castle, males aged 12 to 14 years and females aged under 5 years are the age groups that are most secure financially, with 100.0% of males and 100.0% of females in these age groups living above the poverty line.
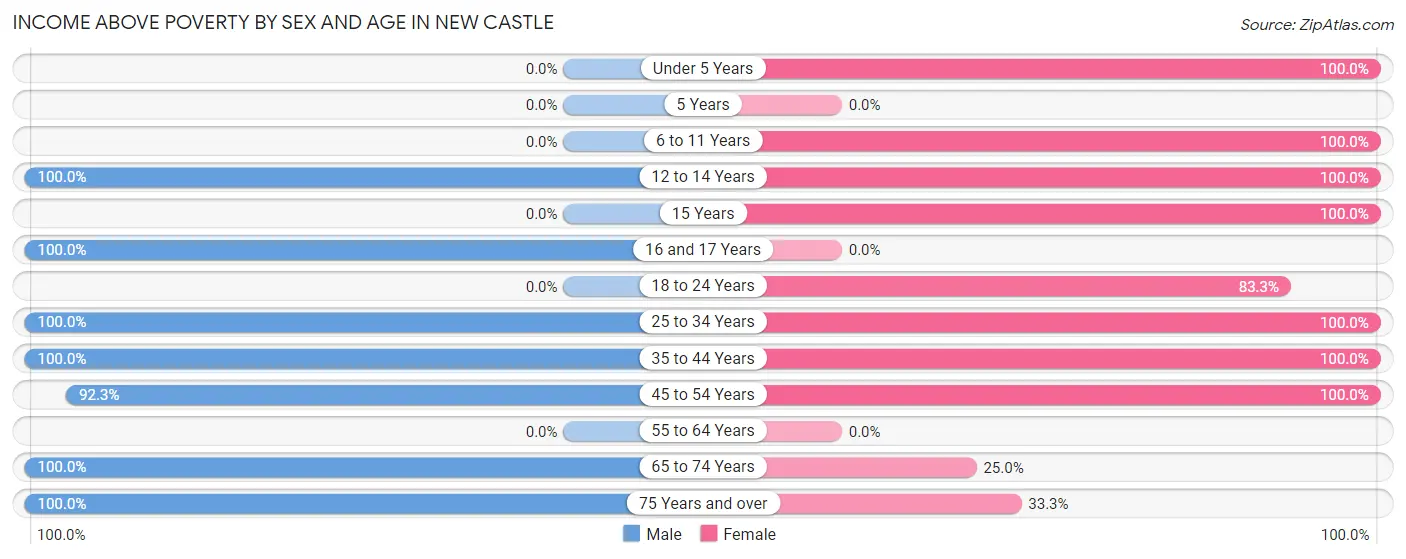
| Age Bracket | Male | Female |
| Under 5 Years | 0 (0.0%) | 24 (100.0%) |
| 5 Years | 0 (0.0%) | 0 (0.0%) |
| 6 to 11 Years | 0 (0.0%) | 22 (100.0%) |
| 12 to 14 Years | 11 (100.0%) | 1 (100.0%) |
| 15 Years | 0 (0.0%) | 3 (100.0%) |
| 16 and 17 Years | 1 (100.0%) | 0 (0.0%) |
| 18 to 24 Years | 0 (0.0%) | 15 (83.3%) |
| 25 to 34 Years | 43 (100.0%) | 31 (100.0%) |
| 35 to 44 Years | 3 (100.0%) | 6 (100.0%) |
| 45 to 54 Years | 12 (92.3%) | 14 (100.0%) |
| 55 to 64 Years | 0 (0.0%) | 0 (0.0%) |
| 65 to 74 Years | 3 (100.0%) | 4 (25.0%) |
| 75 Years and over | 1 (100.0%) | 1 (33.3%) |
| Total | 74 (90.2%) | 121 (85.2%) |
Income Below Poverty Among Married-Couple Families in New Castle
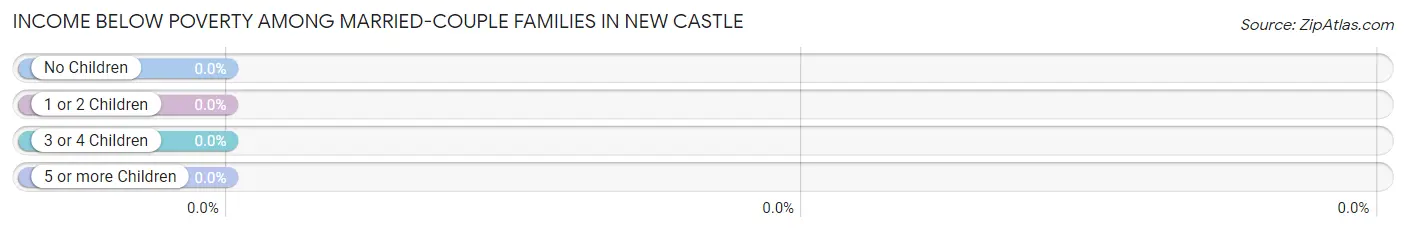
| Children | Above Poverty | Below Poverty |
| No Children | 0 (0.0%) | 0 (0.0%) |
| 1 or 2 Children | 53 (100.0%) | 0 (0.0%) |
| 3 or 4 Children | 0 (0.0%) | 0 (0.0%) |
| 5 or more Children | 0 (0.0%) | 0 (0.0%) |
| Total | 53 (100.0%) | 0 (0.0%) |
Income Below Poverty Among Single-Parent Households in New Castle
According to the poverty data in New Castle, 16.7% or 1 single-father households and 21.4% or 3 single-mother households are living below the poverty line. Among single-father households, those with 1 or 2 children have the highest poverty rate, with 1 households (16.7%) experiencing poverty. Likewise, among single-mother households, those with 1 or 2 children have the highest poverty rate, with 3 households (21.4%) falling below the poverty line.
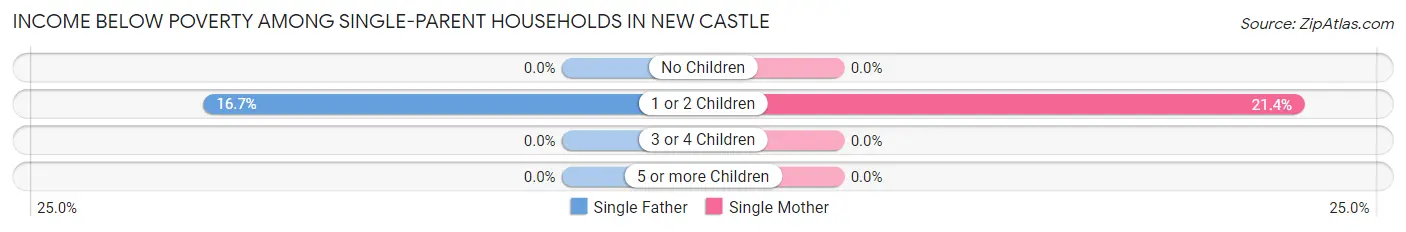
| Children | Single Father | Single Mother |
| No Children | 0 (0.0%) | 0 (0.0%) |
| 1 or 2 Children | 1 (16.7%) | 3 (21.4%) |
| 3 or 4 Children | 0 (0.0%) | 0 (0.0%) |
| 5 or more Children | 0 (0.0%) | 0 (0.0%) |
| Total | 1 (16.7%) | 3 (21.4%) |
Income Below Poverty Among Married-Couple vs Single-Parent Households in New Castle
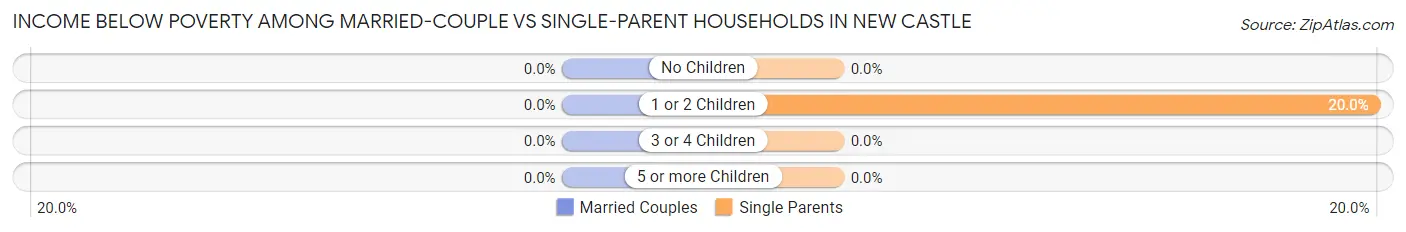
| Children | Married-Couple Families | Single-Parent Households |
| No Children | 0 (0.0%) | 0 (0.0%) |
| 1 or 2 Children | 0 (0.0%) | 4 (20.0%) |
| 3 or 4 Children | 0 (0.0%) | 0 (0.0%) |
| 5 or more Children | 0 (0.0%) | 0 (0.0%) |
| Total | 0 (0.0%) | 4 (20.0%) |
Race in New Castle
The most populous races in New Castle are , and White / Caucasian (224 | 100.0%).
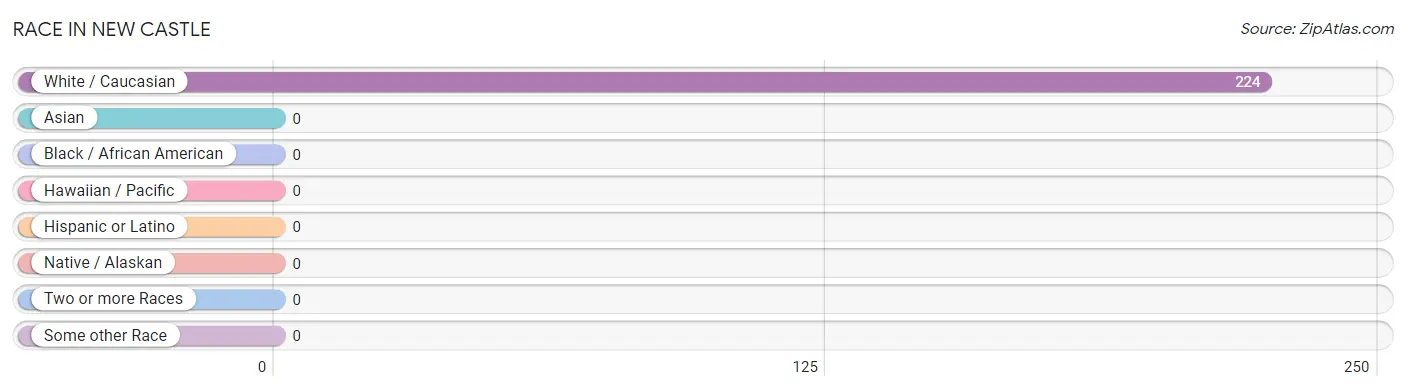
| Race | # Population | % Population |
| Asian | 0 | 0.0% |
| Black / African American | 0 | 0.0% |
| Hawaiian / Pacific | 0 | 0.0% |
| Hispanic or Latino | 0 | 0.0% |
| Native / Alaskan | 0 | 0.0% |
| White / Caucasian | 224 | 100.0% |
| Two or more Races | 0 | 0.0% |
| Some other Race | 0 | 0.0% |
| Total | 224 | 100.0% |
Ancestry in New Castle
The most populous ancestries reported in New Castle are Irish (80 | 35.7%), German (44 | 19.6%), American (18 | 8.0%), Dutch (14 | 6.2%), and French (4 | 1.8%), together accounting for 71.4% of all New Castle residents.
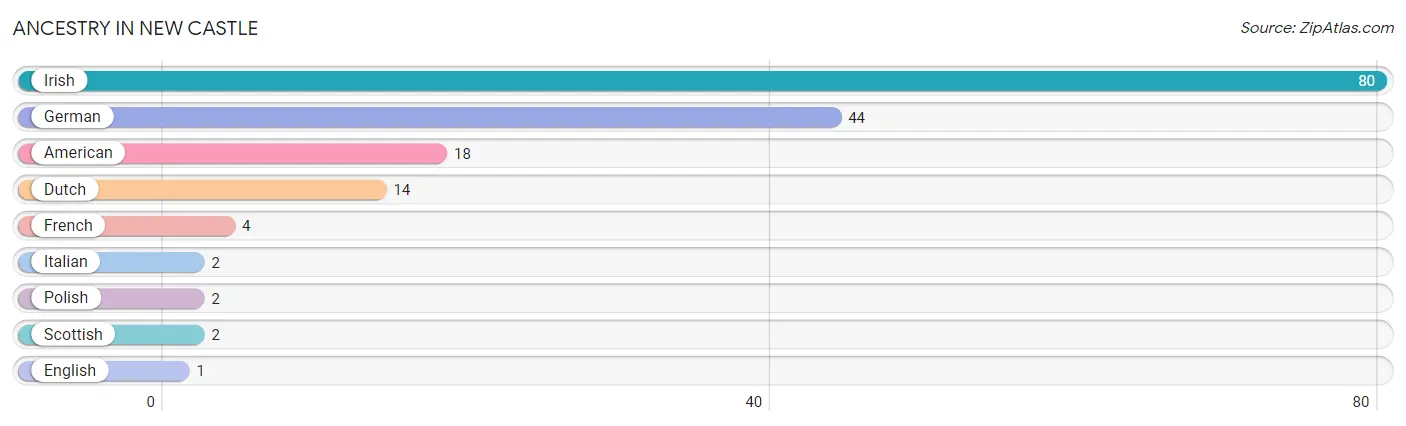
| Ancestry | # Population | % Population |
| American | 18 | 8.0% |
| Dutch | 14 | 6.2% |
| English | 1 | 0.4% |
| French | 4 | 1.8% |
| German | 44 | 19.6% |
| Irish | 80 | 35.7% |
| Italian | 2 | 0.9% |
| Polish | 2 | 0.9% |
| Scottish | 2 | 0.9% | View All 9 Rows |
Immigrants in New Castle

| Immigration Origin | # Population | % Population | View All 0 Rows |
Sex and Age in New Castle
Sex and Age in New Castle
The most populous age groups in New Castle are 30 to 34 Years (38 | 46.3%) for men and Under 5 Years (24 | 16.9%) for women.
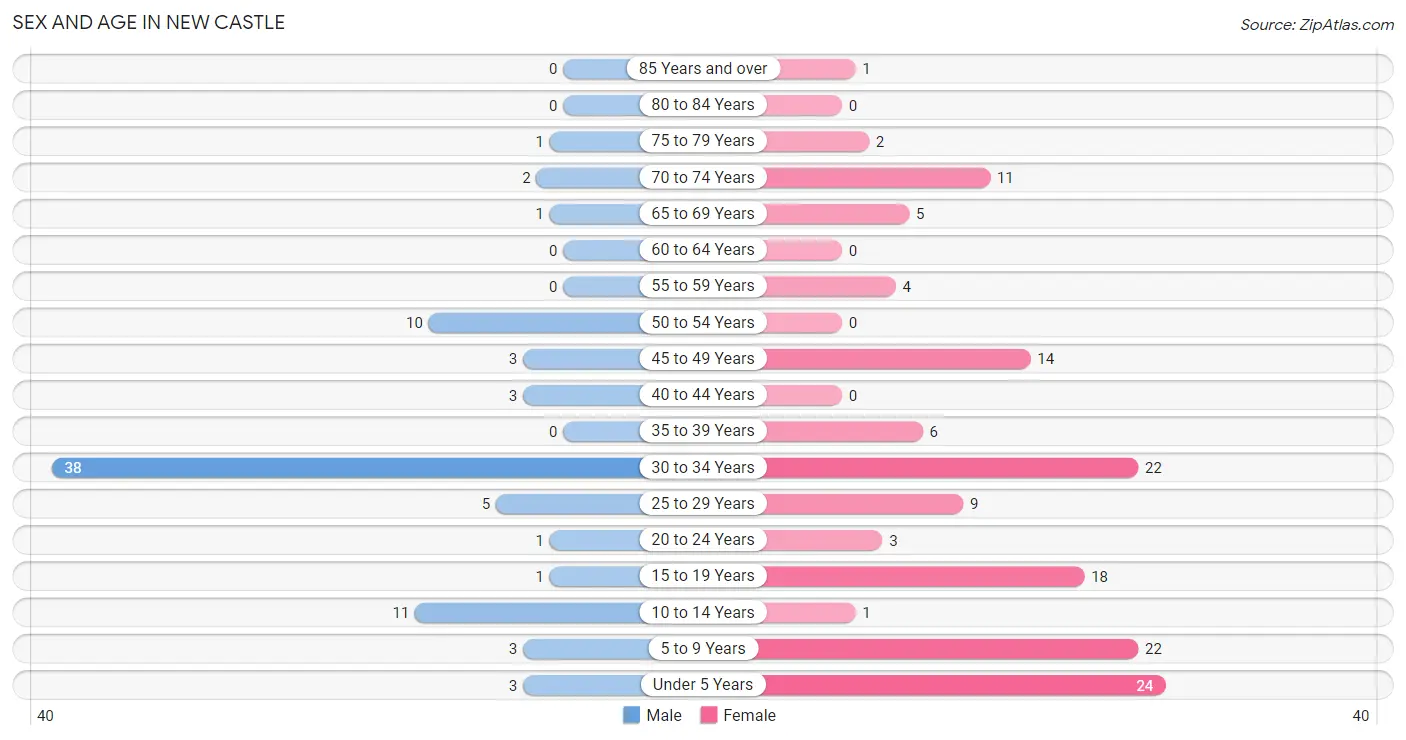
| Age Bracket | Male | Female |
| Under 5 Years | 3 (3.7%) | 24 (16.9%) |
| 5 to 9 Years | 3 (3.7%) | 22 (15.5%) |
| 10 to 14 Years | 11 (13.4%) | 1 (0.7%) |
| 15 to 19 Years | 1 (1.2%) | 18 (12.7%) |
| 20 to 24 Years | 1 (1.2%) | 3 (2.1%) |
| 25 to 29 Years | 5 (6.1%) | 9 (6.3%) |
| 30 to 34 Years | 38 (46.3%) | 22 (15.5%) |
| 35 to 39 Years | 0 (0.0%) | 6 (4.2%) |
| 40 to 44 Years | 3 (3.7%) | 0 (0.0%) |
| 45 to 49 Years | 3 (3.7%) | 14 (9.9%) |
| 50 to 54 Years | 10 (12.2%) | 0 (0.0%) |
| 55 to 59 Years | 0 (0.0%) | 4 (2.8%) |
| 60 to 64 Years | 0 (0.0%) | 0 (0.0%) |
| 65 to 69 Years | 1 (1.2%) | 5 (3.5%) |
| 70 to 74 Years | 2 (2.4%) | 11 (7.7%) |
| 75 to 79 Years | 1 (1.2%) | 2 (1.4%) |
| 80 to 84 Years | 0 (0.0%) | 0 (0.0%) |
| 85 Years and over | 0 (0.0%) | 1 (0.7%) |
| Total | 82 (100.0%) | 142 (100.0%) |
Families and Households in New Castle
Median Family Size in New Castle
The median family size in New Castle is 2.60 persons per family, with married-couple families (53 | 72.6%) accounting for the largest median family size of 2.81 persons per family. On the other hand, single female/mother families (14 | 19.2%) represent the smallest median family size with 1.86 persons per family.
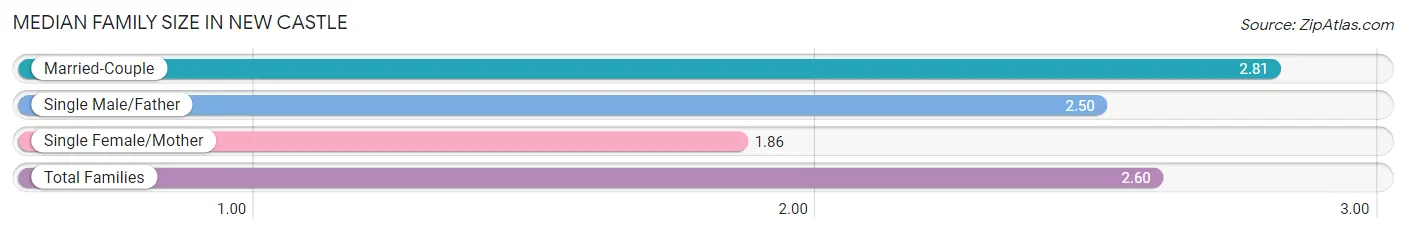
| Family Type | # Families | Family Size |
| Married-Couple | 53 (72.6%) | 2.81 |
| Single Male/Father | 6 (8.2%) | 2.50 |
| Single Female/Mother | 14 (19.2%) | 1.86 |
| Total Families | 73 (100.0%) | 2.60 |
Median Household Size in New Castle
The median household size in New Castle is 2.31 persons per household, with single male/father households (6 | 6.2%) accounting for the largest median household size of 3 persons per household. non-family households (24 | 24.7%) represent the smallest median household size with 1.25 persons per household.
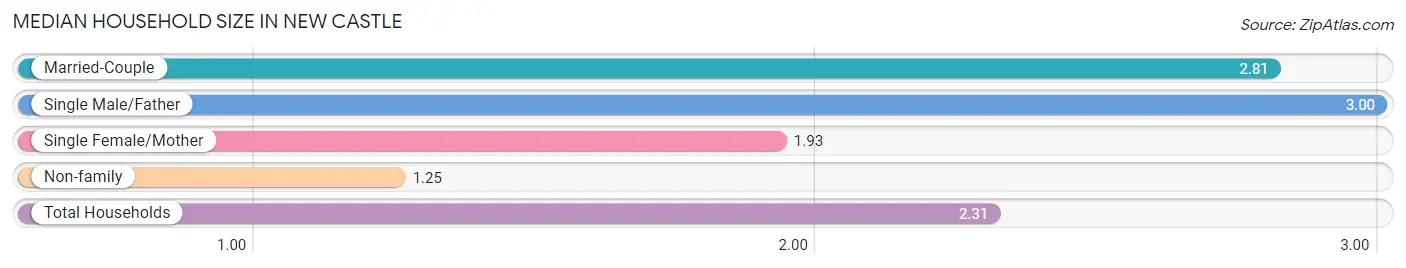
| Household Type | # Households | Household Size |
| Married-Couple | 53 (54.6%) | 2.81 |
| Single Male/Father | 6 (6.2%) | 3.00 |
| Single Female/Mother | 14 (14.4%) | 1.93 |
| Non-family | 24 (24.7%) | 1.25 |
| Total Households | 97 (100.0%) | 2.31 |
Household Size by Marriage Status in New Castle
Out of a total of 97 households in New Castle, 73 (75.3%) are family households, while 24 (24.7%) are nonfamily households. The most numerous type of family households are 4-person households, comprising 53, and the most common type of nonfamily households are 1-person households, comprising 19.
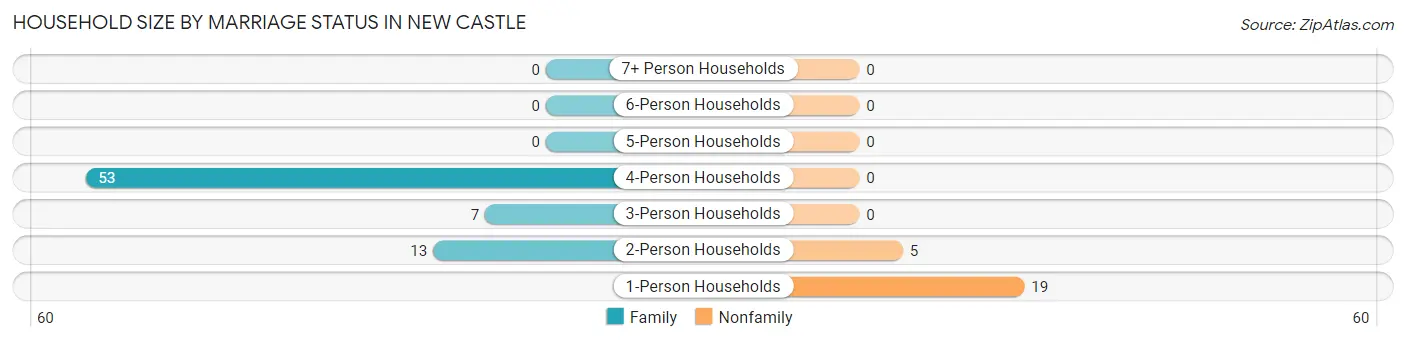
| Household Size | Family Households | Nonfamily Households |
| 1-Person Households | - | 19 (19.6%) |
| 2-Person Households | 13 (13.4%) | 5 (5.1%) |
| 3-Person Households | 7 (7.2%) | 0 (0.0%) |
| 4-Person Households | 53 (54.6%) | 0 (0.0%) |
| 5-Person Households | 0 (0.0%) | 0 (0.0%) |
| 6-Person Households | 0 (0.0%) | 0 (0.0%) |
| 7+ Person Households | 0 (0.0%) | 0 (0.0%) |
| Total | 73 (75.3%) | 24 (24.7%) |
Female Fertility in New Castle
Fertility by Age in New Castle
| Age Bracket | Women with Births | Births / 1,000 Women |
| 15 to 19 years | 0 (0.0%) | 0.0 |
| 20 to 34 years | 0 (0.0%) | 0.0 |
| 35 to 50 years | 0 (0.0%) | 0.0 |
| Total | 0 (0.0%) | 0.0 |
Fertility by Age by Marriage Status in New Castle
| Age Bracket | Married | Unmarried |
| 15 to 19 years | 0 (0.0%) | 0 (0.0%) |
| 20 to 34 years | 0 (0.0%) | 0 (0.0%) |
| 35 to 50 years | 0 (0.0%) | 0 (0.0%) |
| Total | 0 (0.0%) | 0 (0.0%) |
Fertility by Education in New Castle
| Educational Attainment | Women with Births | Births / 1,000 Women |
| Less than High School | 0 (0.0%) | 0.0 |
| High School Diploma | 0 (0.0%) | 0.0 |
| College or Associate's Degree | 0 (0.0%) | 0.0 |
| Bachelor's Degree | 0 (0.0%) | 0.0 |
| Graduate Degree | 0 (0.0%) | 0.0 |
| Total | 0 (0.0%) | 0.0 |
Fertility by Education by Marriage Status in New Castle
| Educational Attainment | Married | Unmarried |
| Less than High School | 0 (0.0%) | 0 (0.0%) |
| High School Diploma | 0 (0.0%) | 0 (0.0%) |
| College or Associate's Degree | 0 (0.0%) | 0 (0.0%) |
| Bachelor's Degree | 0 (0.0%) | 0 (0.0%) |
| Graduate Degree | 0 (0.0%) | 0 (0.0%) |
| Total | 0 (0.0%) | 0 (0.0%) |
Employment Characteristics in New Castle
Employment by Class of Employer in New Castle
Among the 109 employed individuals in New Castle, private company employees (87 | 79.8%), local government employees (12 | 11.0%), and not-for-profit organizations (10 | 9.2%) make up the most common classes of employment.
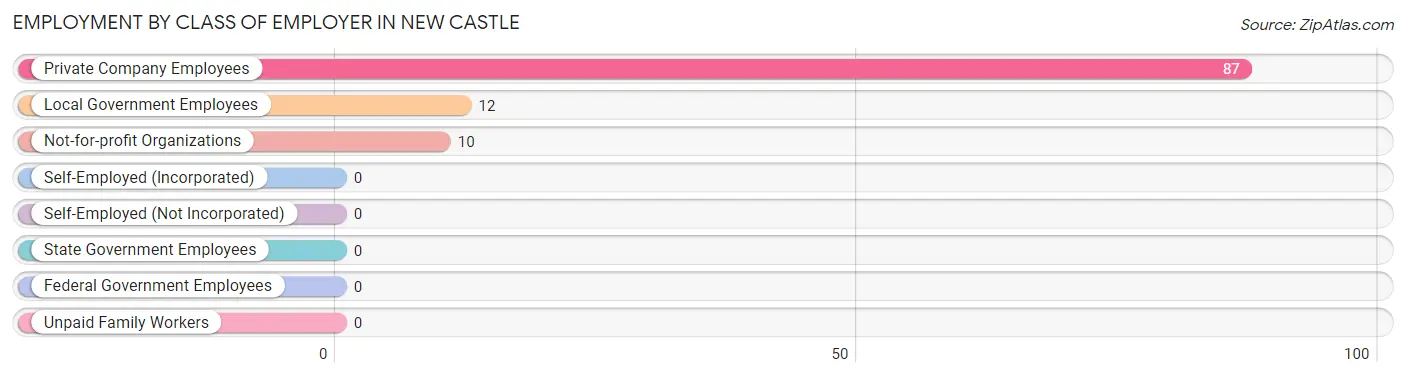
| Employer Class | # Employees | % Employees |
| Private Company Employees | 87 | 79.8% |
| Self-Employed (Incorporated) | 0 | 0.0% |
| Self-Employed (Not Incorporated) | 0 | 0.0% |
| Not-for-profit Organizations | 10 | 9.2% |
| Local Government Employees | 12 | 11.0% |
| State Government Employees | 0 | 0.0% |
| Federal Government Employees | 0 | 0.0% |
| Unpaid Family Workers | 0 | 0.0% |
| Total | 109 | 100.0% |
Employment Status by Age in New Castle
According to the labor force statistics for New Castle, out of the total population over 16 years of age (157), 73.2% or 115 individuals are in the labor force, with 2.6% or 3 of them unemployed. The age group with the highest labor force participation rate is 20 to 24 years, with 100.0% or 4 individuals in the labor force. Within the labor force, the 16 to 19 years age range has the highest percentage of unemployed individuals, with 100.0% or 2 of them being unemployed.
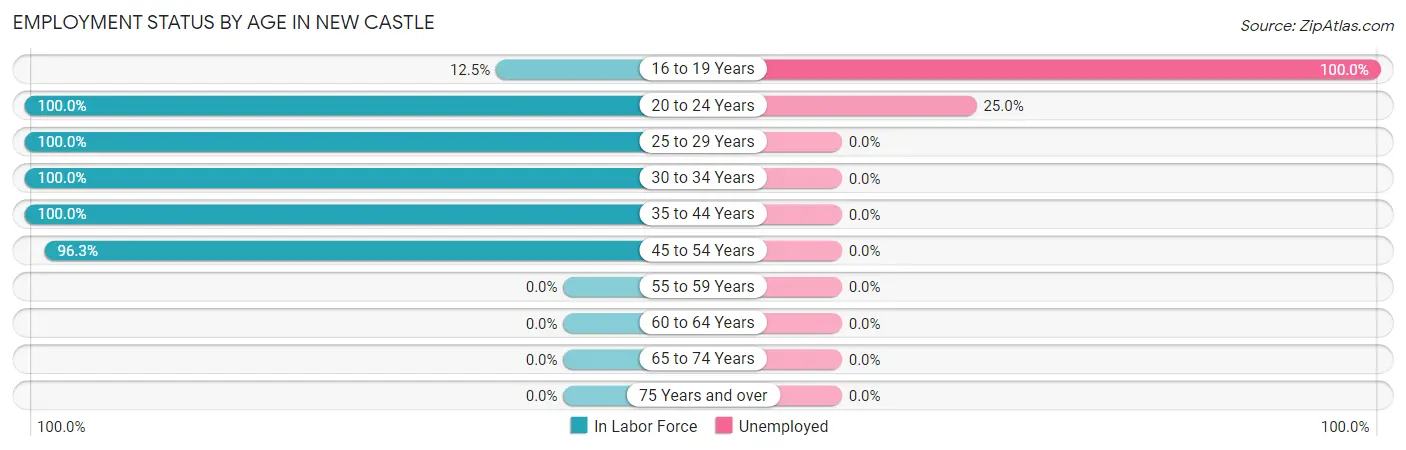
| Age Bracket | In Labor Force | Unemployed |
| 16 to 19 Years | 2 (12.5%) | 2 (100.0%) |
| 20 to 24 Years | 4 (100.0%) | 1 (25.0%) |
| 25 to 29 Years | 14 (100.0%) | 0 (0.0%) |
| 30 to 34 Years | 60 (100.0%) | 0 (0.0%) |
| 35 to 44 Years | 9 (100.0%) | 0 (0.0%) |
| 45 to 54 Years | 26 (96.3%) | 0 (0.0%) |
| 55 to 59 Years | 0 (0.0%) | 0 (0.0%) |
| 60 to 64 Years | 0 (0.0%) | 0 (0.0%) |
| 65 to 74 Years | 0 (0.0%) | 0 (0.0%) |
| 75 Years and over | 0 (0.0%) | 0 (0.0%) |
| Total | 115 (73.2%) | 3 (2.6%) |
Employment Status by Educational Attainment in New Castle
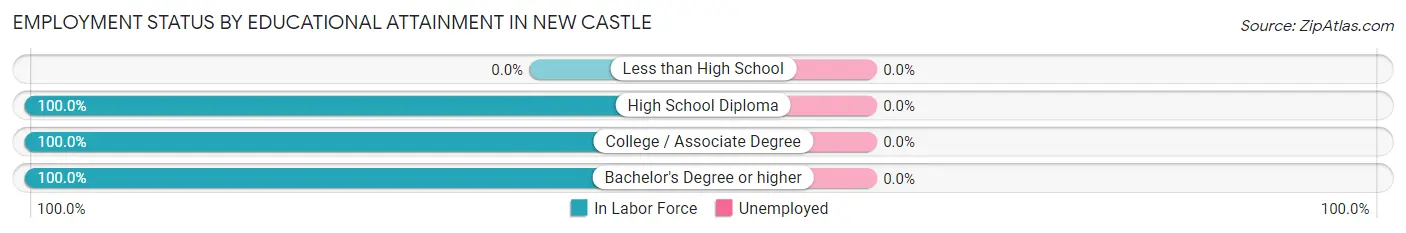
| Educational Attainment | In Labor Force | Unemployed |
| Less than High School | 0 (0.0%) | 0 (0.0%) |
| High School Diploma | 15 (100.0%) | 0 (0.0%) |
| College / Associate Degree | 15 (100.0%) | 0 (0.0%) |
| Bachelor's Degree or higher | 79 (100.0%) | 0 (0.0%) |
| Total | 109 (95.6%) | 0 (0.0%) |
Employment Occupations by Sex in New Castle
Management, Business, Science and Arts Occupations
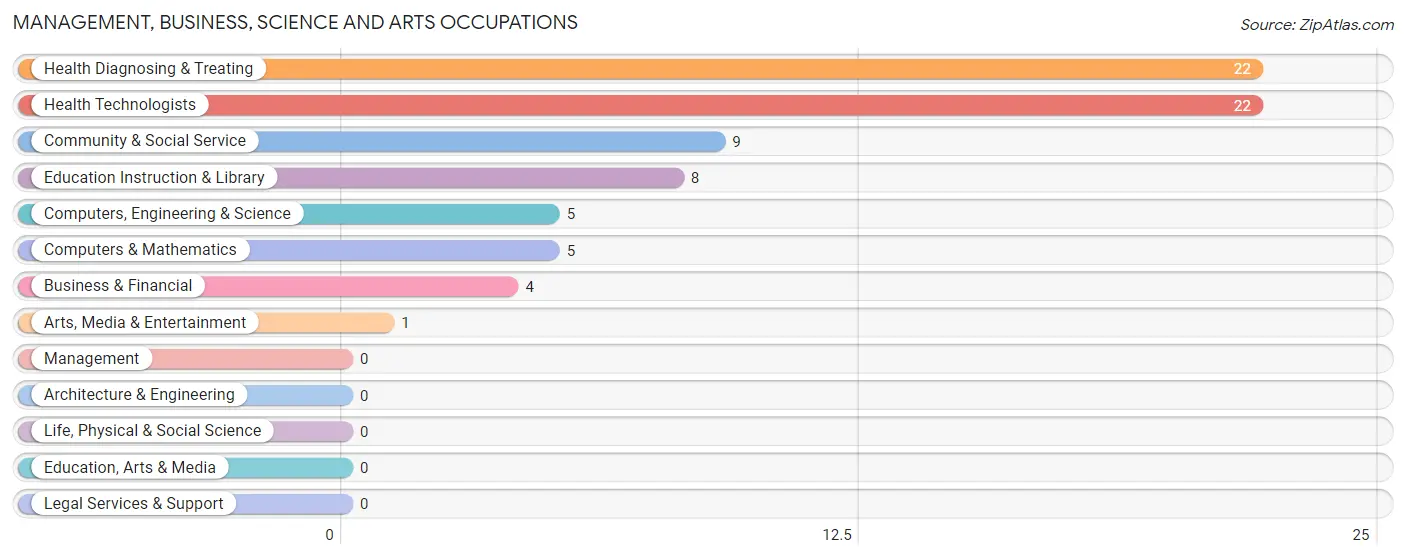
The most common Management, Business, Science and Arts occupations in New Castle are Health Diagnosing & Treating (22 | 19.6%), Health Technologists (22 | 19.6%), Community & Social Service (9 | 8.0%), Education Instruction & Library (8 | 7.1%), and Computers, Engineering & Science (5 | 4.5%).
Management, Business, Science and Arts Occupations by Sex
Within the Management, Business, Science and Arts occupations in New Castle, the most male-oriented occupations are Computers, Engineering & Science (100.0%), Computers & Mathematics (100.0%), and Arts, Media & Entertainment (100.0%), while the most female-oriented occupations are Business & Financial (100.0%), Education Instruction & Library (100.0%), and Health Diagnosing & Treating (100.0%).
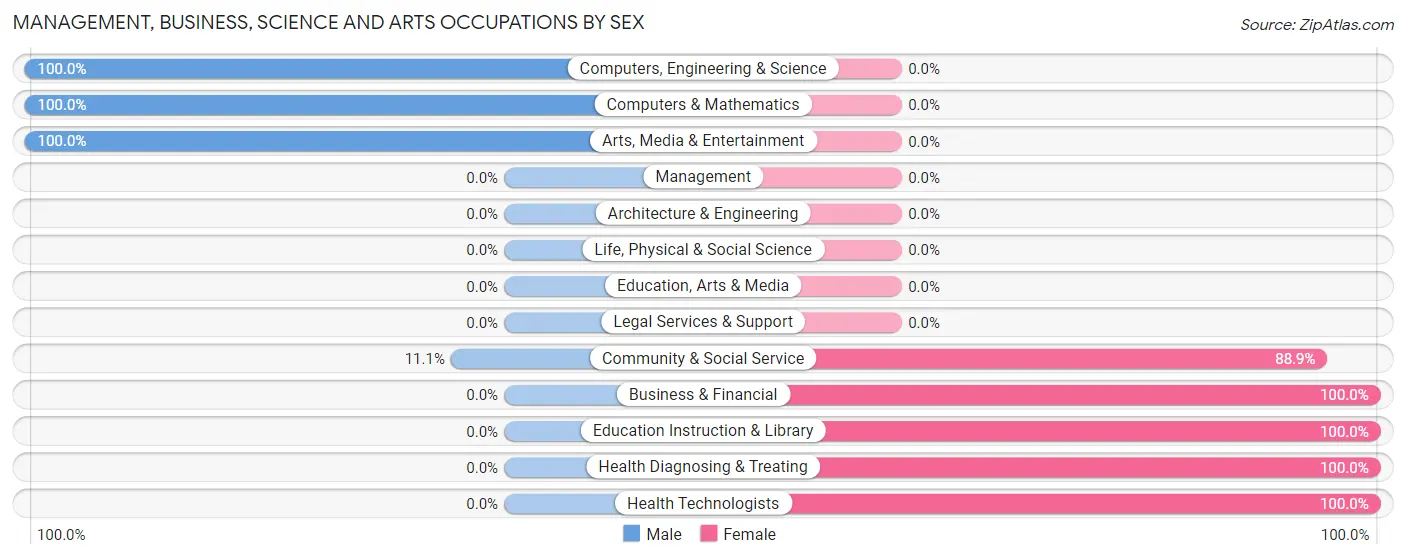
| Occupation | Male | Female |
| Management | 0 (0.0%) | 0 (0.0%) |
| Business & Financial | 0 (0.0%) | 4 (100.0%) |
| Computers, Engineering & Science | 5 (100.0%) | 0 (0.0%) |
| Computers & Mathematics | 5 (100.0%) | 0 (0.0%) |
| Architecture & Engineering | 0 (0.0%) | 0 (0.0%) |
| Life, Physical & Social Science | 0 (0.0%) | 0 (0.0%) |
| Community & Social Service | 1 (11.1%) | 8 (88.9%) |
| Education, Arts & Media | 0 (0.0%) | 0 (0.0%) |
| Legal Services & Support | 0 (0.0%) | 0 (0.0%) |
| Education Instruction & Library | 0 (0.0%) | 8 (100.0%) |
| Arts, Media & Entertainment | 1 (100.0%) | 0 (0.0%) |
| Health Diagnosing & Treating | 0 (0.0%) | 22 (100.0%) |
| Health Technologists | 0 (0.0%) | 22 (100.0%) |
| Total (Category) | 6 (15.0%) | 34 (85.0%) |
| Total (Overall) | 58 (51.8%) | 54 (48.2%) |
Services Occupations
The most common Services occupations in New Castle are Personal Care & Service (4 | 3.6%), Security & Protection (3 | 2.7%), Firefighting & Prevention (3 | 2.7%), and Food Preparation & Serving (3 | 2.7%).
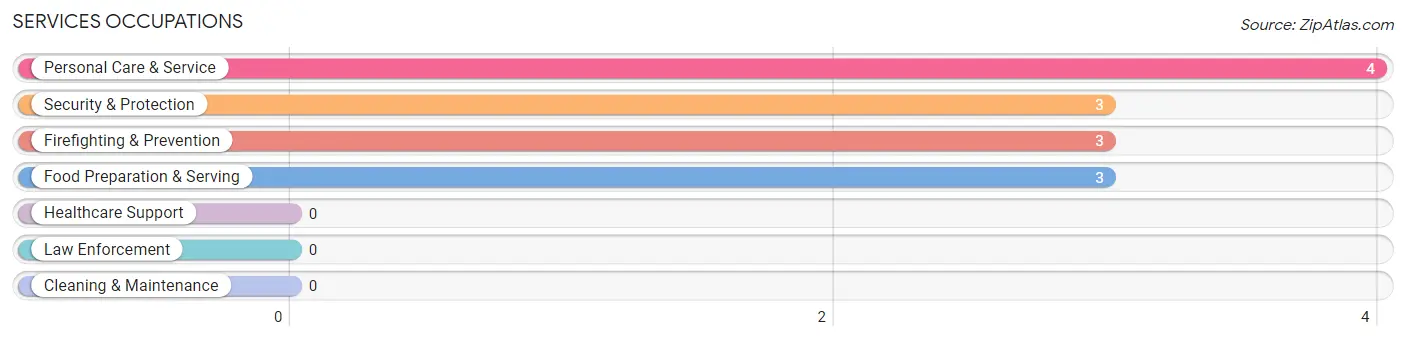
Services Occupations by Sex
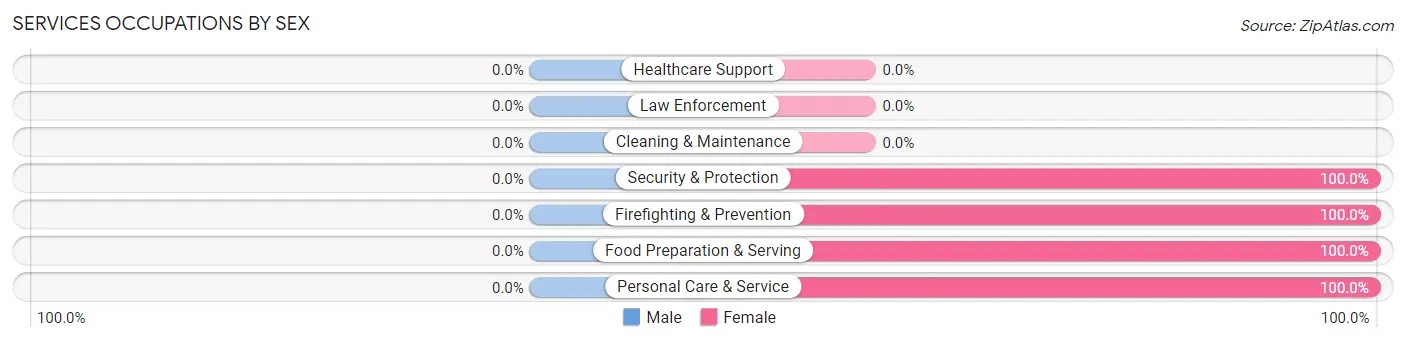
| Occupation | Male | Female |
| Healthcare Support | 0 (0.0%) | 0 (0.0%) |
| Security & Protection | 0 (0.0%) | 3 (100.0%) |
| Firefighting & Prevention | 0 (0.0%) | 3 (100.0%) |
| Law Enforcement | 0 (0.0%) | 0 (0.0%) |
| Food Preparation & Serving | 0 (0.0%) | 3 (100.0%) |
| Cleaning & Maintenance | 0 (0.0%) | 0 (0.0%) |
| Personal Care & Service | 0 (0.0%) | 4 (100.0%) |
| Total (Category) | 0 (0.0%) | 10 (100.0%) |
| Total (Overall) | 58 (51.8%) | 54 (48.2%) |
Sales and Office Occupations
The most common Sales and Office occupations in New Castle are Sales & Related (10 | 8.9%), and Office & Administration (10 | 8.9%).
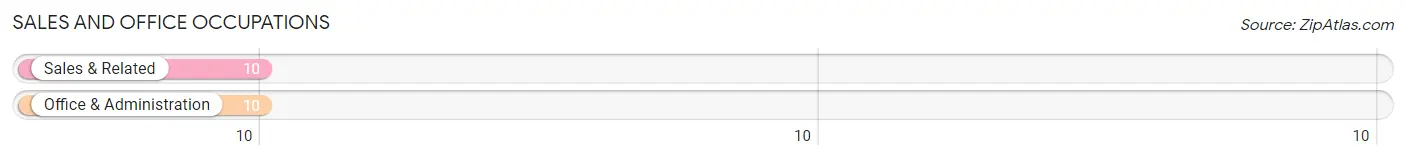
Sales and Office Occupations by Sex

| Occupation | Male | Female |
| Sales & Related | 10 (100.0%) | 0 (0.0%) |
| Office & Administration | 0 (0.0%) | 10 (100.0%) |
| Total (Category) | 10 (50.0%) | 10 (50.0%) |
| Total (Overall) | 58 (51.8%) | 54 (48.2%) |
Natural Resources, Construction and Maintenance Occupations
The most common Natural Resources, Construction and Maintenance occupations in New Castle are , and Installation, Maintenance & Repair (2 | 1.8%).
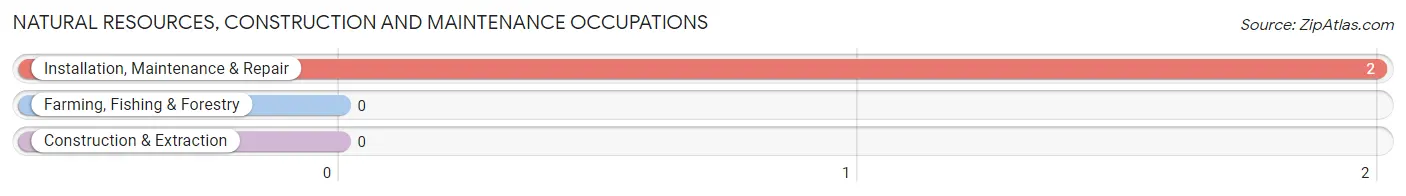
Natural Resources, Construction and Maintenance Occupations by Sex
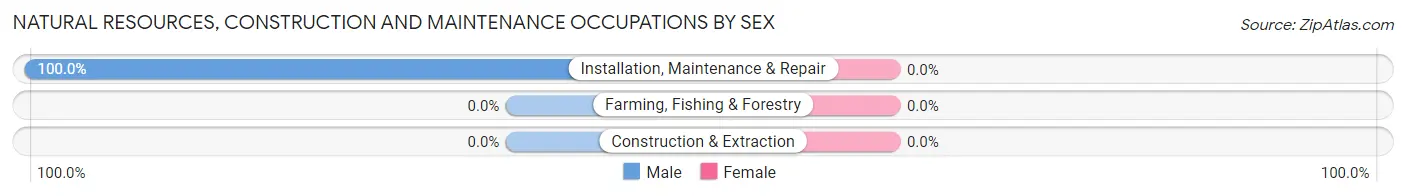
| Occupation | Male | Female |
| Farming, Fishing & Forestry | 0 (0.0%) | 0 (0.0%) |
| Construction & Extraction | 0 (0.0%) | 0 (0.0%) |
| Installation, Maintenance & Repair | 2 (100.0%) | 0 (0.0%) |
| Total (Category) | 2 (100.0%) | 0 (0.0%) |
| Total (Overall) | 58 (51.8%) | 54 (48.2%) |
Production, Transportation and Moving Occupations
The most common Production, Transportation and Moving occupations in New Castle are , and Production (40 | 35.7%).
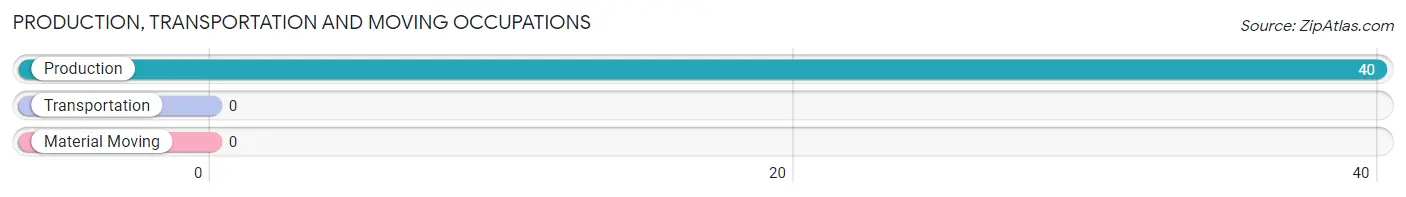
Production, Transportation and Moving Occupations by Sex
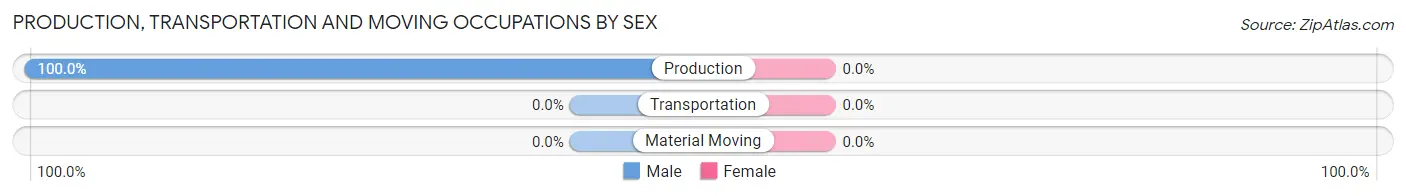
| Occupation | Male | Female |
| Production | 40 (100.0%) | 0 (0.0%) |
| Transportation | 0 (0.0%) | 0 (0.0%) |
| Material Moving | 0 (0.0%) | 0 (0.0%) |
| Total (Category) | 40 (100.0%) | 0 (0.0%) |
| Total (Overall) | 58 (51.8%) | 54 (48.2%) |
Employment Industries by Sex in New Castle
Employment Industries in New Castle
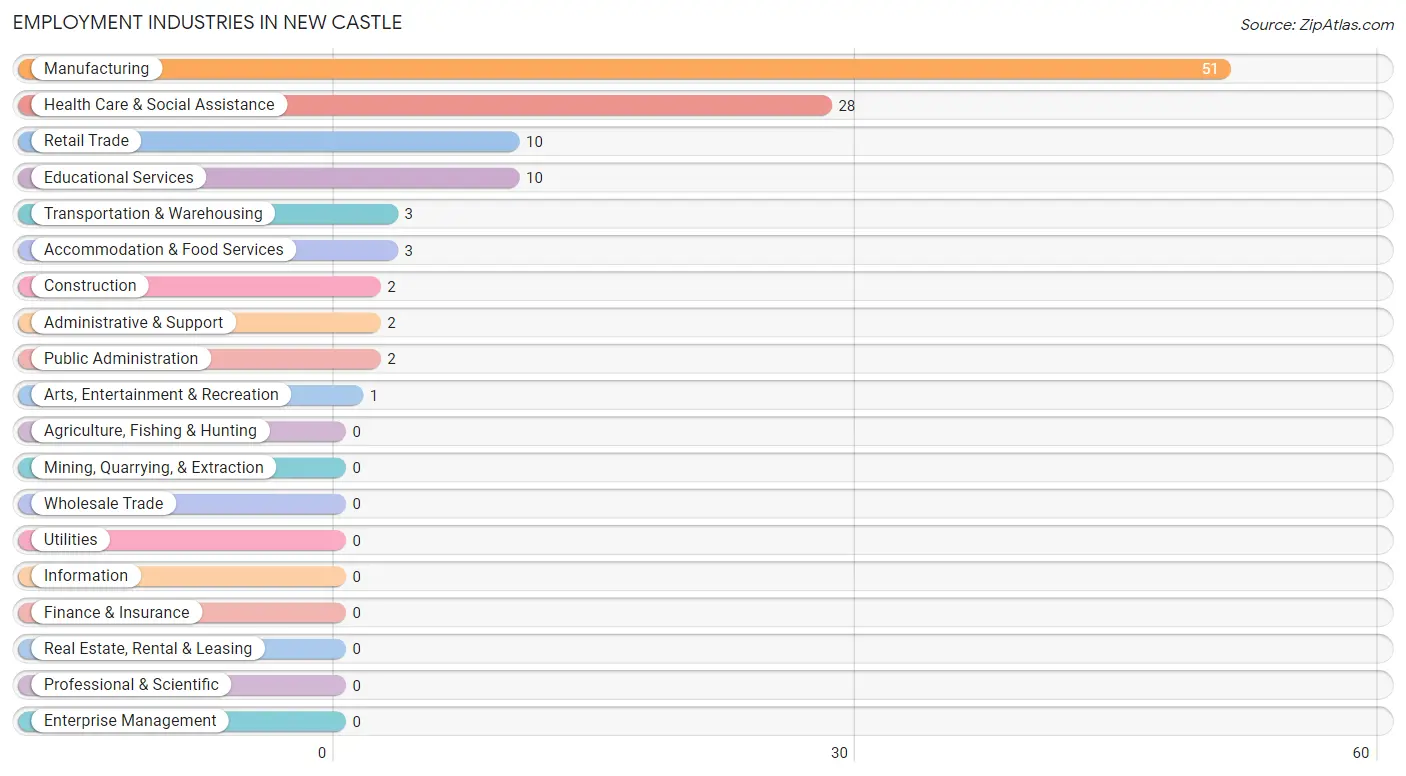
The major employment industries in New Castle include Manufacturing (51 | 45.5%), Health Care & Social Assistance (28 | 25.0%), Retail Trade (10 | 8.9%), Educational Services (10 | 8.9%), and Transportation & Warehousing (3 | 2.7%).
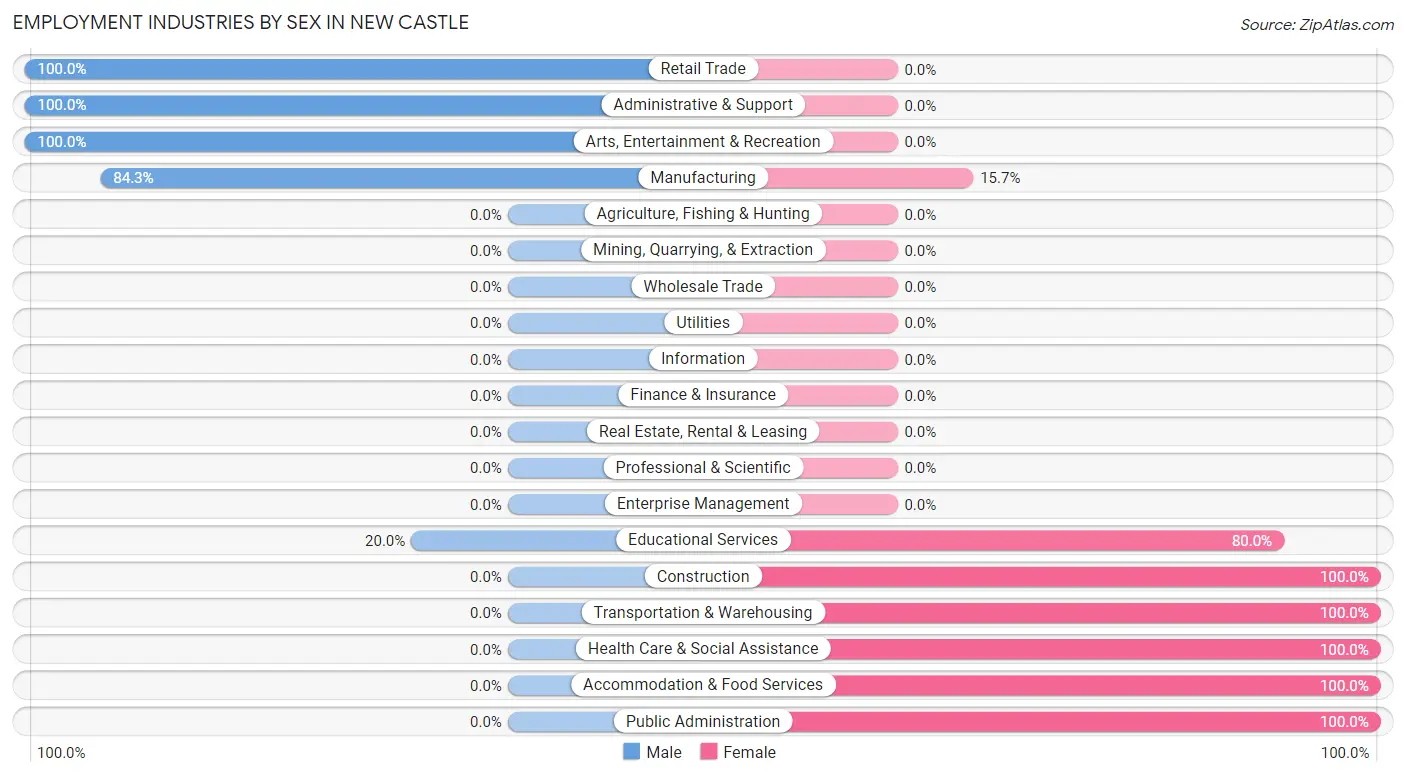
Employment Industries by Sex in New Castle
The New Castle industries that see more men than women are Retail Trade (100.0%), Administrative & Support (100.0%), and Arts, Entertainment & Recreation (100.0%), whereas the industries that tend to have a higher number of women are Construction (100.0%), Transportation & Warehousing (100.0%), and Health Care & Social Assistance (100.0%).
| Industry | Male | Female |
| Agriculture, Fishing & Hunting | 0 (0.0%) | 0 (0.0%) |
| Mining, Quarrying, & Extraction | 0 (0.0%) | 0 (0.0%) |
| Construction | 0 (0.0%) | 2 (100.0%) |
| Manufacturing | 43 (84.3%) | 8 (15.7%) |
| Wholesale Trade | 0 (0.0%) | 0 (0.0%) |
| Retail Trade | 10 (100.0%) | 0 (0.0%) |
| Transportation & Warehousing | 0 (0.0%) | 3 (100.0%) |
| Utilities | 0 (0.0%) | 0 (0.0%) |
| Information | 0 (0.0%) | 0 (0.0%) |
| Finance & Insurance | 0 (0.0%) | 0 (0.0%) |
| Real Estate, Rental & Leasing | 0 (0.0%) | 0 (0.0%) |
| Professional & Scientific | 0 (0.0%) | 0 (0.0%) |
| Enterprise Management | 0 (0.0%) | 0 (0.0%) |
| Administrative & Support | 2 (100.0%) | 0 (0.0%) |
| Educational Services | 2 (20.0%) | 8 (80.0%) |
| Health Care & Social Assistance | 0 (0.0%) | 28 (100.0%) |
| Arts, Entertainment & Recreation | 1 (100.0%) | 0 (0.0%) |
| Accommodation & Food Services | 0 (0.0%) | 3 (100.0%) |
| Public Administration | 0 (0.0%) | 2 (100.0%) |
| Total | 58 (51.8%) | 54 (48.2%) |
Education in New Castle
School Enrollment in New Castle
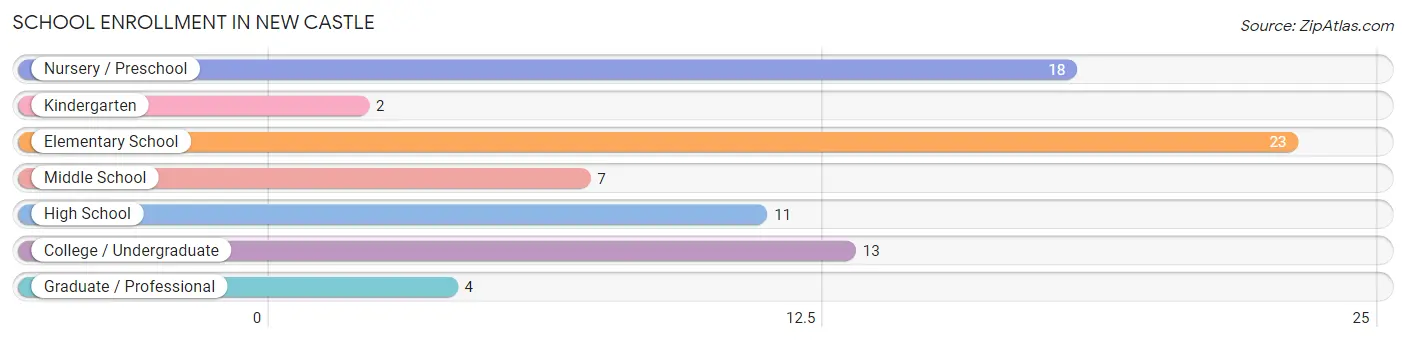
The most common levels of schooling among the 78 students in New Castle are elementary school (23 | 29.5%), nursery / preschool (18 | 23.1%), and college / undergraduate (13 | 16.7%).
| School Level | # Students | % Students |
| Nursery / Preschool | 18 | 23.1% |
| Kindergarten | 2 | 2.6% |
| Elementary School | 23 | 29.5% |
| Middle School | 7 | 9.0% |
| High School | 11 | 14.1% |
| College / Undergraduate | 13 | 16.7% |
| Graduate / Professional | 4 | 5.1% |
| Total | 78 | 100.0% |
School Enrollment by Age by Funding Source in New Castle
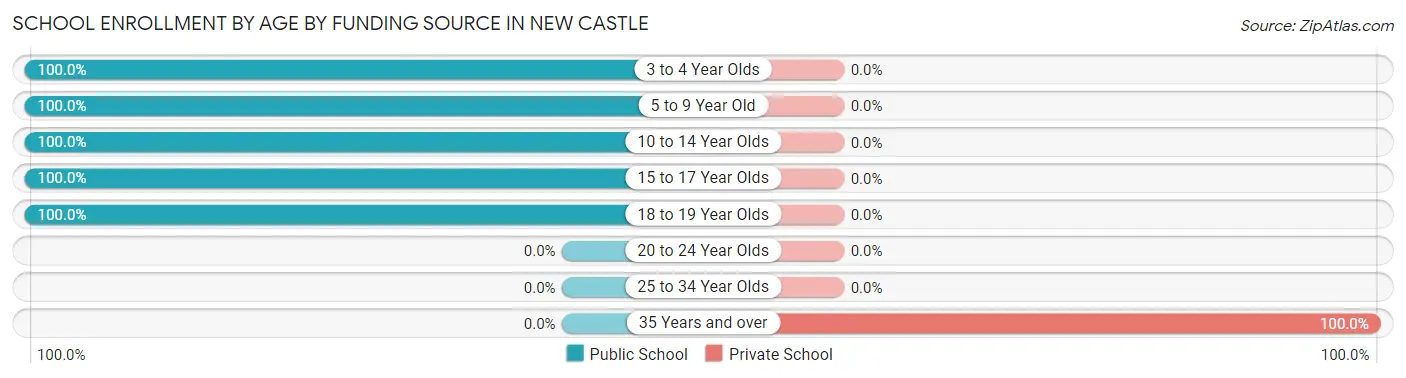
Out of a total of 78 students who are enrolled in schools in New Castle, 4 (5.1%) attend a private institution, while the remaining 74 (94.9%) are enrolled in public schools. The age group of 35 years and over has the highest likelihood of being enrolled in private schools, with 4 (100.0% in the age bracket) enrolled. Conversely, the age group of 3 to 4 year olds has the lowest likelihood of being enrolled in a private school, with 18 (100.0% in the age bracket) attending a public institution.
| Age Bracket | Public School | Private School |
| 3 to 4 Year Olds | 18 (100.0%) | 0 (0.0%) |
| 5 to 9 Year Old | 25 (100.0%) | 0 (0.0%) |
| 10 to 14 Year Olds | 12 (100.0%) | 0 (0.0%) |
| 15 to 17 Year Olds | 4 (100.0%) | 0 (0.0%) |
| 18 to 19 Year Olds | 15 (100.0%) | 0 (0.0%) |
| 20 to 24 Year Olds | 0 (0.0%) | 0 (0.0%) |
| 25 to 34 Year Olds | 0 (0.0%) | 0 (0.0%) |
| 35 Years and over | 0 (0.0%) | 4 (100.0%) |
| Total | 74 (94.9%) | 4 (5.1%) |
Educational Attainment by Field of Study in New Castle
Literature & languages (35 | 44.3%), science & technology (18 | 22.8%), business (10 | 12.7%), liberal arts & history (5 | 6.3%), and visual & performing arts (5 | 6.3%) are the most common fields of study among 79 individuals in New Castle who have obtained a bachelor's degree or higher.
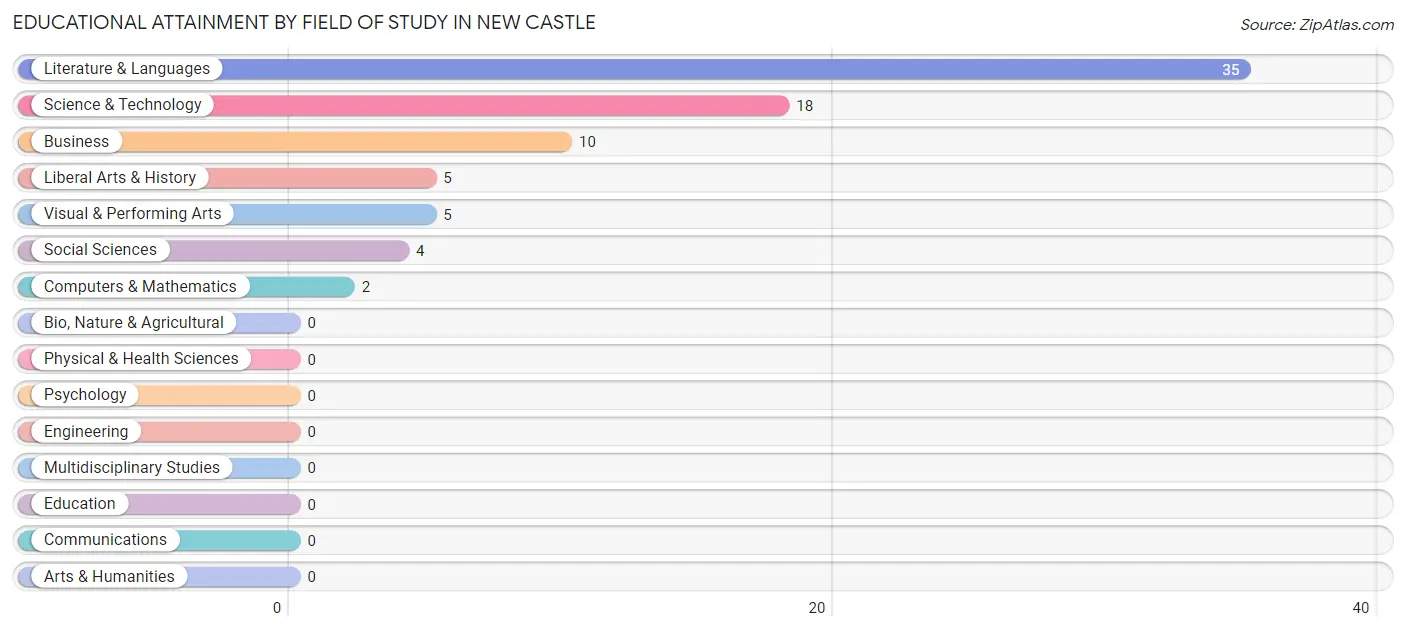
| Field of Study | # Graduates | % Graduates |
| Computers & Mathematics | 2 | 2.5% |
| Bio, Nature & Agricultural | 0 | 0.0% |
| Physical & Health Sciences | 0 | 0.0% |
| Psychology | 0 | 0.0% |
| Social Sciences | 4 | 5.1% |
| Engineering | 0 | 0.0% |
| Multidisciplinary Studies | 0 | 0.0% |
| Science & Technology | 18 | 22.8% |
| Business | 10 | 12.7% |
| Education | 0 | 0.0% |
| Literature & Languages | 35 | 44.3% |
| Liberal Arts & History | 5 | 6.3% |
| Visual & Performing Arts | 5 | 6.3% |
| Communications | 0 | 0.0% |
| Arts & Humanities | 0 | 0.0% |
| Total | 79 | 100.0% |
Transportation & Commute in New Castle
Vehicle Availability by Sex in New Castle
The most prevalent vehicle ownership categories in New Castle are males with 1 vehicle (37, accounting for 67.3%) and females with 1 vehicle (37, making up 68.5%).
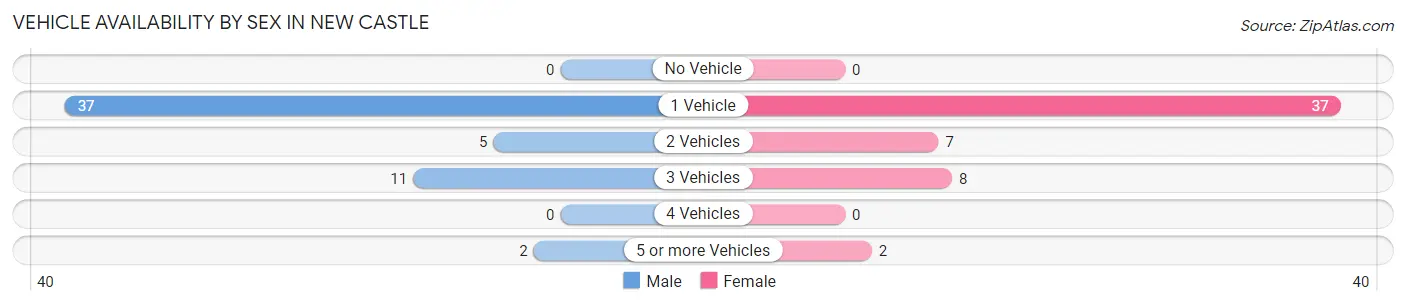
| Vehicles Available | Male | Female |
| No Vehicle | 0 (0.0%) | 0 (0.0%) |
| 1 Vehicle | 37 (67.3%) | 37 (68.5%) |
| 2 Vehicles | 5 (9.1%) | 7 (13.0%) |
| 3 Vehicles | 11 (20.0%) | 8 (14.8%) |
| 4 Vehicles | 0 (0.0%) | 0 (0.0%) |
| 5 or more Vehicles | 2 (3.6%) | 2 (3.7%) |
| Total | 55 (100.0%) | 54 (100.0%) |
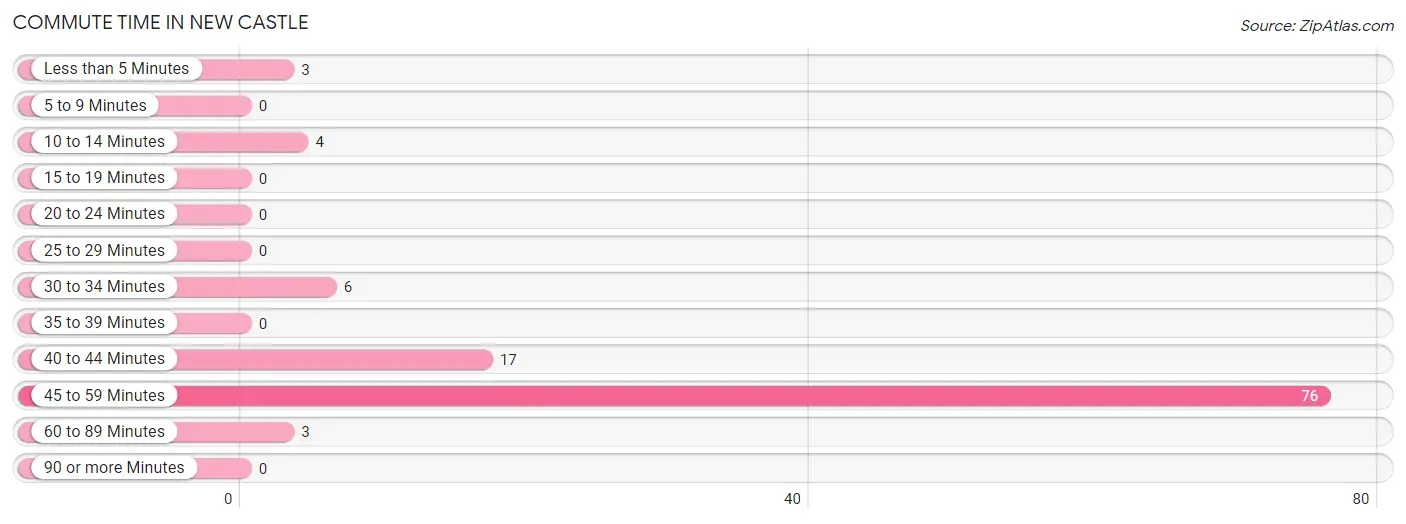
Commute Time in New Castle
The most frequently occuring commute durations in New Castle are 45 to 59 minutes (76 commuters, 69.7%), 40 to 44 minutes (17 commuters, 15.6%), and 30 to 34 minutes (6 commuters, 5.5%).
| Commute Time | # Commuters | % Commuters |
| Less than 5 Minutes | 3 | 2.8% |
| 5 to 9 Minutes | 0 | 0.0% |
| 10 to 14 Minutes | 4 | 3.7% |
| 15 to 19 Minutes | 0 | 0.0% |
| 20 to 24 Minutes | 0 | 0.0% |
| 25 to 29 Minutes | 0 | 0.0% |
| 30 to 34 Minutes | 6 | 5.5% |
| 35 to 39 Minutes | 0 | 0.0% |
| 40 to 44 Minutes | 17 | 15.6% |
| 45 to 59 Minutes | 76 | 69.7% |
| 60 to 89 Minutes | 3 | 2.8% |
| 90 or more Minutes | 0 | 0.0% |
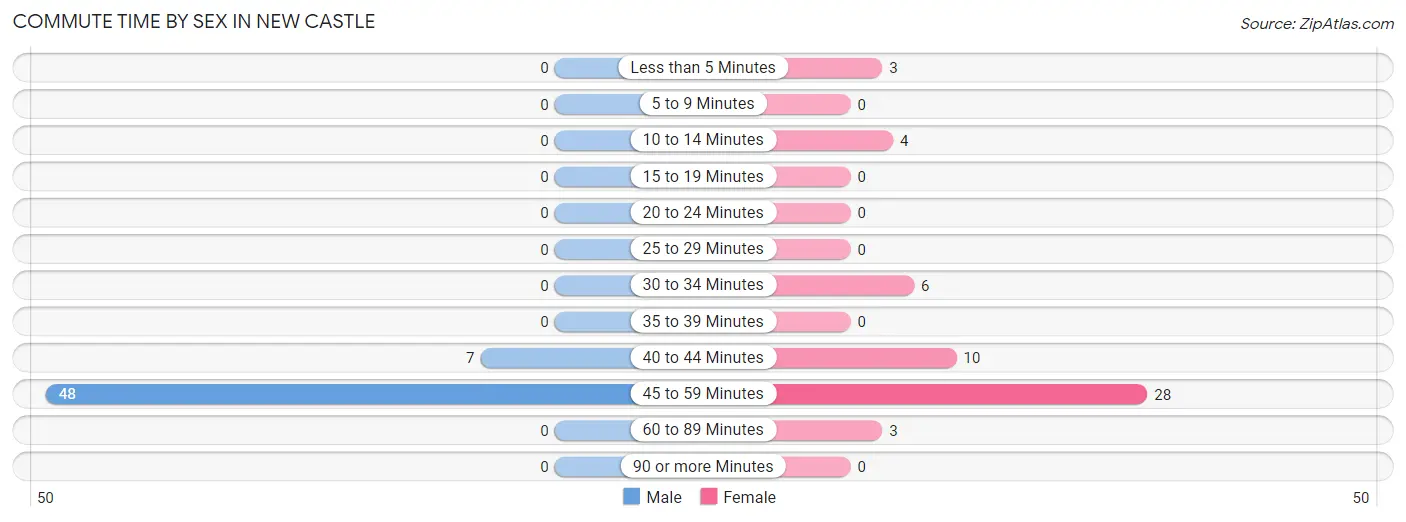
Commute Time by Sex in New Castle
The most common commute times in New Castle are 45 to 59 minutes (48 commuters, 87.3%) for males and 45 to 59 minutes (28 commuters, 51.8%) for females.
| Commute Time | Male | Female |
| Less than 5 Minutes | 0 (0.0%) | 3 (5.6%) |
| 5 to 9 Minutes | 0 (0.0%) | 0 (0.0%) |
| 10 to 14 Minutes | 0 (0.0%) | 4 (7.4%) |
| 15 to 19 Minutes | 0 (0.0%) | 0 (0.0%) |
| 20 to 24 Minutes | 0 (0.0%) | 0 (0.0%) |
| 25 to 29 Minutes | 0 (0.0%) | 0 (0.0%) |
| 30 to 34 Minutes | 0 (0.0%) | 6 (11.1%) |
| 35 to 39 Minutes | 0 (0.0%) | 0 (0.0%) |
| 40 to 44 Minutes | 7 (12.7%) | 10 (18.5%) |
| 45 to 59 Minutes | 48 (87.3%) | 28 (51.8%) |
| 60 to 89 Minutes | 0 (0.0%) | 3 (5.6%) |
| 90 or more Minutes | 0 (0.0%) | 0 (0.0%) |
Time of Departure to Work by Sex in New Castle
The most frequent times of departure to work in New Castle are 12:00 AM to 4:59 AM (35, 63.6%) for males and 7:00 AM to 7:29 AM (37, 68.5%) for females.
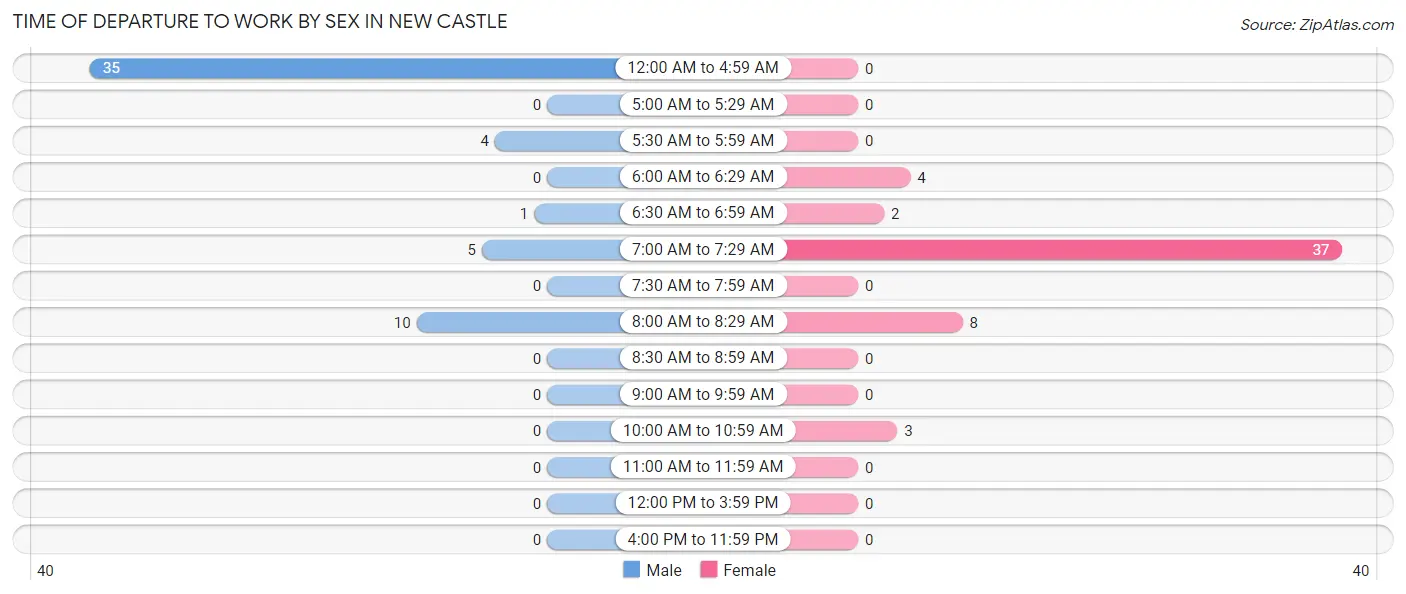
| Time of Departure | Male | Female |
| 12:00 AM to 4:59 AM | 35 (63.6%) | 0 (0.0%) |
| 5:00 AM to 5:29 AM | 0 (0.0%) | 0 (0.0%) |
| 5:30 AM to 5:59 AM | 4 (7.3%) | 0 (0.0%) |
| 6:00 AM to 6:29 AM | 0 (0.0%) | 4 (7.4%) |
| 6:30 AM to 6:59 AM | 1 (1.8%) | 2 (3.7%) |
| 7:00 AM to 7:29 AM | 5 (9.1%) | 37 (68.5%) |
| 7:30 AM to 7:59 AM | 0 (0.0%) | 0 (0.0%) |
| 8:00 AM to 8:29 AM | 10 (18.2%) | 8 (14.8%) |
| 8:30 AM to 8:59 AM | 0 (0.0%) | 0 (0.0%) |
| 9:00 AM to 9:59 AM | 0 (0.0%) | 0 (0.0%) |
| 10:00 AM to 10:59 AM | 0 (0.0%) | 3 (5.6%) |
| 11:00 AM to 11:59 AM | 0 (0.0%) | 0 (0.0%) |
| 12:00 PM to 3:59 PM | 0 (0.0%) | 0 (0.0%) |
| 4:00 PM to 11:59 PM | 0 (0.0%) | 0 (0.0%) |
| Total | 55 (100.0%) | 54 (100.0%) |
Housing Occupancy in New Castle
Occupancy by Ownership in New Castle
Of the total 97 dwellings in New Castle, owner-occupied units account for 60 (61.9%), while renter-occupied units make up 37 (38.1%).
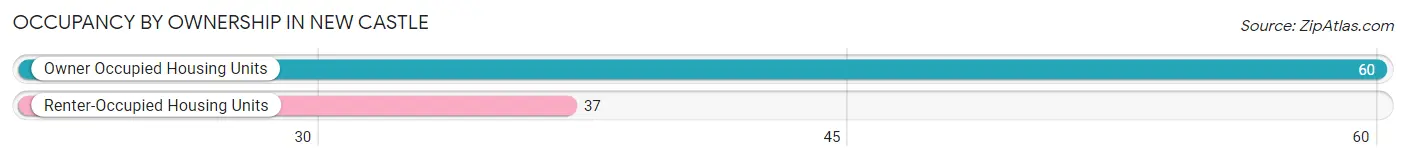
| Occupancy | # Housing Units | % Housing Units |
| Owner Occupied Housing Units | 60 | 61.9% |
| Renter-Occupied Housing Units | 37 | 38.1% |
| Total Occupied Housing Units | 97 | 100.0% |
Occupancy by Household Size in New Castle
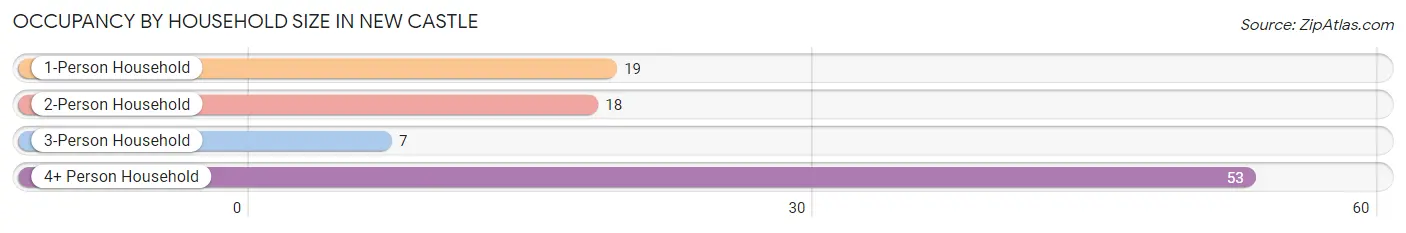
| Household Size | # Housing Units | % Housing Units |
| 1-Person Household | 19 | 19.6% |
| 2-Person Household | 18 | 18.6% |
| 3-Person Household | 7 | 7.2% |
| 4+ Person Household | 53 | 54.6% |
| Total Housing Units | 97 | 100.0% |
Occupancy by Ownership by Household Size in New Castle
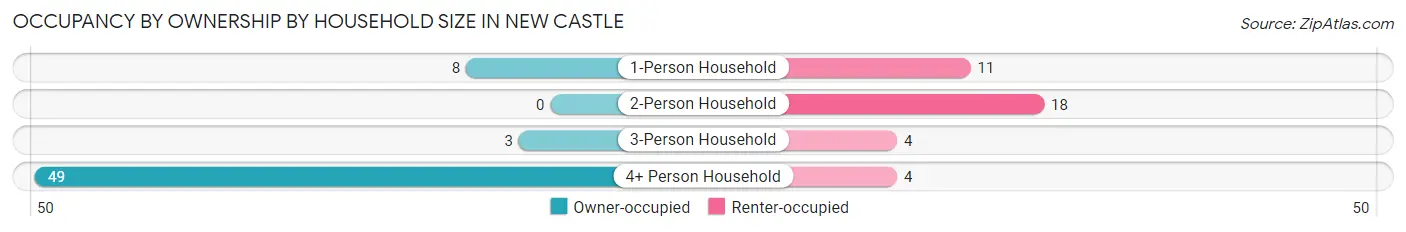
| Household Size | Owner-occupied | Renter-occupied |
| 1-Person Household | 8 (42.1%) | 11 (57.9%) |
| 2-Person Household | 0 (0.0%) | 18 (100.0%) |
| 3-Person Household | 3 (42.9%) | 4 (57.1%) |
| 4+ Person Household | 49 (92.4%) | 4 (7.5%) |
| Total Housing Units | 60 (61.9%) | 37 (38.1%) |
Occupancy by Educational Attainment in New Castle
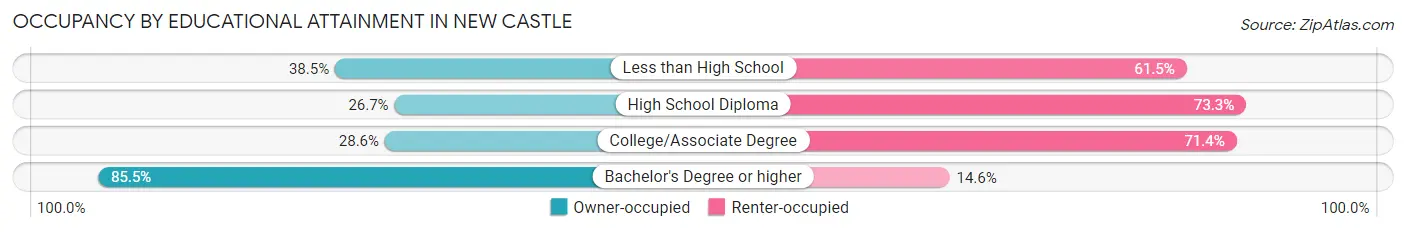
| Household Size | Owner-occupied | Renter-occupied |
| Less than High School | 5 (38.5%) | 8 (61.5%) |
| High School Diploma | 4 (26.7%) | 11 (73.3%) |
| College/Associate Degree | 4 (28.6%) | 10 (71.4%) |
| Bachelor's Degree or higher | 47 (85.5%) | 8 (14.5%) |
Occupancy by Age of Householder in New Castle
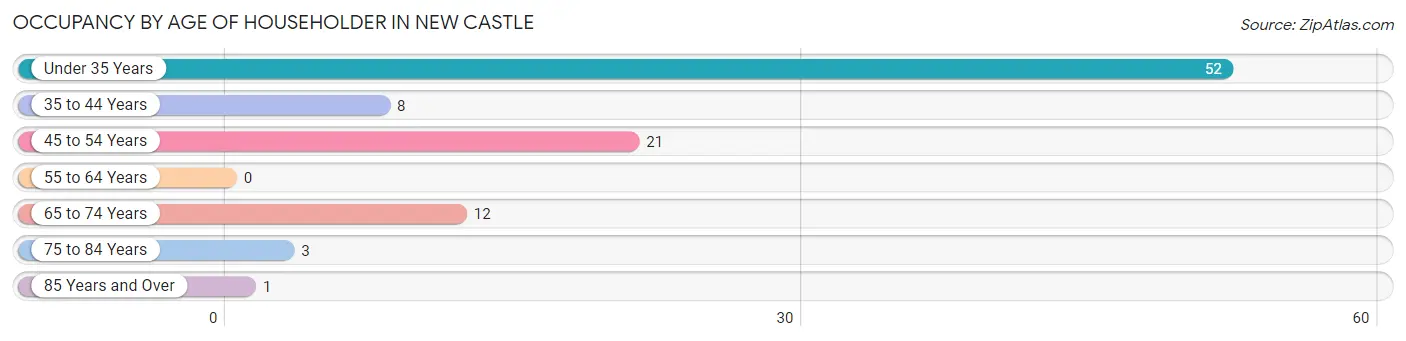
| Age Bracket | # Households | % Households |
| Under 35 Years | 52 | 53.6% |
| 35 to 44 Years | 8 | 8.3% |
| 45 to 54 Years | 21 | 21.6% |
| 55 to 64 Years | 0 | 0.0% |
| 65 to 74 Years | 12 | 12.4% |
| 75 to 84 Years | 3 | 3.1% |
| 85 Years and Over | 1 | 1.0% |
| Total | 97 | 100.0% |
Housing Finances in New Castle
Median Income by Occupancy in New Castle
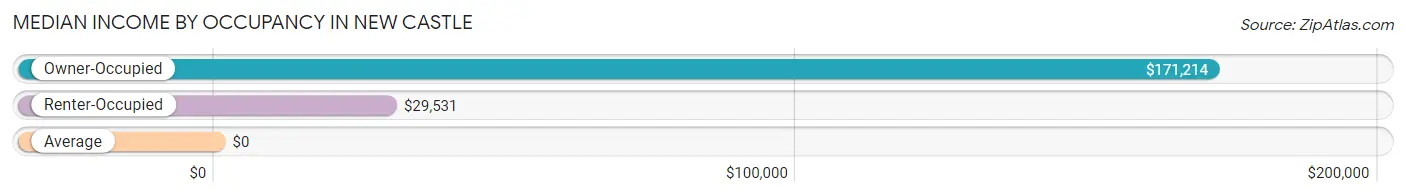
| Occupancy Type | # Households | Median Income |
| Owner-Occupied | 60 (61.9%) | $171,214 |
| Renter-Occupied | 37 (38.1%) | $29,531 |
| Average | 97 (100.0%) | $0 |
Occupancy by Householder Income Bracket in New Castle
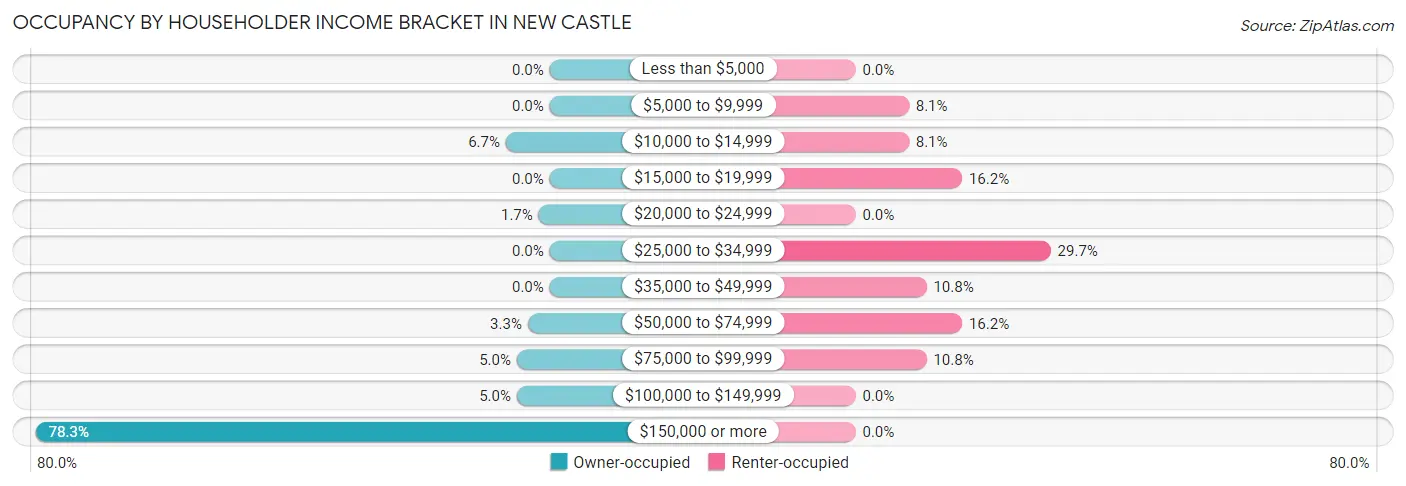
| Income Bracket | Owner-occupied | Renter-occupied |
| Less than $5,000 | 0 (0.0%) | 0 (0.0%) |
| $5,000 to $9,999 | 0 (0.0%) | 3 (8.1%) |
| $10,000 to $14,999 | 4 (6.7%) | 3 (8.1%) |
| $15,000 to $19,999 | 0 (0.0%) | 6 (16.2%) |
| $20,000 to $24,999 | 1 (1.7%) | 0 (0.0%) |
| $25,000 to $34,999 | 0 (0.0%) | 11 (29.7%) |
| $35,000 to $49,999 | 0 (0.0%) | 4 (10.8%) |
| $50,000 to $74,999 | 2 (3.3%) | 6 (16.2%) |
| $75,000 to $99,999 | 3 (5.0%) | 4 (10.8%) |
| $100,000 to $149,999 | 3 (5.0%) | 0 (0.0%) |
| $150,000 or more | 47 (78.3%) | 0 (0.0%) |
| Total | 60 (100.0%) | 37 (100.0%) |
Monthly Housing Cost Tiers in New Castle
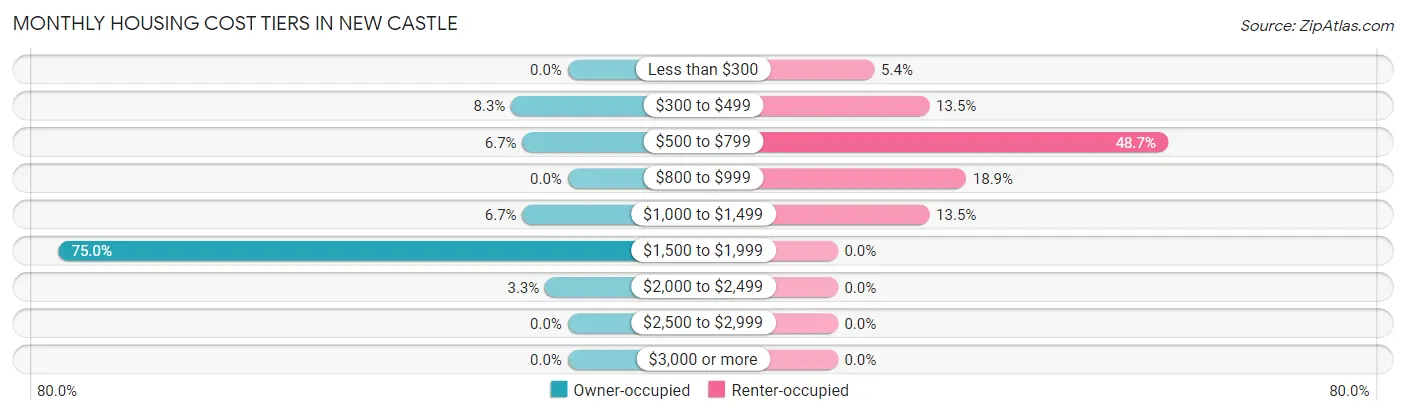
| Monthly Cost | Owner-occupied | Renter-occupied |
| Less than $300 | 0 (0.0%) | 2 (5.4%) |
| $300 to $499 | 5 (8.3%) | 5 (13.5%) |
| $500 to $799 | 4 (6.7%) | 18 (48.6%) |
| $800 to $999 | 0 (0.0%) | 7 (18.9%) |
| $1,000 to $1,499 | 4 (6.7%) | 5 (13.5%) |
| $1,500 to $1,999 | 45 (75.0%) | 0 (0.0%) |
| $2,000 to $2,499 | 2 (3.3%) | 0 (0.0%) |
| $2,500 to $2,999 | 0 (0.0%) | 0 (0.0%) |
| $3,000 or more | 0 (0.0%) | 0 (0.0%) |
| Total | 60 (100.0%) | 37 (100.0%) |
Physical Housing Characteristics in New Castle
Housing Structures in New Castle
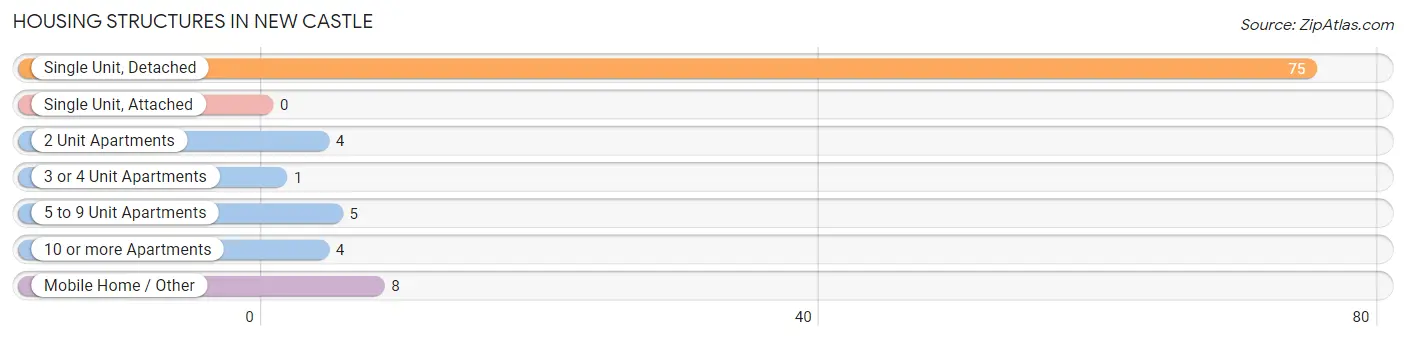
| Structure Type | # Housing Units | % Housing Units |
| Single Unit, Detached | 75 | 77.3% |
| Single Unit, Attached | 0 | 0.0% |
| 2 Unit Apartments | 4 | 4.1% |
| 3 or 4 Unit Apartments | 1 | 1.0% |
| 5 to 9 Unit Apartments | 5 | 5.1% |
| 10 or more Apartments | 4 | 4.1% |
| Mobile Home / Other | 8 | 8.3% |
| Total | 97 | 100.0% |
Housing Structures by Occupancy in New Castle
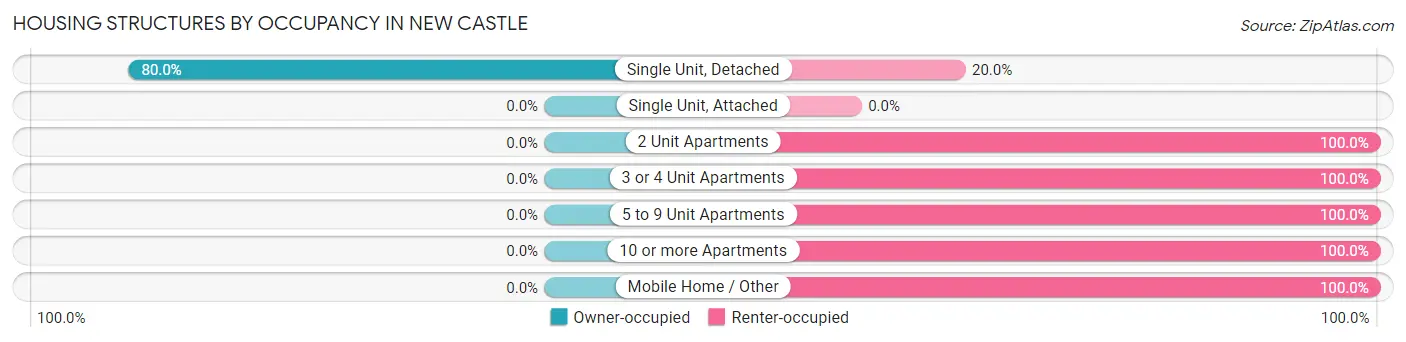
| Structure Type | Owner-occupied | Renter-occupied |
| Single Unit, Detached | 60 (80.0%) | 15 (20.0%) |
| Single Unit, Attached | 0 (0.0%) | 0 (0.0%) |
| 2 Unit Apartments | 0 (0.0%) | 4 (100.0%) |
| 3 or 4 Unit Apartments | 0 (0.0%) | 1 (100.0%) |
| 5 to 9 Unit Apartments | 0 (0.0%) | 5 (100.0%) |
| 10 or more Apartments | 0 (0.0%) | 4 (100.0%) |
| Mobile Home / Other | 0 (0.0%) | 8 (100.0%) |
| Total | 60 (61.9%) | 37 (38.1%) |
Housing Structures by Number of Rooms in New Castle
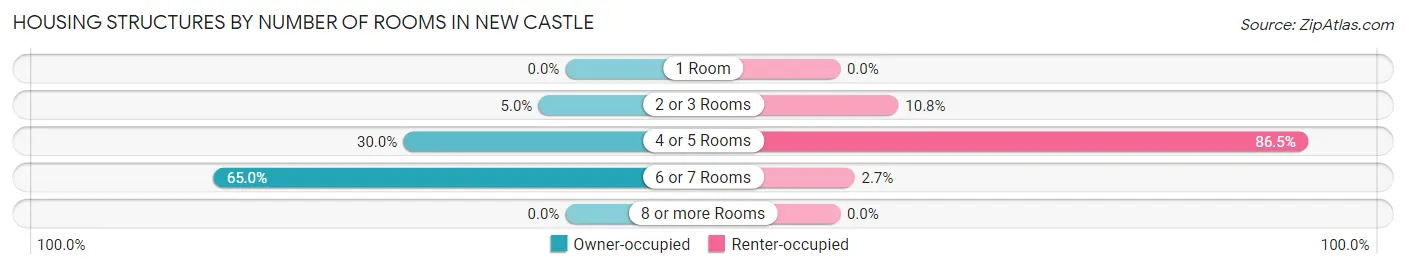
| Number of Rooms | Owner-occupied | Renter-occupied |
| 1 Room | 0 (0.0%) | 0 (0.0%) |
| 2 or 3 Rooms | 3 (5.0%) | 4 (10.8%) |
| 4 or 5 Rooms | 18 (30.0%) | 32 (86.5%) |
| 6 or 7 Rooms | 39 (65.0%) | 1 (2.7%) |
| 8 or more Rooms | 0 (0.0%) | 0 (0.0%) |
| Total | 60 (100.0%) | 37 (100.0%) |
Housing Structure by Heating Type in New Castle
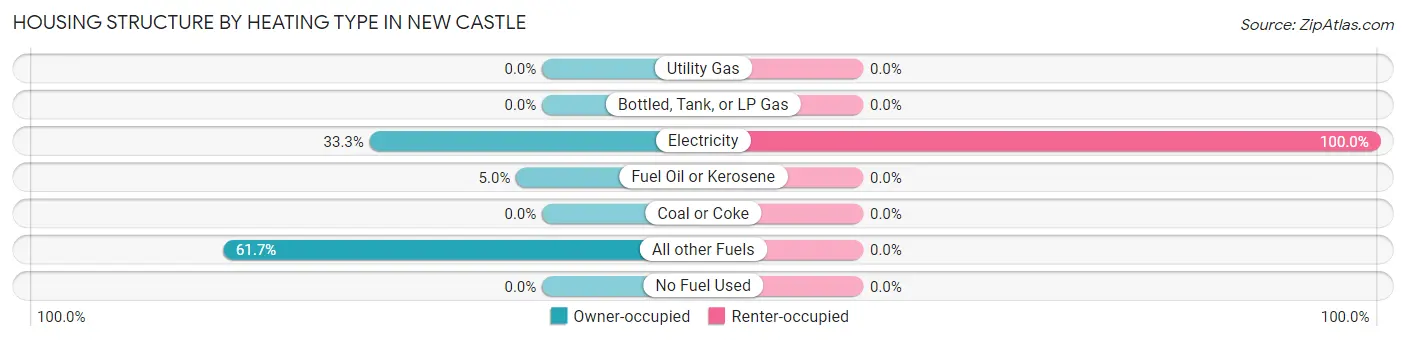
| Heating Type | Owner-occupied | Renter-occupied |
| Utility Gas | 0 (0.0%) | 0 (0.0%) |
| Bottled, Tank, or LP Gas | 0 (0.0%) | 0 (0.0%) |
| Electricity | 20 (33.3%) | 37 (100.0%) |
| Fuel Oil or Kerosene | 3 (5.0%) | 0 (0.0%) |
| Coal or Coke | 0 (0.0%) | 0 (0.0%) |
| All other Fuels | 37 (61.7%) | 0 (0.0%) |
| No Fuel Used | 0 (0.0%) | 0 (0.0%) |
| Total | 60 (100.0%) | 37 (100.0%) |
Household Vehicle Usage in New Castle
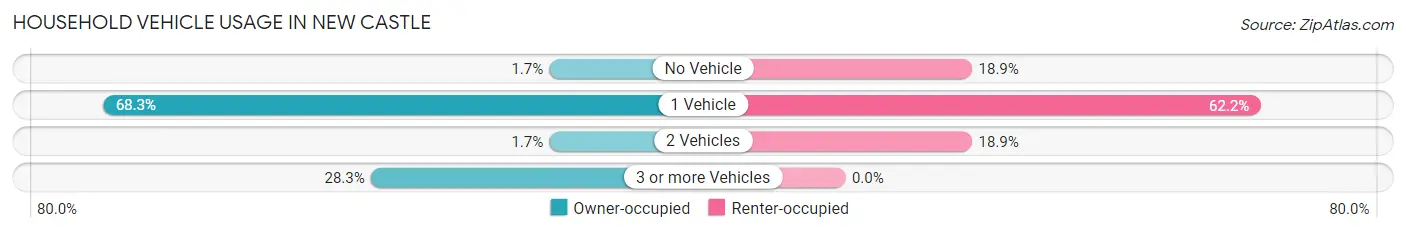
| Vehicles per Household | Owner-occupied | Renter-occupied |
| No Vehicle | 1 (1.7%) | 7 (18.9%) |
| 1 Vehicle | 41 (68.3%) | 23 (62.2%) |
| 2 Vehicles | 1 (1.7%) | 7 (18.9%) |
| 3 or more Vehicles | 17 (28.3%) | 0 (0.0%) |
| Total | 60 (100.0%) | 37 (100.0%) |
Real Estate & Mortgages in New Castle
Real Estate and Mortgage Overview in New Castle
| Characteristic | Without Mortgage | With Mortgage |
| Housing Units | 2 | 58 |
| Median Property Value | - | - |
| Median Household Income | - | - |
| Monthly Housing Costs | - | - |
| Real Estate Taxes | - | - |
Property Value by Mortgage Status in New Castle
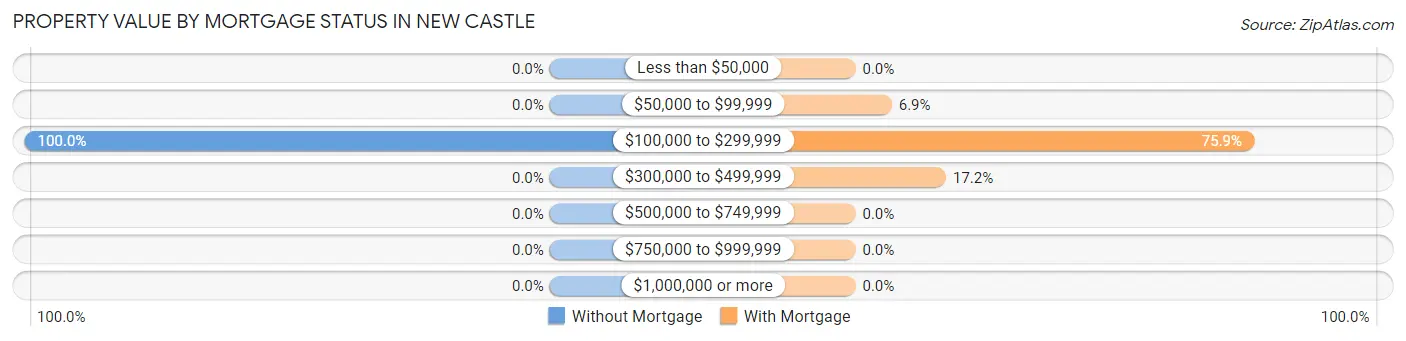
| Property Value | Without Mortgage | With Mortgage |
| Less than $50,000 | 0 (0.0%) | 0 (0.0%) |
| $50,000 to $99,999 | 0 (0.0%) | 4 (6.9%) |
| $100,000 to $299,999 | 2 (100.0%) | 44 (75.9%) |
| $300,000 to $499,999 | 0 (0.0%) | 10 (17.2%) |
| $500,000 to $749,999 | 0 (0.0%) | 0 (0.0%) |
| $750,000 to $999,999 | 0 (0.0%) | 0 (0.0%) |
| $1,000,000 or more | 0 (0.0%) | 0 (0.0%) |
| Total | 2 (100.0%) | 58 (100.0%) |
Household Income by Mortgage Status in New Castle
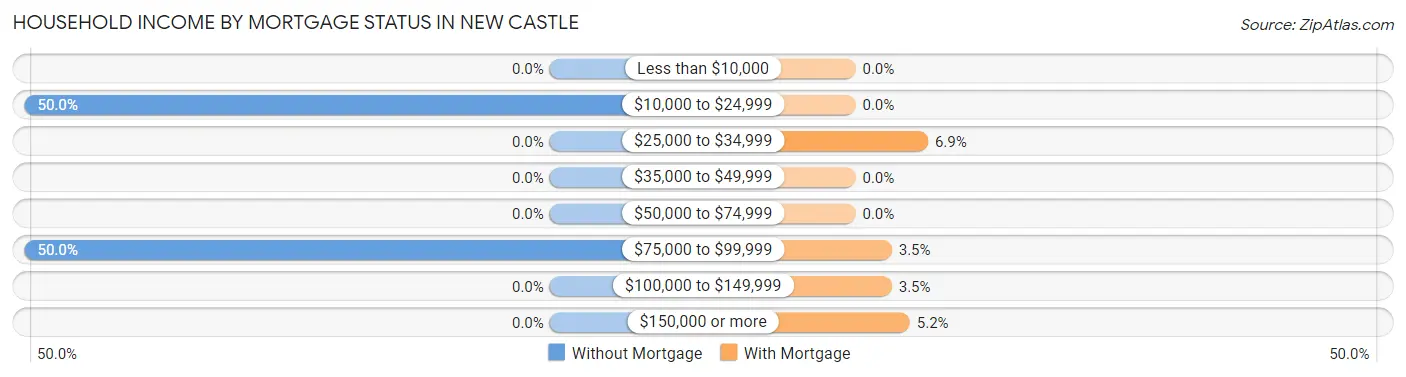
| Household Income | Without Mortgage | With Mortgage |
| Less than $10,000 | 0 (0.0%) | 0 (0.0%) |
| $10,000 to $24,999 | 1 (50.0%) | 0 (0.0%) |
| $25,000 to $34,999 | 0 (0.0%) | 4 (6.9%) |
| $35,000 to $49,999 | 0 (0.0%) | 0 (0.0%) |
| $50,000 to $74,999 | 0 (0.0%) | 0 (0.0%) |
| $75,000 to $99,999 | 1 (50.0%) | 2 (3.5%) |
| $100,000 to $149,999 | 0 (0.0%) | 2 (3.5%) |
| $150,000 or more | 0 (0.0%) | 3 (5.2%) |
| Total | 2 (100.0%) | 58 (100.0%) |
Property Value to Household Income Ratio in New Castle
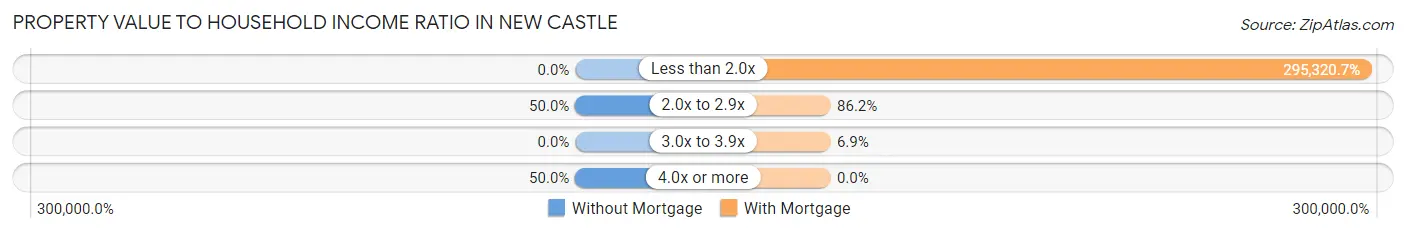
| Value-to-Income Ratio | Without Mortgage | With Mortgage |
| Less than 2.0x | 0 (0.0%) | 171,286 (295,320.7%) |
| 2.0x to 2.9x | 1 (50.0%) | 50 (86.2%) |
| 3.0x to 3.9x | 0 (0.0%) | 4 (6.9%) |
| 4.0x or more | 1 (50.0%) | 0 (0.0%) |
| Total | 2 (100.0%) | 58 (100.0%) |
Real Estate Taxes by Mortgage Status in New Castle
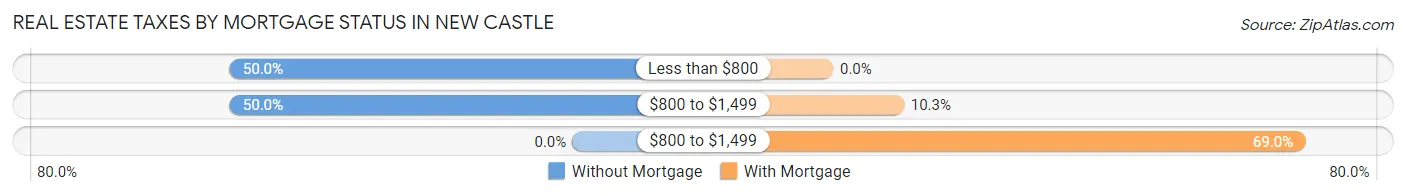
| Property Taxes | Without Mortgage | With Mortgage |
| Less than $800 | 1 (50.0%) | 0 (0.0%) |
| $800 to $1,499 | 1 (50.0%) | 6 (10.3%) |
| $800 to $1,499 | 0 (0.0%) | 40 (69.0%) |
| Total | 2 (100.0%) | 58 (100.0%) |
Health & Disability in New Castle
Health Insurance Coverage by Age in New Castle
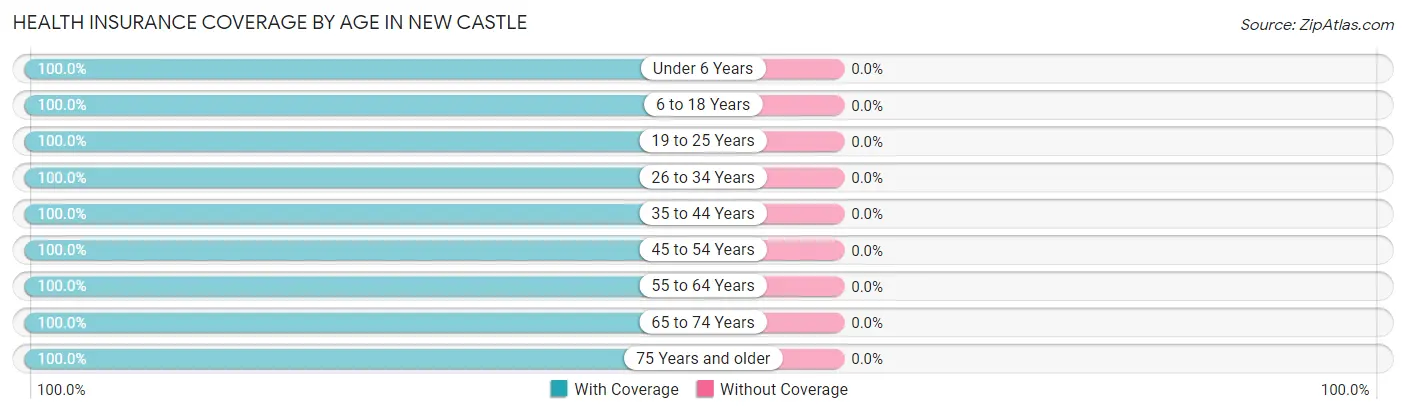
| Age Bracket | With Coverage | Without Coverage |
| Under 6 Years | 29 (100.0%) | 0 (0.0%) |
| 6 to 18 Years | 41 (100.0%) | 0 (0.0%) |
| 19 to 25 Years | 20 (100.0%) | 0 (0.0%) |
| 26 to 34 Years | 71 (100.0%) | 0 (0.0%) |
| 35 to 44 Years | 9 (100.0%) | 0 (0.0%) |
| 45 to 54 Years | 27 (100.0%) | 0 (0.0%) |
| 55 to 64 Years | 4 (100.0%) | 0 (0.0%) |
| 65 to 74 Years | 19 (100.0%) | 0 (0.0%) |
| 75 Years and older | 4 (100.0%) | 0 (0.0%) |
| Total | 224 (100.0%) | 0 (0.0%) |
Health Insurance Coverage by Citizenship Status in New Castle
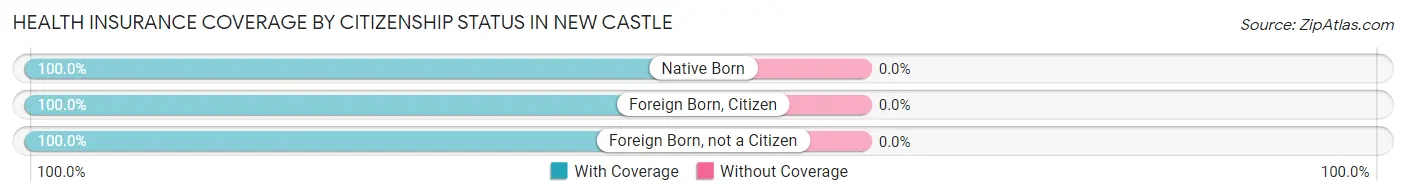
| Citizenship Status | With Coverage | Without Coverage |
| Native Born | 29 (100.0%) | 0 (0.0%) |
| Foreign Born, Citizen | 41 (100.0%) | 0 (0.0%) |
| Foreign Born, not a Citizen | 20 (100.0%) | 0 (0.0%) |
Health Insurance Coverage by Household Income in New Castle
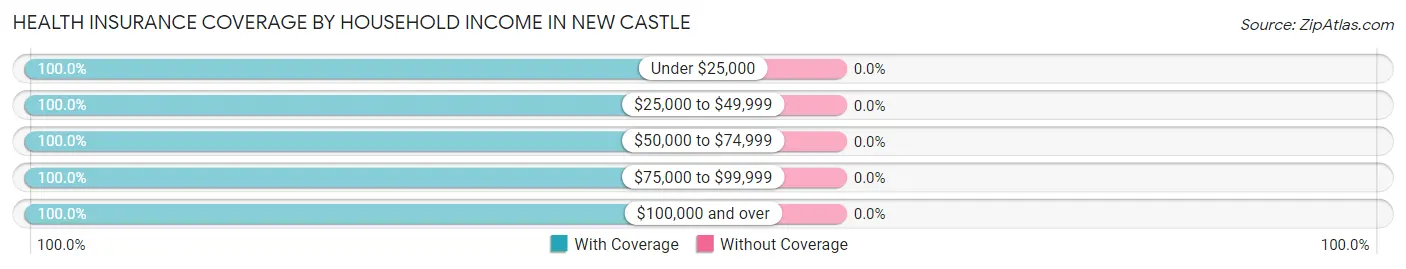
| Household Income | With Coverage | Without Coverage |
| Under $25,000 | 35 (100.0%) | 0 (0.0%) |
| $25,000 to $49,999 | 22 (100.0%) | 0 (0.0%) |
| $50,000 to $74,999 | 10 (100.0%) | 0 (0.0%) |
| $75,000 to $99,999 | 21 (100.0%) | 0 (0.0%) |
| $100,000 and over | 136 (100.0%) | 0 (0.0%) |
Public vs Private Health Insurance Coverage by Age in New Castle
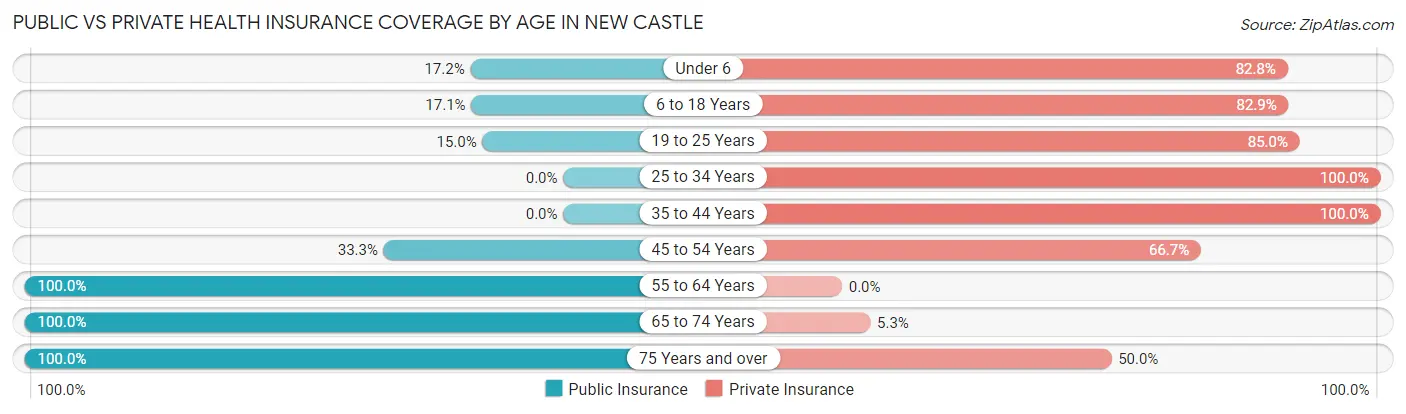
| Age Bracket | Public Insurance | Private Insurance |
| Under 6 | 5 (17.2%) | 24 (82.8%) |
| 6 to 18 Years | 7 (17.1%) | 34 (82.9%) |
| 19 to 25 Years | 3 (15.0%) | 17 (85.0%) |
| 25 to 34 Years | 0 (0.0%) | 71 (100.0%) |
| 35 to 44 Years | 0 (0.0%) | 9 (100.0%) |
| 45 to 54 Years | 9 (33.3%) | 18 (66.7%) |
| 55 to 64 Years | 4 (100.0%) | 0 (0.0%) |
| 65 to 74 Years | 19 (100.0%) | 1 (5.3%) |
| 75 Years and over | 4 (100.0%) | 2 (50.0%) |
| Total | 51 (22.8%) | 176 (78.6%) |
Disability Status by Sex by Age in New Castle
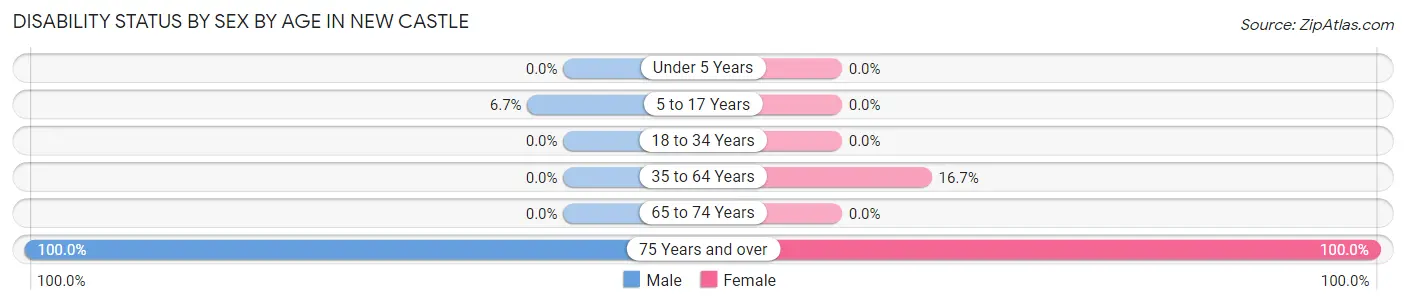
| Age Bracket | Male | Female |
| Under 5 Years | 0 (0.0%) | 0 (0.0%) |
| 5 to 17 Years | 1 (6.7%) | 0 (0.0%) |
| 18 to 34 Years | 0 (0.0%) | 0 (0.0%) |
| 35 to 64 Years | 0 (0.0%) | 4 (16.7%) |
| 65 to 74 Years | 0 (0.0%) | 0 (0.0%) |
| 75 Years and over | 1 (100.0%) | 3 (100.0%) |
Disability Class by Sex by Age in New Castle
Disability Class: Hearing Difficulty
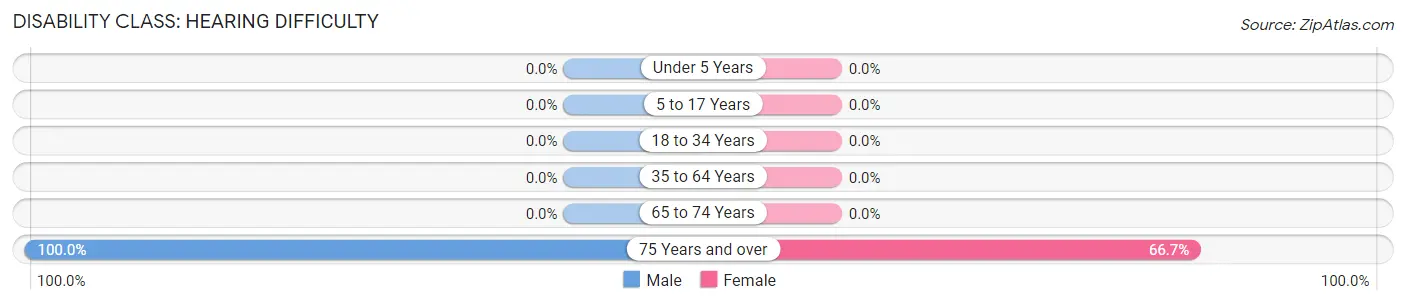
| Age Bracket | Male | Female |
| Under 5 Years | 0 (0.0%) | 0 (0.0%) |
| 5 to 17 Years | 0 (0.0%) | 0 (0.0%) |
| 18 to 34 Years | 0 (0.0%) | 0 (0.0%) |
| 35 to 64 Years | 0 (0.0%) | 0 (0.0%) |
| 65 to 74 Years | 0 (0.0%) | 0 (0.0%) |
| 75 Years and over | 1 (100.0%) | 2 (66.7%) |
Disability Class: Vision Difficulty
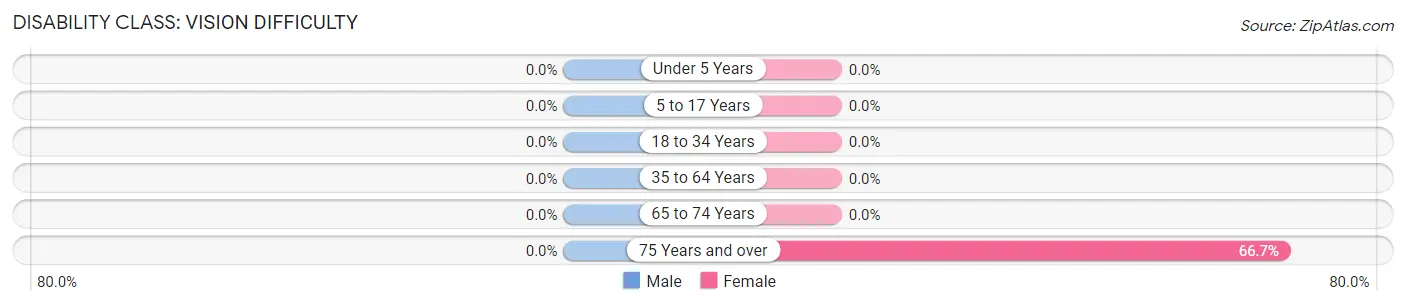
| Age Bracket | Male | Female |
| Under 5 Years | 0 (0.0%) | 0 (0.0%) |
| 5 to 17 Years | 0 (0.0%) | 0 (0.0%) |
| 18 to 34 Years | 0 (0.0%) | 0 (0.0%) |
| 35 to 64 Years | 0 (0.0%) | 0 (0.0%) |
| 65 to 74 Years | 0 (0.0%) | 0 (0.0%) |
| 75 Years and over | 0 (0.0%) | 2 (66.7%) |
Disability Class: Cognitive Difficulty
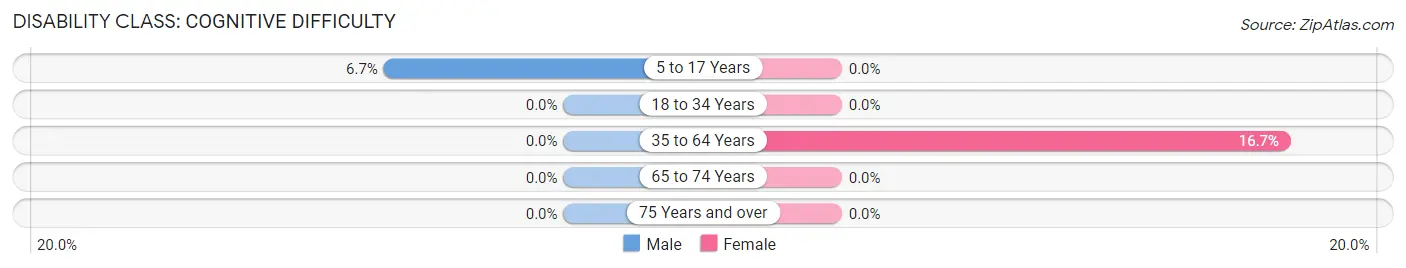
| Age Bracket | Male | Female |
| 5 to 17 Years | 1 (6.7%) | 0 (0.0%) |
| 18 to 34 Years | 0 (0.0%) | 0 (0.0%) |
| 35 to 64 Years | 0 (0.0%) | 4 (16.7%) |
| 65 to 74 Years | 0 (0.0%) | 0 (0.0%) |
| 75 Years and over | 0 (0.0%) | 0 (0.0%) |
Disability Class: Ambulatory Difficulty
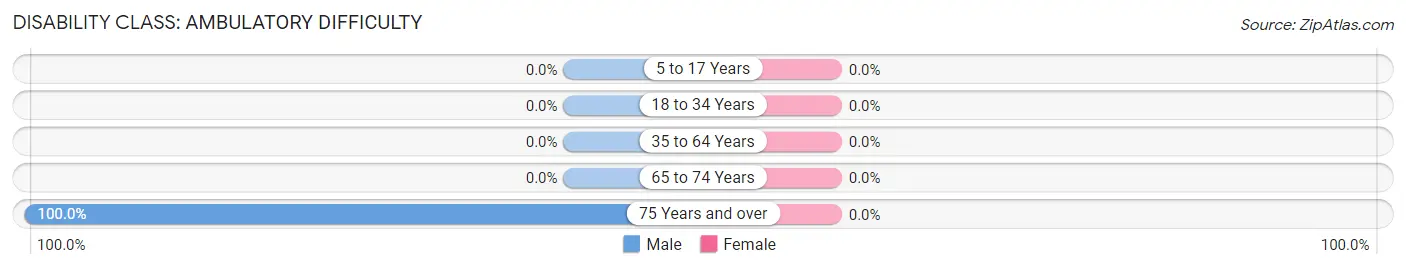
| Age Bracket | Male | Female |
| 5 to 17 Years | 0 (0.0%) | 0 (0.0%) |
| 18 to 34 Years | 0 (0.0%) | 0 (0.0%) |
| 35 to 64 Years | 0 (0.0%) | 0 (0.0%) |
| 65 to 74 Years | 0 (0.0%) | 0 (0.0%) |
| 75 Years and over | 1 (100.0%) | 0 (0.0%) |
Disability Class: Self-Care Difficulty
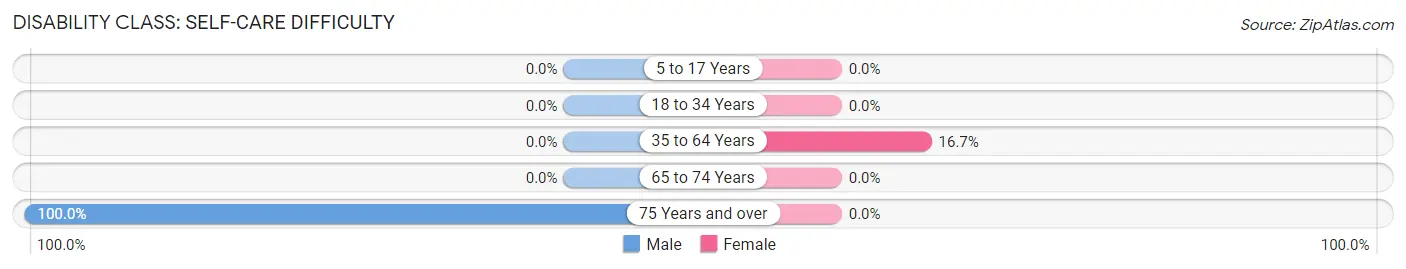
| Age Bracket | Male | Female |
| 5 to 17 Years | 0 (0.0%) | 0 (0.0%) |
| 18 to 34 Years | 0 (0.0%) | 0 (0.0%) |
| 35 to 64 Years | 0 (0.0%) | 4 (16.7%) |
| 65 to 74 Years | 0 (0.0%) | 0 (0.0%) |
| 75 Years and over | 1 (100.0%) | 0 (0.0%) |
Technology Access in New Castle
Computing Device Access in New Castle
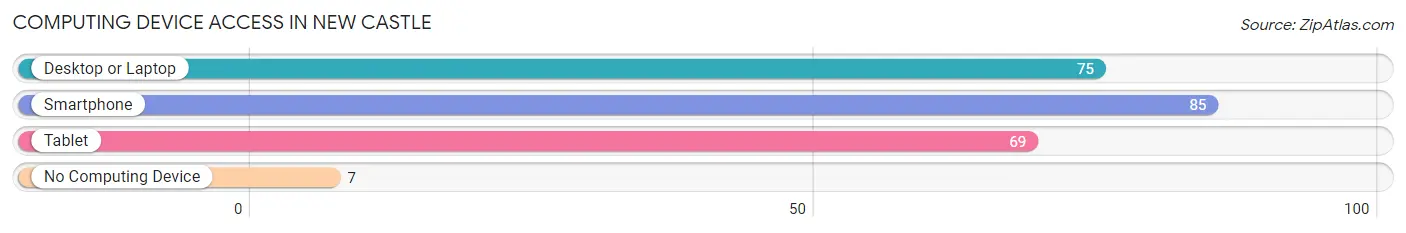
| Device Type | # Households | % Households |
| Desktop or Laptop | 75 | 77.3% |
| Smartphone | 85 | 87.6% |
| Tablet | 69 | 71.1% |
| No Computing Device | 7 | 7.2% |
| Total | 97 | 100.0% |
Internet Access in New Castle
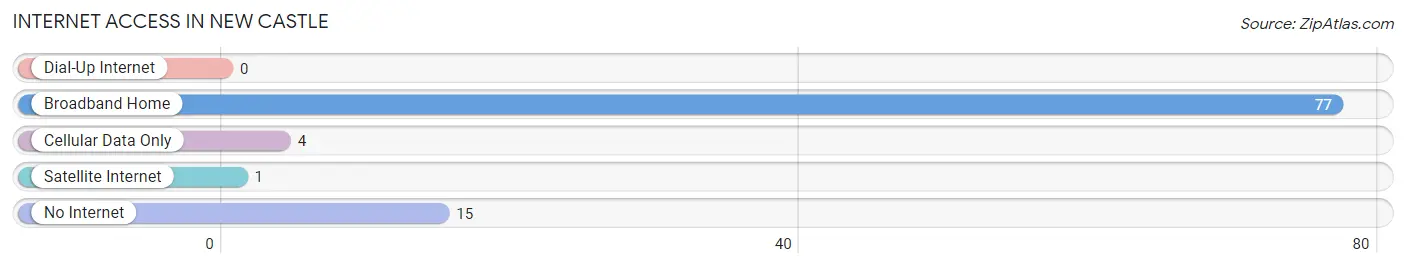
| Internet Type | # Households | % Households |
| Dial-Up Internet | 0 | 0.0% |
| Broadband Home | 77 | 79.4% |
| Cellular Data Only | 4 | 4.1% |
| Satellite Internet | 1 | 1.0% |
| No Internet | 15 | 15.5% |
| Total | 97 | 100.0% |
New Castle Summary
New Castle is a small town located in Craig County, Virginia. It is situated in the Appalachian Mountains, and is the county seat of Craig County. The town has a population of just over 500 people, and is located about 30 miles from Roanoke, Virginia.
History
New Castle was founded in 1790 by William Craig, a Revolutionary War veteran. Craig had purchased the land from the local Native American tribes, and named the town after his hometown of New Castle, Pennsylvania. The town was incorporated in 1802, and was the first town in Craig County.
In the early 19th century, New Castle was a thriving agricultural community. The town was home to several mills, including a grist mill, a saw mill, and a woolen mill. The town also had a tannery, a blacksmith shop, and a general store.
In the late 19th century, the town began to decline. The mills closed, and the population began to dwindle. In the early 20th century, the town was revitalized by the arrival of the railroad. The railroad brought new industry to the town, and the population began to grow again.
Geography
New Castle is located in the Appalachian Mountains, in the western part of Craig County. The town is situated at the confluence of the New River and the Craig Creek. The town is surrounded by the Jefferson National Forest, and is located about 30 miles from Roanoke, Virginia.
The town has a total area of 0.7 square miles, all of which is land. The town is located at an elevation of 1,890 feet above sea level. The climate in New Castle is humid subtropical, with hot, humid summers and mild winters.
Economy
The economy of New Castle is largely based on tourism. The town is home to several historic sites, including the Craig County Courthouse, the New Castle Historic District, and the New Castle Museum. The town also has several restaurants, shops, and other businesses.
The town is also home to several manufacturing companies, including a furniture factory and a woodworking shop. The town is also home to several farms, which produce a variety of crops, including corn, soybeans, and hay.
Demographics
As of the 2010 census, the population of New Castle was 517. The racial makeup of the town was 95.2% White, 1.2% African American, 0.4% Native American, 0.4% Asian, 0.2% from other races, and 2.6% from two or more races. Hispanic or Latino of any race were 1.2% of the population.
The median household income in New Castle was $35,000, and the median family income was $41,000. The per capita income in the town was $17,000. About 11.2% of the population was below the poverty line.
New Castle is a small town with a rich history and a vibrant economy. The town is home to several historic sites, and is a popular tourist destination. The town is also home to several manufacturing companies, and is a great place to live and work.
Common Questions
What is Per Capita Income in New Castle?
Per Capita income in New Castle is $42,015.
What is the Median Family Income in New Castle?
Median Family Income in New Castle is $170,750.
What is Income or Wage Gap in New Castle?
Income or Wage Gap in New Castle is 59.6%.
Women in New Castle earn 40.4 cents for every dollar earned by a man.
What is Inequality or Gini Index in New Castle?
Inequality or Gini Index in New Castle is 0.36.
What is the Total Population of New Castle?
Total Population of New Castle is 224.
What is the Total Male Population of New Castle?
Total Male Population of New Castle is 82.
What is the Total Female Population of New Castle?
Total Female Population of New Castle is 142.
What is the Ratio of Males per 100 Females in New Castle?
There are 57.75 Males per 100 Females in New Castle.
What is the Ratio of Females per 100 Males in New Castle?
There are 173.17 Females per 100 Males in New Castle.
What is the Median Population Age in New Castle?
Median Population Age in New Castle is 33.1 Years.
What is the Average Family Size in New Castle
Average Family Size in New Castle is 2.6 People.
What is the Average Household Size in New Castle
Average Household Size in New Castle is 2.3 People.
How Large is the Labor Force in New Castle?
There are 115 People in the Labor Forcein in New Castle.
What is the Percentage of People in the Labor Force in New Castle?
73.2% of People are in the Labor Force in New Castle.
What is the Unemployment Rate in New Castle?
Unemployment Rate in New Castle is 2.6%.