Monterey, VA Map & Demographics
Monterey Map
Monterey Overview
$48,007
PER CAPITA INCOME
$70,000
AVG FAMILY INCOME
$56,144
AVG HOUSEHOLD INCOME
0.31
INEQUALITY / GINI INDEX
164
TOTAL POPULATION
53
MALE POPULATION
111
FEMALE POPULATION
47.75
MALES / 100 FEMALES
209.43
FEMALES / 100 MALES
76.0
MEDIAN AGE
2.2
AVG FAMILY SIZE
1.4
AVG HOUSEHOLD SIZE
48
LABOR FORCE [ PEOPLE ]
31.0%
PERCENT IN LABOR FORCE
Monterey Zip Codes
Monterey Area Codes
Income in Monterey
Income Overview in Monterey
Per Capita Income in Monterey is $48,007, while median incomes of families and households are $70,000 and $56,144 respectively.
| Characteristic | Number | Measure |
| Per Capita Income | 164 | $48,007 |
| Median Family Income | 38 | $70,000 |
| Mean Family Income | 38 | $95,329 |
| Median Household Income | 119 | $56,144 |
| Mean Household Income | 119 | $65,013 |
| Income Deficit | 38 | $0 |
| Wage / Income Gap (%) | 164 | 0.00% |
| Wage / Income Gap ($) | 164 | 100.00¢ per $1 |
| Gini / Inequality Index | 164 | 0.31 |
Earnings by Sex in Monterey
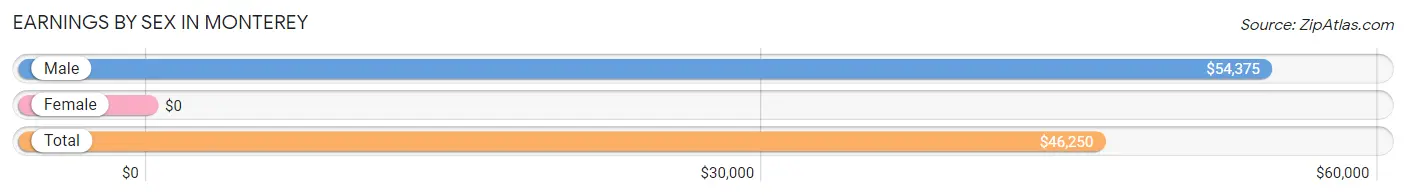
| Sex | Number | Average Earnings |
| Male | 27 (51.9%) | $54,375 |
| Female | 25 (48.1%) | $0 |
| Total | 52 (100.0%) | $46,250 |
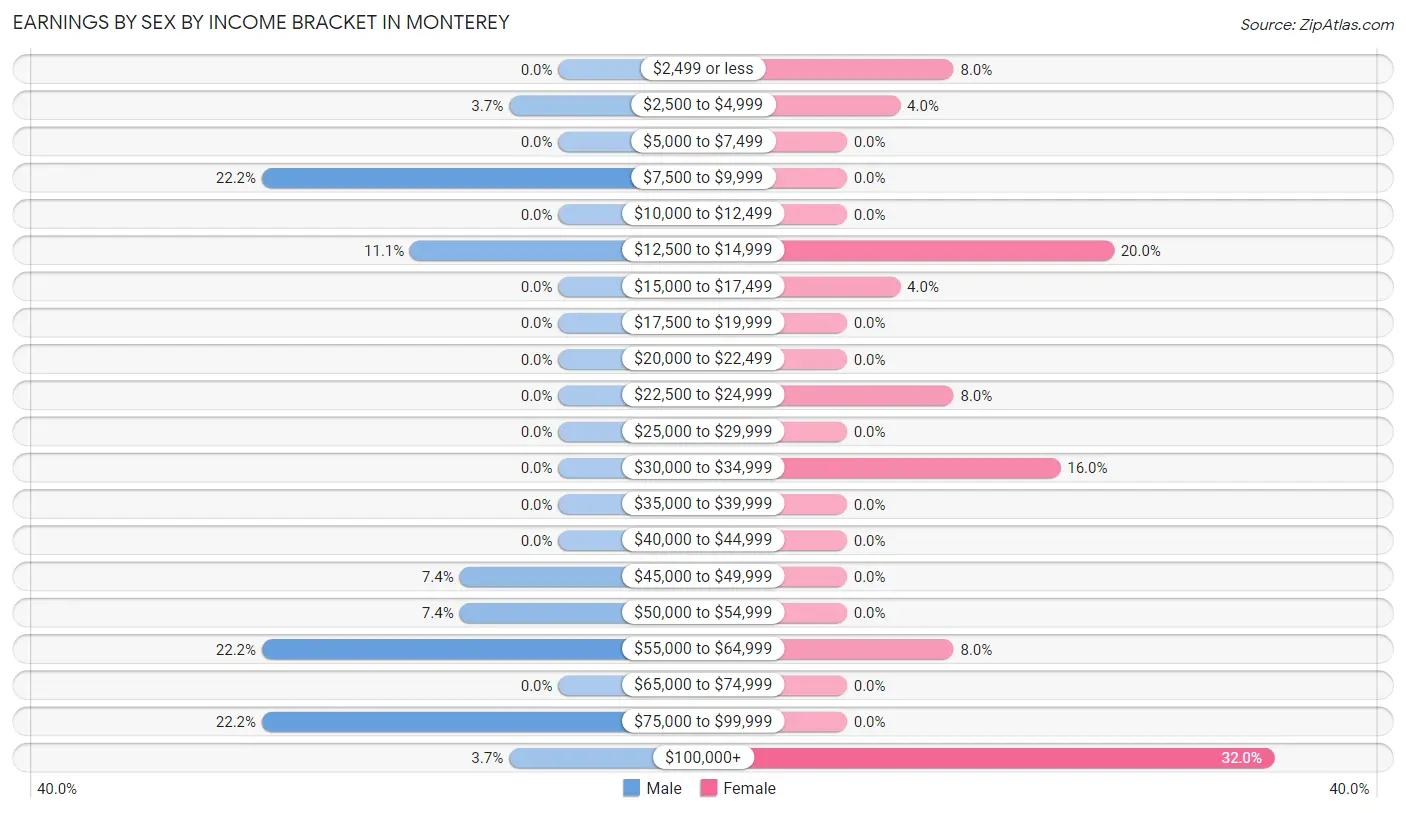
Earnings by Sex by Income Bracket in Monterey
The most common earnings brackets in Monterey are $7,500 to $9,999 for men (6 | 22.2%) and $100,000+ for women (8 | 32.0%).
| Income | Male | Female |
| $2,499 or less | 0 (0.0%) | 2 (8.0%) |
| $2,500 to $4,999 | 1 (3.7%) | 1 (4.0%) |
| $5,000 to $7,499 | 0 (0.0%) | 0 (0.0%) |
| $7,500 to $9,999 | 6 (22.2%) | 0 (0.0%) |
| $10,000 to $12,499 | 0 (0.0%) | 0 (0.0%) |
| $12,500 to $14,999 | 3 (11.1%) | 5 (20.0%) |
| $15,000 to $17,499 | 0 (0.0%) | 1 (4.0%) |
| $17,500 to $19,999 | 0 (0.0%) | 0 (0.0%) |
| $20,000 to $22,499 | 0 (0.0%) | 0 (0.0%) |
| $22,500 to $24,999 | 0 (0.0%) | 2 (8.0%) |
| $25,000 to $29,999 | 0 (0.0%) | 0 (0.0%) |
| $30,000 to $34,999 | 0 (0.0%) | 4 (16.0%) |
| $35,000 to $39,999 | 0 (0.0%) | 0 (0.0%) |
| $40,000 to $44,999 | 0 (0.0%) | 0 (0.0%) |
| $45,000 to $49,999 | 2 (7.4%) | 0 (0.0%) |
| $50,000 to $54,999 | 2 (7.4%) | 0 (0.0%) |
| $55,000 to $64,999 | 6 (22.2%) | 2 (8.0%) |
| $65,000 to $74,999 | 0 (0.0%) | 0 (0.0%) |
| $75,000 to $99,999 | 6 (22.2%) | 0 (0.0%) |
| $100,000+ | 1 (3.7%) | 8 (32.0%) |
| Total | 27 (100.0%) | 25 (100.0%) |
Earnings by Sex by Educational Attainment in Monterey
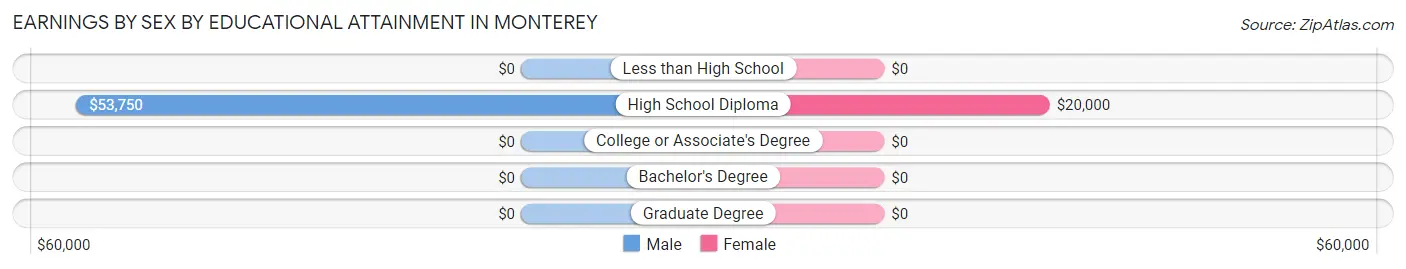
| Educational Attainment | Male Income | Female Income |
| Less than High School | - | - |
| High School Diploma | $53,750 | $20,000 |
| College or Associate's Degree | - | - |
| Bachelor's Degree | - | - |
| Graduate Degree | - | - |
| Total | $55,208 | $0 |
Family Income in Monterey
Family Income Brackets in Monterey
According to the Monterey family income data, there are 10 families falling into the $50,000 to $74,999 income range, which is the most common income bracket and makes up 26.3% of all families.
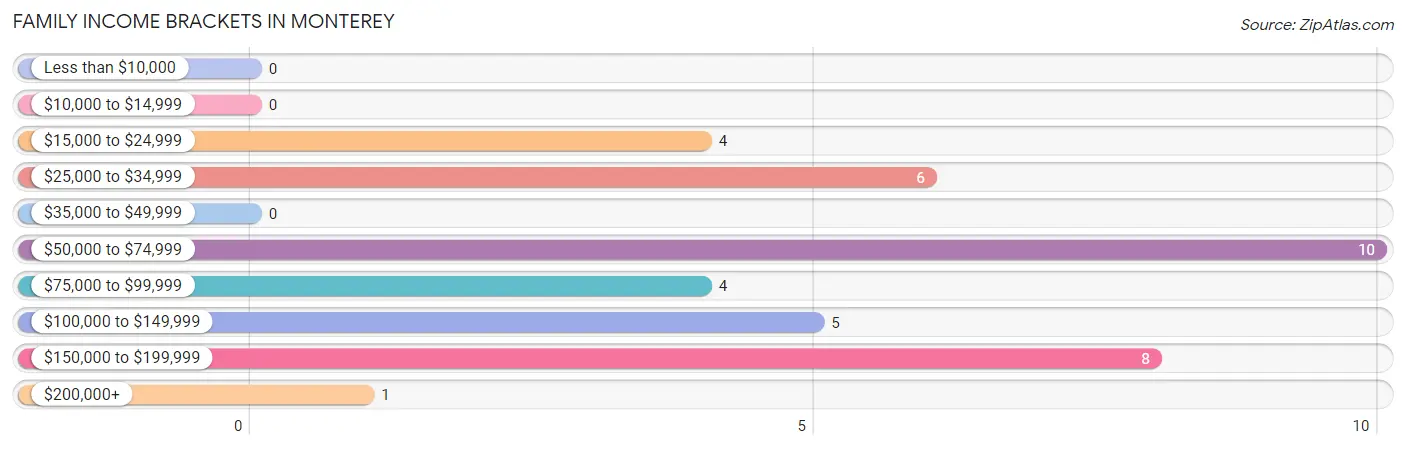
| Income Bracket | # Families | % Families |
| Less than $10,000 | 0 | 0.0% |
| $10,000 to $14,999 | 0 | 0.0% |
| $15,000 to $24,999 | 4 | 10.5% |
| $25,000 to $34,999 | 6 | 15.8% |
| $35,000 to $49,999 | 0 | 0.0% |
| $50,000 to $74,999 | 10 | 26.3% |
| $75,000 to $99,999 | 4 | 10.5% |
| $100,000 to $149,999 | 5 | 13.2% |
| $150,000 to $199,999 | 8 | 21.1% |
| $200,000+ | 1 | 2.6% |
Family Income by Famaliy Size in Monterey
2-person families (35 | 92.1%) account for the highest median family income in Monterey with $80,625 per family, while 2-person families (35 | 92.1%) have the highest median income of $40,312 per family member.
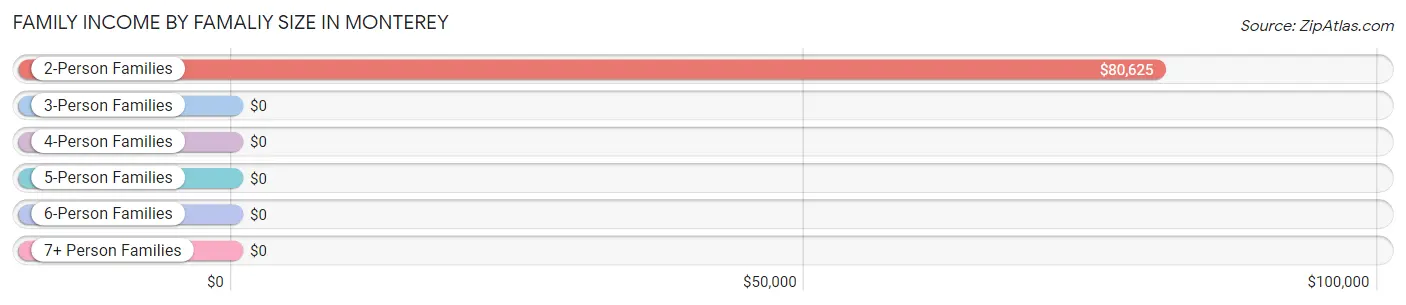
| Income Bracket | # Families | Median Income |
| 2-Person Families | 35 (92.1%) | $80,625 |
| 3-Person Families | 3 (7.9%) | $0 |
| 4-Person Families | 0 (0.0%) | $0 |
| 5-Person Families | 0 (0.0%) | $0 |
| 6-Person Families | 0 (0.0%) | $0 |
| 7+ Person Families | 0 (0.0%) | $0 |
| Total | 38 (100.0%) | $70,000 |
Family Income by Number of Earners in Monterey
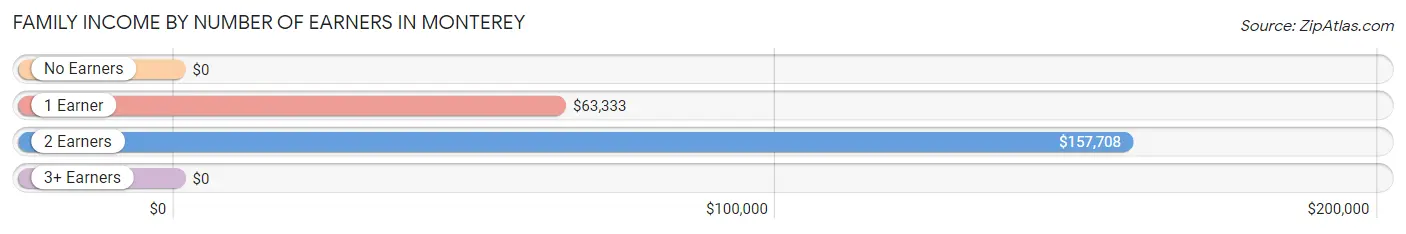
| Number of Earners | # Families | Median Income |
| No Earners | 11 (28.9%) | $0 |
| 1 Earner | 14 (36.8%) | $63,333 |
| 2 Earners | 11 (28.9%) | $157,708 |
| 3+ Earners | 2 (5.3%) | $0 |
| Total | 38 (100.0%) | $70,000 |
Household Income in Monterey
Household Income Brackets in Monterey
With 57 households falling in the category, the $50,000 to $74,999 income range is the most frequent in Monterey, accounting for 47.9% of all households.
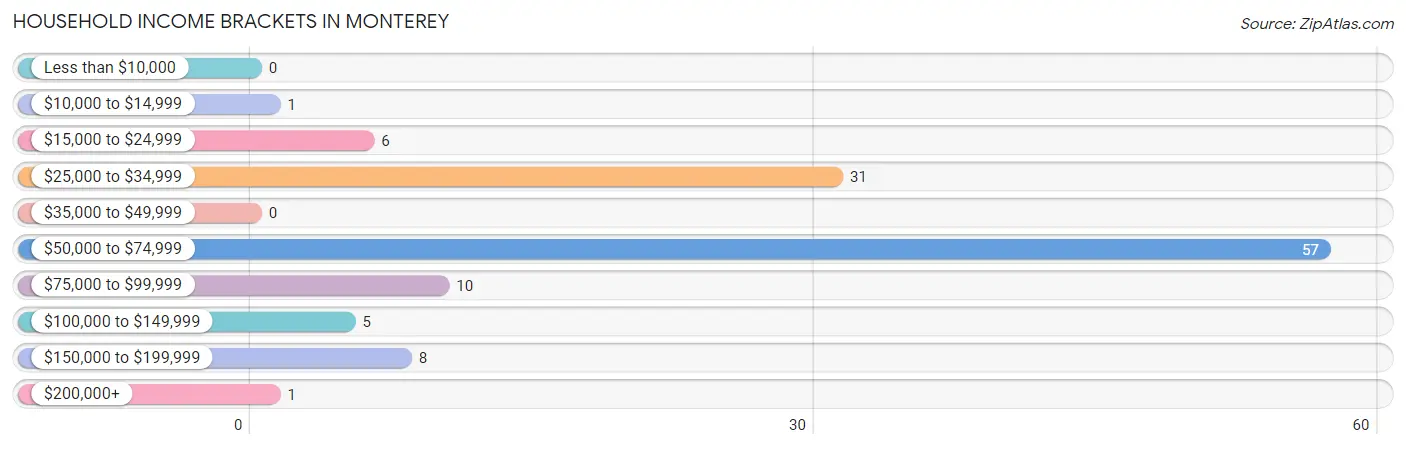
| Income Bracket | # Households | % Households |
| Less than $10,000 | 0 | 0.0% |
| $10,000 to $14,999 | 1 | 0.8% |
| $15,000 to $24,999 | 6 | 5.0% |
| $25,000 to $34,999 | 31 | 26.1% |
| $35,000 to $49,999 | 0 | 0.0% |
| $50,000 to $74,999 | 57 | 47.9% |
| $75,000 to $99,999 | 10 | 8.4% |
| $100,000 to $149,999 | 5 | 4.2% |
| $150,000 to $199,999 | 8 | 6.7% |
| $200,000+ | 1 | 0.8% |
Household Income by Householder Age in Monterey
The median household income in Monterey is $56,144, with the highest median household income of $55,665 found in the 65+ years age bracket for the primary householder. A total of 89 households (74.8%) fall into this category. Meanwhile, the 15 to 24 years age bracket for the primary householder has the lowest median household income of $0, with 4 households (3.4%) in this group.
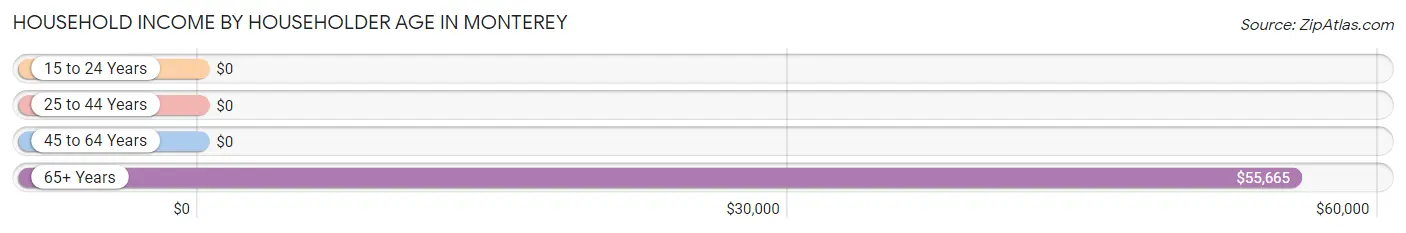
| Income Bracket | # Households | Median Income |
| 15 to 24 Years | 4 (3.4%) | $0 |
| 25 to 44 Years | 5 (4.2%) | $0 |
| 45 to 64 Years | 21 (17.6%) | $0 |
| 65+ Years | 89 (74.8%) | $55,665 |
| Total | 119 (100.0%) | $56,144 |
Poverty in Monterey
Income Below Poverty by Sex and Age in Monterey
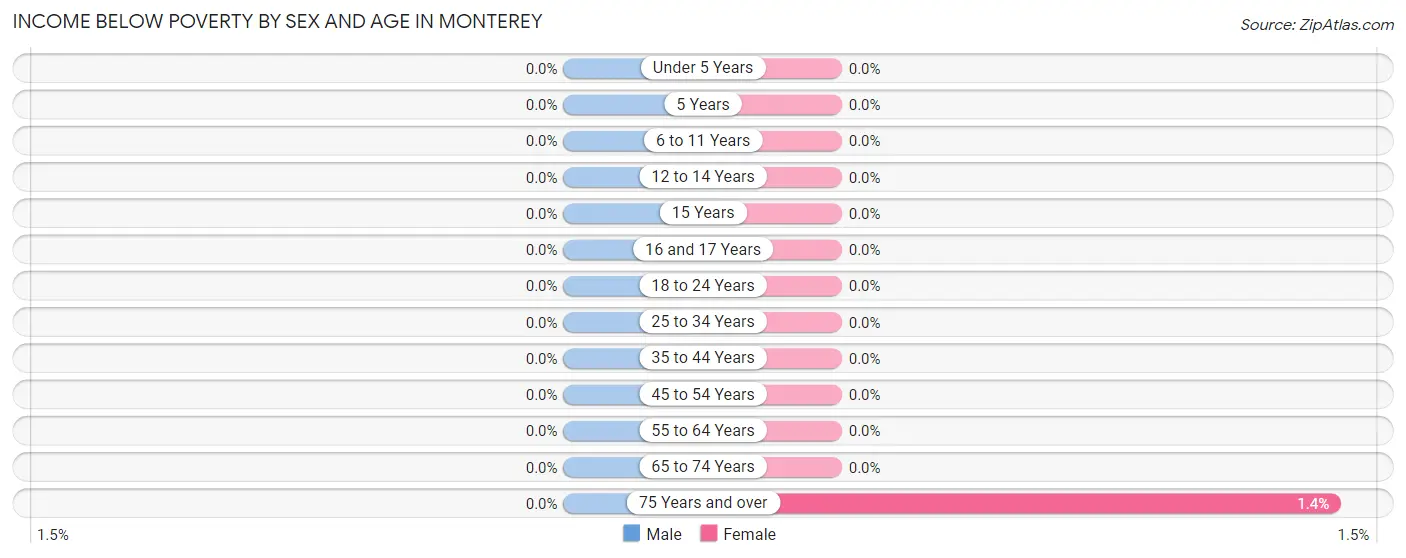
| Age Bracket | Male | Female |
| Under 5 Years | 0 (0.0%) | 0 (0.0%) |
| 5 Years | 0 (0.0%) | 0 (0.0%) |
| 6 to 11 Years | 0 (0.0%) | 0 (0.0%) |
| 12 to 14 Years | 0 (0.0%) | 0 (0.0%) |
| 15 Years | 0 (0.0%) | 0 (0.0%) |
| 16 and 17 Years | 0 (0.0%) | 0 (0.0%) |
| 18 to 24 Years | 0 (0.0%) | 0 (0.0%) |
| 25 to 34 Years | 0 (0.0%) | 0 (0.0%) |
| 35 to 44 Years | 0 (0.0%) | 0 (0.0%) |
| 45 to 54 Years | 0 (0.0%) | 0 (0.0%) |
| 55 to 64 Years | 0 (0.0%) | 0 (0.0%) |
| 65 to 74 Years | 0 (0.0%) | 0 (0.0%) |
| 75 Years and over | 0 (0.0%) | 1 (1.4%) |
| Total | 0 (0.0%) | 1 (0.9%) |
Income Above Poverty by Sex and Age in Monterey
According to the poverty statistics in Monterey, males aged 15 years and females aged 12 to 14 years are the age groups that are most secure financially, with 100.0% of males and 100.0% of females in these age groups living above the poverty line.
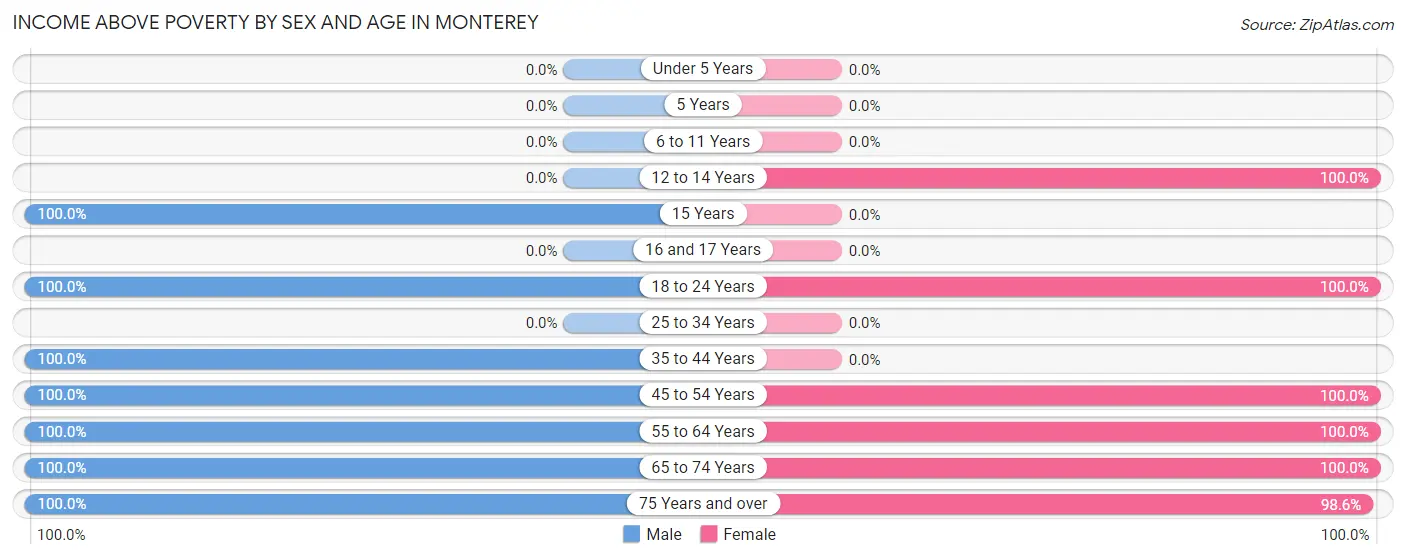
| Age Bracket | Male | Female |
| Under 5 Years | 0 (0.0%) | 0 (0.0%) |
| 5 Years | 0 (0.0%) | 0 (0.0%) |
| 6 to 11 Years | 0 (0.0%) | 0 (0.0%) |
| 12 to 14 Years | 0 (0.0%) | 3 (100.0%) |
| 15 Years | 6 (100.0%) | 0 (0.0%) |
| 16 and 17 Years | 0 (0.0%) | 0 (0.0%) |
| 18 to 24 Years | 2 (100.0%) | 10 (100.0%) |
| 25 to 34 Years | 0 (0.0%) | 0 (0.0%) |
| 35 to 44 Years | 5 (100.0%) | 0 (0.0%) |
| 45 to 54 Years | 8 (100.0%) | 4 (100.0%) |
| 55 to 64 Years | 5 (100.0%) | 12 (100.0%) |
| 65 to 74 Years | 17 (100.0%) | 10 (100.0%) |
| 75 Years and over | 10 (100.0%) | 71 (98.6%) |
| Total | 53 (100.0%) | 110 (99.1%) |
Income Below Poverty Among Married-Couple Families in Monterey
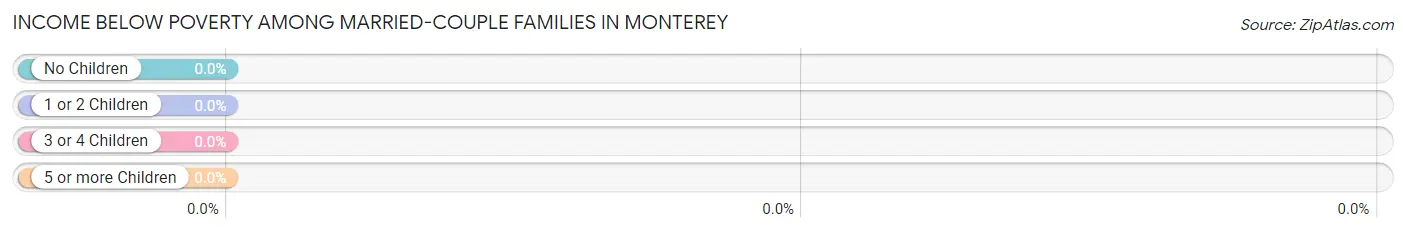
| Children | Above Poverty | Below Poverty |
| No Children | 27 (100.0%) | 0 (0.0%) |
| 1 or 2 Children | 0 (0.0%) | 0 (0.0%) |
| 3 or 4 Children | 0 (0.0%) | 0 (0.0%) |
| 5 or more Children | 0 (0.0%) | 0 (0.0%) |
| Total | 27 (100.0%) | 0 (0.0%) |
Income Below Poverty Among Single-Parent Households in Monterey
| Children | Single Father | Single Mother |
| No Children | 0 (0.0%) | 0 (0.0%) |
| 1 or 2 Children | 0 (0.0%) | 0 (0.0%) |
| 3 or 4 Children | 0 (0.0%) | 0 (0.0%) |
| 5 or more Children | 0 (0.0%) | 0 (0.0%) |
| Total | 0 (0.0%) | 0 (0.0%) |
Income Below Poverty Among Married-Couple vs Single-Parent Households in Monterey
| Children | Married-Couple Families | Single-Parent Households |
| No Children | 0 (0.0%) | 0 (0.0%) |
| 1 or 2 Children | 0 (0.0%) | 0 (0.0%) |
| 3 or 4 Children | 0 (0.0%) | 0 (0.0%) |
| 5 or more Children | 0 (0.0%) | 0 (0.0%) |
| Total | 0 (0.0%) | 0 (0.0%) |
Race in Monterey
The most populous races in Monterey are White / Caucasian (158 | 96.3%), and Asian (6 | 3.7%).
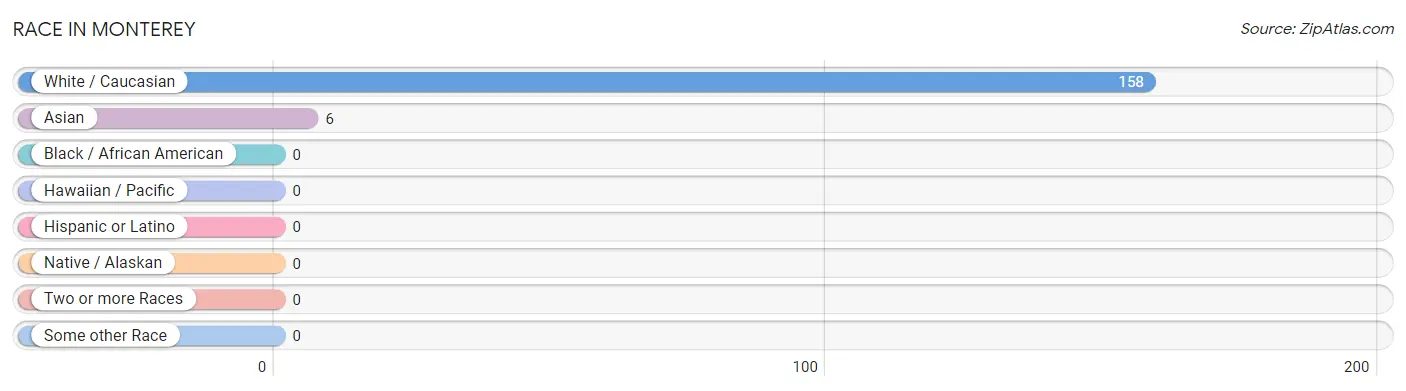
| Race | # Population | % Population |
| Asian | 6 | 3.7% |
| Black / African American | 0 | 0.0% |
| Hawaiian / Pacific | 0 | 0.0% |
| Hispanic or Latino | 0 | 0.0% |
| Native / Alaskan | 0 | 0.0% |
| White / Caucasian | 158 | 96.3% |
| Two or more Races | 0 | 0.0% |
| Some other Race | 0 | 0.0% |
| Total | 164 | 100.0% |
Ancestry in Monterey
The most populous ancestries reported in Monterey are German (45 | 27.4%), English (35 | 21.3%), American (26 | 15.9%), Irish (11 | 6.7%), and Burmese (6 | 3.7%), together accounting for 75.0% of all Monterey residents.
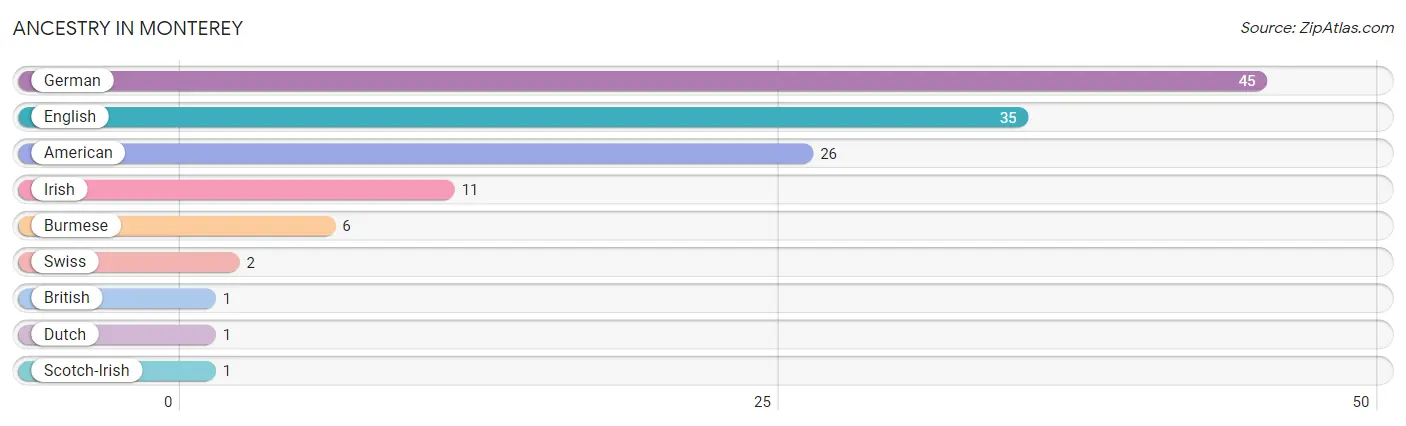
| Ancestry | # Population | % Population |
| American | 26 | 15.9% |
| British | 1 | 0.6% |
| Burmese | 6 | 3.7% |
| Dutch | 1 | 0.6% |
| English | 35 | 21.3% |
| German | 45 | 27.4% |
| Irish | 11 | 6.7% |
| Scotch-Irish | 1 | 0.6% |
| Swiss | 2 | 1.2% | View All 9 Rows |
Immigrants in Monterey
The most numerous immigrant groups reported in Monterey came from Asia (1 | 0.6%), India (1 | 0.6%), and South Central Asia (1 | 0.6%), together accounting for 1.8% of all Monterey residents.
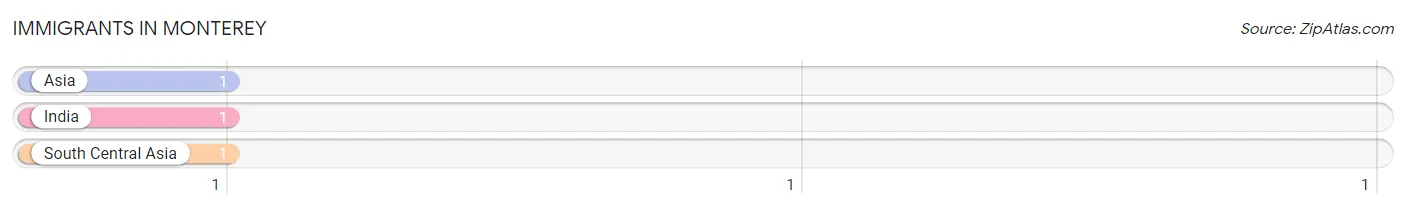
| Immigration Origin | # Population | % Population |
| Asia | 1 | 0.6% |
| India | 1 | 0.6% |
| South Central Asia | 1 | 0.6% | View All 3 Rows |
Sex and Age in Monterey
Sex and Age in Monterey
The most populous age groups in Monterey are 65 to 69 Years (13 | 24.5%) for men and 85 Years and over (65 | 58.6%) for women.
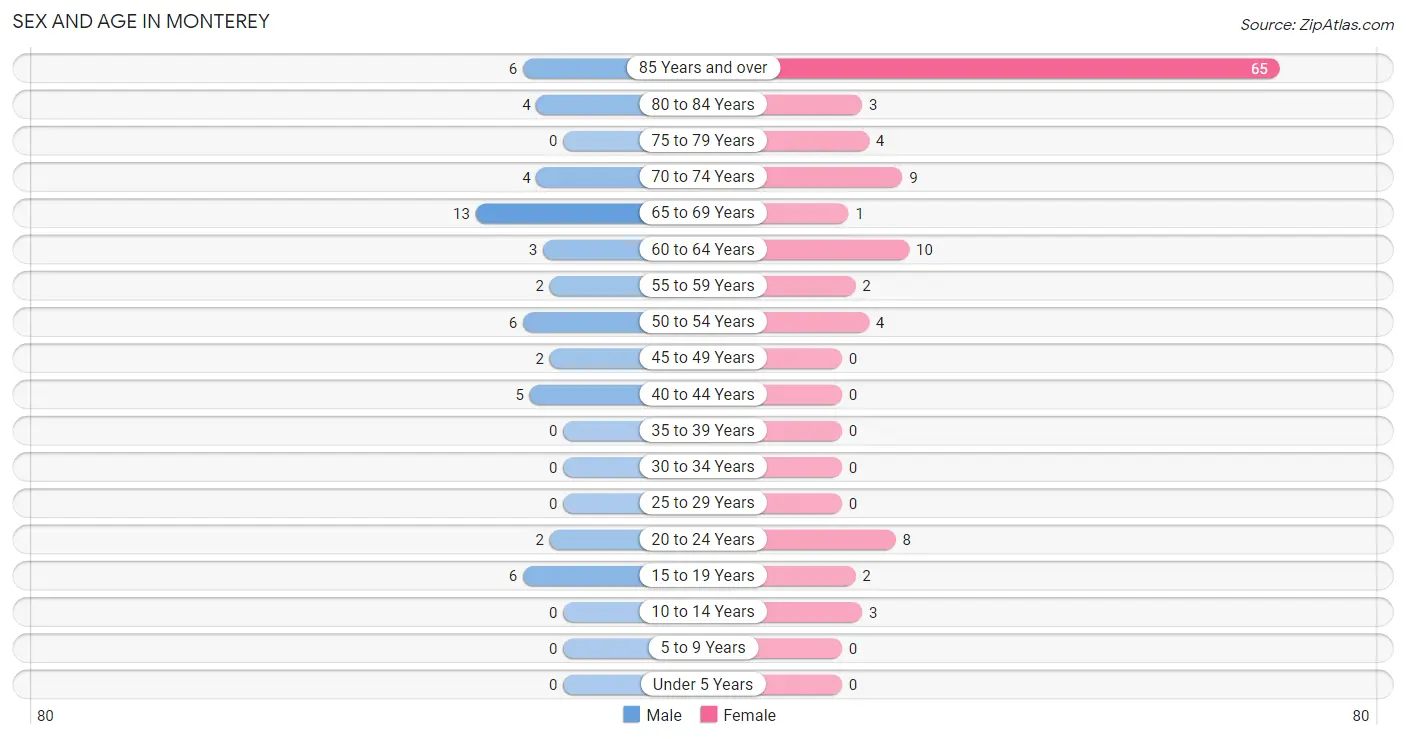
| Age Bracket | Male | Female |
| Under 5 Years | 0 (0.0%) | 0 (0.0%) |
| 5 to 9 Years | 0 (0.0%) | 0 (0.0%) |
| 10 to 14 Years | 0 (0.0%) | 3 (2.7%) |
| 15 to 19 Years | 6 (11.3%) | 2 (1.8%) |
| 20 to 24 Years | 2 (3.8%) | 8 (7.2%) |
| 25 to 29 Years | 0 (0.0%) | 0 (0.0%) |
| 30 to 34 Years | 0 (0.0%) | 0 (0.0%) |
| 35 to 39 Years | 0 (0.0%) | 0 (0.0%) |
| 40 to 44 Years | 5 (9.4%) | 0 (0.0%) |
| 45 to 49 Years | 2 (3.8%) | 0 (0.0%) |
| 50 to 54 Years | 6 (11.3%) | 4 (3.6%) |
| 55 to 59 Years | 2 (3.8%) | 2 (1.8%) |
| 60 to 64 Years | 3 (5.7%) | 10 (9.0%) |
| 65 to 69 Years | 13 (24.5%) | 1 (0.9%) |
| 70 to 74 Years | 4 (7.5%) | 9 (8.1%) |
| 75 to 79 Years | 0 (0.0%) | 4 (3.6%) |
| 80 to 84 Years | 4 (7.5%) | 3 (2.7%) |
| 85 Years and over | 6 (11.3%) | 65 (58.6%) |
| Total | 53 (100.0%) | 111 (100.0%) |
Families and Households in Monterey
Median Family Size in Monterey
The median family size in Monterey is 2.18 persons per family, with single female/mother families (5 | 13.2%) accounting for the largest median family size of 2.8 persons per family. On the other hand, single male/father families (6 | 15.8%) represent the smallest median family size with 2.00 persons per family.
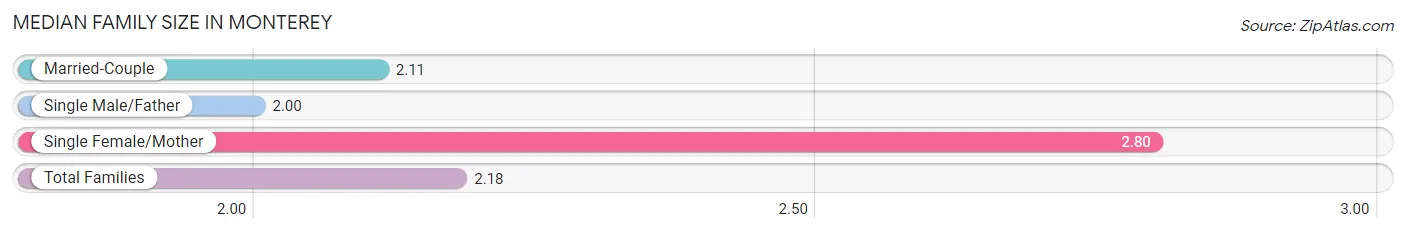
| Family Type | # Families | Family Size |
| Married-Couple | 27 (71.1%) | 2.11 |
| Single Male/Father | 6 (15.8%) | 2.00 |
| Single Female/Mother | 5 (13.2%) | 2.80 |
| Total Families | 38 (100.0%) | 2.18 |
Median Household Size in Monterey
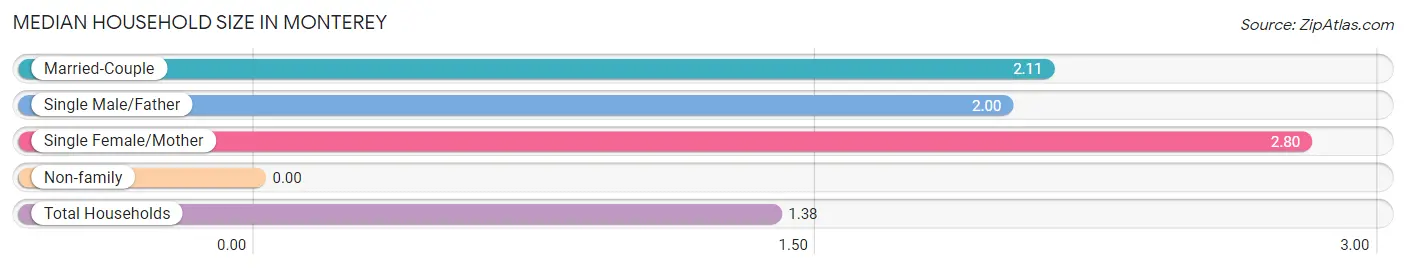
| Household Type | # Households | Household Size |
| Married-Couple | 27 (22.7%) | 2.11 |
| Single Male/Father | 6 (5.0%) | 2.00 |
| Single Female/Mother | 5 (4.2%) | 2.80 |
| Non-family | 81 (68.1%) | - |
| Total Households | 119 (100.0%) | 1.38 |
Household Size by Marriage Status in Monterey
Out of a total of 119 households in Monterey, 38 (31.9%) are family households, while 81 (68.1%) are nonfamily households. The most numerous type of family households are 2-person households, comprising 35, and the most common type of nonfamily households are 1-person households, comprising 81.
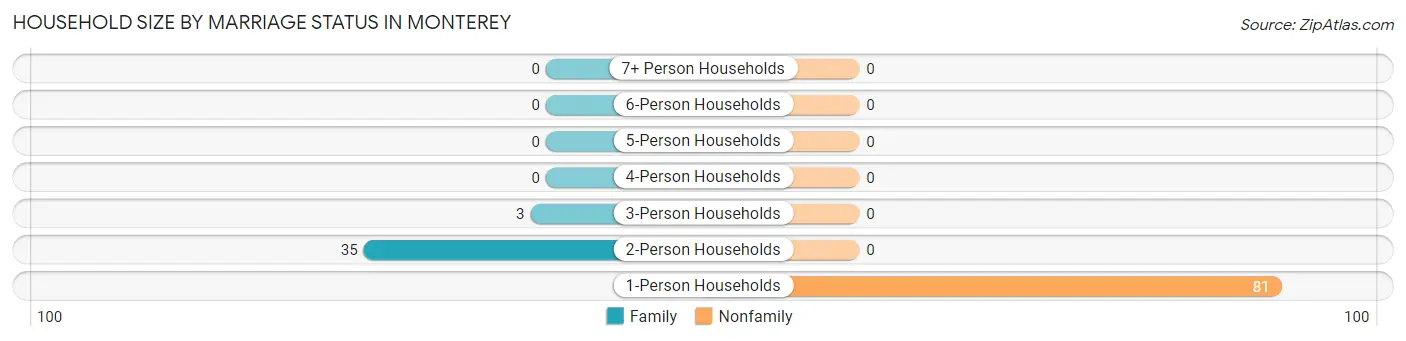
| Household Size | Family Households | Nonfamily Households |
| 1-Person Households | - | 81 (68.1%) |
| 2-Person Households | 35 (29.4%) | 0 (0.0%) |
| 3-Person Households | 3 (2.5%) | 0 (0.0%) |
| 4-Person Households | 0 (0.0%) | 0 (0.0%) |
| 5-Person Households | 0 (0.0%) | 0 (0.0%) |
| 6-Person Households | 0 (0.0%) | 0 (0.0%) |
| 7+ Person Households | 0 (0.0%) | 0 (0.0%) |
| Total | 38 (31.9%) | 81 (68.1%) |
Female Fertility in Monterey
Fertility by Age in Monterey
| Age Bracket | Women with Births | Births / 1,000 Women |
| 15 to 19 years | 0 (0.0%) | 0.0 |
| 20 to 34 years | 0 (0.0%) | 0.0 |
| 35 to 50 years | 0 (0.0%) | 0.0 |
| Total | 0 (0.0%) | 0.0 |
Fertility by Age by Marriage Status in Monterey
| Age Bracket | Married | Unmarried |
| 15 to 19 years | 0 (0.0%) | 0 (0.0%) |
| 20 to 34 years | 0 (0.0%) | 0 (0.0%) |
| 35 to 50 years | 0 (0.0%) | 0 (0.0%) |
| Total | 0 (0.0%) | 0 (0.0%) |
Fertility by Education in Monterey
| Educational Attainment | Women with Births | Births / 1,000 Women |
| Less than High School | 0 (0.0%) | 0.0 |
| High School Diploma | 0 (0.0%) | 0.0 |
| College or Associate's Degree | 0 (0.0%) | 0.0 |
| Bachelor's Degree | 0 (0.0%) | 0.0 |
| Graduate Degree | 0 (0.0%) | 0.0 |
| Total | 0 (0.0%) | 0.0 |
Fertility by Education by Marriage Status in Monterey
| Educational Attainment | Married | Unmarried |
| Less than High School | 0 (0.0%) | 0 (0.0%) |
| High School Diploma | 0 (0.0%) | 0 (0.0%) |
| College or Associate's Degree | 0 (0.0%) | 0 (0.0%) |
| Bachelor's Degree | 0 (0.0%) | 0 (0.0%) |
| Graduate Degree | 0 (0.0%) | 0 (0.0%) |
| Total | 0 (0.0%) | 0 (0.0%) |
Employment Characteristics in Monterey
Employment by Class of Employer in Monterey
Among the 48 employed individuals in Monterey, private company employees (23 | 47.9%), not-for-profit organizations (15 | 31.2%), and self-employed (incorporated) (4 | 8.3%) make up the most common classes of employment.
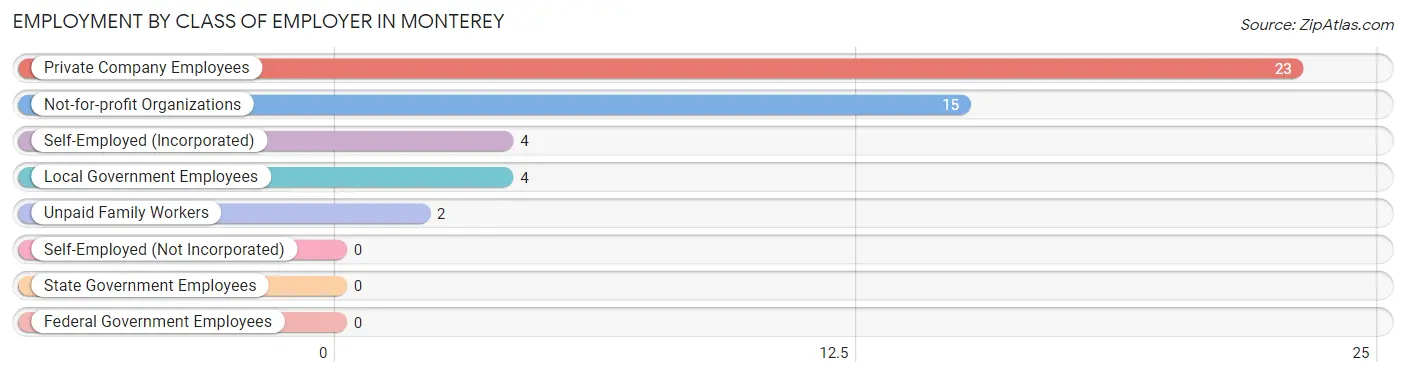
| Employer Class | # Employees | % Employees |
| Private Company Employees | 23 | 47.9% |
| Self-Employed (Incorporated) | 4 | 8.3% |
| Self-Employed (Not Incorporated) | 0 | 0.0% |
| Not-for-profit Organizations | 15 | 31.2% |
| Local Government Employees | 4 | 8.3% |
| State Government Employees | 0 | 0.0% |
| Federal Government Employees | 0 | 0.0% |
| Unpaid Family Workers | 2 | 4.2% |
| Total | 48 | 100.0% |
Employment Status by Age in Monterey
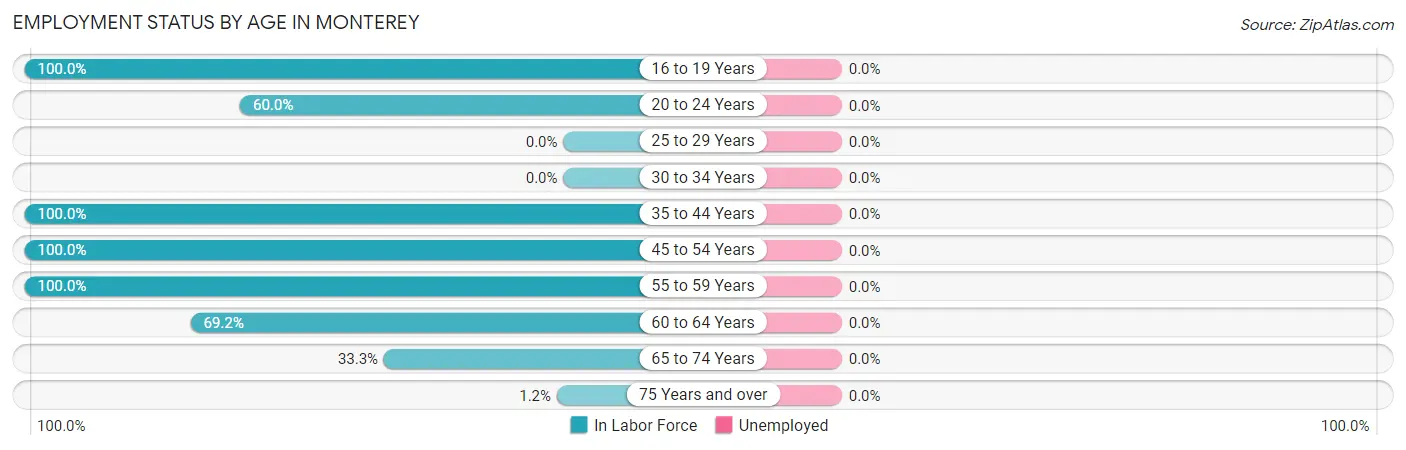
| Age Bracket | In Labor Force | Unemployed |
| 16 to 19 Years | 2 (100.0%) | 0 (0.0%) |
| 20 to 24 Years | 6 (60.0%) | 0 (0.0%) |
| 25 to 29 Years | 0 (0.0%) | 0 (0.0%) |
| 30 to 34 Years | 0 (0.0%) | 0 (0.0%) |
| 35 to 44 Years | 5 (100.0%) | 0 (0.0%) |
| 45 to 54 Years | 12 (100.0%) | 0 (0.0%) |
| 55 to 59 Years | 4 (100.0%) | 0 (0.0%) |
| 60 to 64 Years | 9 (69.2%) | 0 (0.0%) |
| 65 to 74 Years | 9 (33.3%) | 0 (0.0%) |
| 75 Years and over | 1 (1.2%) | 0 (0.0%) |
| Total | 48 (31.0%) | 0 (0.0%) |
Employment Status by Educational Attainment in Monterey
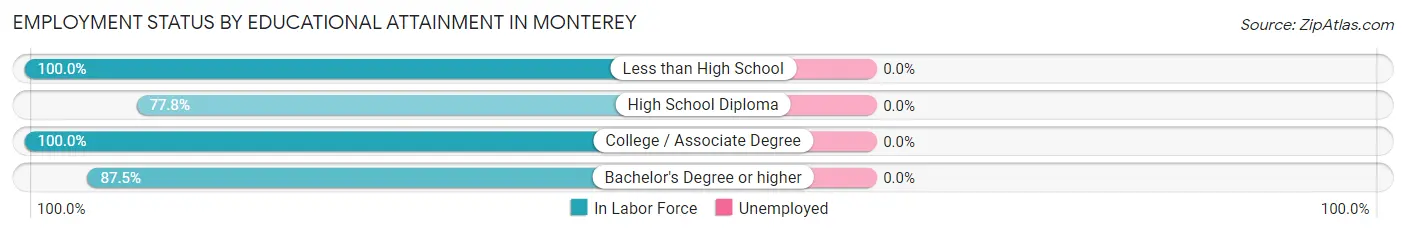
| Educational Attainment | In Labor Force | Unemployed |
| Less than High School | 3 (100.0%) | 0 (0.0%) |
| High School Diploma | 7 (77.8%) | 0 (0.0%) |
| College / Associate Degree | 6 (100.0%) | 0 (0.0%) |
| Bachelor's Degree or higher | 14 (87.5%) | 0 (0.0%) |
| Total | 30 (88.2%) | 0 (0.0%) |
Employment Occupations by Sex in Monterey
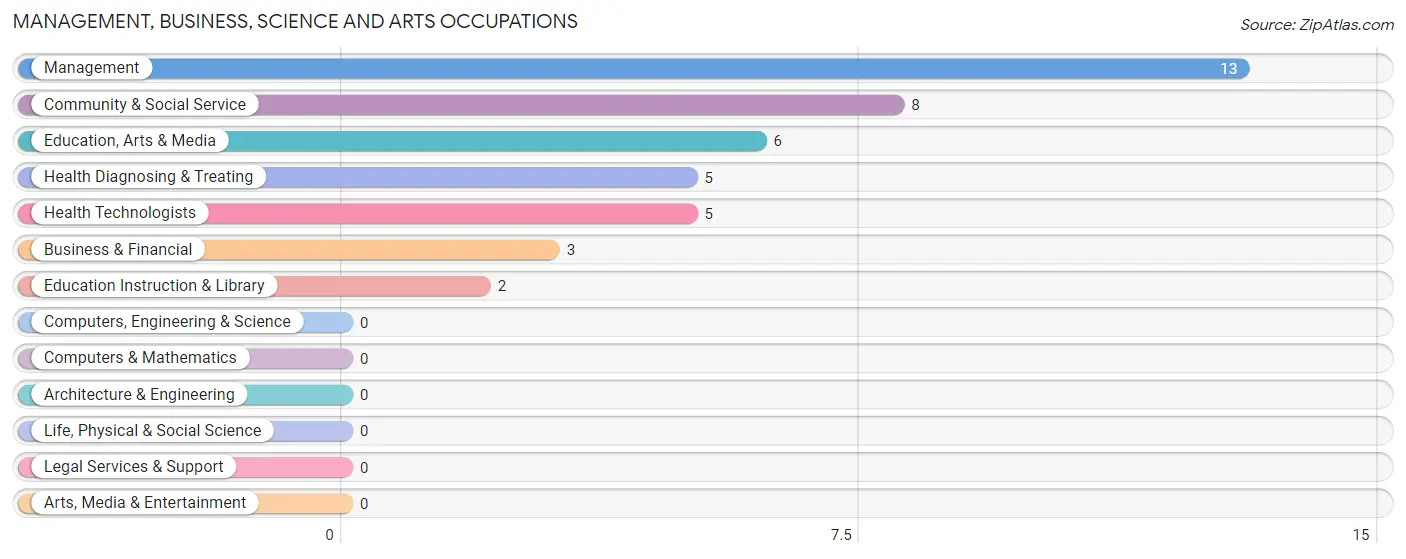
Management, Business, Science and Arts Occupations
The most common Management, Business, Science and Arts occupations in Monterey are Management (13 | 27.1%), Community & Social Service (8 | 16.7%), Education, Arts & Media (6 | 12.5%), Health Diagnosing & Treating (5 | 10.4%), and Health Technologists (5 | 10.4%).
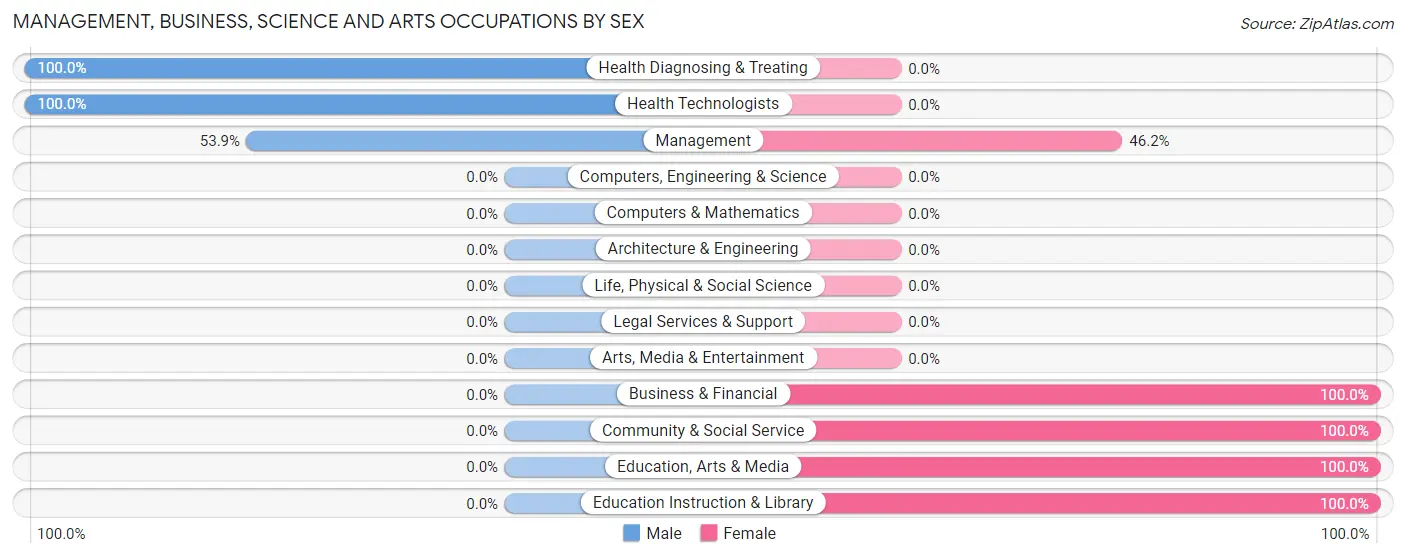
Management, Business, Science and Arts Occupations by Sex
Within the Management, Business, Science and Arts occupations in Monterey, the most male-oriented occupations are Health Diagnosing & Treating (100.0%), Health Technologists (100.0%), and Management (53.8%), while the most female-oriented occupations are Business & Financial (100.0%), Community & Social Service (100.0%), and Education, Arts & Media (100.0%).
| Occupation | Male | Female |
| Management | 7 (53.8%) | 6 (46.2%) |
| Business & Financial | 0 (0.0%) | 3 (100.0%) |
| Computers, Engineering & Science | 0 (0.0%) | 0 (0.0%) |
| Computers & Mathematics | 0 (0.0%) | 0 (0.0%) |
| Architecture & Engineering | 0 (0.0%) | 0 (0.0%) |
| Life, Physical & Social Science | 0 (0.0%) | 0 (0.0%) |
| Community & Social Service | 0 (0.0%) | 8 (100.0%) |
| Education, Arts & Media | 0 (0.0%) | 6 (100.0%) |
| Legal Services & Support | 0 (0.0%) | 0 (0.0%) |
| Education Instruction & Library | 0 (0.0%) | 2 (100.0%) |
| Arts, Media & Entertainment | 0 (0.0%) | 0 (0.0%) |
| Health Diagnosing & Treating | 5 (100.0%) | 0 (0.0%) |
| Health Technologists | 5 (100.0%) | 0 (0.0%) |
| Total (Category) | 12 (41.4%) | 17 (58.6%) |
| Total (Overall) | 24 (50.0%) | 24 (50.0%) |
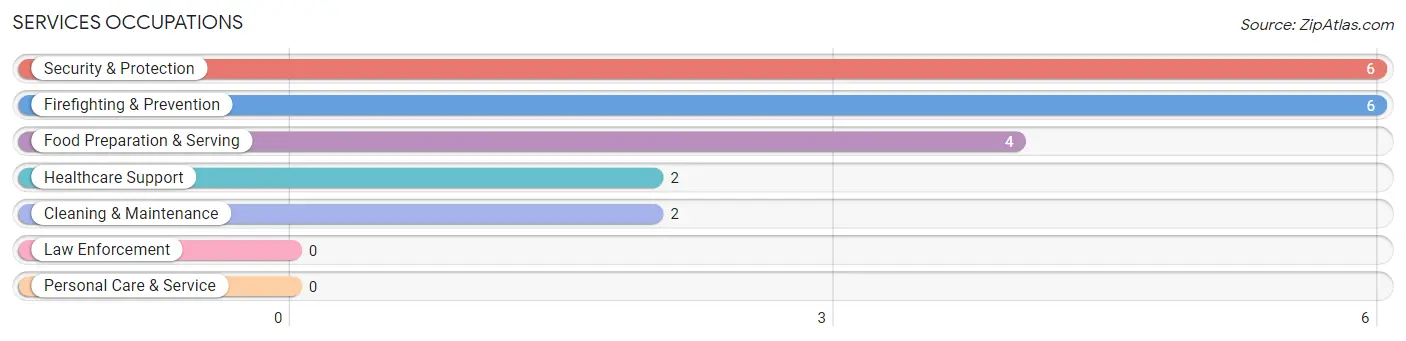
Services Occupations
The most common Services occupations in Monterey are Security & Protection (6 | 12.5%), Firefighting & Prevention (6 | 12.5%), Food Preparation & Serving (4 | 8.3%), Healthcare Support (2 | 4.2%), and Cleaning & Maintenance (2 | 4.2%).
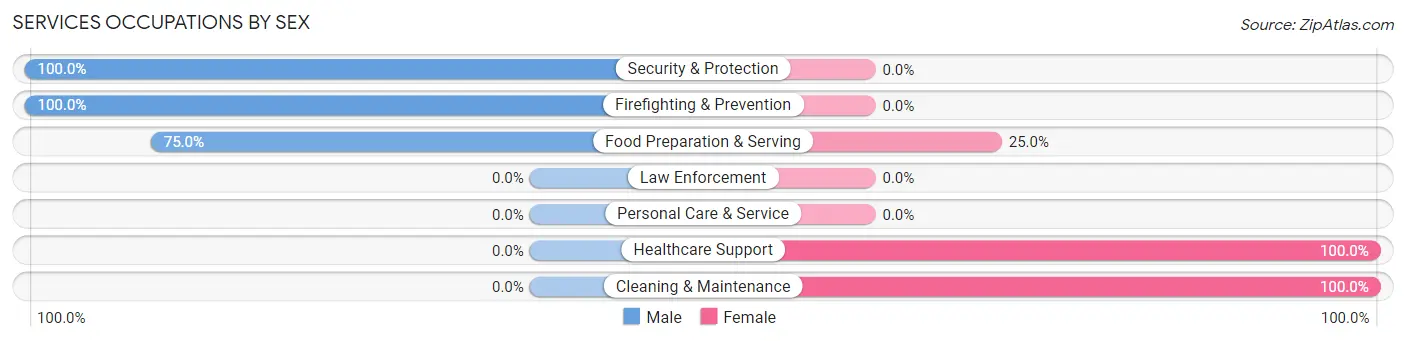
Services Occupations by Sex
Within the Services occupations in Monterey, the most male-oriented occupations are Security & Protection (100.0%), Firefighting & Prevention (100.0%), and Food Preparation & Serving (75.0%), while the most female-oriented occupations are Healthcare Support (100.0%), Cleaning & Maintenance (100.0%), and Food Preparation & Serving (25.0%).
| Occupation | Male | Female |
| Healthcare Support | 0 (0.0%) | 2 (100.0%) |
| Security & Protection | 6 (100.0%) | 0 (0.0%) |
| Firefighting & Prevention | 6 (100.0%) | 0 (0.0%) |
| Law Enforcement | 0 (0.0%) | 0 (0.0%) |
| Food Preparation & Serving | 3 (75.0%) | 1 (25.0%) |
| Cleaning & Maintenance | 0 (0.0%) | 2 (100.0%) |
| Personal Care & Service | 0 (0.0%) | 0 (0.0%) |
| Total (Category) | 9 (64.3%) | 5 (35.7%) |
| Total (Overall) | 24 (50.0%) | 24 (50.0%) |
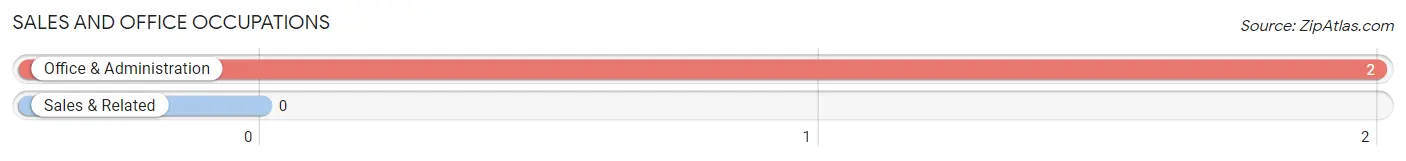
Sales and Office Occupations
The most common Sales and Office occupations in Monterey are , and Office & Administration (2 | 4.2%).
Sales and Office Occupations by Sex
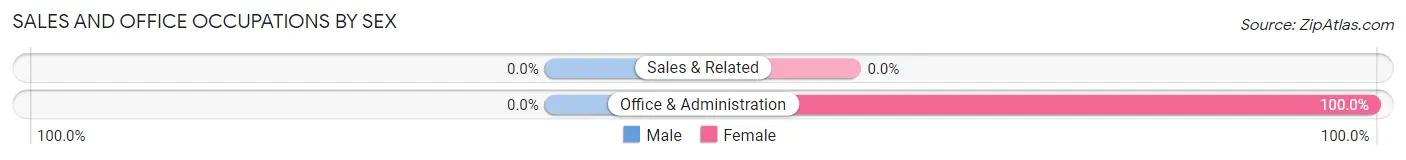
| Occupation | Male | Female |
| Sales & Related | 0 (0.0%) | 0 (0.0%) |
| Office & Administration | 0 (0.0%) | 2 (100.0%) |
| Total (Category) | 0 (0.0%) | 2 (100.0%) |
| Total (Overall) | 24 (50.0%) | 24 (50.0%) |
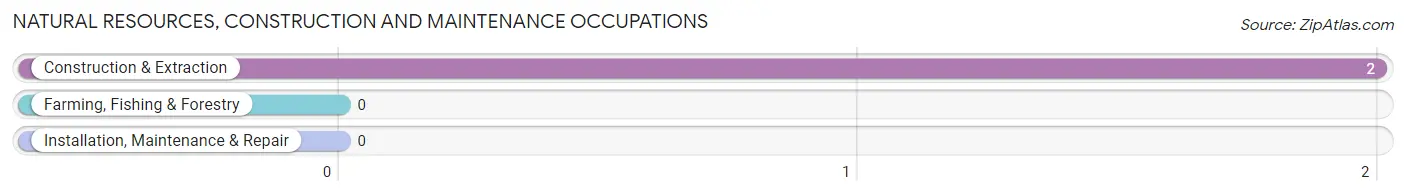
Natural Resources, Construction and Maintenance Occupations
The most common Natural Resources, Construction and Maintenance occupations in Monterey are , and Construction & Extraction (2 | 4.2%).
Natural Resources, Construction and Maintenance Occupations by Sex
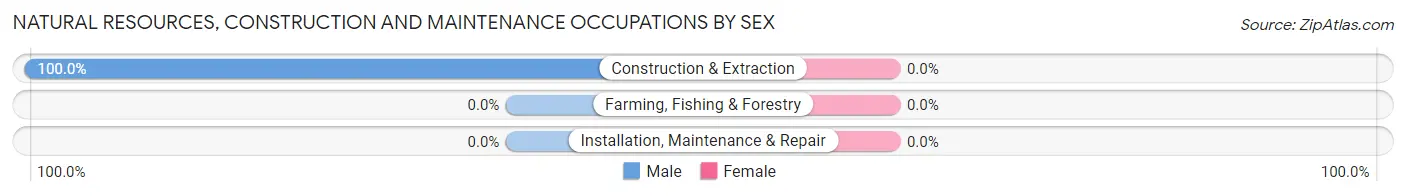
| Occupation | Male | Female |
| Farming, Fishing & Forestry | 0 (0.0%) | 0 (0.0%) |
| Construction & Extraction | 2 (100.0%) | 0 (0.0%) |
| Installation, Maintenance & Repair | 0 (0.0%) | 0 (0.0%) |
| Total (Category) | 2 (100.0%) | 0 (0.0%) |
| Total (Overall) | 24 (50.0%) | 24 (50.0%) |
Production, Transportation and Moving Occupations
The most common Production, Transportation and Moving occupations in Monterey are , and Production (1 | 2.1%).
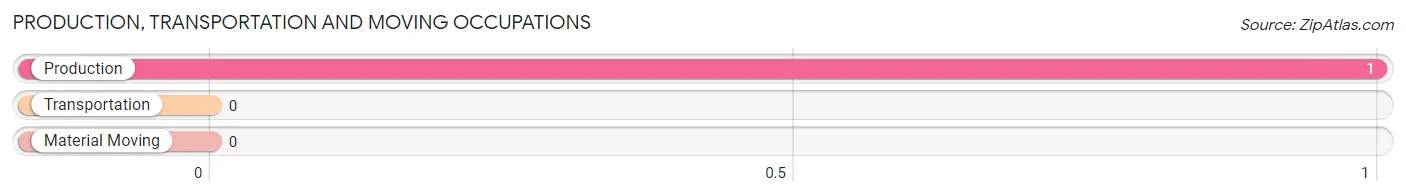
Production, Transportation and Moving Occupations by Sex
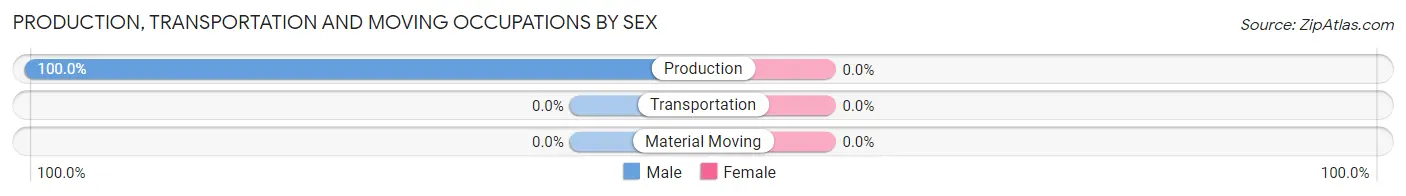
| Occupation | Male | Female |
| Production | 1 (100.0%) | 0 (0.0%) |
| Transportation | 0 (0.0%) | 0 (0.0%) |
| Material Moving | 0 (0.0%) | 0 (0.0%) |
| Total (Category) | 1 (100.0%) | 0 (0.0%) |
| Total (Overall) | 24 (50.0%) | 24 (50.0%) |
Employment Industries by Sex in Monterey
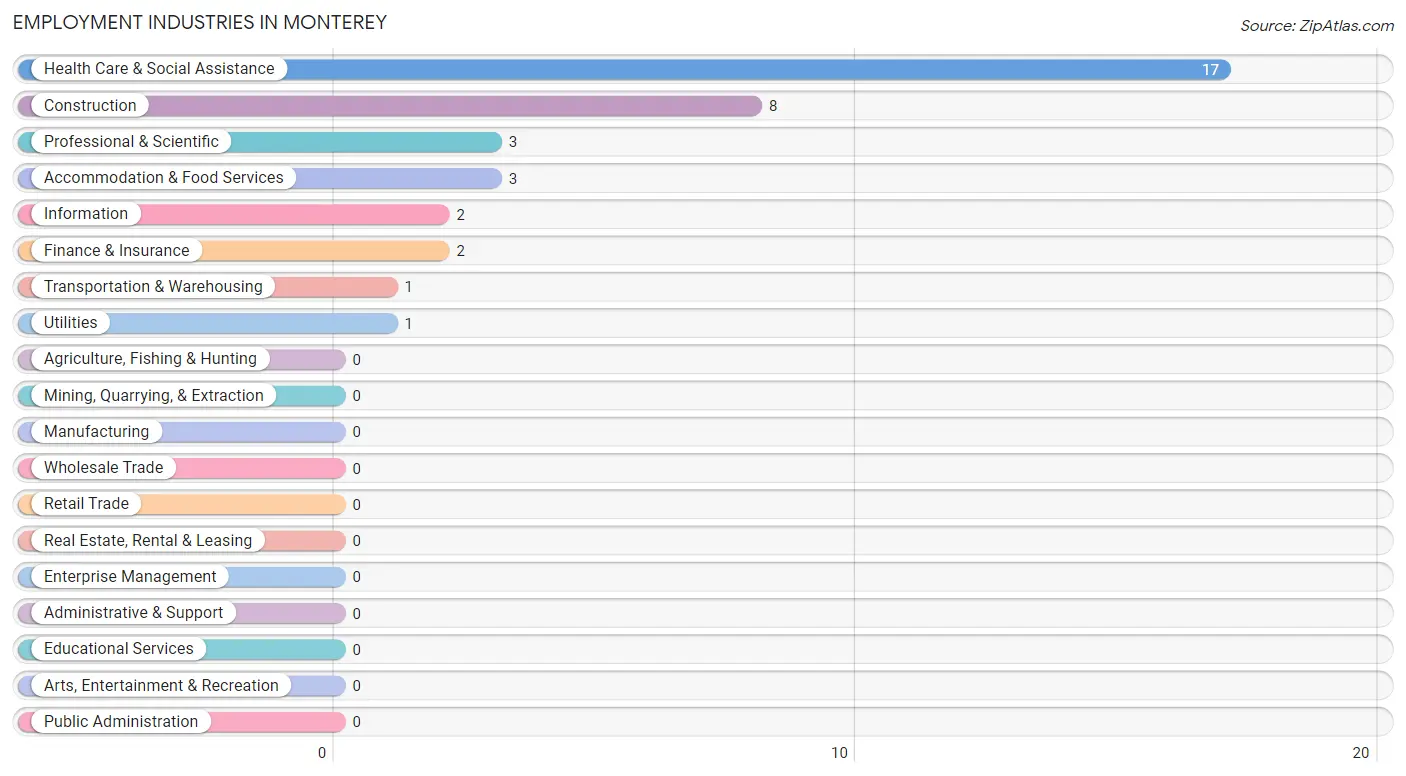
Employment Industries in Monterey
The major employment industries in Monterey include Health Care & Social Assistance (17 | 35.4%), Construction (8 | 16.7%), Professional & Scientific (3 | 6.2%), Accommodation & Food Services (3 | 6.2%), and Information (2 | 4.2%).
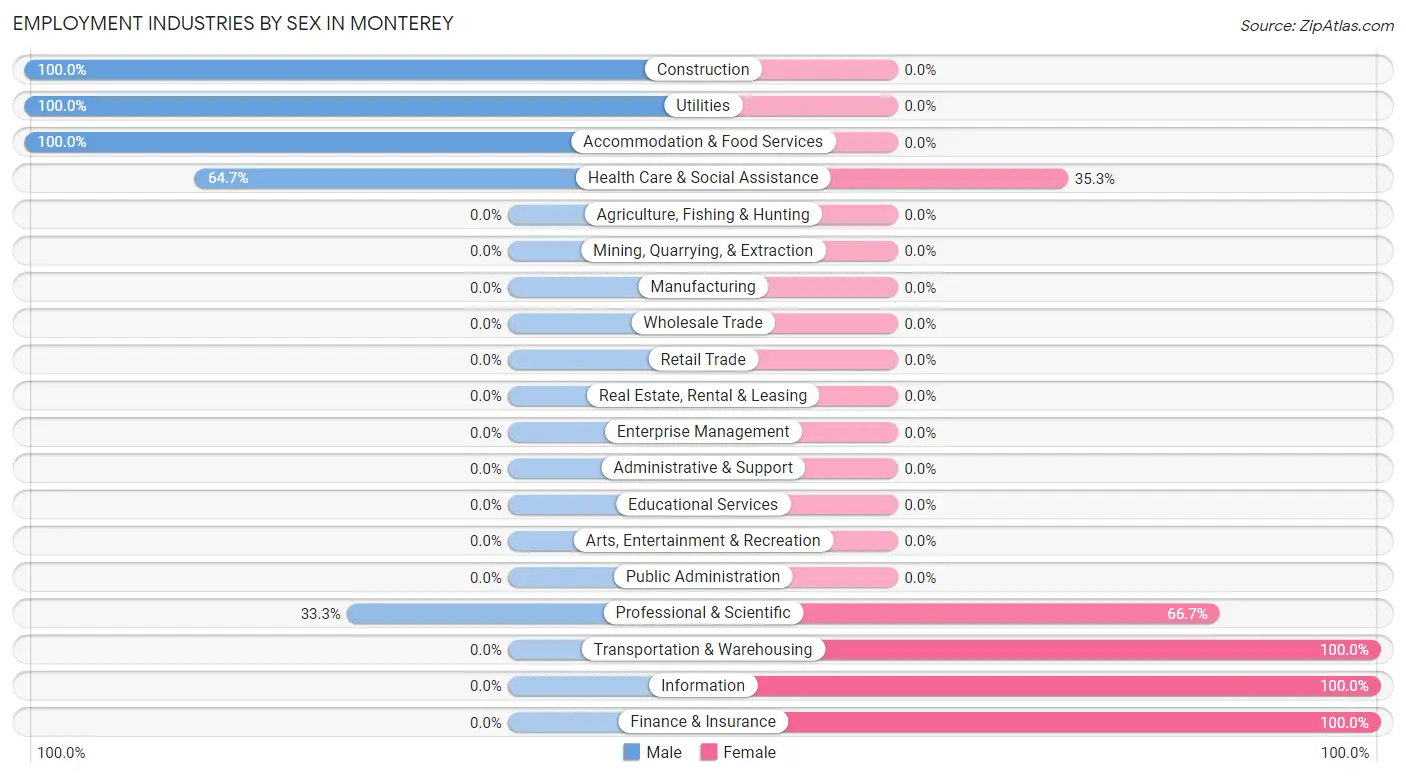
Employment Industries by Sex in Monterey
The Monterey industries that see more men than women are Construction (100.0%), Utilities (100.0%), and Accommodation & Food Services (100.0%), whereas the industries that tend to have a higher number of women are Transportation & Warehousing (100.0%), Information (100.0%), and Finance & Insurance (100.0%).
| Industry | Male | Female |
| Agriculture, Fishing & Hunting | 0 (0.0%) | 0 (0.0%) |
| Mining, Quarrying, & Extraction | 0 (0.0%) | 0 (0.0%) |
| Construction | 8 (100.0%) | 0 (0.0%) |
| Manufacturing | 0 (0.0%) | 0 (0.0%) |
| Wholesale Trade | 0 (0.0%) | 0 (0.0%) |
| Retail Trade | 0 (0.0%) | 0 (0.0%) |
| Transportation & Warehousing | 0 (0.0%) | 1 (100.0%) |
| Utilities | 1 (100.0%) | 0 (0.0%) |
| Information | 0 (0.0%) | 2 (100.0%) |
| Finance & Insurance | 0 (0.0%) | 2 (100.0%) |
| Real Estate, Rental & Leasing | 0 (0.0%) | 0 (0.0%) |
| Professional & Scientific | 1 (33.3%) | 2 (66.7%) |
| Enterprise Management | 0 (0.0%) | 0 (0.0%) |
| Administrative & Support | 0 (0.0%) | 0 (0.0%) |
| Educational Services | 0 (0.0%) | 0 (0.0%) |
| Health Care & Social Assistance | 11 (64.7%) | 6 (35.3%) |
| Arts, Entertainment & Recreation | 0 (0.0%) | 0 (0.0%) |
| Accommodation & Food Services | 3 (100.0%) | 0 (0.0%) |
| Public Administration | 0 (0.0%) | 0 (0.0%) |
| Total | 24 (50.0%) | 24 (50.0%) |
Education in Monterey
School Enrollment in Monterey
The most common levels of schooling among the 13 students in Monterey are high school (8 | 61.5%), middle school (3 | 23.1%), and college / undergraduate (2 | 15.4%).
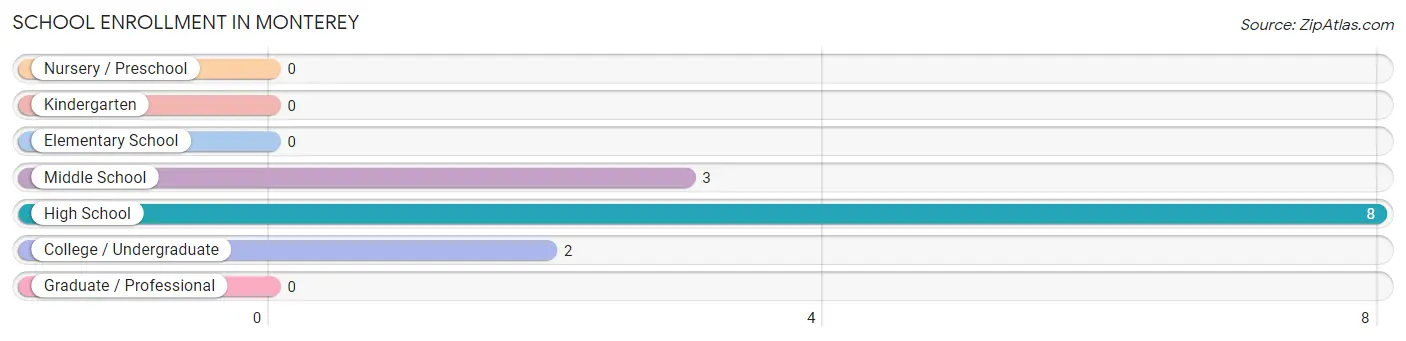
| School Level | # Students | % Students |
| Nursery / Preschool | 0 | 0.0% |
| Kindergarten | 0 | 0.0% |
| Elementary School | 0 | 0.0% |
| Middle School | 3 | 23.1% |
| High School | 8 | 61.5% |
| College / Undergraduate | 2 | 15.4% |
| Graduate / Professional | 0 | 0.0% |
| Total | 13 | 100.0% |
School Enrollment by Age by Funding Source in Monterey
Out of a total of 13 students who are enrolled in schools in Monterey, 4 (30.8%) attend a private institution, while the remaining 9 (69.2%) are enrolled in public schools. The age group of 18 to 19 year olds has the highest likelihood of being enrolled in private schools, with 2 (100.0% in the age bracket) enrolled. Conversely, the age group of 10 to 14 year olds has the lowest likelihood of being enrolled in a private school, with 3 (100.0% in the age bracket) attending a public institution.
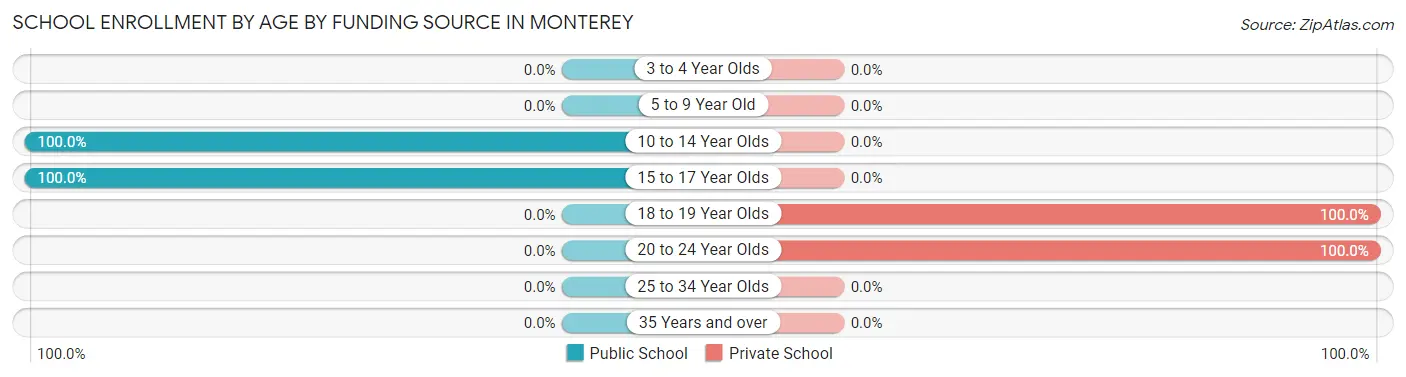
| Age Bracket | Public School | Private School |
| 3 to 4 Year Olds | 0 (0.0%) | 0 (0.0%) |
| 5 to 9 Year Old | 0 (0.0%) | 0 (0.0%) |
| 10 to 14 Year Olds | 3 (100.0%) | 0 (0.0%) |
| 15 to 17 Year Olds | 6 (100.0%) | 0 (0.0%) |
| 18 to 19 Year Olds | 0 (0.0%) | 2 (100.0%) |
| 20 to 24 Year Olds | 0 (0.0%) | 2 (100.0%) |
| 25 to 34 Year Olds | 0 (0.0%) | 0 (0.0%) |
| 35 Years and over | 0 (0.0%) | 0 (0.0%) |
| Total | 9 (69.2%) | 4 (30.8%) |
Educational Attainment by Field of Study in Monterey
Education (72 | 71.3%), business (15 | 14.8%), engineering (5 | 5.0%), arts & humanities (5 | 5.0%), and social sciences (2 | 2.0%) are the most common fields of study among 101 individuals in Monterey who have obtained a bachelor's degree or higher.
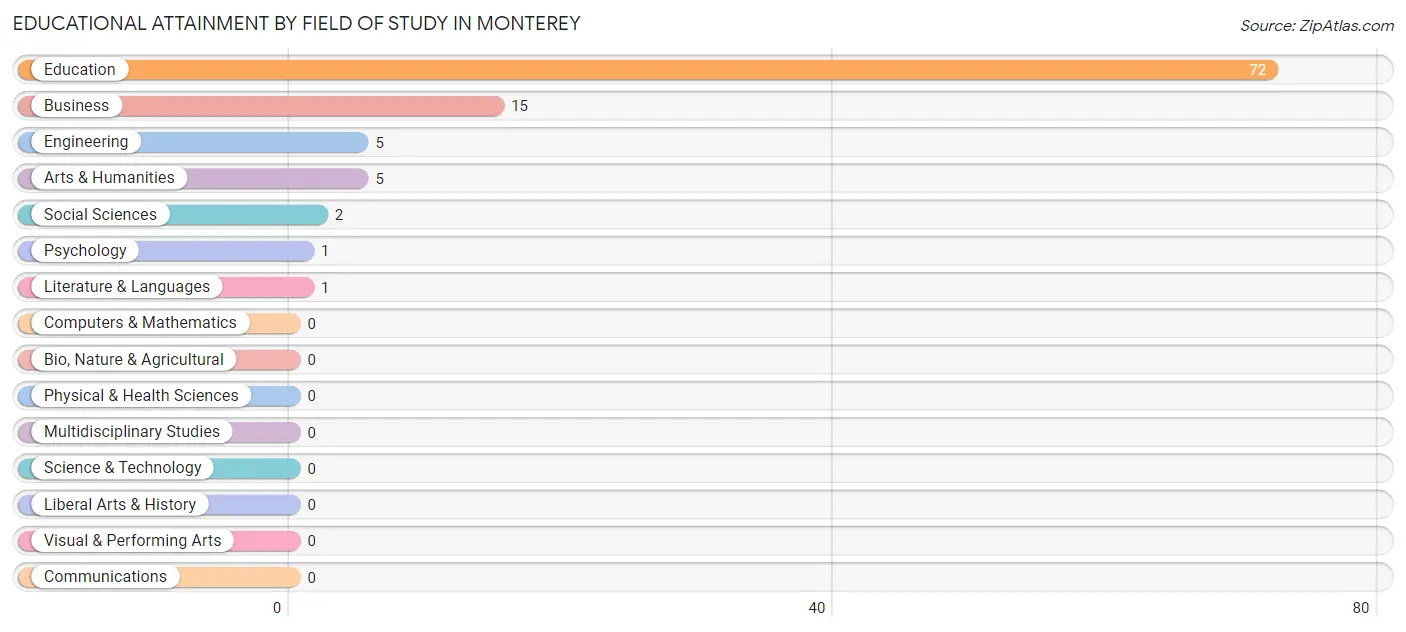
| Field of Study | # Graduates | % Graduates |
| Computers & Mathematics | 0 | 0.0% |
| Bio, Nature & Agricultural | 0 | 0.0% |
| Physical & Health Sciences | 0 | 0.0% |
| Psychology | 1 | 1.0% |
| Social Sciences | 2 | 2.0% |
| Engineering | 5 | 5.0% |
| Multidisciplinary Studies | 0 | 0.0% |
| Science & Technology | 0 | 0.0% |
| Business | 15 | 14.8% |
| Education | 72 | 71.3% |
| Literature & Languages | 1 | 1.0% |
| Liberal Arts & History | 0 | 0.0% |
| Visual & Performing Arts | 0 | 0.0% |
| Communications | 0 | 0.0% |
| Arts & Humanities | 5 | 5.0% |
| Total | 101 | 100.0% |
Transportation & Commute in Monterey
Vehicle Availability by Sex in Monterey
The most prevalent vehicle ownership categories in Monterey are males with 2 vehicles (8, accounting for 33.3%) and females with 2 vehicles (12, making up 33.3%).
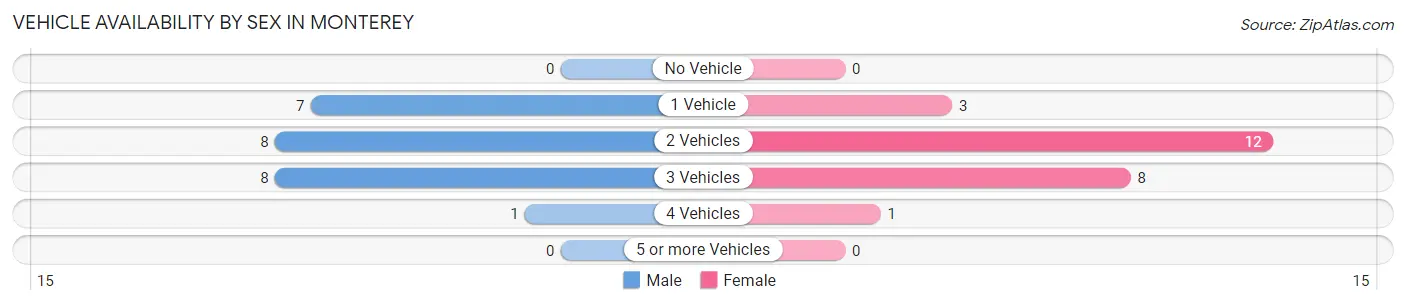
| Vehicles Available | Male | Female |
| No Vehicle | 0 (0.0%) | 0 (0.0%) |
| 1 Vehicle | 7 (29.2%) | 3 (12.5%) |
| 2 Vehicles | 8 (33.3%) | 12 (50.0%) |
| 3 Vehicles | 8 (33.3%) | 8 (33.3%) |
| 4 Vehicles | 1 (4.2%) | 1 (4.2%) |
| 5 or more Vehicles | 0 (0.0%) | 0 (0.0%) |
| Total | 24 (100.0%) | 24 (100.0%) |
Commute Time in Monterey
The most frequently occuring commute durations in Monterey are 5 to 9 minutes (15 commuters, 33.3%), less than 5 minutes (9 commuters, 20.0%), and 15 to 19 minutes (6 commuters, 13.3%).
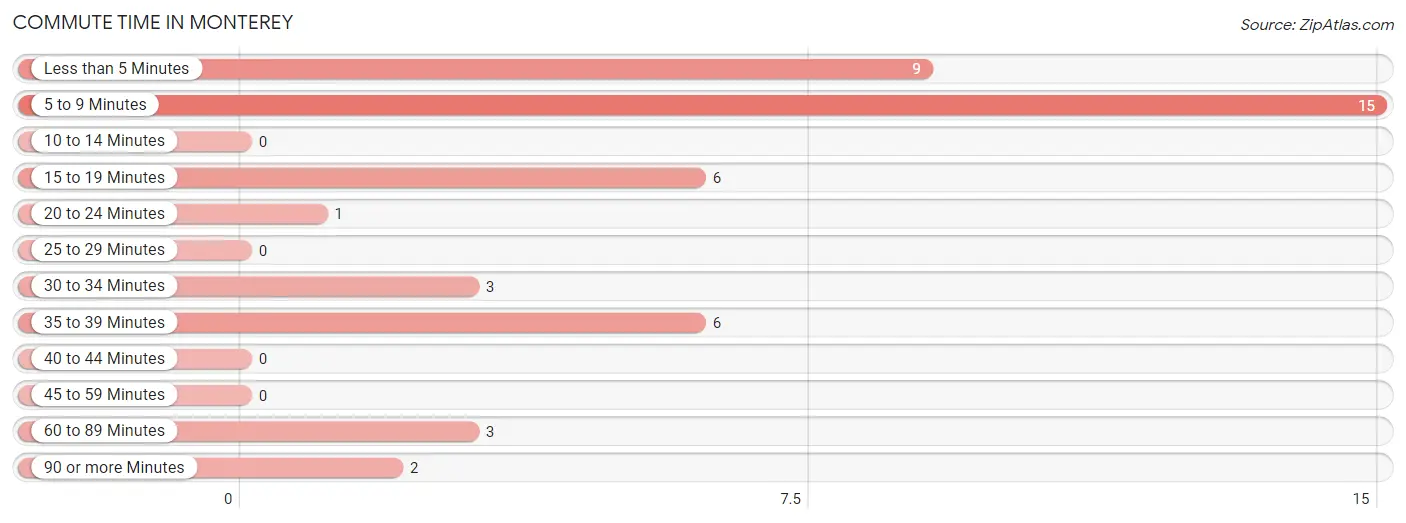
| Commute Time | # Commuters | % Commuters |
| Less than 5 Minutes | 9 | 20.0% |
| 5 to 9 Minutes | 15 | 33.3% |
| 10 to 14 Minutes | 0 | 0.0% |
| 15 to 19 Minutes | 6 | 13.3% |
| 20 to 24 Minutes | 1 | 2.2% |
| 25 to 29 Minutes | 0 | 0.0% |
| 30 to 34 Minutes | 3 | 6.7% |
| 35 to 39 Minutes | 6 | 13.3% |
| 40 to 44 Minutes | 0 | 0.0% |
| 45 to 59 Minutes | 0 | 0.0% |
| 60 to 89 Minutes | 3 | 6.7% |
| 90 or more Minutes | 2 | 4.4% |
Commute Time by Sex in Monterey
The most common commute times in Monterey are 15 to 19 minutes (6 commuters, 26.1%) for males and 5 to 9 minutes (15 commuters, 68.2%) for females.
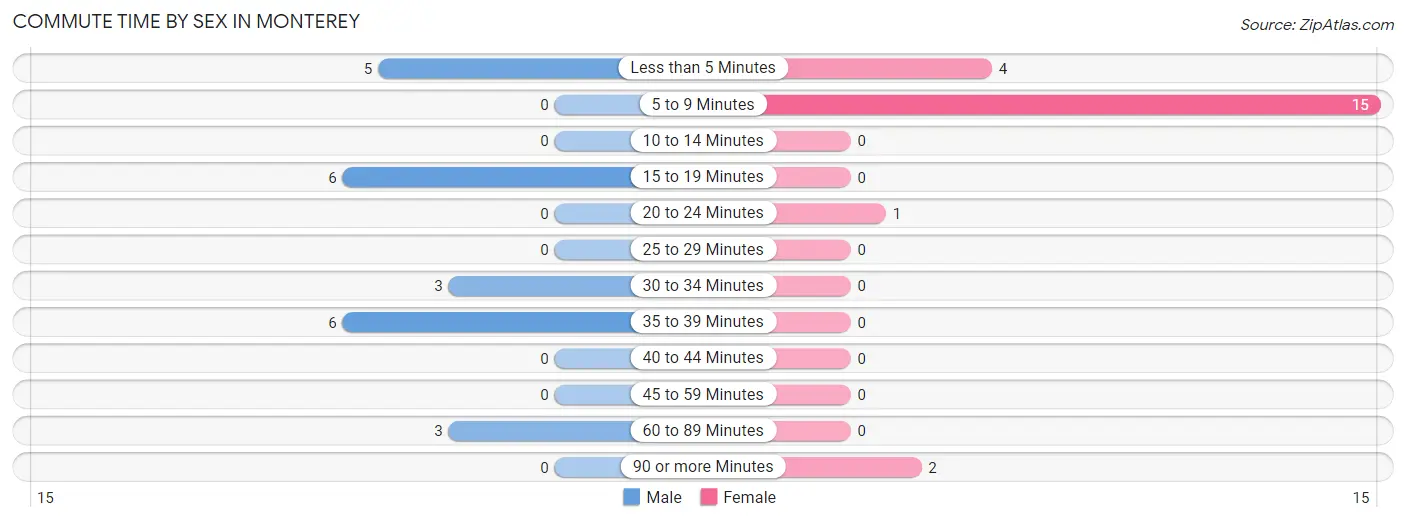
| Commute Time | Male | Female |
| Less than 5 Minutes | 5 (21.7%) | 4 (18.2%) |
| 5 to 9 Minutes | 0 (0.0%) | 15 (68.2%) |
| 10 to 14 Minutes | 0 (0.0%) | 0 (0.0%) |
| 15 to 19 Minutes | 6 (26.1%) | 0 (0.0%) |
| 20 to 24 Minutes | 0 (0.0%) | 1 (4.5%) |
| 25 to 29 Minutes | 0 (0.0%) | 0 (0.0%) |
| 30 to 34 Minutes | 3 (13.0%) | 0 (0.0%) |
| 35 to 39 Minutes | 6 (26.1%) | 0 (0.0%) |
| 40 to 44 Minutes | 0 (0.0%) | 0 (0.0%) |
| 45 to 59 Minutes | 0 (0.0%) | 0 (0.0%) |
| 60 to 89 Minutes | 3 (13.0%) | 0 (0.0%) |
| 90 or more Minutes | 0 (0.0%) | 2 (9.1%) |
Time of Departure to Work by Sex in Monterey
The most frequent times of departure to work in Monterey are 6:00 AM to 6:29 AM (6, 26.1%) for males and 7:30 AM to 7:59 AM (9, 40.9%) for females.
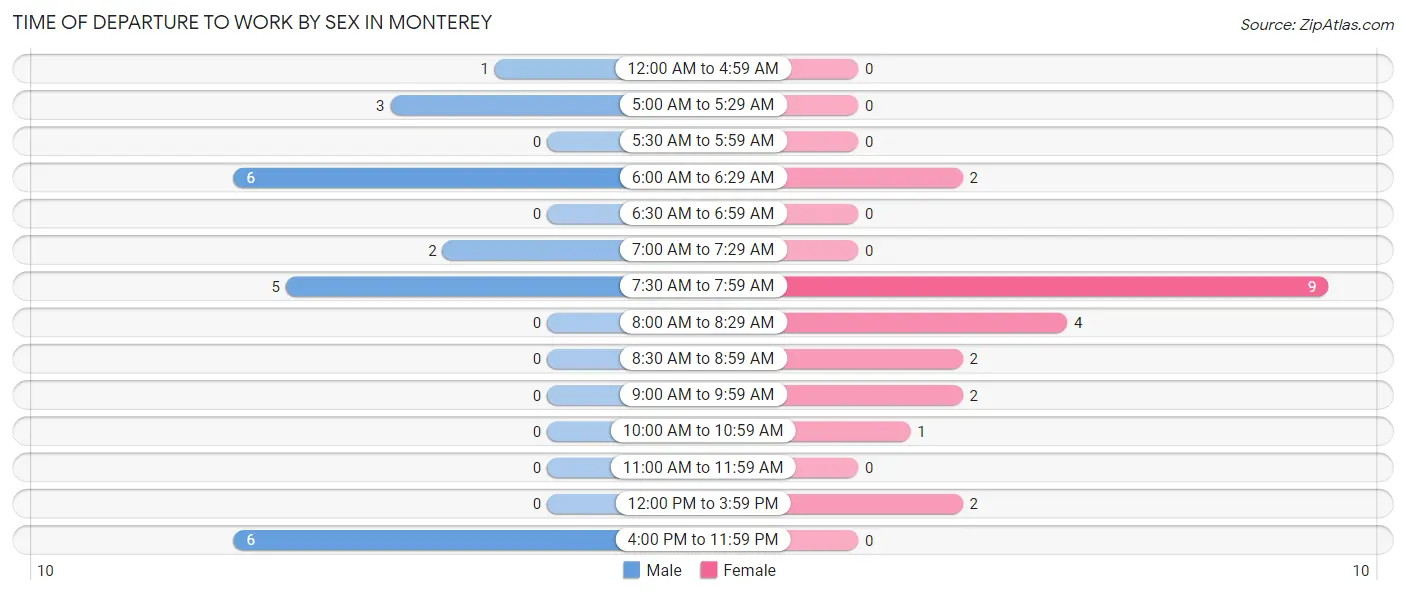
| Time of Departure | Male | Female |
| 12:00 AM to 4:59 AM | 1 (4.3%) | 0 (0.0%) |
| 5:00 AM to 5:29 AM | 3 (13.0%) | 0 (0.0%) |
| 5:30 AM to 5:59 AM | 0 (0.0%) | 0 (0.0%) |
| 6:00 AM to 6:29 AM | 6 (26.1%) | 2 (9.1%) |
| 6:30 AM to 6:59 AM | 0 (0.0%) | 0 (0.0%) |
| 7:00 AM to 7:29 AM | 2 (8.7%) | 0 (0.0%) |
| 7:30 AM to 7:59 AM | 5 (21.7%) | 9 (40.9%) |
| 8:00 AM to 8:29 AM | 0 (0.0%) | 4 (18.2%) |
| 8:30 AM to 8:59 AM | 0 (0.0%) | 2 (9.1%) |
| 9:00 AM to 9:59 AM | 0 (0.0%) | 2 (9.1%) |
| 10:00 AM to 10:59 AM | 0 (0.0%) | 1 (4.5%) |
| 11:00 AM to 11:59 AM | 0 (0.0%) | 0 (0.0%) |
| 12:00 PM to 3:59 PM | 0 (0.0%) | 2 (9.1%) |
| 4:00 PM to 11:59 PM | 6 (26.1%) | 0 (0.0%) |
| Total | 23 (100.0%) | 22 (100.0%) |
Housing Occupancy in Monterey
Occupancy by Ownership in Monterey
Of the total 119 dwellings in Monterey, owner-occupied units account for 84 (70.6%), while renter-occupied units make up 35 (29.4%).
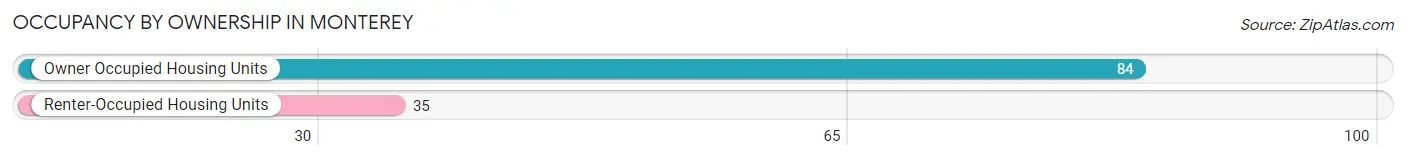
| Occupancy | # Housing Units | % Housing Units |
| Owner Occupied Housing Units | 84 | 70.6% |
| Renter-Occupied Housing Units | 35 | 29.4% |
| Total Occupied Housing Units | 119 | 100.0% |
Occupancy by Household Size in Monterey
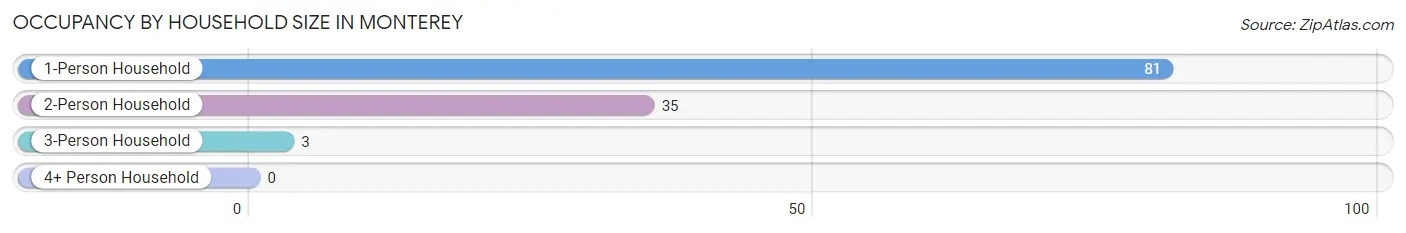
| Household Size | # Housing Units | % Housing Units |
| 1-Person Household | 81 | 68.1% |
| 2-Person Household | 35 | 29.4% |
| 3-Person Household | 3 | 2.5% |
| 4+ Person Household | 0 | 0.0% |
| Total Housing Units | 119 | 100.0% |
Occupancy by Ownership by Household Size in Monterey
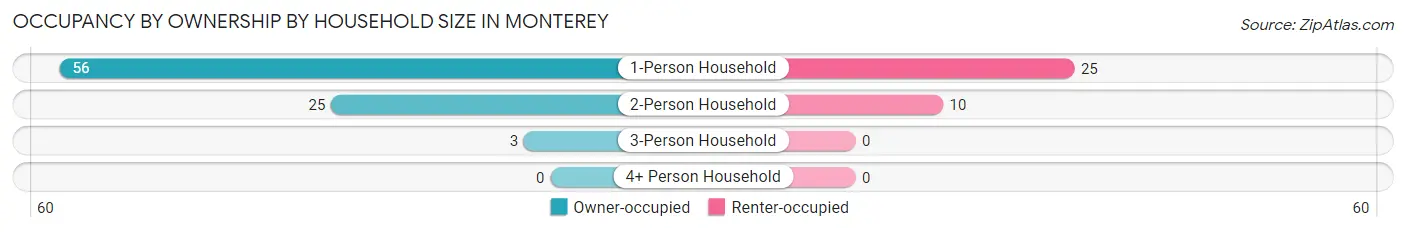
| Household Size | Owner-occupied | Renter-occupied |
| 1-Person Household | 56 (69.1%) | 25 (30.9%) |
| 2-Person Household | 25 (71.4%) | 10 (28.6%) |
| 3-Person Household | 3 (100.0%) | 0 (0.0%) |
| 4+ Person Household | 0 (0.0%) | 0 (0.0%) |
| Total Housing Units | 84 (70.6%) | 35 (29.4%) |
Occupancy by Educational Attainment in Monterey
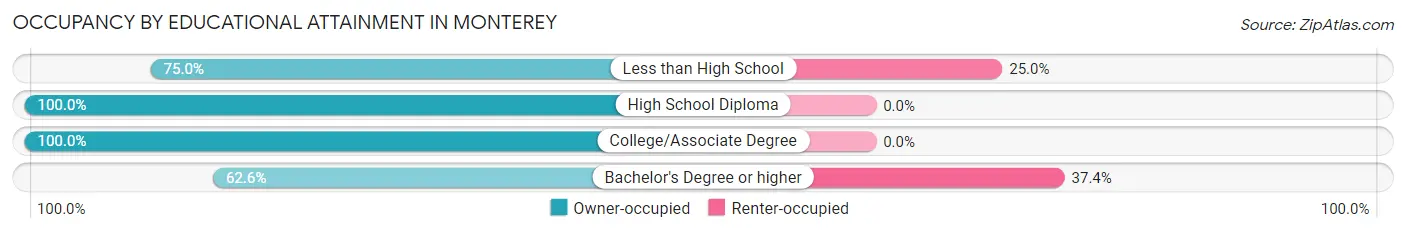
| Household Size | Owner-occupied | Renter-occupied |
| Less than High School | 3 (75.0%) | 1 (25.0%) |
| High School Diploma | 13 (100.0%) | 0 (0.0%) |
| College/Associate Degree | 11 (100.0%) | 0 (0.0%) |
| Bachelor's Degree or higher | 57 (62.6%) | 34 (37.4%) |
Occupancy by Age of Householder in Monterey
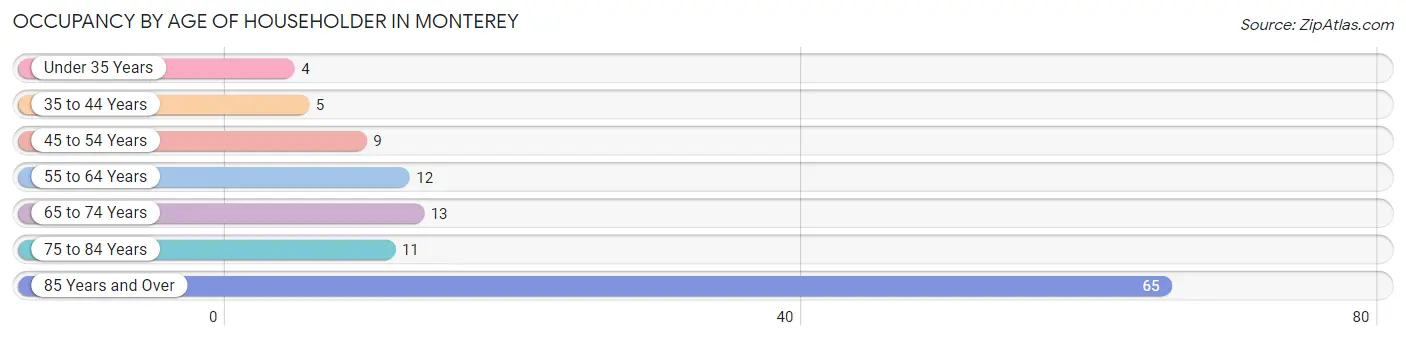
| Age Bracket | # Households | % Households |
| Under 35 Years | 4 | 3.4% |
| 35 to 44 Years | 5 | 4.2% |
| 45 to 54 Years | 9 | 7.6% |
| 55 to 64 Years | 12 | 10.1% |
| 65 to 74 Years | 13 | 10.9% |
| 75 to 84 Years | 11 | 9.2% |
| 85 Years and Over | 65 | 54.6% |
| Total | 119 | 100.0% |
Housing Finances in Monterey
Median Income by Occupancy in Monterey
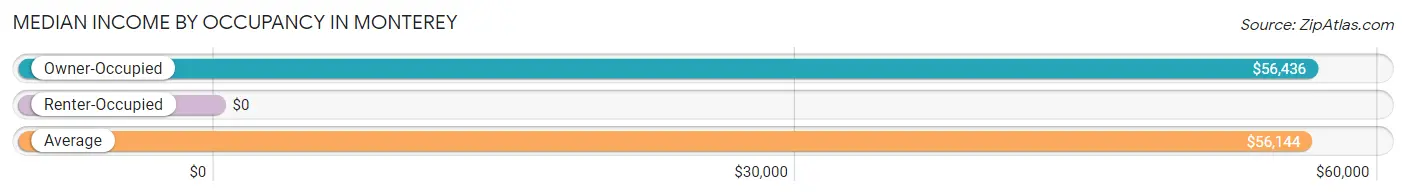
| Occupancy Type | # Households | Median Income |
| Owner-Occupied | 84 (70.6%) | $56,436 |
| Renter-Occupied | 35 (29.4%) | $0 |
| Average | 119 (100.0%) | $56,144 |
Occupancy by Householder Income Bracket in Monterey
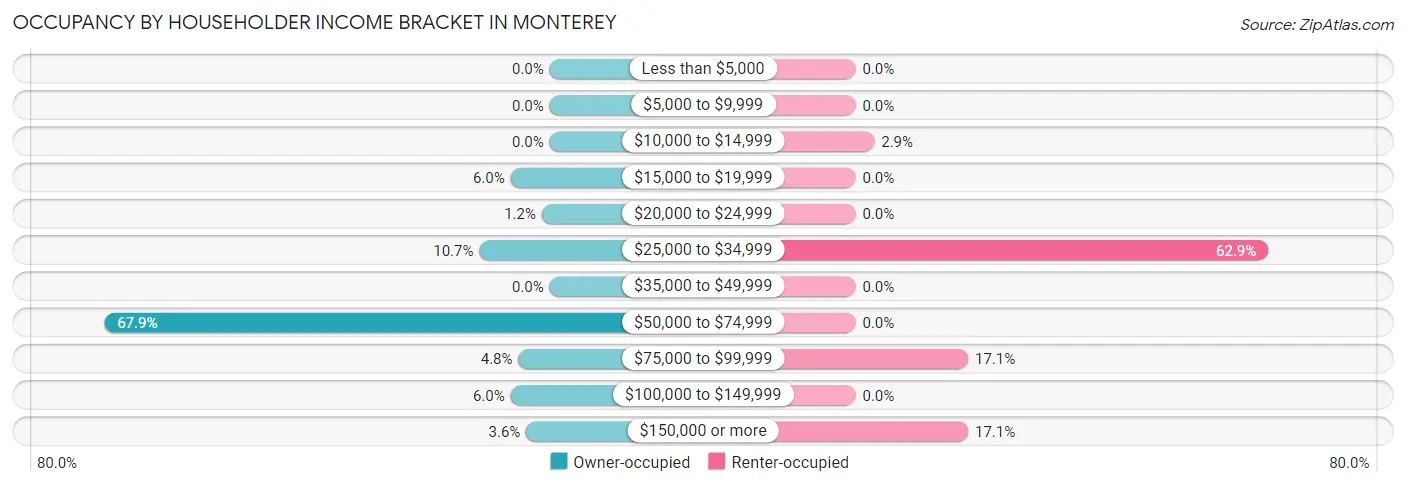
| Income Bracket | Owner-occupied | Renter-occupied |
| Less than $5,000 | 0 (0.0%) | 0 (0.0%) |
| $5,000 to $9,999 | 0 (0.0%) | 0 (0.0%) |
| $10,000 to $14,999 | 0 (0.0%) | 1 (2.9%) |
| $15,000 to $19,999 | 5 (5.9%) | 0 (0.0%) |
| $20,000 to $24,999 | 1 (1.2%) | 0 (0.0%) |
| $25,000 to $34,999 | 9 (10.7%) | 22 (62.9%) |
| $35,000 to $49,999 | 0 (0.0%) | 0 (0.0%) |
| $50,000 to $74,999 | 57 (67.9%) | 0 (0.0%) |
| $75,000 to $99,999 | 4 (4.8%) | 6 (17.1%) |
| $100,000 to $149,999 | 5 (5.9%) | 0 (0.0%) |
| $150,000 or more | 3 (3.6%) | 6 (17.1%) |
| Total | 84 (100.0%) | 35 (100.0%) |
Monthly Housing Cost Tiers in Monterey
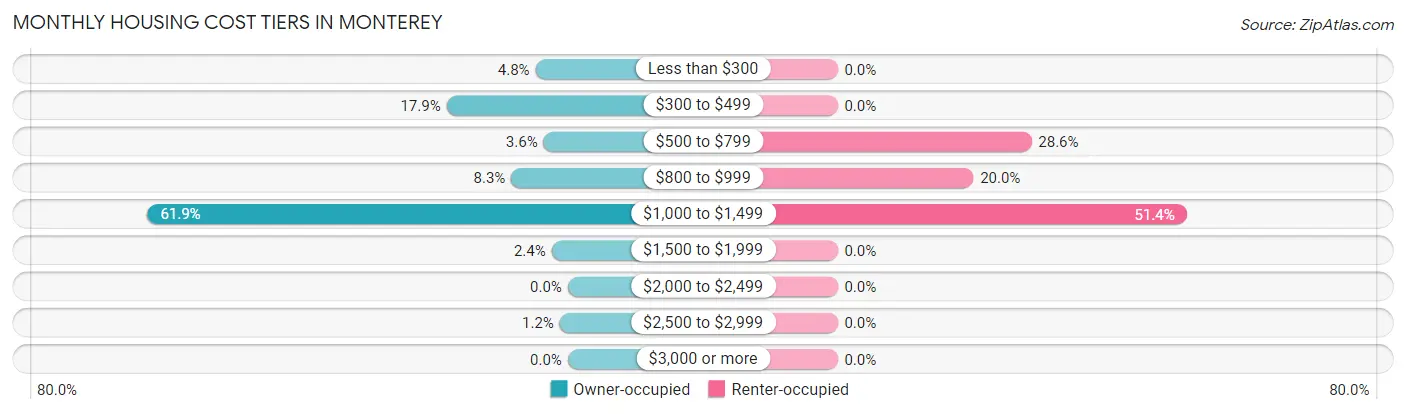
| Monthly Cost | Owner-occupied | Renter-occupied |
| Less than $300 | 4 (4.8%) | 0 (0.0%) |
| $300 to $499 | 15 (17.9%) | 0 (0.0%) |
| $500 to $799 | 3 (3.6%) | 10 (28.6%) |
| $800 to $999 | 7 (8.3%) | 7 (20.0%) |
| $1,000 to $1,499 | 52 (61.9%) | 18 (51.4%) |
| $1,500 to $1,999 | 2 (2.4%) | 0 (0.0%) |
| $2,000 to $2,499 | 0 (0.0%) | 0 (0.0%) |
| $2,500 to $2,999 | 1 (1.2%) | 0 (0.0%) |
| $3,000 or more | 0 (0.0%) | 0 (0.0%) |
| Total | 84 (100.0%) | 35 (100.0%) |
Physical Housing Characteristics in Monterey
Housing Structures in Monterey
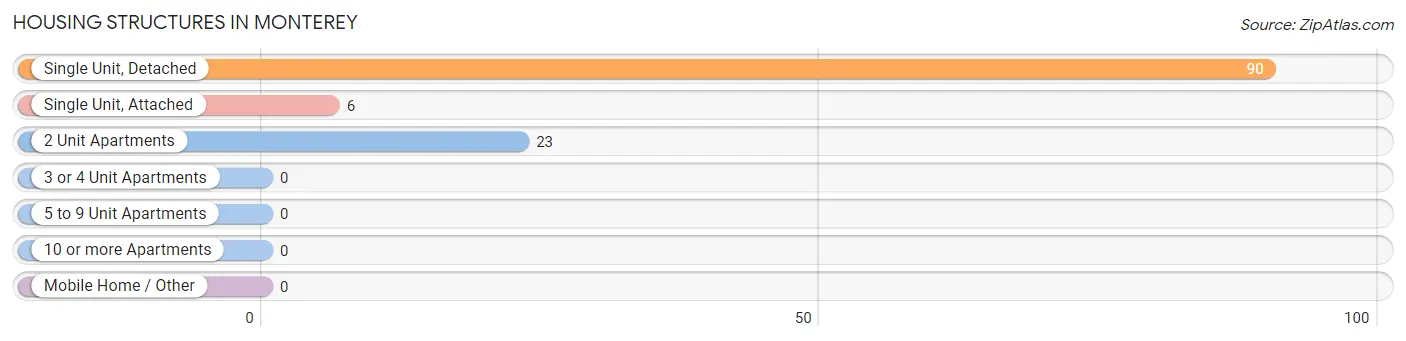
| Structure Type | # Housing Units | % Housing Units |
| Single Unit, Detached | 90 | 75.6% |
| Single Unit, Attached | 6 | 5.0% |
| 2 Unit Apartments | 23 | 19.3% |
| 3 or 4 Unit Apartments | 0 | 0.0% |
| 5 to 9 Unit Apartments | 0 | 0.0% |
| 10 or more Apartments | 0 | 0.0% |
| Mobile Home / Other | 0 | 0.0% |
| Total | 119 | 100.0% |
Housing Structures by Occupancy in Monterey
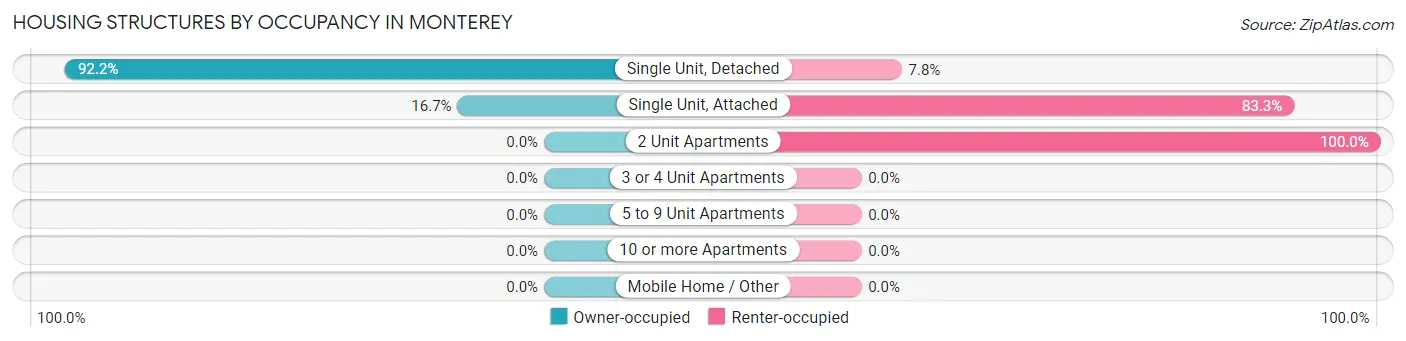
| Structure Type | Owner-occupied | Renter-occupied |
| Single Unit, Detached | 83 (92.2%) | 7 (7.8%) |
| Single Unit, Attached | 1 (16.7%) | 5 (83.3%) |
| 2 Unit Apartments | 0 (0.0%) | 23 (100.0%) |
| 3 or 4 Unit Apartments | 0 (0.0%) | 0 (0.0%) |
| 5 to 9 Unit Apartments | 0 (0.0%) | 0 (0.0%) |
| 10 or more Apartments | 0 (0.0%) | 0 (0.0%) |
| Mobile Home / Other | 0 (0.0%) | 0 (0.0%) |
| Total | 84 (70.6%) | 35 (29.4%) |
Housing Structures by Number of Rooms in Monterey
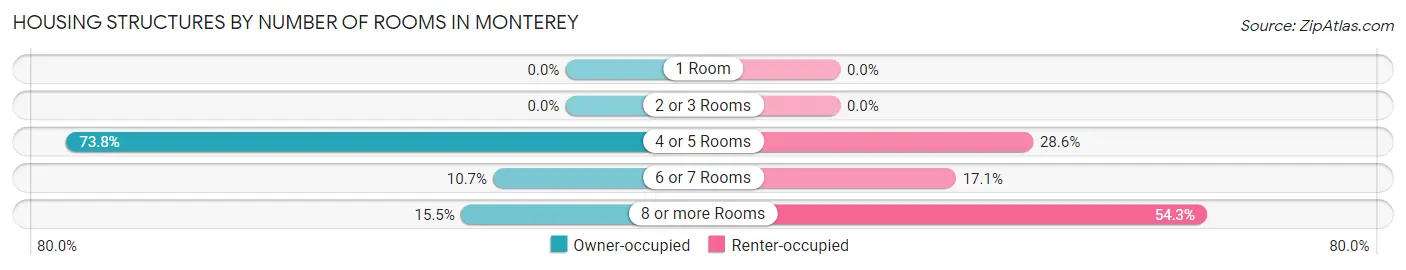
| Number of Rooms | Owner-occupied | Renter-occupied |
| 1 Room | 0 (0.0%) | 0 (0.0%) |
| 2 or 3 Rooms | 0 (0.0%) | 0 (0.0%) |
| 4 or 5 Rooms | 62 (73.8%) | 10 (28.6%) |
| 6 or 7 Rooms | 9 (10.7%) | 6 (17.1%) |
| 8 or more Rooms | 13 (15.5%) | 19 (54.3%) |
| Total | 84 (100.0%) | 35 (100.0%) |
Housing Structure by Heating Type in Monterey
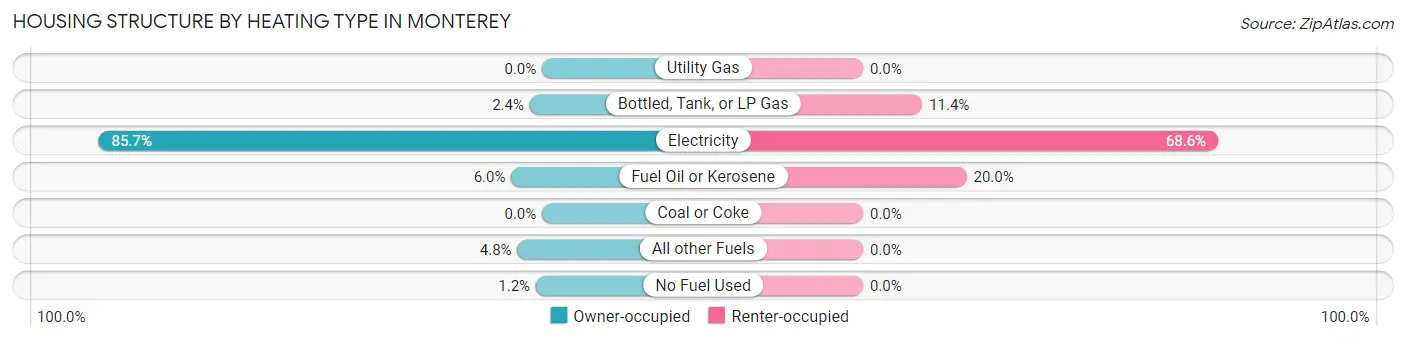
| Heating Type | Owner-occupied | Renter-occupied |
| Utility Gas | 0 (0.0%) | 0 (0.0%) |
| Bottled, Tank, or LP Gas | 2 (2.4%) | 4 (11.4%) |
| Electricity | 72 (85.7%) | 24 (68.6%) |
| Fuel Oil or Kerosene | 5 (5.9%) | 7 (20.0%) |
| Coal or Coke | 0 (0.0%) | 0 (0.0%) |
| All other Fuels | 4 (4.8%) | 0 (0.0%) |
| No Fuel Used | 1 (1.2%) | 0 (0.0%) |
| Total | 84 (100.0%) | 35 (100.0%) |
Household Vehicle Usage in Monterey
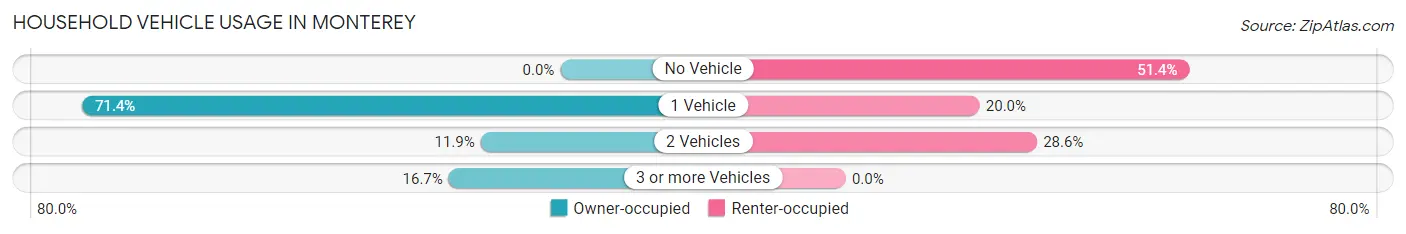
| Vehicles per Household | Owner-occupied | Renter-occupied |
| No Vehicle | 0 (0.0%) | 18 (51.4%) |
| 1 Vehicle | 60 (71.4%) | 7 (20.0%) |
| 2 Vehicles | 10 (11.9%) | 10 (28.6%) |
| 3 or more Vehicles | 14 (16.7%) | 0 (0.0%) |
| Total | 84 (100.0%) | 35 (100.0%) |
Real Estate & Mortgages in Monterey
Real Estate and Mortgage Overview in Monterey
| Characteristic | Without Mortgage | With Mortgage |
| Housing Units | 25 | 59 |
| Median Property Value | $181,300 | $139,600 |
| Median Household Income | $63,958 | $0 |
| Monthly Housing Costs | $419 | $0 |
| Real Estate Taxes | $975 | $0 |
Property Value by Mortgage Status in Monterey
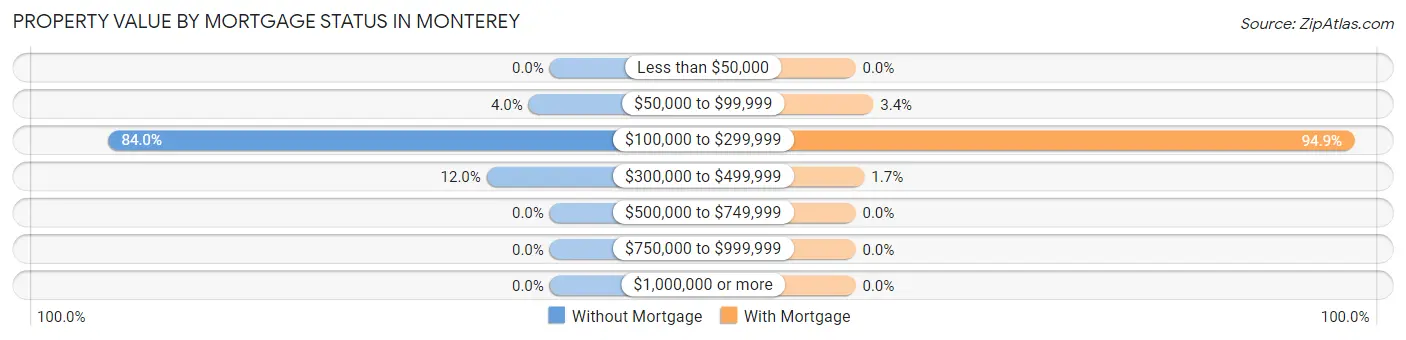
| Property Value | Without Mortgage | With Mortgage |
| Less than $50,000 | 0 (0.0%) | 0 (0.0%) |
| $50,000 to $99,999 | 1 (4.0%) | 2 (3.4%) |
| $100,000 to $299,999 | 21 (84.0%) | 56 (94.9%) |
| $300,000 to $499,999 | 3 (12.0%) | 1 (1.7%) |
| $500,000 to $749,999 | 0 (0.0%) | 0 (0.0%) |
| $750,000 to $999,999 | 0 (0.0%) | 0 (0.0%) |
| $1,000,000 or more | 0 (0.0%) | 0 (0.0%) |
| Total | 25 (100.0%) | 59 (100.0%) |
Household Income by Mortgage Status in Monterey
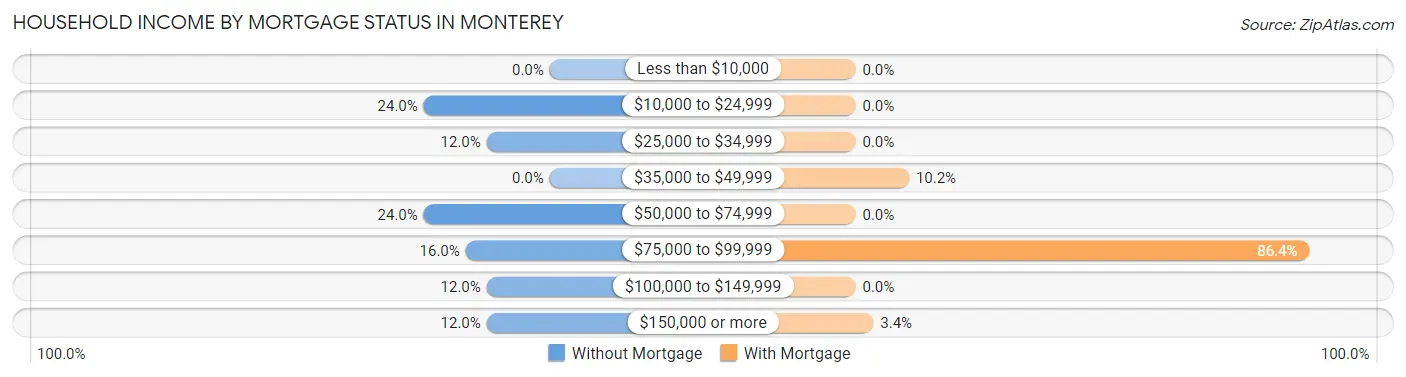
| Household Income | Without Mortgage | With Mortgage |
| Less than $10,000 | 0 (0.0%) | 0 (0.0%) |
| $10,000 to $24,999 | 6 (24.0%) | 0 (0.0%) |
| $25,000 to $34,999 | 3 (12.0%) | 0 (0.0%) |
| $35,000 to $49,999 | 0 (0.0%) | 6 (10.2%) |
| $50,000 to $74,999 | 6 (24.0%) | 0 (0.0%) |
| $75,000 to $99,999 | 4 (16.0%) | 51 (86.4%) |
| $100,000 to $149,999 | 3 (12.0%) | 0 (0.0%) |
| $150,000 or more | 3 (12.0%) | 2 (3.4%) |
| Total | 25 (100.0%) | 59 (100.0%) |
Property Value to Household Income Ratio in Monterey
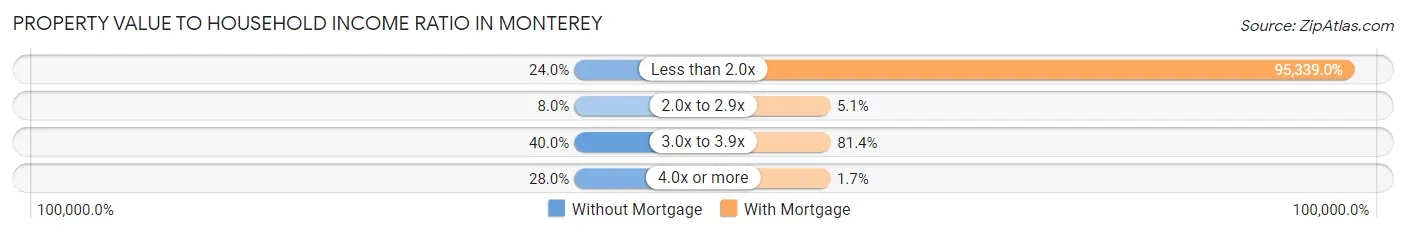
| Value-to-Income Ratio | Without Mortgage | With Mortgage |
| Less than 2.0x | 6 (24.0%) | 56,250 (95,339.0%) |
| 2.0x to 2.9x | 2 (8.0%) | 3 (5.1%) |
| 3.0x to 3.9x | 10 (40.0%) | 48 (81.4%) |
| 4.0x or more | 7 (28.0%) | 1 (1.7%) |
| Total | 25 (100.0%) | 59 (100.0%) |
Real Estate Taxes by Mortgage Status in Monterey
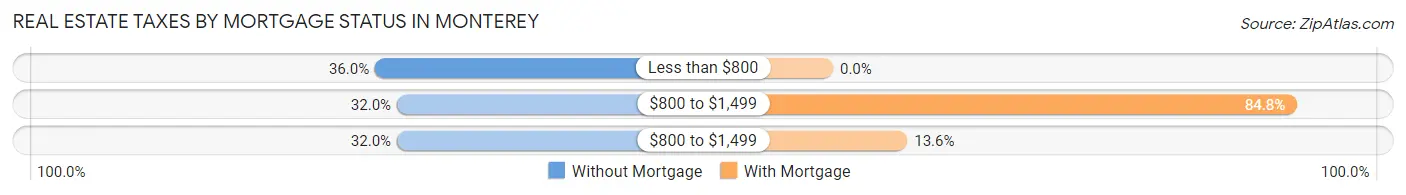
| Property Taxes | Without Mortgage | With Mortgage |
| Less than $800 | 9 (36.0%) | 0 (0.0%) |
| $800 to $1,499 | 8 (32.0%) | 50 (84.8%) |
| $800 to $1,499 | 8 (32.0%) | 8 (13.6%) |
| Total | 25 (100.0%) | 59 (100.0%) |
Health & Disability in Monterey
Health Insurance Coverage by Age in Monterey
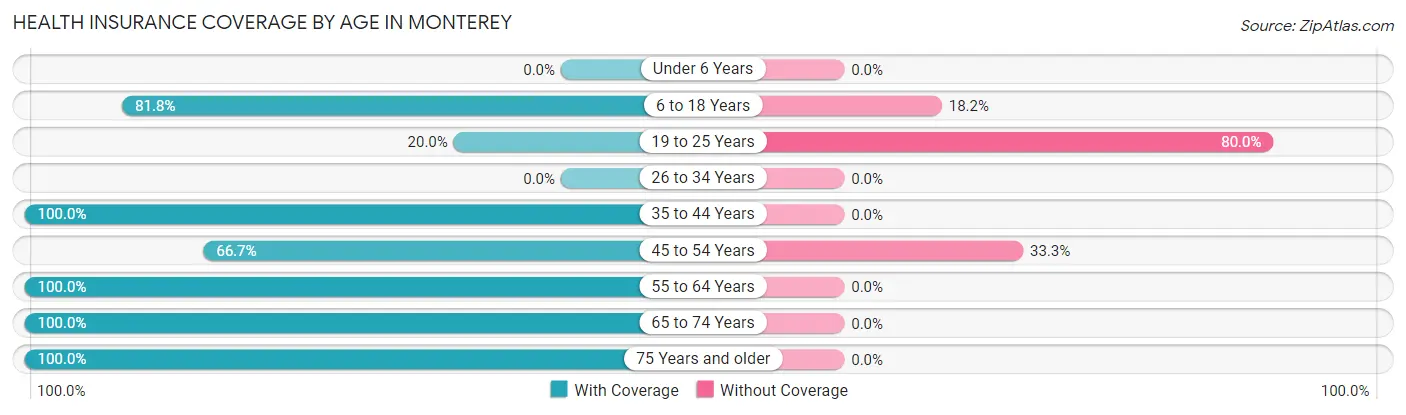
| Age Bracket | With Coverage | Without Coverage |
| Under 6 Years | 0 (0.0%) | 0 (0.0%) |
| 6 to 18 Years | 9 (81.8%) | 2 (18.2%) |
| 19 to 25 Years | 2 (20.0%) | 8 (80.0%) |
| 26 to 34 Years | 0 (0.0%) | 0 (0.0%) |
| 35 to 44 Years | 5 (100.0%) | 0 (0.0%) |
| 45 to 54 Years | 8 (66.7%) | 4 (33.3%) |
| 55 to 64 Years | 17 (100.0%) | 0 (0.0%) |
| 65 to 74 Years | 27 (100.0%) | 0 (0.0%) |
| 75 Years and older | 82 (100.0%) | 0 (0.0%) |
| Total | 150 (91.5%) | 14 (8.5%) |
Health Insurance Coverage by Citizenship Status in Monterey
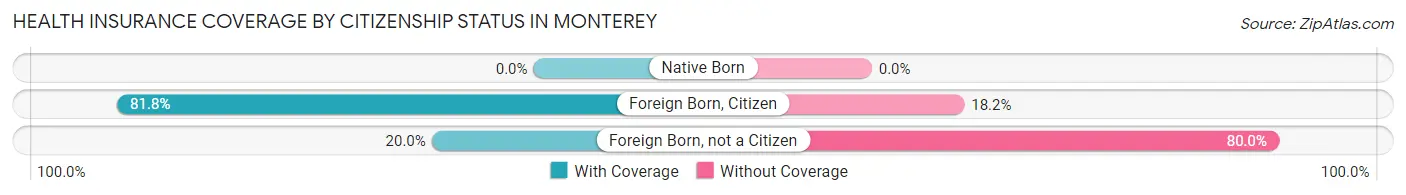
| Citizenship Status | With Coverage | Without Coverage |
| Native Born | 0 (0.0%) | 0 (0.0%) |
| Foreign Born, Citizen | 9 (81.8%) | 2 (18.2%) |
| Foreign Born, not a Citizen | 2 (20.0%) | 8 (80.0%) |
Health Insurance Coverage by Household Income in Monterey
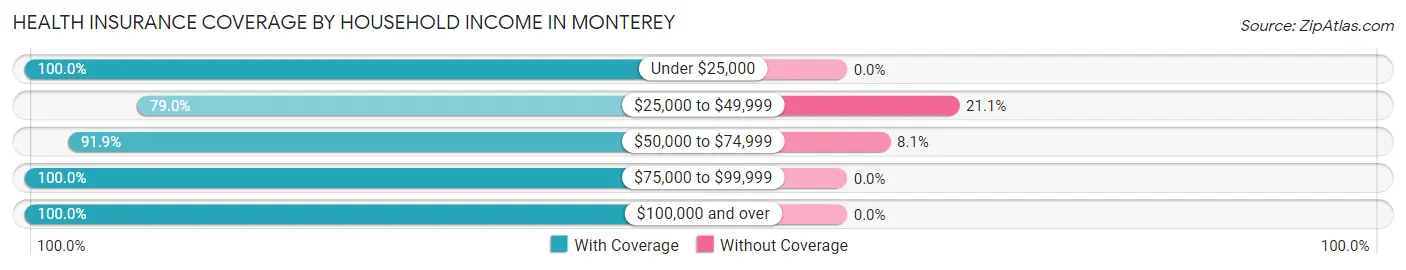
| Household Income | With Coverage | Without Coverage |
| Under $25,000 | 11 (100.0%) | 0 (0.0%) |
| $25,000 to $49,999 | 30 (78.9%) | 8 (21.0%) |
| $50,000 to $74,999 | 68 (91.9%) | 6 (8.1%) |
| $75,000 to $99,999 | 13 (100.0%) | 0 (0.0%) |
| $100,000 and over | 28 (100.0%) | 0 (0.0%) |
Public vs Private Health Insurance Coverage by Age in Monterey
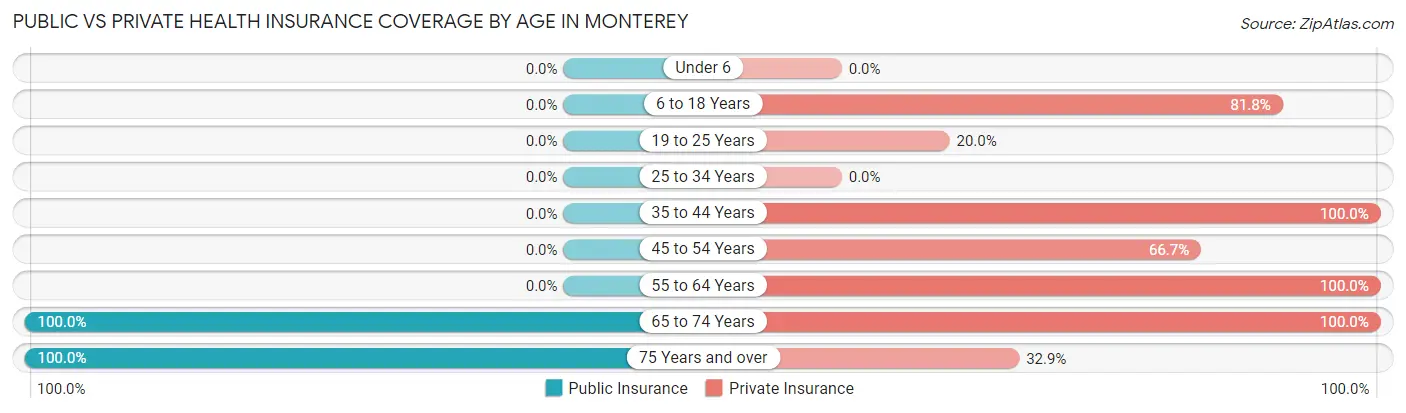
| Age Bracket | Public Insurance | Private Insurance |
| Under 6 | 0 (0.0%) | 0 (0.0%) |
| 6 to 18 Years | 0 (0.0%) | 9 (81.8%) |
| 19 to 25 Years | 0 (0.0%) | 2 (20.0%) |
| 25 to 34 Years | 0 (0.0%) | 0 (0.0%) |
| 35 to 44 Years | 0 (0.0%) | 5 (100.0%) |
| 45 to 54 Years | 0 (0.0%) | 8 (66.7%) |
| 55 to 64 Years | 0 (0.0%) | 17 (100.0%) |
| 65 to 74 Years | 27 (100.0%) | 27 (100.0%) |
| 75 Years and over | 82 (100.0%) | 27 (32.9%) |
| Total | 109 (66.5%) | 95 (57.9%) |
Disability Status by Sex by Age in Monterey
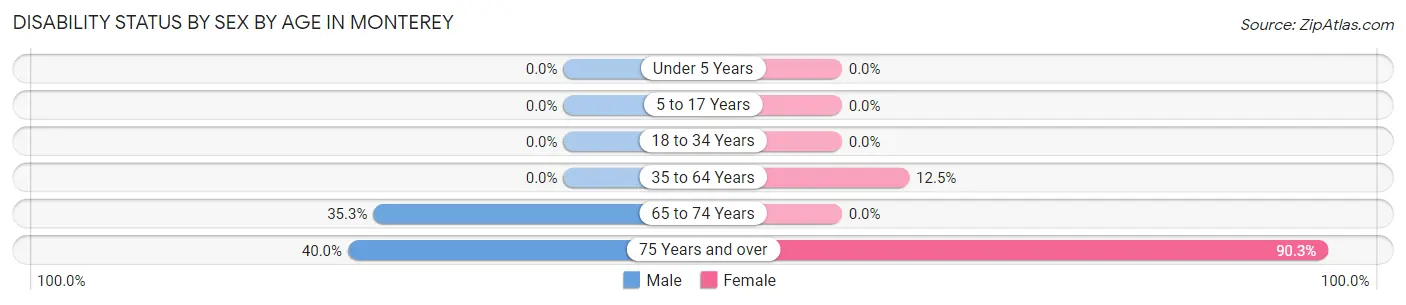
| Age Bracket | Male | Female |
| Under 5 Years | 0 (0.0%) | 0 (0.0%) |
| 5 to 17 Years | 0 (0.0%) | 0 (0.0%) |
| 18 to 34 Years | 0 (0.0%) | 0 (0.0%) |
| 35 to 64 Years | 0 (0.0%) | 2 (12.5%) |
| 65 to 74 Years | 6 (35.3%) | 0 (0.0%) |
| 75 Years and over | 4 (40.0%) | 65 (90.3%) |
Disability Class by Sex by Age in Monterey
Disability Class: Hearing Difficulty
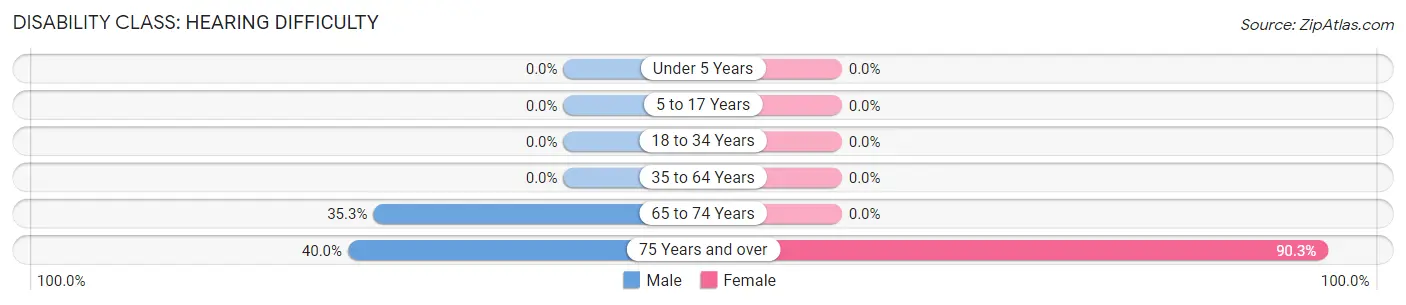
| Age Bracket | Male | Female |
| Under 5 Years | 0 (0.0%) | 0 (0.0%) |
| 5 to 17 Years | 0 (0.0%) | 0 (0.0%) |
| 18 to 34 Years | 0 (0.0%) | 0 (0.0%) |
| 35 to 64 Years | 0 (0.0%) | 0 (0.0%) |
| 65 to 74 Years | 6 (35.3%) | 0 (0.0%) |
| 75 Years and over | 4 (40.0%) | 65 (90.3%) |
Disability Class: Vision Difficulty
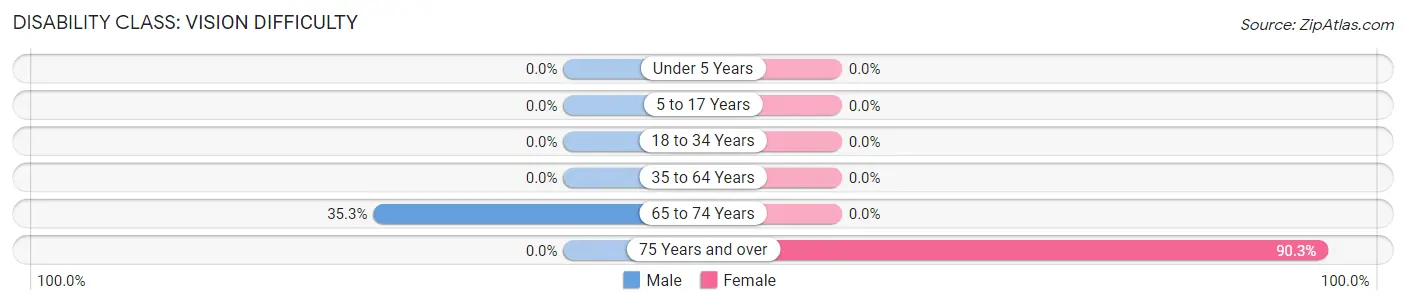
| Age Bracket | Male | Female |
| Under 5 Years | 0 (0.0%) | 0 (0.0%) |
| 5 to 17 Years | 0 (0.0%) | 0 (0.0%) |
| 18 to 34 Years | 0 (0.0%) | 0 (0.0%) |
| 35 to 64 Years | 0 (0.0%) | 0 (0.0%) |
| 65 to 74 Years | 6 (35.3%) | 0 (0.0%) |
| 75 Years and over | 0 (0.0%) | 65 (90.3%) |
Disability Class: Cognitive Difficulty
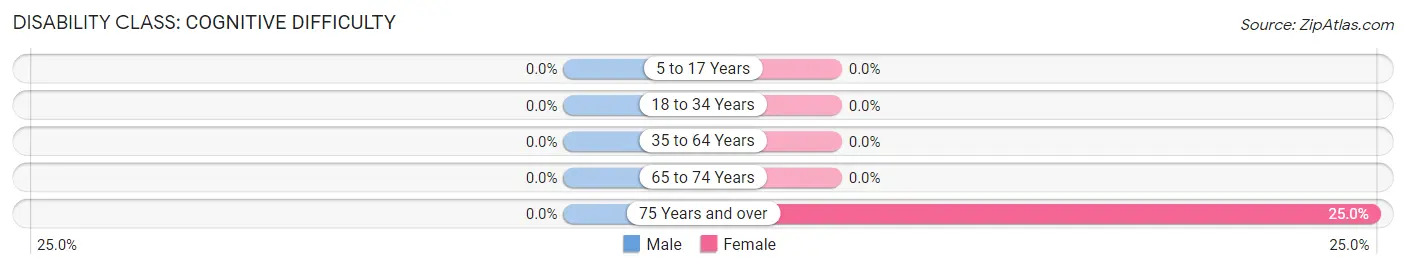
| Age Bracket | Male | Female |
| 5 to 17 Years | 0 (0.0%) | 0 (0.0%) |
| 18 to 34 Years | 0 (0.0%) | 0 (0.0%) |
| 35 to 64 Years | 0 (0.0%) | 0 (0.0%) |
| 65 to 74 Years | 0 (0.0%) | 0 (0.0%) |
| 75 Years and over | 0 (0.0%) | 18 (25.0%) |
Disability Class: Ambulatory Difficulty
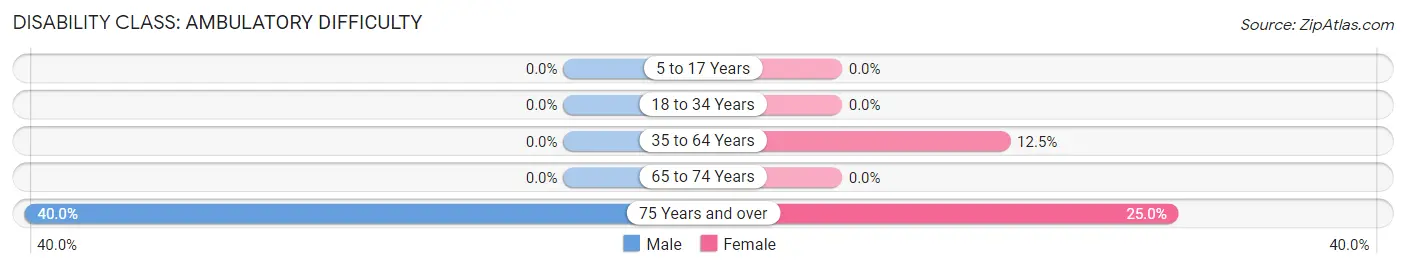
| Age Bracket | Male | Female |
| 5 to 17 Years | 0 (0.0%) | 0 (0.0%) |
| 18 to 34 Years | 0 (0.0%) | 0 (0.0%) |
| 35 to 64 Years | 0 (0.0%) | 2 (12.5%) |
| 65 to 74 Years | 0 (0.0%) | 0 (0.0%) |
| 75 Years and over | 4 (40.0%) | 18 (25.0%) |
Disability Class: Self-Care Difficulty
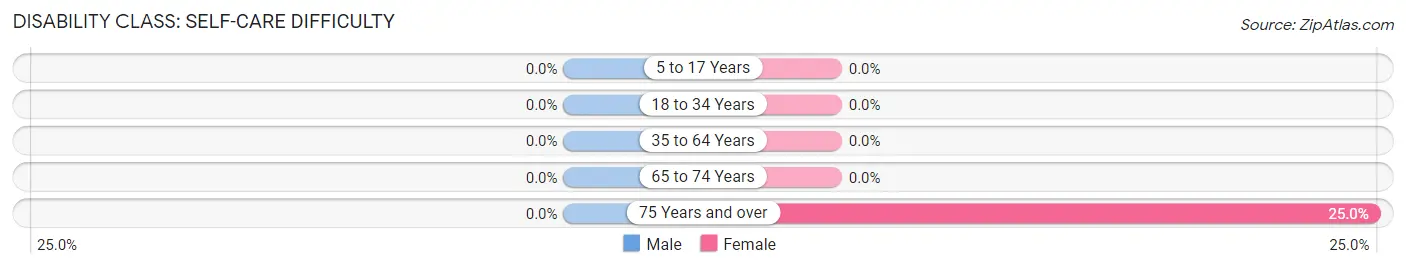
| Age Bracket | Male | Female |
| 5 to 17 Years | 0 (0.0%) | 0 (0.0%) |
| 18 to 34 Years | 0 (0.0%) | 0 (0.0%) |
| 35 to 64 Years | 0 (0.0%) | 0 (0.0%) |
| 65 to 74 Years | 0 (0.0%) | 0 (0.0%) |
| 75 Years and over | 0 (0.0%) | 18 (25.0%) |
Technology Access in Monterey
Computing Device Access in Monterey
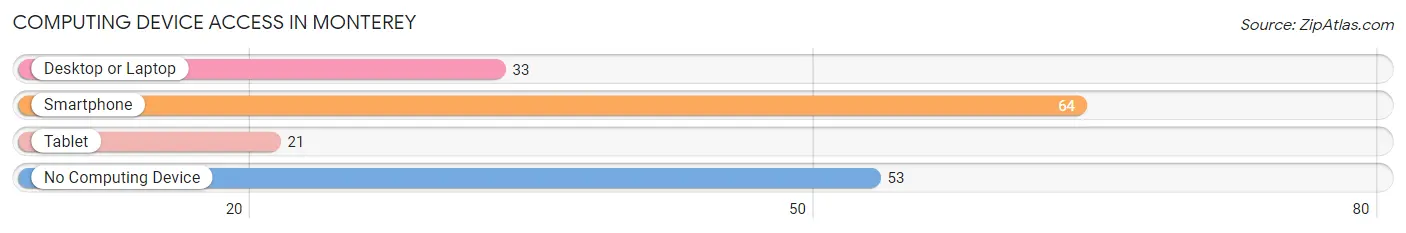
| Device Type | # Households | % Households |
| Desktop or Laptop | 33 | 27.7% |
| Smartphone | 64 | 53.8% |
| Tablet | 21 | 17.6% |
| No Computing Device | 53 | 44.5% |
| Total | 119 | 100.0% |
Internet Access in Monterey
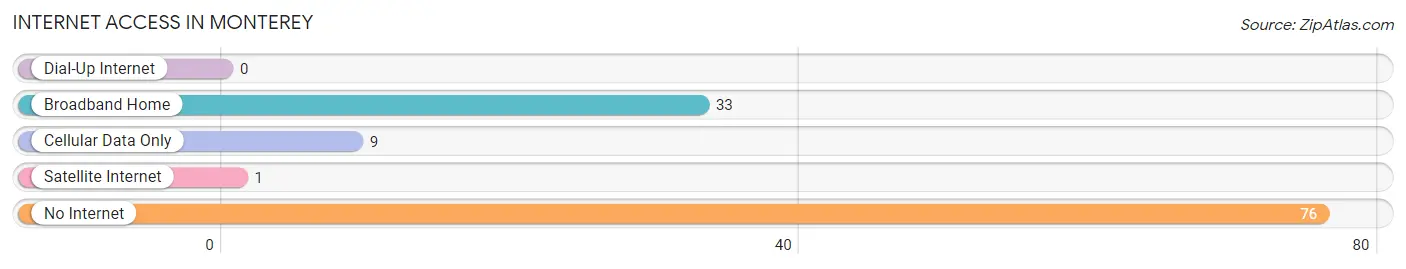
| Internet Type | # Households | % Households |
| Dial-Up Internet | 0 | 0.0% |
| Broadband Home | 33 | 27.7% |
| Cellular Data Only | 9 | 7.6% |
| Satellite Internet | 1 | 0.8% |
| No Internet | 76 | 63.9% |
| Total | 119 | 100.0% |
Monterey Summary
Monterey, Virginia is a small town located in Highland County, Virginia. It is situated in the Allegheny Mountains, and is the county seat of Highland County. The town was founded in 1847 and is named after the Battle of Monterrey in the Mexican-American War. The population of Monterey was 1,093 as of the 2010 census.
Geography
Monterey is located in the Allegheny Mountains of Highland County, Virginia. It is situated at the intersection of U.S. Route 250 and Virginia State Route 42. The town is located at an elevation of 2,717 feet above sea level. The town is surrounded by the George Washington National Forest and the Allegheny Mountains. The nearest major cities are Roanoke, Virginia, which is about 75 miles away, and Harrisonburg, Virginia, which is about 50 miles away.
Climate
Monterey has a humid continental climate, with cold winters and hot summers. The average annual temperature is 50.2°F, with an average high of 68.2°F in July and an average low of 32.2°F in January. The average annual precipitation is 40.2 inches, with an average of 4.2 inches of snowfall per year.
Demographics
As of the 2010 census, the population of Monterey was 1,093. The racial makeup of the town was 97.2% White, 0.7% African American, 0.2% Native American, 0.2% Asian, 0.2% from other races, and 1.5% from two or more races. Hispanic or Latino of any race were 0.7% of the population.
Economy
Monterey’s economy is largely based on agriculture and tourism. The town is home to several farms, including cattle, sheep, and poultry farms. The town is also home to several small businesses, including restaurants, shops, and a bed and breakfast. Tourism is also an important part of the local economy, with visitors coming to the area to enjoy the natural beauty of the Allegheny Mountains.
History
Monterey was founded in 1847 and was named after the Battle of Monterrey in the Mexican-American War. The town was originally a farming community, and the first post office was established in 1848. The town was incorporated in 1872 and the first bank was established in 1873. The town was also home to several mills, including a grist mill, a saw mill, and a woolen mill.
In the early 20th century, Monterey was a popular tourist destination, with visitors coming to the area to enjoy the natural beauty of the Allegheny Mountains. The town was also home to several resorts, including the Monterey Hotel, which was built in 1891 and was a popular destination for visitors.
In the late 20th century, Monterey began to decline as the local economy shifted away from agriculture and tourism. The town’s population decreased from 1,717 in 1950 to 1,093 in 2010. However, the town has seen a resurgence in recent years, with new businesses and restaurants opening in the area.
Conclusion
Monterey, Virginia is a small town located in the Allegheny Mountains of Highland County, Virginia. The town was founded in 1847 and is the county seat of Highland County. The population of Monterey was 1,093 as of the 2010 census. The town’s economy is largely based on agriculture and tourism, and the town is home to several small businesses and restaurants. Monterey has seen a resurgence in recent years, with new businesses and restaurants opening in the area.
Common Questions
What is Per Capita Income in Monterey?
Per Capita income in Monterey is $48,007.
What is the Median Family Income in Monterey?
Median Family Income in Monterey is $70,000.
What is the Median Household income in Monterey?
Median Household Income in Monterey is $56,144.
What is Inequality or Gini Index in Monterey?
Inequality or Gini Index in Monterey is 0.31.
What is the Total Population of Monterey?
Total Population of Monterey is 164.
What is the Total Male Population of Monterey?
Total Male Population of Monterey is 53.
What is the Total Female Population of Monterey?
Total Female Population of Monterey is 111.
What is the Ratio of Males per 100 Females in Monterey?
There are 47.75 Males per 100 Females in Monterey.
What is the Ratio of Females per 100 Males in Monterey?
There are 209.43 Females per 100 Males in Monterey.
What is the Median Population Age in Monterey?
Median Population Age in Monterey is 76.0 Years.
What is the Average Family Size in Monterey
Average Family Size in Monterey is 2.2 People.
What is the Average Household Size in Monterey
Average Household Size in Monterey is 1.4 People.
How Large is the Labor Force in Monterey?
There are 48 People in the Labor Forcein in Monterey.
What is the Percentage of People in the Labor Force in Monterey?
31.0% of People are in the Labor Force in Monterey.