Marion, VA Map & Demographics
Marion Map
Marion Overview
$26,766
PER CAPITA INCOME
$57,798
AVG FAMILY INCOME
$37,337
AVG HOUSEHOLD INCOME
29.5%
WAGE / INCOME GAP [ % ]
70.5¢/ $1
WAGE / INCOME GAP [ $ ]
0.50
INEQUALITY / GINI INDEX
5,722
TOTAL POPULATION
2,728
MALE POPULATION
2,994
FEMALE POPULATION
91.12
MALES / 100 FEMALES
109.75
FEMALES / 100 MALES
44.3
MEDIAN AGE
2.8
AVG FAMILY SIZE
2.2
AVG HOUSEHOLD SIZE
2,393
LABOR FORCE [ PEOPLE ]
49.5%
PERCENT IN LABOR FORCE
5.1%
UNEMPLOYMENT RATE
Marion Zip Codes
Marion Area Codes
Income in Marion
Income Overview in Marion
Per Capita Income in Marion is $26,766, while median incomes of families and households are $57,798 and $37,337 respectively.
| Characteristic | Number | Measure |
| Per Capita Income | 5,722 | $26,766 |
| Median Family Income | 1,328 | $57,798 |
| Mean Family Income | 1,328 | $84,708 |
| Median Household Income | 2,385 | $37,337 |
| Mean Household Income | 2,385 | $60,633 |
| Income Deficit | 1,328 | $0 |
| Wage / Income Gap (%) | 5,722 | 29.52% |
| Wage / Income Gap ($) | 5,722 | 70.48¢ per $1 |
| Gini / Inequality Index | 5,722 | 0.50 |
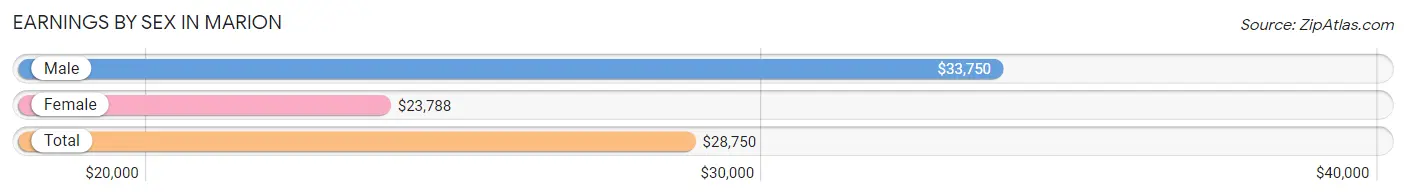
Earnings by Sex in Marion
Average Earnings in Marion are $28,750, $33,750 for men and $23,788 for women, a difference of 29.5%.
| Sex | Number | Average Earnings |
| Male | 1,409 (53.3%) | $33,750 |
| Female | 1,235 (46.7%) | $23,788 |
| Total | 2,644 (100.0%) | $28,750 |
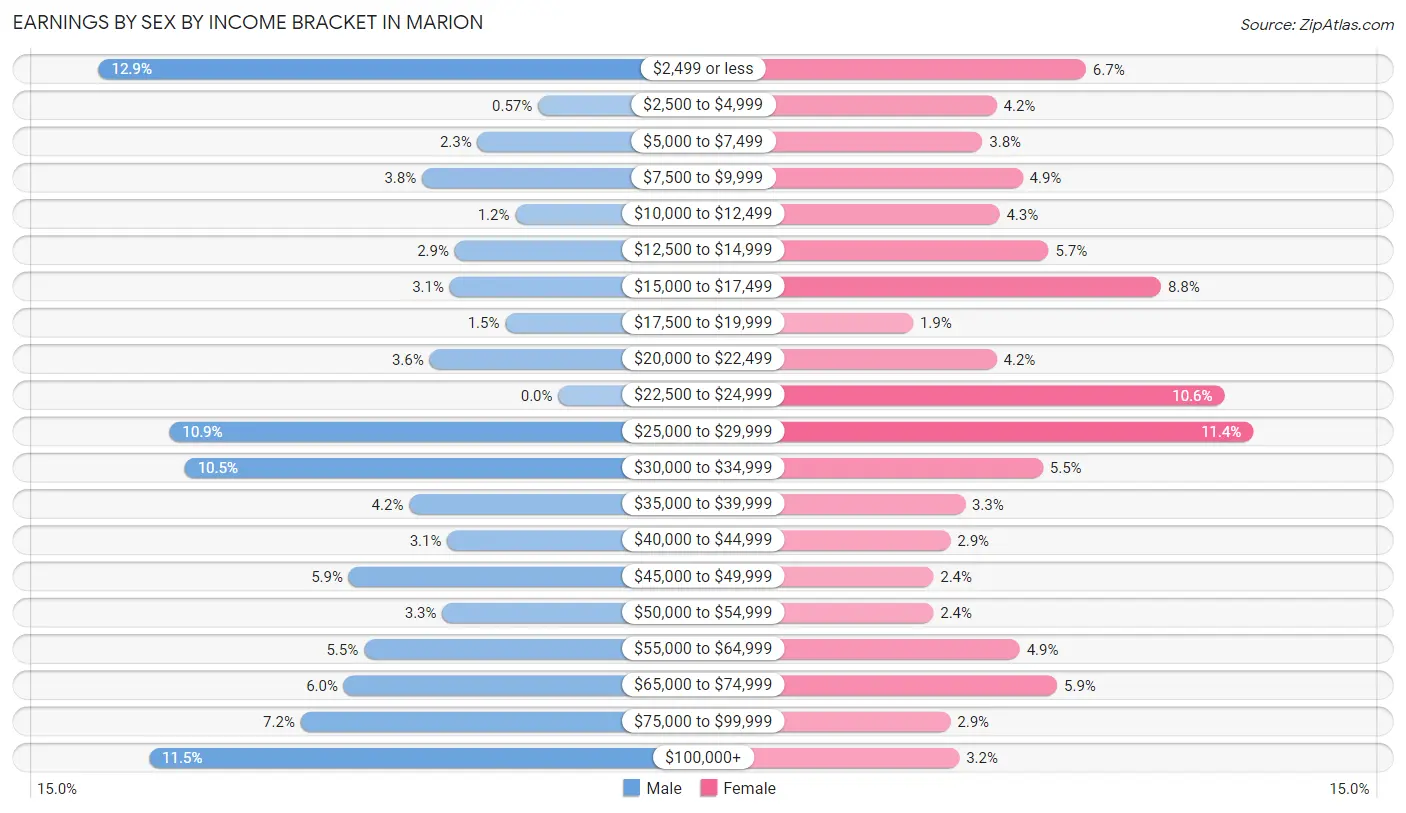
Earnings by Sex by Income Bracket in Marion
The most common earnings brackets in Marion are $2,499 or less for men (182 | 12.9%) and $25,000 to $29,999 for women (141 | 11.4%).
| Income | Male | Female |
| $2,499 or less | 182 (12.9%) | 83 (6.7%) |
| $2,500 to $4,999 | 8 (0.6%) | 52 (4.2%) |
| $5,000 to $7,499 | 32 (2.3%) | 47 (3.8%) |
| $7,500 to $9,999 | 54 (3.8%) | 61 (4.9%) |
| $10,000 to $12,499 | 17 (1.2%) | 53 (4.3%) |
| $12,500 to $14,999 | 41 (2.9%) | 70 (5.7%) |
| $15,000 to $17,499 | 43 (3.0%) | 109 (8.8%) |
| $17,500 to $19,999 | 21 (1.5%) | 23 (1.9%) |
| $20,000 to $22,499 | 51 (3.6%) | 52 (4.2%) |
| $22,500 to $24,999 | 0 (0.0%) | 131 (10.6%) |
| $25,000 to $29,999 | 154 (10.9%) | 141 (11.4%) |
| $30,000 to $34,999 | 148 (10.5%) | 68 (5.5%) |
| $35,000 to $39,999 | 59 (4.2%) | 41 (3.3%) |
| $40,000 to $44,999 | 44 (3.1%) | 36 (2.9%) |
| $45,000 to $49,999 | 83 (5.9%) | 30 (2.4%) |
| $50,000 to $54,999 | 46 (3.3%) | 30 (2.4%) |
| $55,000 to $64,999 | 77 (5.5%) | 60 (4.9%) |
| $65,000 to $74,999 | 85 (6.0%) | 73 (5.9%) |
| $75,000 to $99,999 | 102 (7.2%) | 36 (2.9%) |
| $100,000+ | 162 (11.5%) | 39 (3.2%) |
| Total | 1,409 (100.0%) | 1,235 (100.0%) |
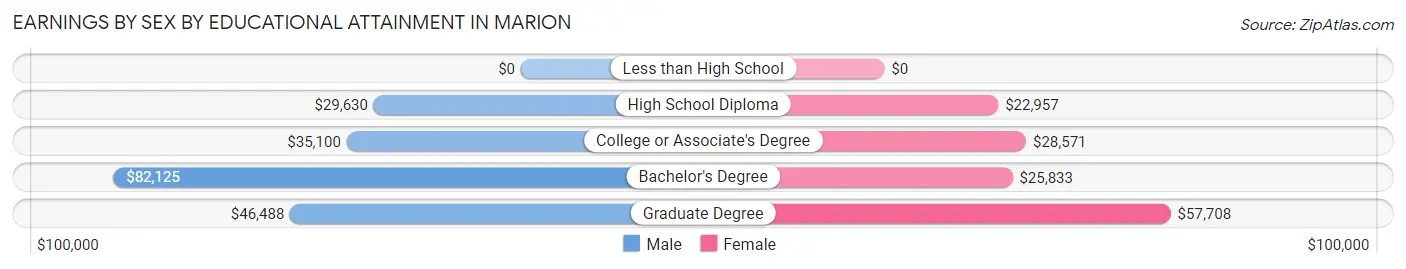
Earnings by Sex by Educational Attainment in Marion
Average earnings in Marion are $37,383 for men and $26,362 for women, a difference of 29.5%. Men with an educational attainment of bachelor's degree enjoy the highest average annual earnings of $82,125, while those with high school diploma education earn the least with $29,630. Women with an educational attainment of graduate degree earn the most with the average annual earnings of $57,708, while those with high school diploma education have the smallest earnings of $22,957.
| Educational Attainment | Male Income | Female Income |
| Less than High School | - | - |
| High School Diploma | $29,630 | $22,957 |
| College or Associate's Degree | $35,100 | $28,571 |
| Bachelor's Degree | $82,125 | $25,833 |
| Graduate Degree | $46,488 | $57,708 |
| Total | $37,383 | $26,362 |
Family Income in Marion
Family Income Brackets in Marion
According to the Marion family income data, there are 244 families falling into the $50,000 to $74,999 income range, which is the most common income bracket and makes up 18.4% of all families. Conversely, the $10,000 to $14,999 income bracket is the least frequent group with only 28 families (2.1%) belonging to this category.
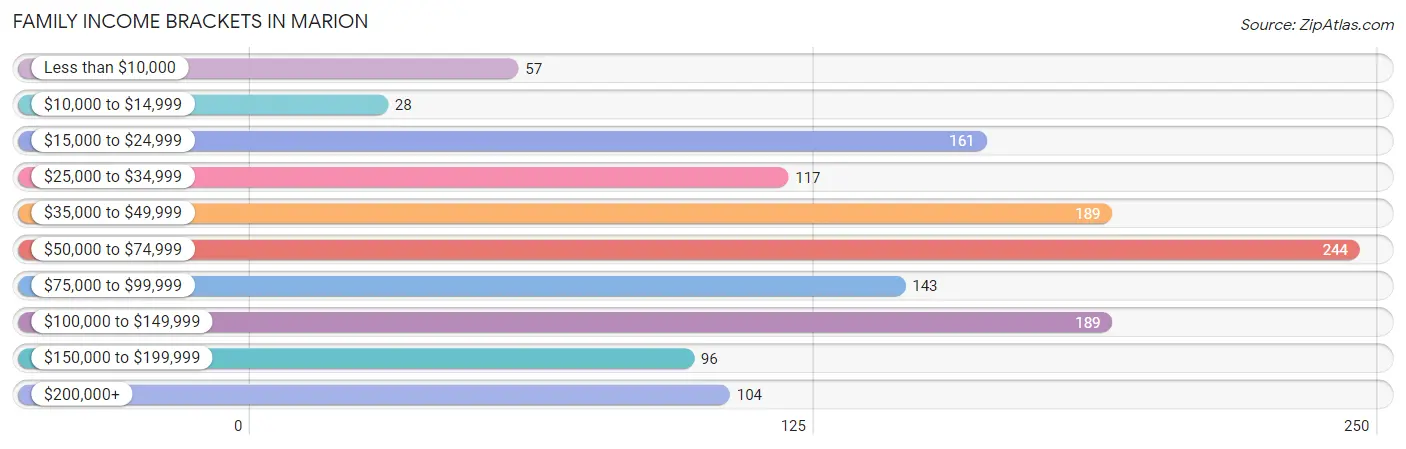
| Income Bracket | # Families | % Families |
| Less than $10,000 | 57 | 4.3% |
| $10,000 to $14,999 | 28 | 2.1% |
| $15,000 to $24,999 | 161 | 12.1% |
| $25,000 to $34,999 | 117 | 8.8% |
| $35,000 to $49,999 | 189 | 14.2% |
| $50,000 to $74,999 | 244 | 18.4% |
| $75,000 to $99,999 | 143 | 10.8% |
| $100,000 to $149,999 | 189 | 14.2% |
| $150,000 to $199,999 | 96 | 7.2% |
| $200,000+ | 104 | 7.8% |
Family Income by Famaliy Size in Marion
5-person families (77 | 5.8%) account for the highest median family income in Marion with $184,135 per family, while 5-person families (77 | 5.8%) have the highest median income of $36,827 per family member.
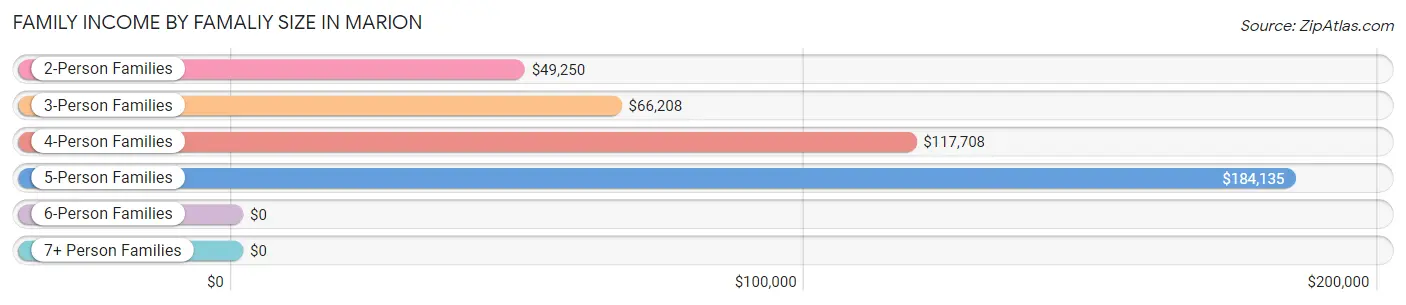
| Income Bracket | # Families | Median Income |
| 2-Person Families | 771 (58.1%) | $49,250 |
| 3-Person Families | 297 (22.4%) | $66,208 |
| 4-Person Families | 141 (10.6%) | $117,708 |
| 5-Person Families | 77 (5.8%) | $184,135 |
| 6-Person Families | 25 (1.9%) | $0 |
| 7+ Person Families | 17 (1.3%) | $0 |
| Total | 1,328 (100.0%) | $57,798 |
Family Income by Number of Earners in Marion
The median family income in Marion is $57,798, with families comprising 3+ earners (127) having the highest median family income of $135,139, while families with no earners (268) have the lowest median family income of $30,943, accounting for 9.6% and 20.2% of families, respectively.
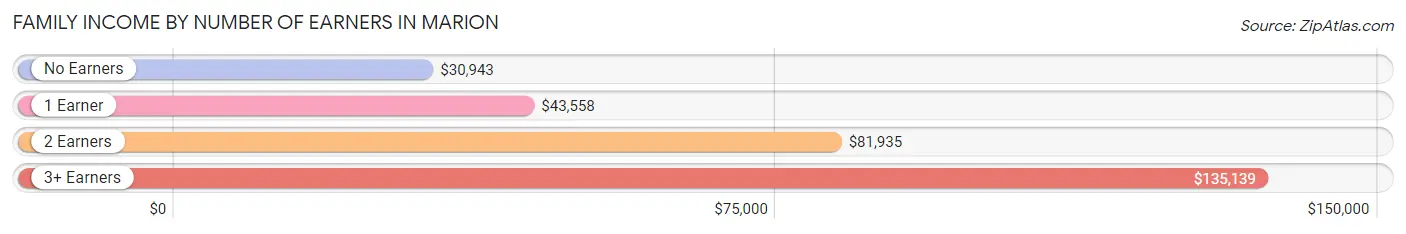
| Number of Earners | # Families | Median Income |
| No Earners | 268 (20.2%) | $30,943 |
| 1 Earner | 489 (36.8%) | $43,558 |
| 2 Earners | 444 (33.4%) | $81,935 |
| 3+ Earners | 127 (9.6%) | $135,139 |
| Total | 1,328 (100.0%) | $57,798 |
Household Income in Marion
Household Income Brackets in Marion
With 365 households falling in the category, the $15,000 to $24,999 income range is the most frequent in Marion, accounting for 15.3% of all households. In contrast, only 95 households (4.0%) fall into the $150,000 to $199,999 income bracket, making it the least populous group.
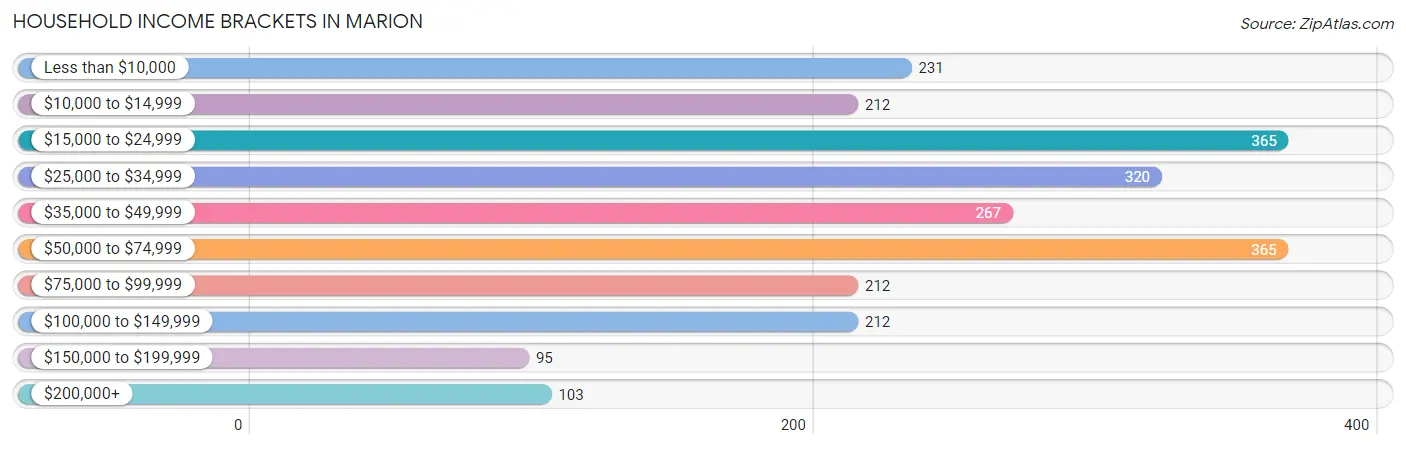
| Income Bracket | # Households | % Households |
| Less than $10,000 | 231 | 9.7% |
| $10,000 to $14,999 | 212 | 8.9% |
| $15,000 to $24,999 | 365 | 15.3% |
| $25,000 to $34,999 | 320 | 13.4% |
| $35,000 to $49,999 | 267 | 11.2% |
| $50,000 to $74,999 | 365 | 15.3% |
| $75,000 to $99,999 | 212 | 8.9% |
| $100,000 to $149,999 | 212 | 8.9% |
| $150,000 to $199,999 | 95 | 4.0% |
| $200,000+ | 103 | 4.3% |
Household Income by Householder Age in Marion
The median household income in Marion is $37,337, with the highest median household income of $50,517 found in the 25 to 44 years age bracket for the primary householder. A total of 629 households (26.4%) fall into this category. Meanwhile, the 15 to 24 years age bracket for the primary householder has the lowest median household income of $23,955, with 166 households (7.0%) in this group.
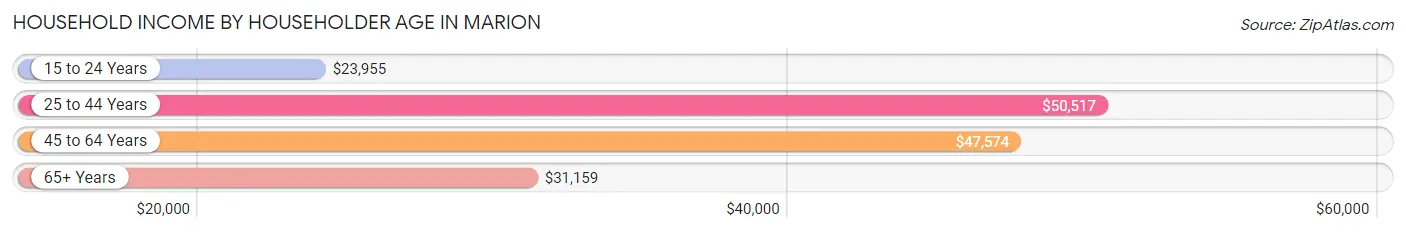
| Income Bracket | # Households | Median Income |
| 15 to 24 Years | 166 (7.0%) | $23,955 |
| 25 to 44 Years | 629 (26.4%) | $50,517 |
| 45 to 64 Years | 801 (33.6%) | $47,574 |
| 65+ Years | 789 (33.1%) | $31,159 |
| Total | 2,385 (100.0%) | $37,337 |
Poverty in Marion
Income Below Poverty by Sex and Age in Marion
With 16.7% poverty level for males and 24.0% for females among the residents of Marion, 55 to 64 year old males and 55 to 64 year old females are the most vulnerable to poverty, with 96 males (34.7%) and 162 females (48.2%) in their respective age groups living below the poverty level.
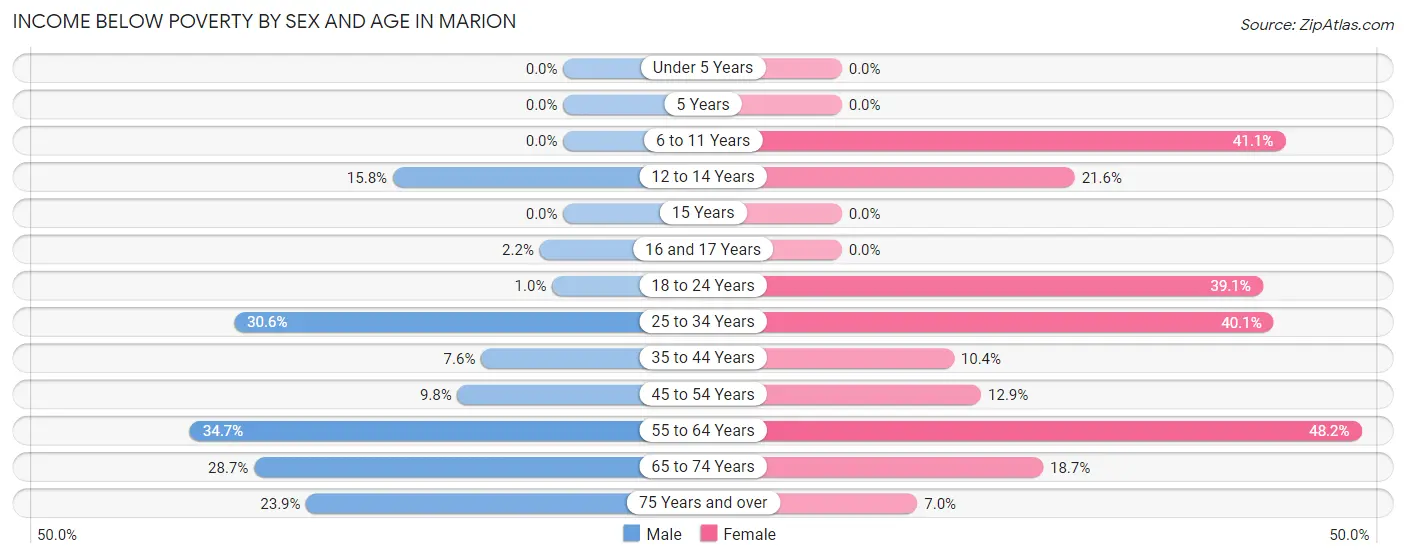
| Age Bracket | Male | Female |
| Under 5 Years | 0 (0.0%) | 0 (0.0%) |
| 5 Years | 0 (0.0%) | 0 (0.0%) |
| 6 to 11 Years | 0 (0.0%) | 72 (41.1%) |
| 12 to 14 Years | 28 (15.8%) | 32 (21.6%) |
| 15 Years | 0 (0.0%) | 0 (0.0%) |
| 16 and 17 Years | 3 (2.2%) | 0 (0.0%) |
| 18 to 24 Years | 2 (1.0%) | 123 (39.1%) |
| 25 to 34 Years | 99 (30.6%) | 137 (40.1%) |
| 35 to 44 Years | 16 (7.6%) | 31 (10.4%) |
| 45 to 54 Years | 43 (9.8%) | 49 (12.9%) |
| 55 to 64 Years | 96 (34.7%) | 162 (48.2%) |
| 65 to 74 Years | 62 (28.7%) | 48 (18.7%) |
| 75 Years and over | 52 (23.8%) | 27 (7.0%) |
| Total | 401 (16.7%) | 681 (24.0%) |
Income Above Poverty by Sex and Age in Marion
According to the poverty statistics in Marion, males aged under 5 years and females aged under 5 years are the age groups that are most secure financially, with 100.0% of males and 100.0% of females in these age groups living above the poverty line.
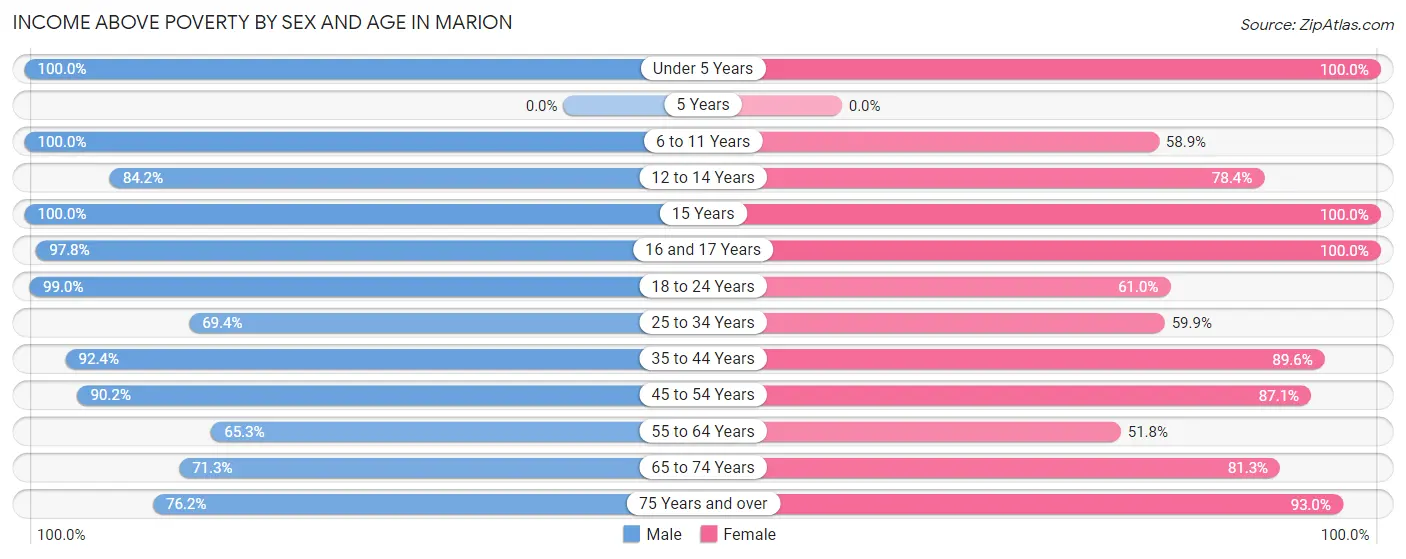
| Age Bracket | Male | Female |
| Under 5 Years | 84 (100.0%) | 120 (100.0%) |
| 5 Years | 0 (0.0%) | 0 (0.0%) |
| 6 to 11 Years | 105 (100.0%) | 103 (58.9%) |
| 12 to 14 Years | 149 (84.2%) | 116 (78.4%) |
| 15 Years | 17 (100.0%) | 31 (100.0%) |
| 16 and 17 Years | 134 (97.8%) | 55 (100.0%) |
| 18 to 24 Years | 193 (99.0%) | 192 (61.0%) |
| 25 to 34 Years | 225 (69.4%) | 205 (59.9%) |
| 35 to 44 Years | 194 (92.4%) | 267 (89.6%) |
| 45 to 54 Years | 395 (90.2%) | 330 (87.1%) |
| 55 to 64 Years | 181 (65.3%) | 174 (51.8%) |
| 65 to 74 Years | 154 (71.3%) | 209 (81.3%) |
| 75 Years and over | 166 (76.1%) | 358 (93.0%) |
| Total | 1,997 (83.3%) | 2,160 (76.0%) |
Income Below Poverty Among Married-Couple Families in Marion
The poverty statistics for married-couple families in Marion show that 4.7% or 39 of the total 824 families live below the poverty line. Families with 1 or 2 children have the highest poverty rate of 12.0%, comprising of 35 families. On the other hand, families with 3 or 4 children have the lowest poverty rate of 0.0%, which includes 0 families.
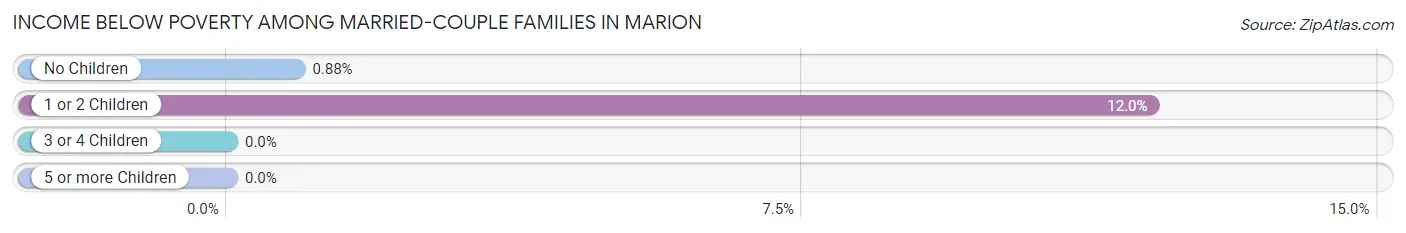
| Children | Above Poverty | Below Poverty |
| No Children | 453 (99.1%) | 4 (0.9%) |
| 1 or 2 Children | 256 (88.0%) | 35 (12.0%) |
| 3 or 4 Children | 59 (100.0%) | 0 (0.0%) |
| 5 or more Children | 17 (100.0%) | 0 (0.0%) |
| Total | 785 (95.3%) | 39 (4.7%) |
Income Below Poverty Among Single-Parent Households in Marion
According to the poverty data in Marion, 6.7% or 13 single-father households and 27.4% or 85 single-mother households are living below the poverty line. Among single-father households, those with no children have the highest poverty rate, with 8 households (8.7%) experiencing poverty. Likewise, among single-mother households, those with 1 or 2 children have the highest poverty rate, with 60 households (32.1%) falling below the poverty line.
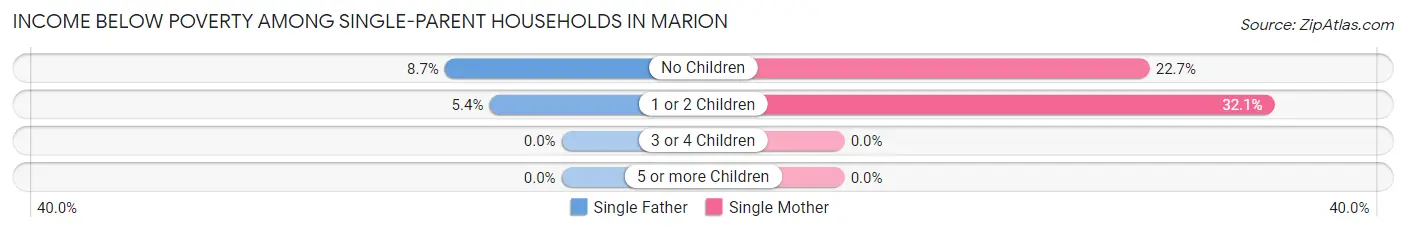
| Children | Single Father | Single Mother |
| No Children | 8 (8.7%) | 25 (22.7%) |
| 1 or 2 Children | 5 (5.4%) | 60 (32.1%) |
| 3 or 4 Children | 0 (0.0%) | 0 (0.0%) |
| 5 or more Children | 0 (0.0%) | 0 (0.0%) |
| Total | 13 (6.7%) | 85 (27.4%) |
Income Below Poverty Among Married-Couple vs Single-Parent Households in Marion
The poverty data for Marion shows that 39 of the married-couple family households (4.7%) and 98 of the single-parent households (19.4%) are living below the poverty level. Within the married-couple family households, those with 1 or 2 children have the highest poverty rate, with 35 households (12.0%) falling below the poverty line. Among the single-parent households, those with 1 or 2 children have the highest poverty rate, with 65 household (23.2%) living below poverty.
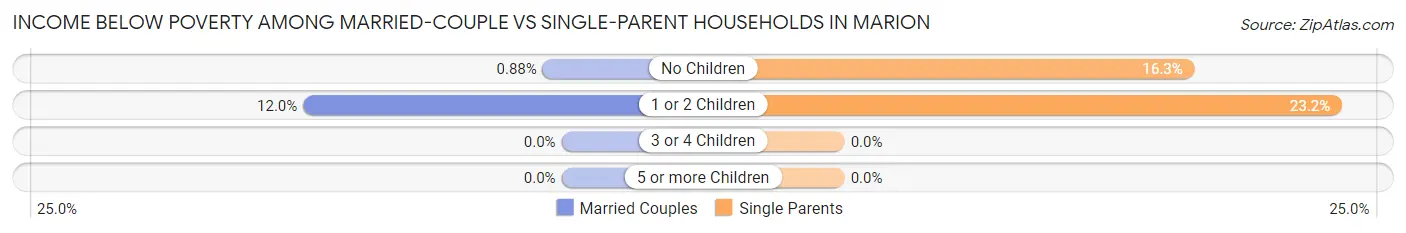
| Children | Married-Couple Families | Single-Parent Households |
| No Children | 4 (0.9%) | 33 (16.3%) |
| 1 or 2 Children | 35 (12.0%) | 65 (23.2%) |
| 3 or 4 Children | 0 (0.0%) | 0 (0.0%) |
| 5 or more Children | 0 (0.0%) | 0 (0.0%) |
| Total | 39 (4.7%) | 98 (19.4%) |
Race in Marion
The most populous races in Marion are White / Caucasian (5,148 | 90.0%), Black / African American (284 | 5.0%), and Two or more Races (262 | 4.6%).
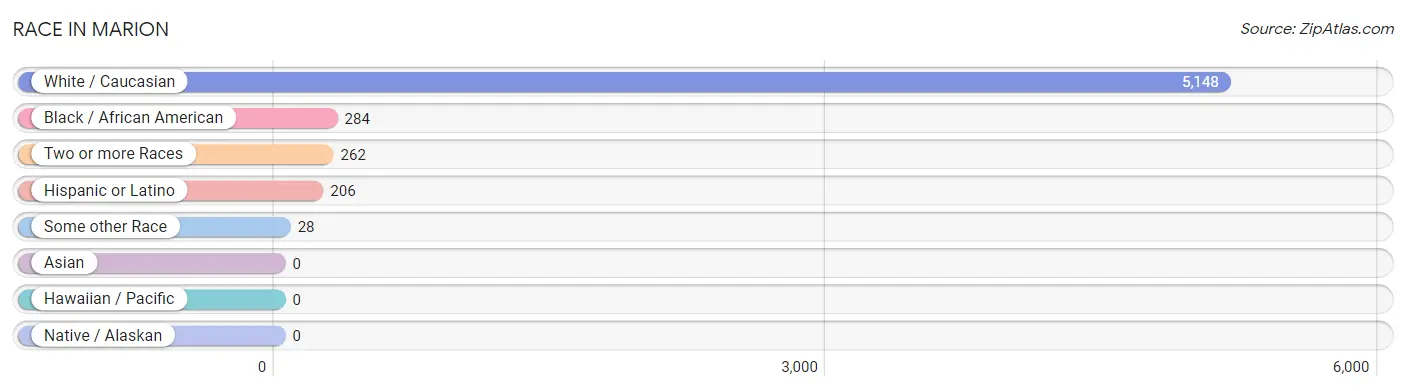
| Race | # Population | % Population |
| Asian | 0 | 0.0% |
| Black / African American | 284 | 5.0% |
| Hawaiian / Pacific | 0 | 0.0% |
| Hispanic or Latino | 206 | 3.6% |
| Native / Alaskan | 0 | 0.0% |
| White / Caucasian | 5,148 | 90.0% |
| Two or more Races | 262 | 4.6% |
| Some other Race | 28 | 0.5% |
| Total | 5,722 | 100.0% |
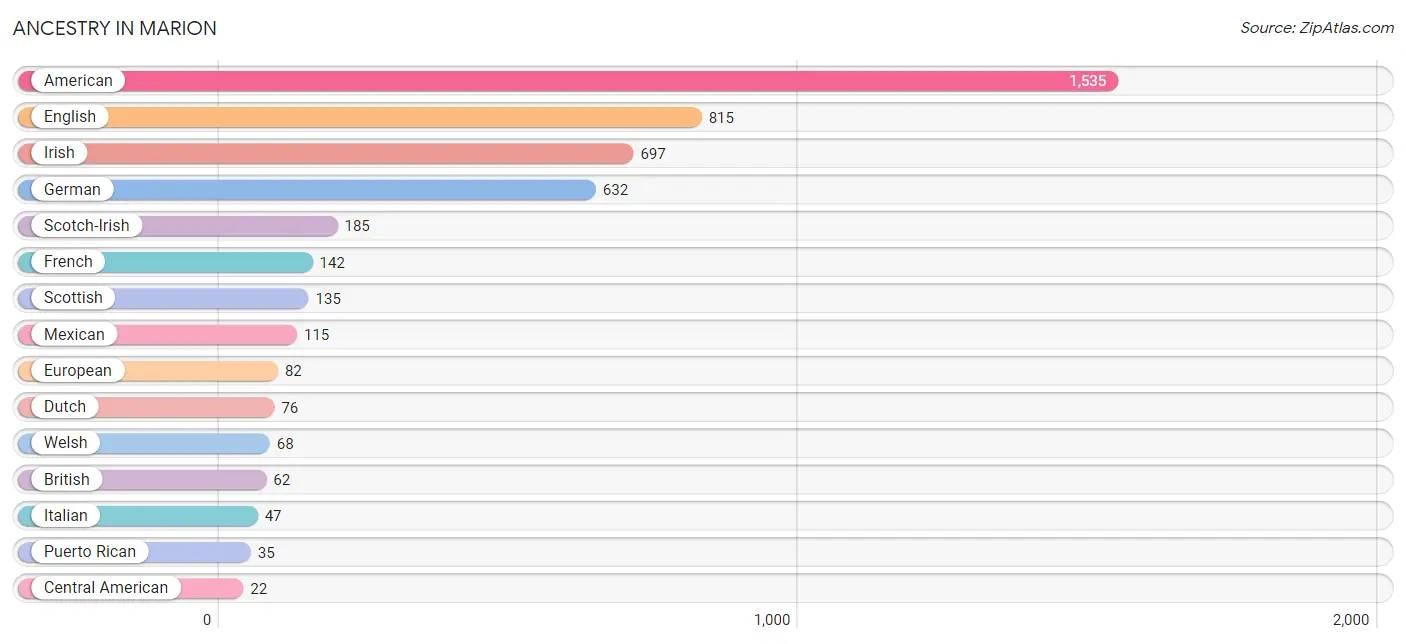
Ancestry in Marion
The most populous ancestries reported in Marion are American (1,535 | 26.8%), English (815 | 14.2%), Irish (697 | 12.2%), German (632 | 11.1%), and Scotch-Irish (185 | 3.2%), together accounting for 67.5% of all Marion residents.
| Ancestry | # Population | % Population |
| African | 12 | 0.2% |
| American | 1,535 | 26.8% |
| Arab | 2 | 0.0% |
| Assyrian / Chaldean / Syriac | 11 | 0.2% |
| British | 62 | 1.1% |
| Central American | 22 | 0.4% |
| Cherokee | 10 | 0.2% |
| Colombian | 14 | 0.2% |
| Danish | 7 | 0.1% |
| Dominican | 6 | 0.1% |
| Dutch | 76 | 1.3% |
| English | 815 | 14.2% |
| European | 82 | 1.4% |
| French | 142 | 2.5% |
| French Canadian | 6 | 0.1% |
| German | 632 | 11.1% |
| Greek | 7 | 0.1% |
| Irish | 697 | 12.2% |
| Italian | 47 | 0.8% |
| Mexican | 115 | 2.0% |
| Nicaraguan | 17 | 0.3% |
| Northern European | 10 | 0.2% |
| Norwegian | 1 | 0.0% |
| Panamanian | 2 | 0.0% |
| Polish | 11 | 0.2% |
| Puerto Rican | 35 | 0.6% |
| Salvadoran | 3 | 0.1% |
| Scandinavian | 14 | 0.2% |
| Scotch-Irish | 185 | 3.2% |
| Scottish | 135 | 2.4% |
| South American | 14 | 0.2% |
| Spanish | 6 | 0.1% |
| Subsaharan African | 12 | 0.2% |
| Swedish | 12 | 0.2% |
| Welsh | 68 | 1.2% | View All 35 Rows |
Immigrants in Marion
The most numerous immigrant groups reported in Marion came from Latin America (47 | 0.8%), Central America (39 | 0.7%), Nicaragua (17 | 0.3%), Honduras (16 | 0.3%), and Colombia (8 | 0.1%), together accounting for 2.2% of all Marion residents.
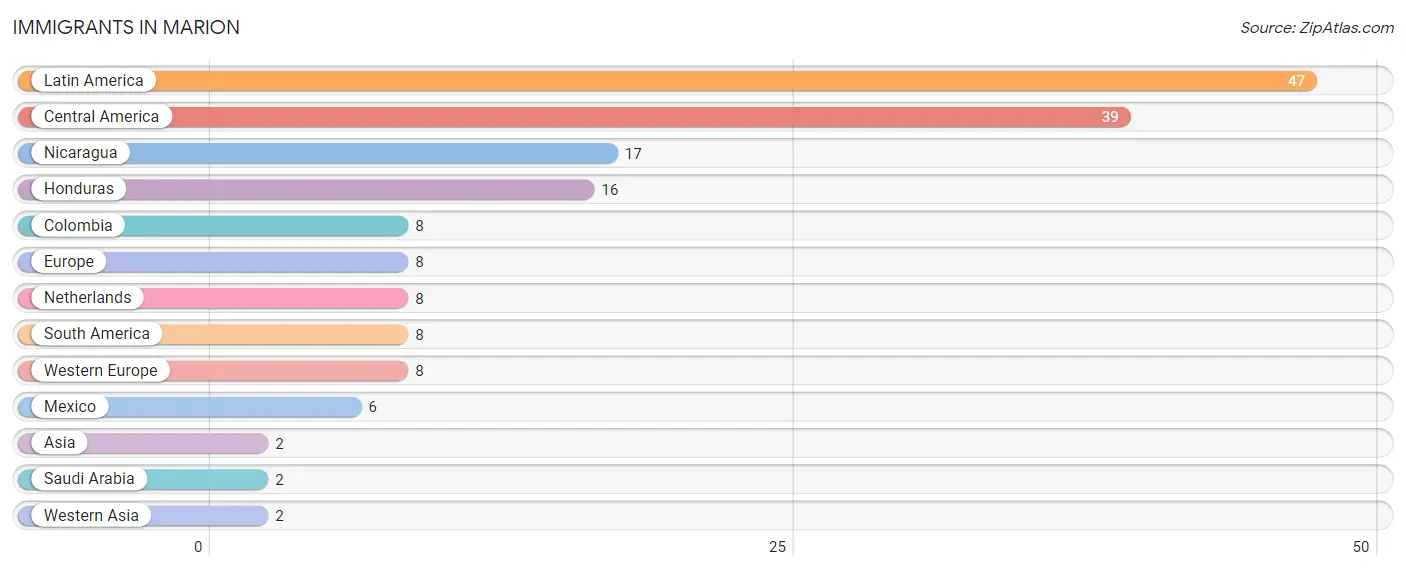
| Immigration Origin | # Population | % Population |
| Asia | 2 | 0.0% |
| Central America | 39 | 0.7% |
| Colombia | 8 | 0.1% |
| Europe | 8 | 0.1% |
| Honduras | 16 | 0.3% |
| Latin America | 47 | 0.8% |
| Mexico | 6 | 0.1% |
| Netherlands | 8 | 0.1% |
| Nicaragua | 17 | 0.3% |
| Saudi Arabia | 2 | 0.0% |
| South America | 8 | 0.1% |
| Western Asia | 2 | 0.0% |
| Western Europe | 8 | 0.1% | View All 13 Rows |
Sex and Age in Marion
Sex and Age in Marion
The most populous age groups in Marion are 50 to 54 Years (298 | 10.9%) for men and 20 to 24 Years (239 | 8.0%) for women.
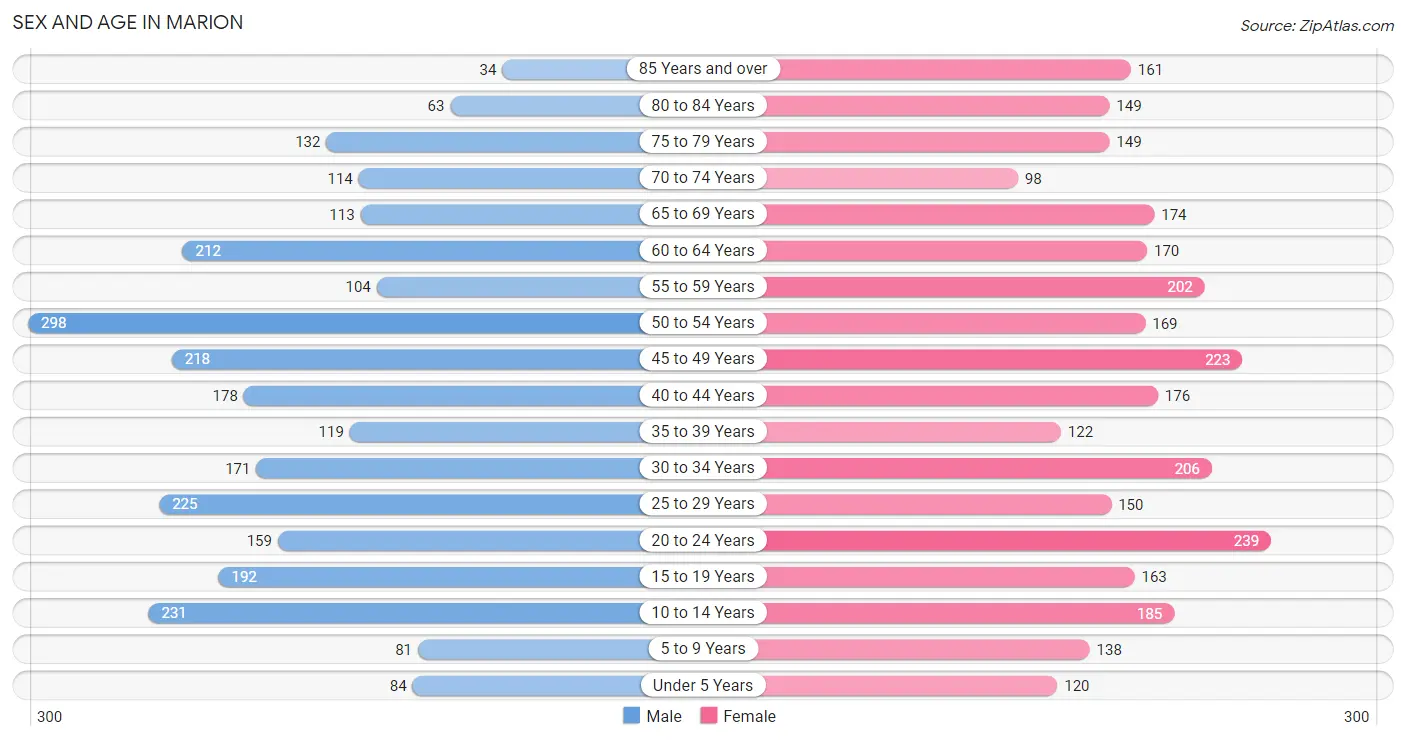
| Age Bracket | Male | Female |
| Under 5 Years | 84 (3.1%) | 120 (4.0%) |
| 5 to 9 Years | 81 (3.0%) | 138 (4.6%) |
| 10 to 14 Years | 231 (8.5%) | 185 (6.2%) |
| 15 to 19 Years | 192 (7.0%) | 163 (5.4%) |
| 20 to 24 Years | 159 (5.8%) | 239 (8.0%) |
| 25 to 29 Years | 225 (8.3%) | 150 (5.0%) |
| 30 to 34 Years | 171 (6.3%) | 206 (6.9%) |
| 35 to 39 Years | 119 (4.4%) | 122 (4.1%) |
| 40 to 44 Years | 178 (6.5%) | 176 (5.9%) |
| 45 to 49 Years | 218 (8.0%) | 223 (7.4%) |
| 50 to 54 Years | 298 (10.9%) | 169 (5.6%) |
| 55 to 59 Years | 104 (3.8%) | 202 (6.8%) |
| 60 to 64 Years | 212 (7.8%) | 170 (5.7%) |
| 65 to 69 Years | 113 (4.1%) | 174 (5.8%) |
| 70 to 74 Years | 114 (4.2%) | 98 (3.3%) |
| 75 to 79 Years | 132 (4.8%) | 149 (5.0%) |
| 80 to 84 Years | 63 (2.3%) | 149 (5.0%) |
| 85 Years and over | 34 (1.3%) | 161 (5.4%) |
| Total | 2,728 (100.0%) | 2,994 (100.0%) |
Families and Households in Marion
Median Family Size in Marion
The median family size in Marion is 2.77 persons per family, with married-couple families (824 | 62.1%) accounting for the largest median family size of 3.1 persons per family. On the other hand, single male/father families (194 | 14.6%) represent the smallest median family size with 1.86 persons per family.
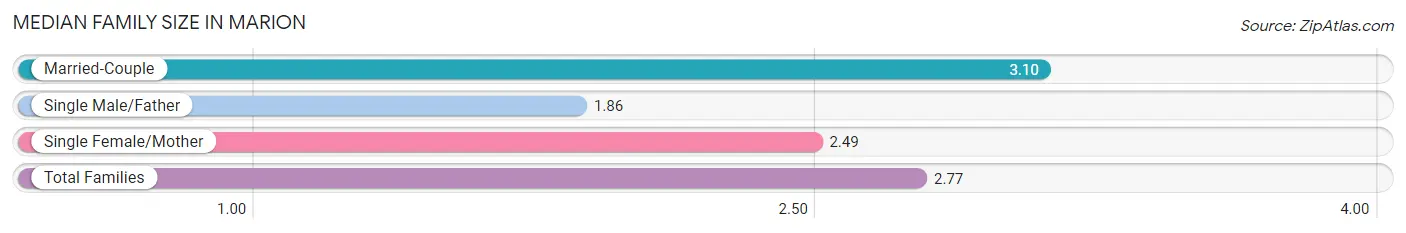
| Family Type | # Families | Family Size |
| Married-Couple | 824 (62.1%) | 3.10 |
| Single Male/Father | 194 (14.6%) | 1.86 |
| Single Female/Mother | 310 (23.3%) | 2.49 |
| Total Families | 1,328 (100.0%) | 2.77 |
Median Household Size in Marion
The median household size in Marion is 2.19 persons per household, with married-couple households (824 | 34.5%) accounting for the largest median household size of 3.13 persons per household. non-family households (1,057 | 44.3%) represent the smallest median household size with 1.27 persons per household.
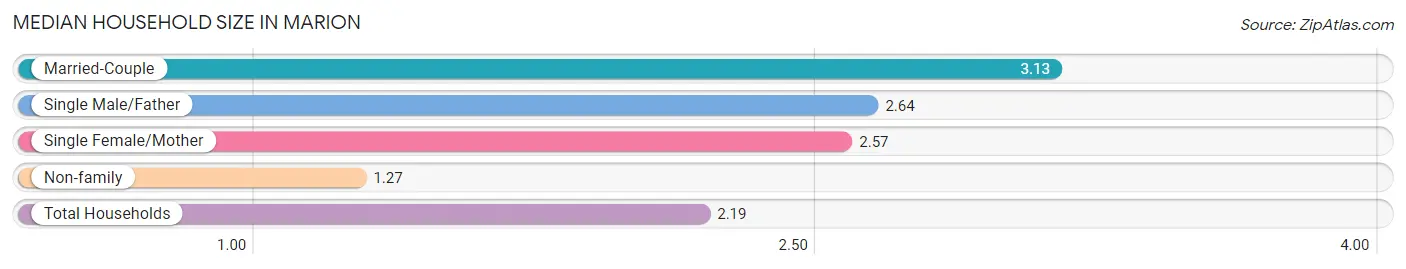
| Household Type | # Households | Household Size |
| Married-Couple | 824 (34.5%) | 3.13 |
| Single Male/Father | 194 (8.1%) | 2.64 |
| Single Female/Mother | 310 (13.0%) | 2.57 |
| Non-family | 1,057 (44.3%) | 1.27 |
| Total Households | 2,385 (100.0%) | 2.19 |
Household Size by Marriage Status in Marion
Out of a total of 2,385 households in Marion, 1,328 (55.7%) are family households, while 1,057 (44.3%) are nonfamily households. The most numerous type of family households are 2-person households, comprising 697, and the most common type of nonfamily households are 1-person households, comprising 877.
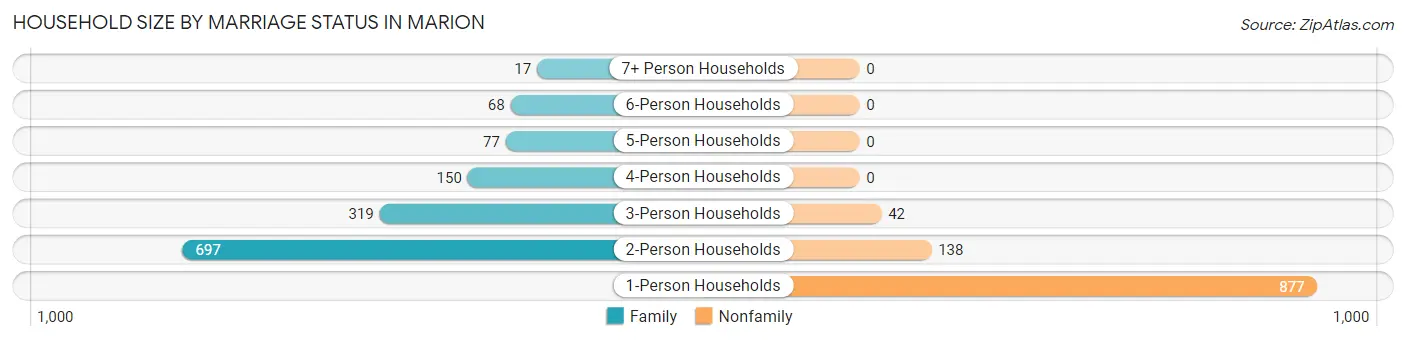
| Household Size | Family Households | Nonfamily Households |
| 1-Person Households | - | 877 (36.8%) |
| 2-Person Households | 697 (29.2%) | 138 (5.8%) |
| 3-Person Households | 319 (13.4%) | 42 (1.8%) |
| 4-Person Households | 150 (6.3%) | 0 (0.0%) |
| 5-Person Households | 77 (3.2%) | 0 (0.0%) |
| 6-Person Households | 68 (2.9%) | 0 (0.0%) |
| 7+ Person Households | 17 (0.7%) | 0 (0.0%) |
| Total | 1,328 (55.7%) | 1,057 (44.3%) |
Female Fertility in Marion
Fertility by Age in Marion
Average fertility rate in Marion is 38.0 births per 1,000 women. Women in the age bracket of 20 to 34 years have the highest fertility rate with 50.0 births per 1,000 women. Women in the age bracket of 20 to 34 years acount for 61.2% of all women with births.
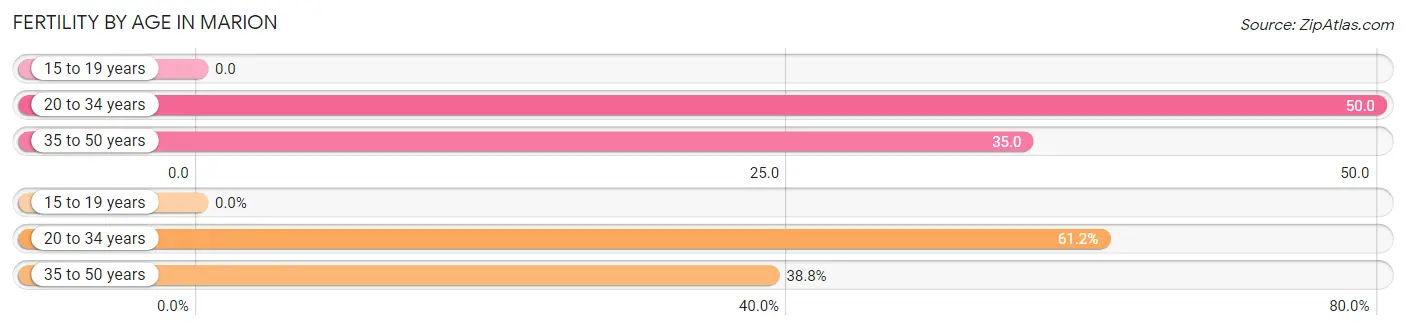
| Age Bracket | Women with Births | Births / 1,000 Women |
| 15 to 19 years | 0 (0.0%) | 0.0 |
| 20 to 34 years | 30 (61.2%) | 50.0 |
| 35 to 50 years | 19 (38.8%) | 35.0 |
| Total | 49 (100.0%) | 38.0 |
Fertility by Age by Marriage Status in Marion
55.1% of women with births (49) in Marion are married. The highest percentage of unmarried women with births falls into 20 to 34 years age bracket with 73.3% of them unmarried at the time of birth, while the lowest percentage of unmarried women with births belong to 35 to 50 years age bracket with 0.0% of them unmarried.
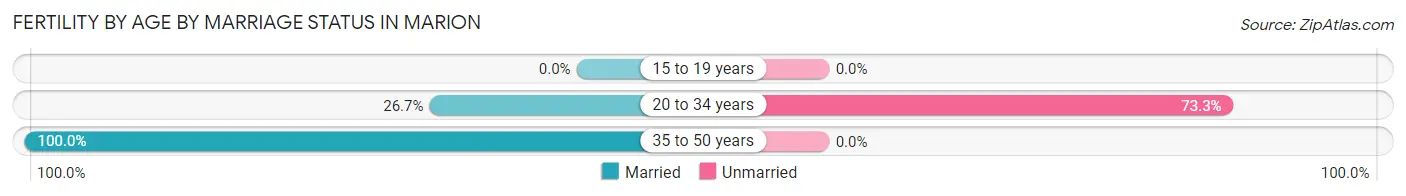
| Age Bracket | Married | Unmarried |
| 15 to 19 years | 0 (0.0%) | 0 (0.0%) |
| 20 to 34 years | 8 (26.7%) | 22 (73.3%) |
| 35 to 50 years | 19 (100.0%) | 0 (0.0%) |
| Total | 27 (55.1%) | 22 (44.9%) |
Fertility by Education in Marion
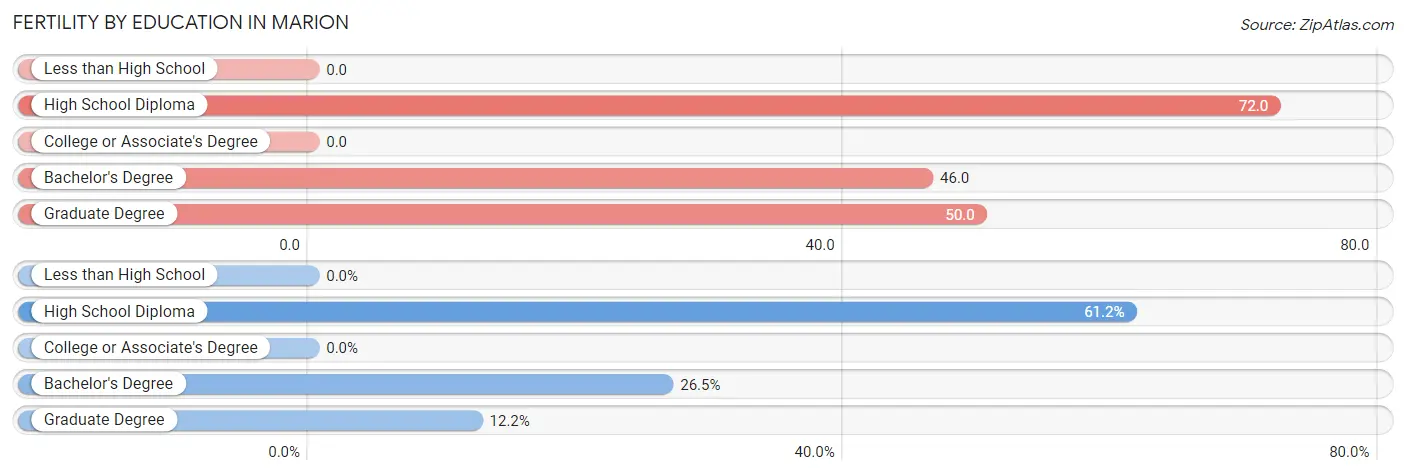
| Educational Attainment | Women with Births | Births / 1,000 Women |
| Less than High School | 0 (0.0%) | 0.0 |
| High School Diploma | 30 (61.2%) | 72.0 |
| College or Associate's Degree | 0 (0.0%) | 0.0 |
| Bachelor's Degree | 13 (26.5%) | 46.0 |
| Graduate Degree | 6 (12.2%) | 50.0 |
| Total | 49 (100.0%) | 38.0 |
Fertility by Education by Marriage Status in Marion
44.9% of women with births in Marion are unmarried. Women with the educational attainment of bachelor's degree are most likely to be married with 100.0% of them married at childbirth, while women with the educational attainment of high school diploma are least likely to be married with 73.3% of them unmarried at childbirth.
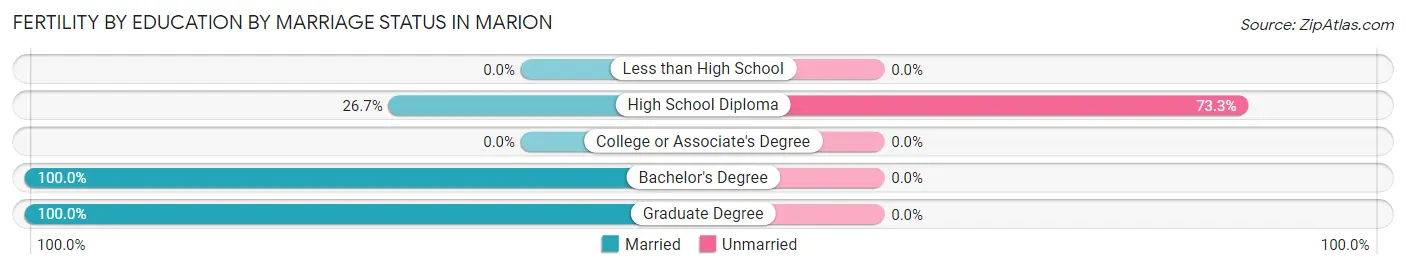
| Educational Attainment | Married | Unmarried |
| Less than High School | 0 (0.0%) | 0 (0.0%) |
| High School Diploma | 8 (26.7%) | 22 (73.3%) |
| College or Associate's Degree | 0 (0.0%) | 0 (0.0%) |
| Bachelor's Degree | 13 (100.0%) | 0 (0.0%) |
| Graduate Degree | 6 (100.0%) | 0 (0.0%) |
| Total | 27 (55.1%) | 22 (44.9%) |
Employment Characteristics in Marion
Employment by Class of Employer in Marion
Among the 2,220 employed individuals in Marion, private company employees (1,559 | 70.2%), local government employees (166 | 7.5%), and state government employees (158 | 7.1%) make up the most common classes of employment.
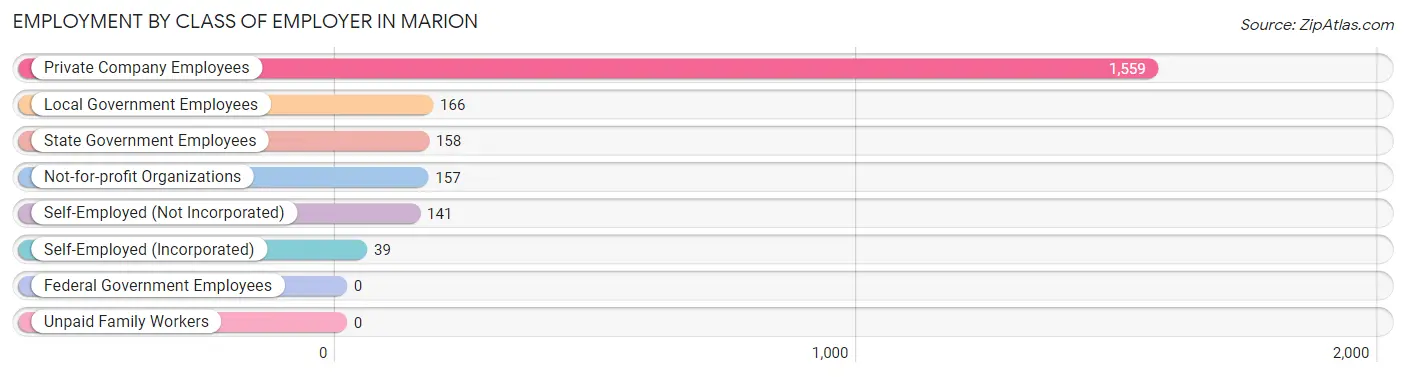
| Employer Class | # Employees | % Employees |
| Private Company Employees | 1,559 | 70.2% |
| Self-Employed (Incorporated) | 39 | 1.8% |
| Self-Employed (Not Incorporated) | 141 | 6.4% |
| Not-for-profit Organizations | 157 | 7.1% |
| Local Government Employees | 166 | 7.5% |
| State Government Employees | 158 | 7.1% |
| Federal Government Employees | 0 | 0.0% |
| Unpaid Family Workers | 0 | 0.0% |
| Total | 2,220 | 100.0% |
Employment Status by Age in Marion
According to the labor force statistics for Marion, out of the total population over 16 years of age (4,835), 49.5% or 2,393 individuals are in the labor force, with 5.1% or 122 of them unemployed. The age group with the highest labor force participation rate is 30 to 34 years, with 77.5% or 292 individuals in the labor force. Within the labor force, the 25 to 29 years age range has the highest percentage of unemployed individuals, with 14.2% or 30 of them being unemployed.
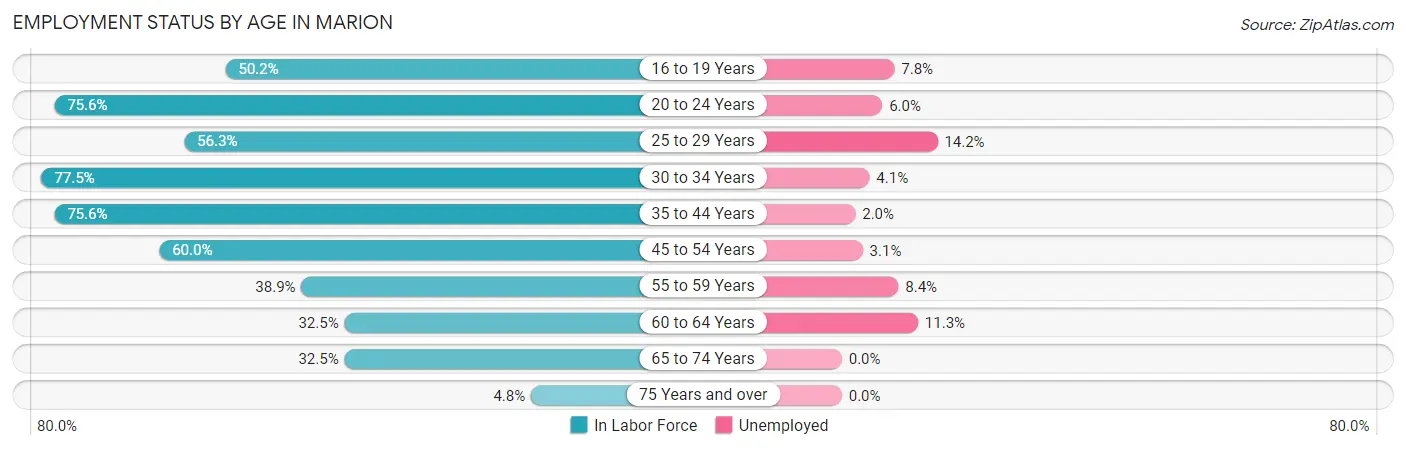
| Age Bracket | In Labor Force | Unemployed |
| 16 to 19 Years | 154 (50.2%) | 12 (7.8%) |
| 20 to 24 Years | 301 (75.6%) | 18 (6.0%) |
| 25 to 29 Years | 211 (56.3%) | 30 (14.2%) |
| 30 to 34 Years | 292 (77.5%) | 12 (4.1%) |
| 35 to 44 Years | 450 (75.6%) | 9 (2.0%) |
| 45 to 54 Years | 545 (60.0%) | 17 (3.1%) |
| 55 to 59 Years | 119 (38.9%) | 10 (8.4%) |
| 60 to 64 Years | 124 (32.5%) | 14 (11.3%) |
| 65 to 74 Years | 162 (32.5%) | 0 (0.0%) |
| 75 Years and over | 33 (4.8%) | 0 (0.0%) |
| Total | 2,393 (49.5%) | 122 (5.1%) |
Employment Status by Educational Attainment in Marion
According to labor force statistics for Marion, 59.2% of individuals (1,742) out of the total population between 25 and 64 years of age (2,943) are in the labor force, with 5.3% or 92 of them being unemployed. The group with the highest labor force participation rate are those with the educational attainment of bachelor's degree or higher, with 78.0% or 538 individuals in the labor force. Within the labor force, individuals with less than high school education have the highest percentage of unemployment, with 8.7% or 9 of them being unemployed.
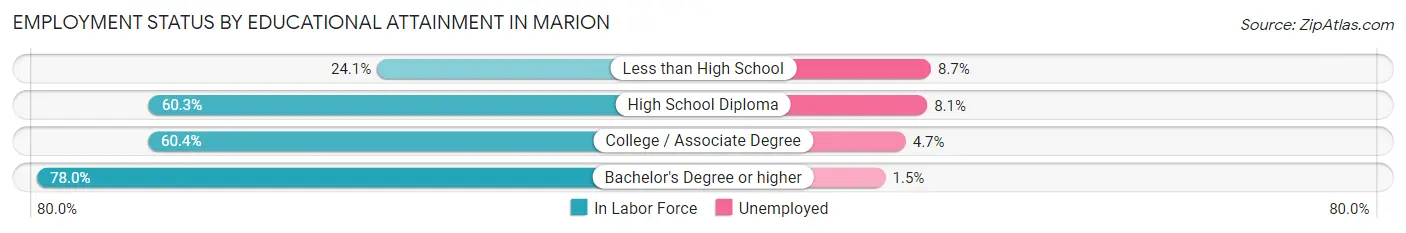
| Educational Attainment | In Labor Force | Unemployed |
| Less than High School | 104 (24.1%) | 37 (8.7%) |
| High School Diploma | 694 (60.3%) | 93 (8.1%) |
| College / Associate Degree | 405 (60.4%) | 32 (4.7%) |
| Bachelor's Degree or higher | 538 (78.0%) | 10 (1.5%) |
| Total | 1,742 (59.2%) | 156 (5.3%) |
Employment Occupations by Sex in Marion
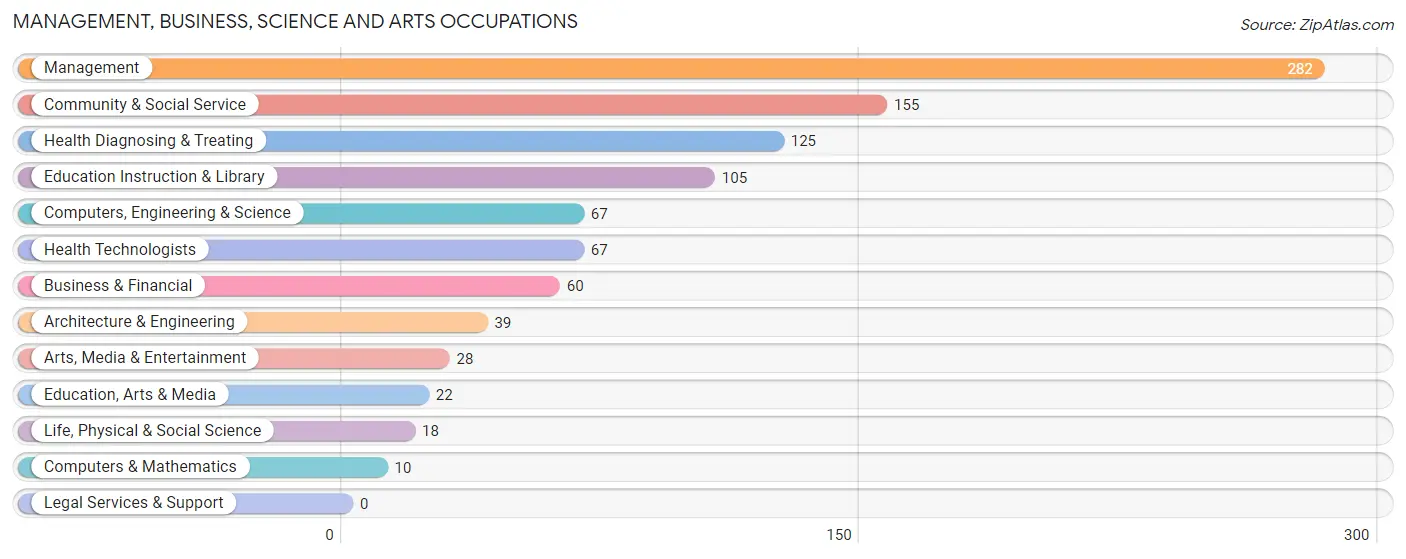
Management, Business, Science and Arts Occupations
The most common Management, Business, Science and Arts occupations in Marion are Management (282 | 12.4%), Community & Social Service (155 | 6.8%), Health Diagnosing & Treating (125 | 5.5%), Education Instruction & Library (105 | 4.6%), and Computers, Engineering & Science (67 | 2.9%).
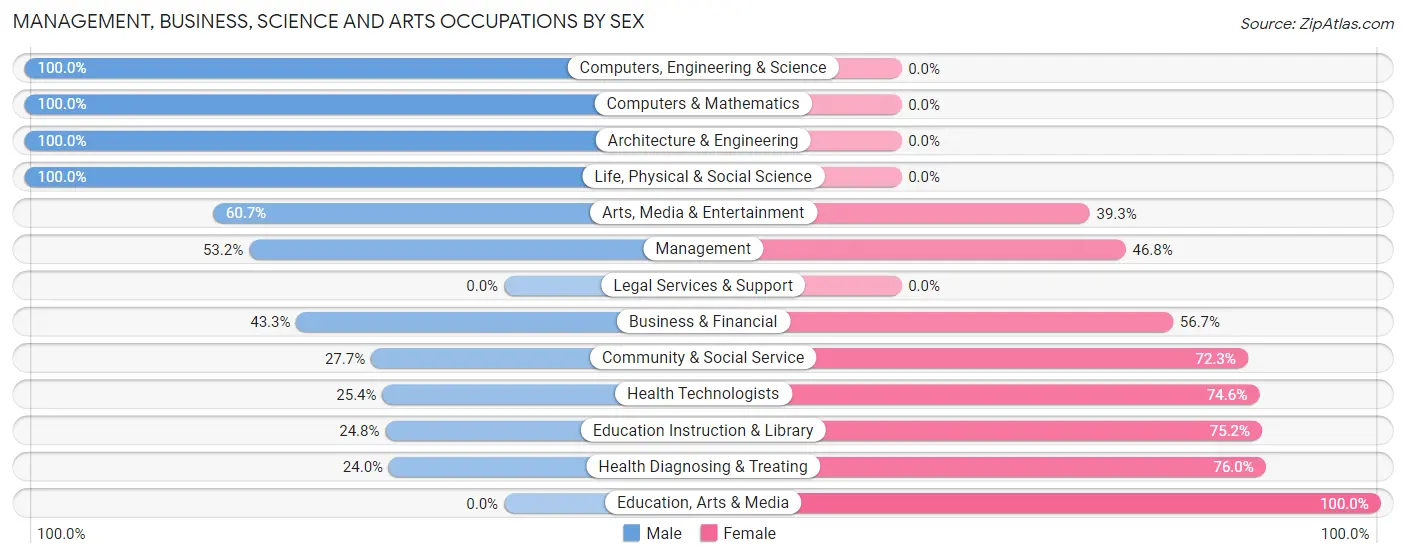
Management, Business, Science and Arts Occupations by Sex
Within the Management, Business, Science and Arts occupations in Marion, the most male-oriented occupations are Computers, Engineering & Science (100.0%), Computers & Mathematics (100.0%), and Architecture & Engineering (100.0%), while the most female-oriented occupations are Education, Arts & Media (100.0%), Health Diagnosing & Treating (76.0%), and Education Instruction & Library (75.2%).
| Occupation | Male | Female |
| Management | 150 (53.2%) | 132 (46.8%) |
| Business & Financial | 26 (43.3%) | 34 (56.7%) |
| Computers, Engineering & Science | 67 (100.0%) | 0 (0.0%) |
| Computers & Mathematics | 10 (100.0%) | 0 (0.0%) |
| Architecture & Engineering | 39 (100.0%) | 0 (0.0%) |
| Life, Physical & Social Science | 18 (100.0%) | 0 (0.0%) |
| Community & Social Service | 43 (27.7%) | 112 (72.3%) |
| Education, Arts & Media | 0 (0.0%) | 22 (100.0%) |
| Legal Services & Support | 0 (0.0%) | 0 (0.0%) |
| Education Instruction & Library | 26 (24.8%) | 79 (75.2%) |
| Arts, Media & Entertainment | 17 (60.7%) | 11 (39.3%) |
| Health Diagnosing & Treating | 30 (24.0%) | 95 (76.0%) |
| Health Technologists | 17 (25.4%) | 50 (74.6%) |
| Total (Category) | 316 (45.9%) | 373 (54.1%) |
| Total (Overall) | 1,083 (47.7%) | 1,186 (52.3%) |
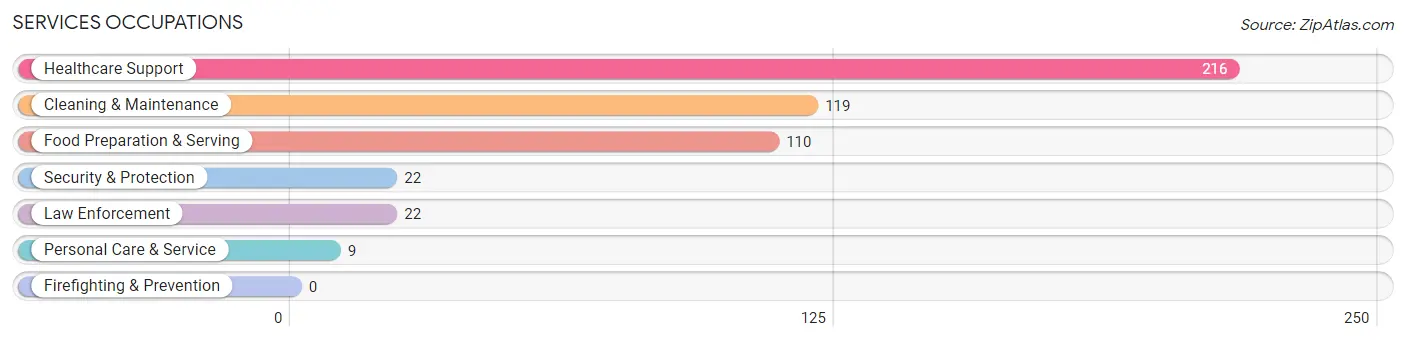
Services Occupations
The most common Services occupations in Marion are Healthcare Support (216 | 9.5%), Cleaning & Maintenance (119 | 5.2%), Food Preparation & Serving (110 | 4.9%), Security & Protection (22 | 1.0%), and Law Enforcement (22 | 1.0%).
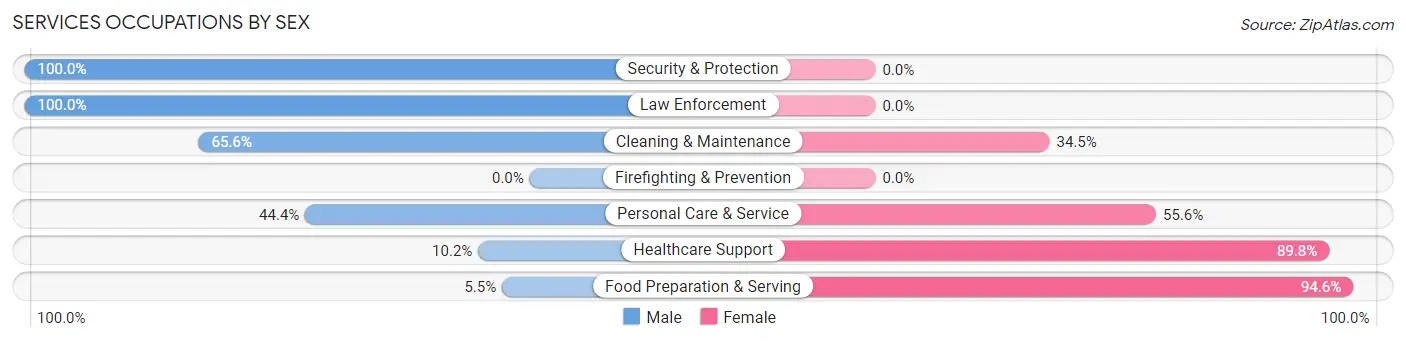
Services Occupations by Sex
Within the Services occupations in Marion, the most male-oriented occupations are Security & Protection (100.0%), Law Enforcement (100.0%), and Cleaning & Maintenance (65.5%), while the most female-oriented occupations are Food Preparation & Serving (94.6%), Healthcare Support (89.8%), and Personal Care & Service (55.6%).
| Occupation | Male | Female |
| Healthcare Support | 22 (10.2%) | 194 (89.8%) |
| Security & Protection | 22 (100.0%) | 0 (0.0%) |
| Firefighting & Prevention | 0 (0.0%) | 0 (0.0%) |
| Law Enforcement | 22 (100.0%) | 0 (0.0%) |
| Food Preparation & Serving | 6 (5.4%) | 104 (94.6%) |
| Cleaning & Maintenance | 78 (65.5%) | 41 (34.4%) |
| Personal Care & Service | 4 (44.4%) | 5 (55.6%) |
| Total (Category) | 132 (27.7%) | 344 (72.3%) |
| Total (Overall) | 1,083 (47.7%) | 1,186 (52.3%) |
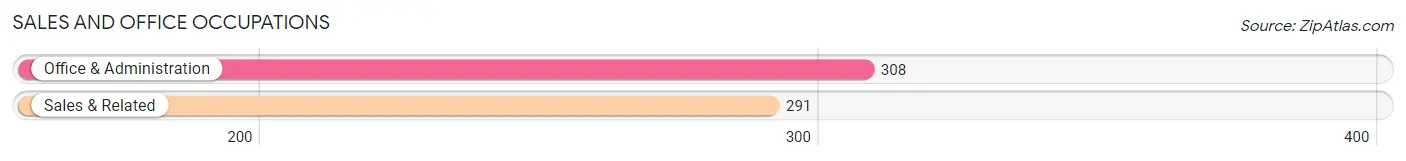
Sales and Office Occupations
The most common Sales and Office occupations in Marion are Office & Administration (308 | 13.6%), and Sales & Related (291 | 12.8%).
Sales and Office Occupations by Sex
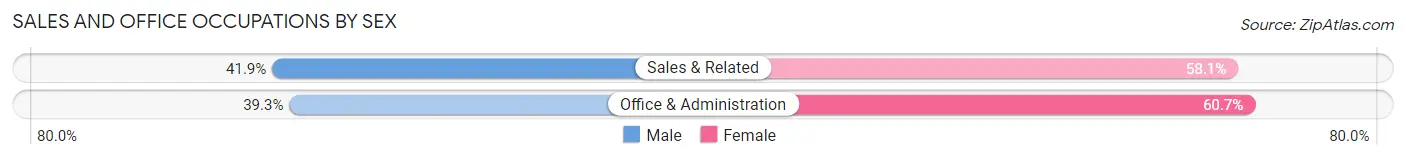
| Occupation | Male | Female |
| Sales & Related | 122 (41.9%) | 169 (58.1%) |
| Office & Administration | 121 (39.3%) | 187 (60.7%) |
| Total (Category) | 243 (40.6%) | 356 (59.4%) |
| Total (Overall) | 1,083 (47.7%) | 1,186 (52.3%) |
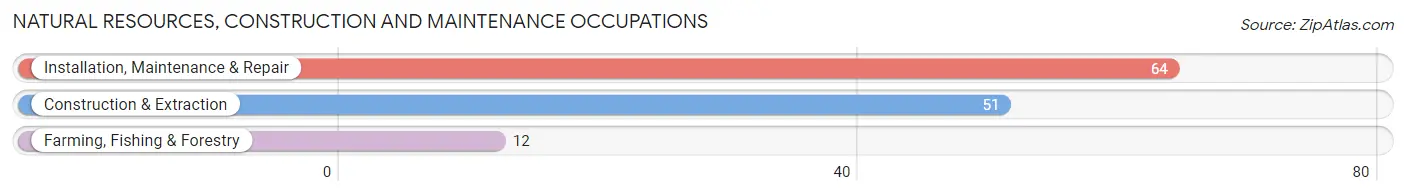
Natural Resources, Construction and Maintenance Occupations
The most common Natural Resources, Construction and Maintenance occupations in Marion are Installation, Maintenance & Repair (64 | 2.8%), Construction & Extraction (51 | 2.2%), and Farming, Fishing & Forestry (12 | 0.5%).
Natural Resources, Construction and Maintenance Occupations by Sex
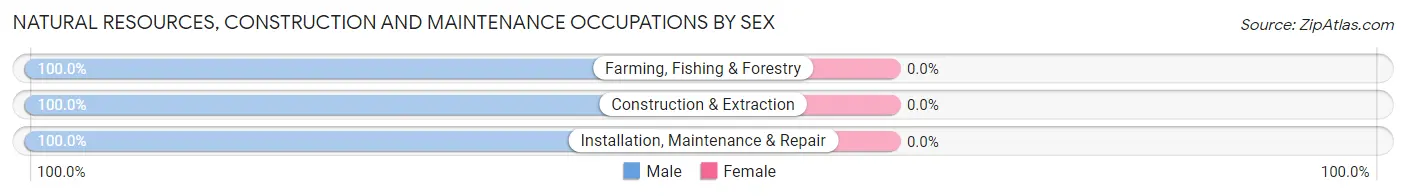
| Occupation | Male | Female |
| Farming, Fishing & Forestry | 12 (100.0%) | 0 (0.0%) |
| Construction & Extraction | 51 (100.0%) | 0 (0.0%) |
| Installation, Maintenance & Repair | 64 (100.0%) | 0 (0.0%) |
| Total (Category) | 127 (100.0%) | 0 (0.0%) |
| Total (Overall) | 1,083 (47.7%) | 1,186 (52.3%) |
Production, Transportation and Moving Occupations
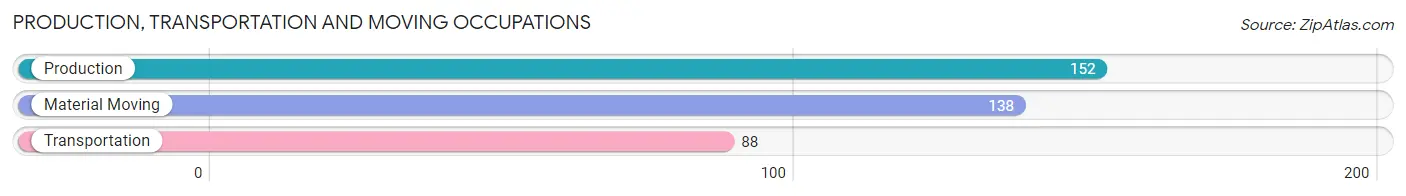
The most common Production, Transportation and Moving occupations in Marion are Production (152 | 6.7%), Material Moving (138 | 6.1%), and Transportation (88 | 3.9%).
Production, Transportation and Moving Occupations by Sex
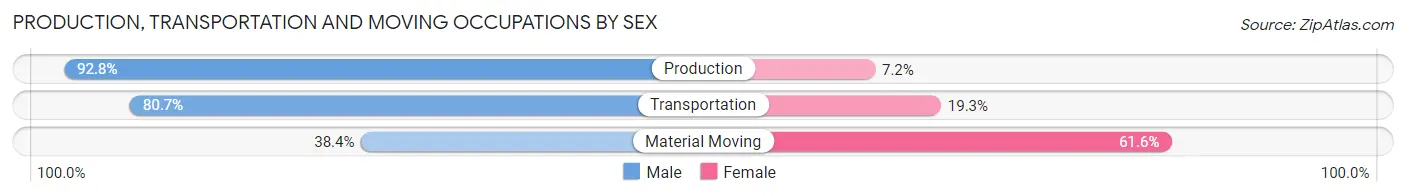
| Occupation | Male | Female |
| Production | 141 (92.8%) | 11 (7.2%) |
| Transportation | 71 (80.7%) | 17 (19.3%) |
| Material Moving | 53 (38.4%) | 85 (61.6%) |
| Total (Category) | 265 (70.1%) | 113 (29.9%) |
| Total (Overall) | 1,083 (47.7%) | 1,186 (52.3%) |
Employment Industries by Sex in Marion
Employment Industries in Marion
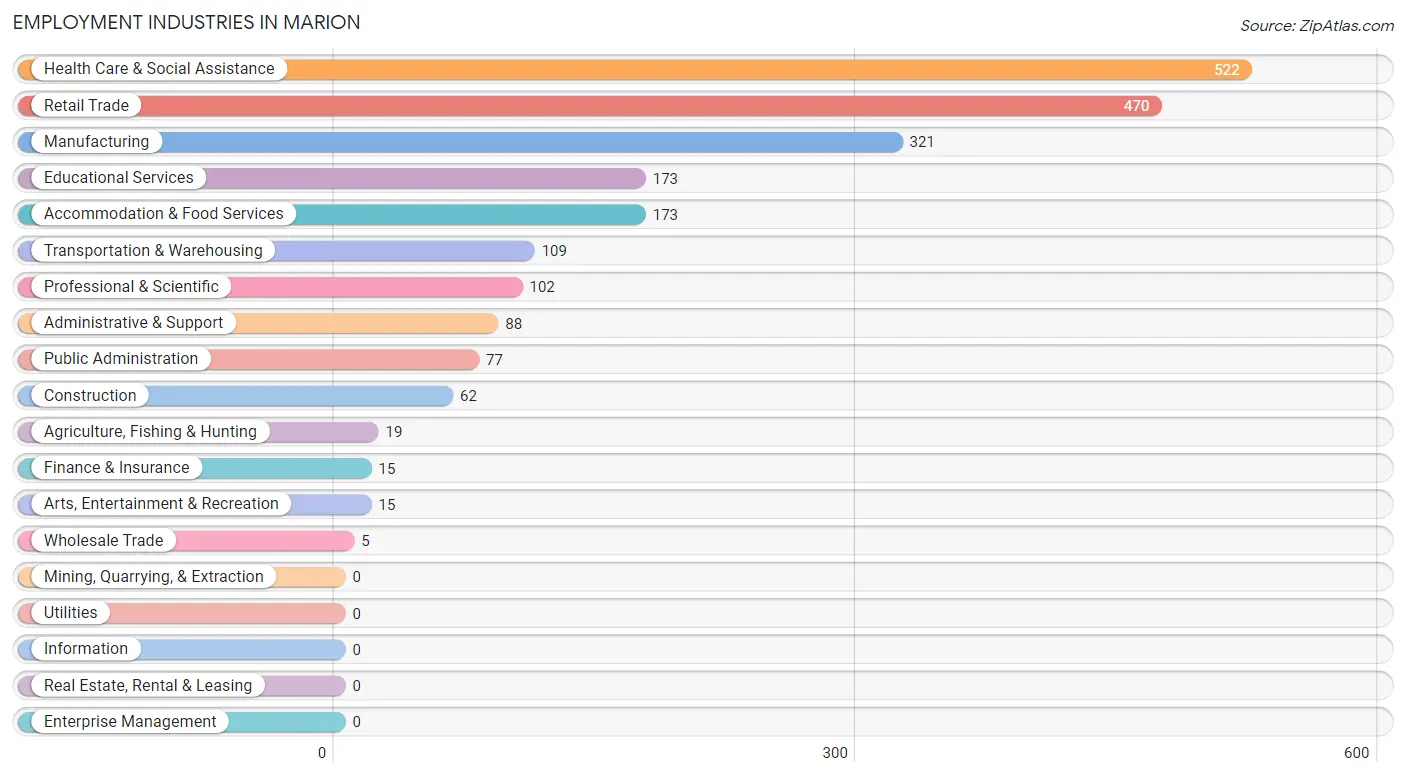
The major employment industries in Marion include Health Care & Social Assistance (522 | 23.0%), Retail Trade (470 | 20.7%), Manufacturing (321 | 14.1%), Educational Services (173 | 7.6%), and Accommodation & Food Services (173 | 7.6%).
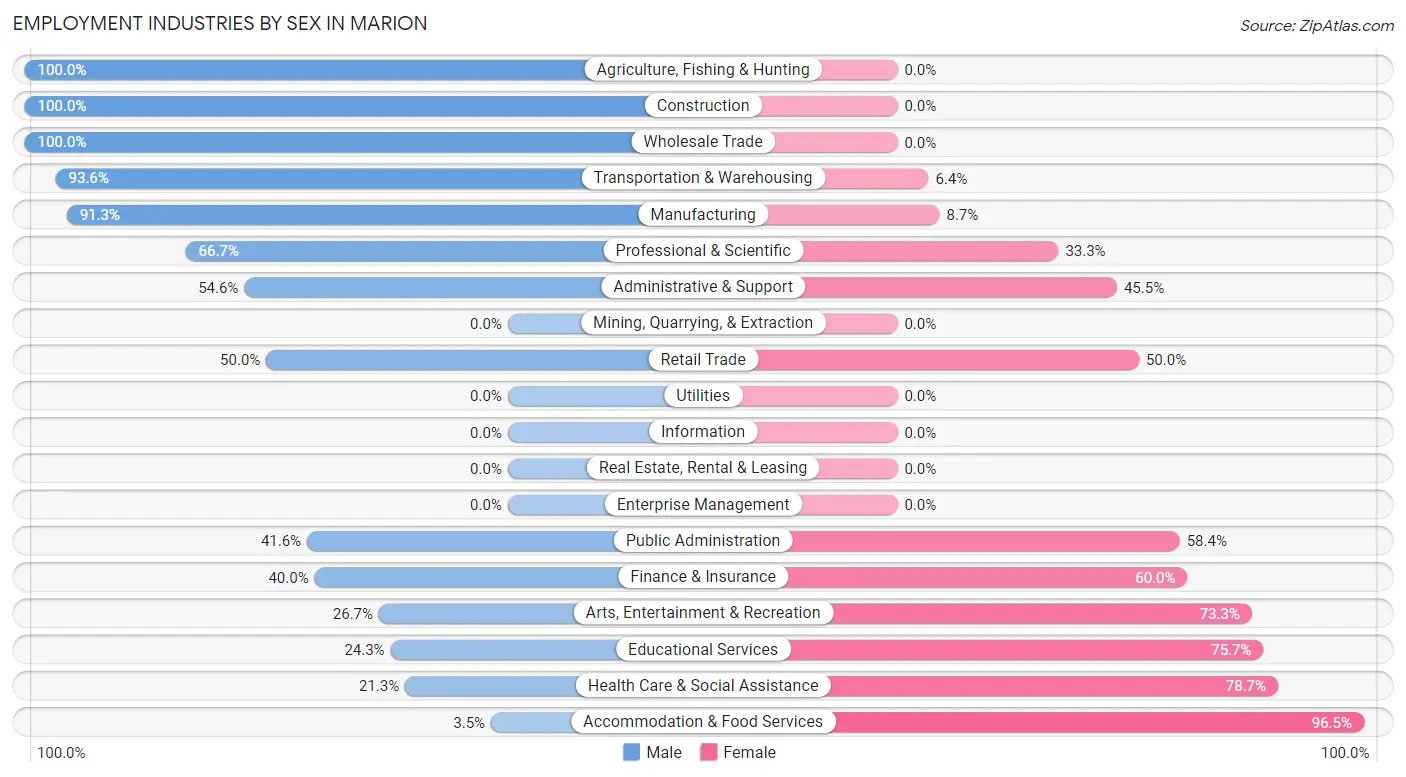
Employment Industries by Sex in Marion
The Marion industries that see more men than women are Agriculture, Fishing & Hunting (100.0%), Construction (100.0%), and Wholesale Trade (100.0%), whereas the industries that tend to have a higher number of women are Accommodation & Food Services (96.5%), Health Care & Social Assistance (78.7%), and Educational Services (75.7%).
| Industry | Male | Female |
| Agriculture, Fishing & Hunting | 19 (100.0%) | 0 (0.0%) |
| Mining, Quarrying, & Extraction | 0 (0.0%) | 0 (0.0%) |
| Construction | 62 (100.0%) | 0 (0.0%) |
| Manufacturing | 293 (91.3%) | 28 (8.7%) |
| Wholesale Trade | 5 (100.0%) | 0 (0.0%) |
| Retail Trade | 235 (50.0%) | 235 (50.0%) |
| Transportation & Warehousing | 102 (93.6%) | 7 (6.4%) |
| Utilities | 0 (0.0%) | 0 (0.0%) |
| Information | 0 (0.0%) | 0 (0.0%) |
| Finance & Insurance | 6 (40.0%) | 9 (60.0%) |
| Real Estate, Rental & Leasing | 0 (0.0%) | 0 (0.0%) |
| Professional & Scientific | 68 (66.7%) | 34 (33.3%) |
| Enterprise Management | 0 (0.0%) | 0 (0.0%) |
| Administrative & Support | 48 (54.5%) | 40 (45.5%) |
| Educational Services | 42 (24.3%) | 131 (75.7%) |
| Health Care & Social Assistance | 111 (21.3%) | 411 (78.7%) |
| Arts, Entertainment & Recreation | 4 (26.7%) | 11 (73.3%) |
| Accommodation & Food Services | 6 (3.5%) | 167 (96.5%) |
| Public Administration | 32 (41.6%) | 45 (58.4%) |
| Total | 1,083 (47.7%) | 1,186 (52.3%) |
Education in Marion
School Enrollment in Marion
The most common levels of schooling among the 1,192 students in Marion are high school (326 | 27.4%), middle school (323 | 27.1%), and elementary school (177 | 14.8%).
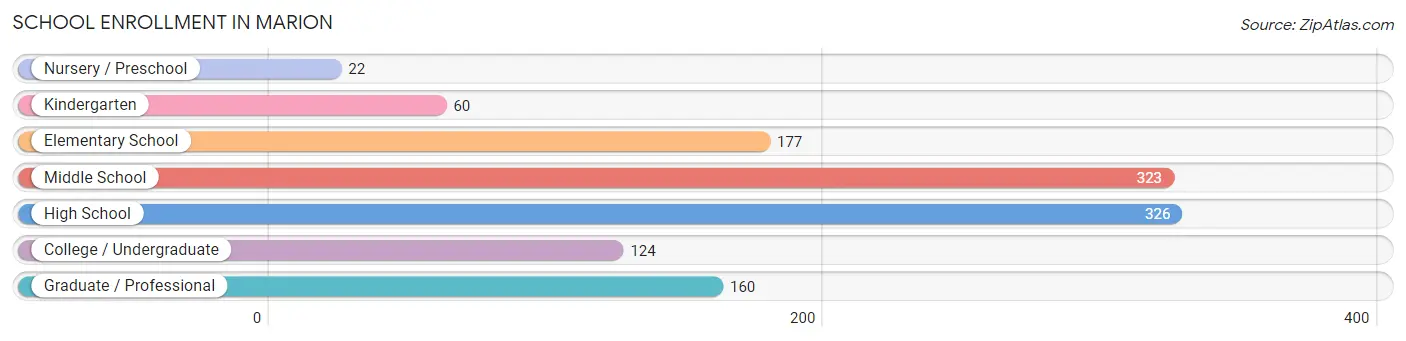
| School Level | # Students | % Students |
| Nursery / Preschool | 22 | 1.8% |
| Kindergarten | 60 | 5.0% |
| Elementary School | 177 | 14.8% |
| Middle School | 323 | 27.1% |
| High School | 326 | 27.4% |
| College / Undergraduate | 124 | 10.4% |
| Graduate / Professional | 160 | 13.4% |
| Total | 1,192 | 100.0% |
School Enrollment by Age by Funding Source in Marion
Out of a total of 1,192 students who are enrolled in schools in Marion, 266 (22.3%) attend a private institution, while the remaining 926 (77.7%) are enrolled in public schools. The age group of 25 to 34 year olds has the highest likelihood of being enrolled in private schools, with 61 (88.4% in the age bracket) enrolled. Conversely, the age group of 10 to 14 year olds has the lowest likelihood of being enrolled in a private school, with 375 (93.5% in the age bracket) attending a public institution.
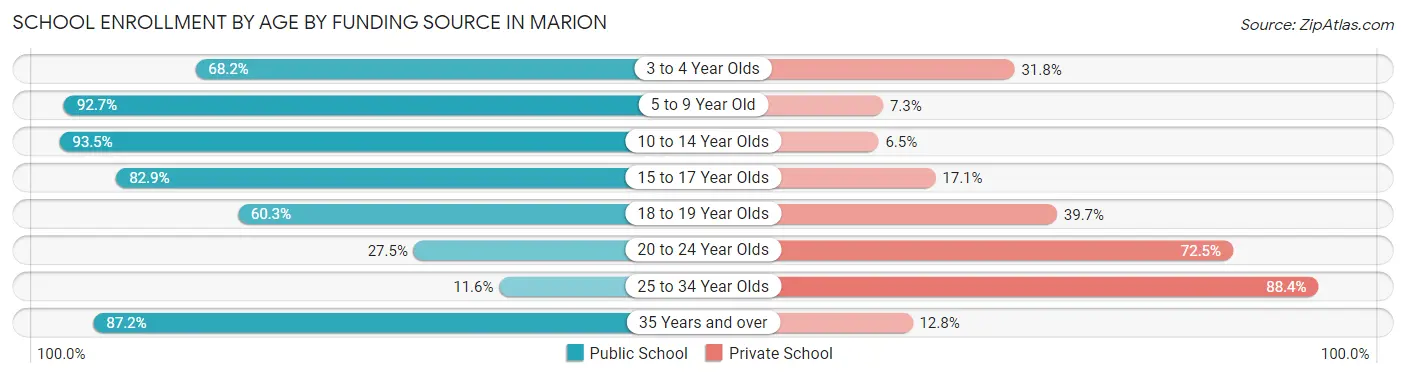
| Age Bracket | Public School | Private School |
| 3 to 4 Year Olds | 15 (68.2%) | 7 (31.8%) |
| 5 to 9 Year Old | 190 (92.7%) | 15 (7.3%) |
| 10 to 14 Year Olds | 375 (93.5%) | 26 (6.5%) |
| 15 to 17 Year Olds | 199 (82.9%) | 41 (17.1%) |
| 18 to 19 Year Olds | 41 (60.3%) | 27 (39.7%) |
| 20 to 24 Year Olds | 30 (27.5%) | 79 (72.5%) |
| 25 to 34 Year Olds | 8 (11.6%) | 61 (88.4%) |
| 35 Years and over | 68 (87.2%) | 10 (12.8%) |
| Total | 926 (77.7%) | 266 (22.3%) |
Educational Attainment by Field of Study in Marion
Business (192 | 20.8%), science & technology (129 | 14.0%), bio, nature & agricultural (119 | 12.9%), education (112 | 12.2%), and arts & humanities (76 | 8.3%) are the most common fields of study among 921 individuals in Marion who have obtained a bachelor's degree or higher.
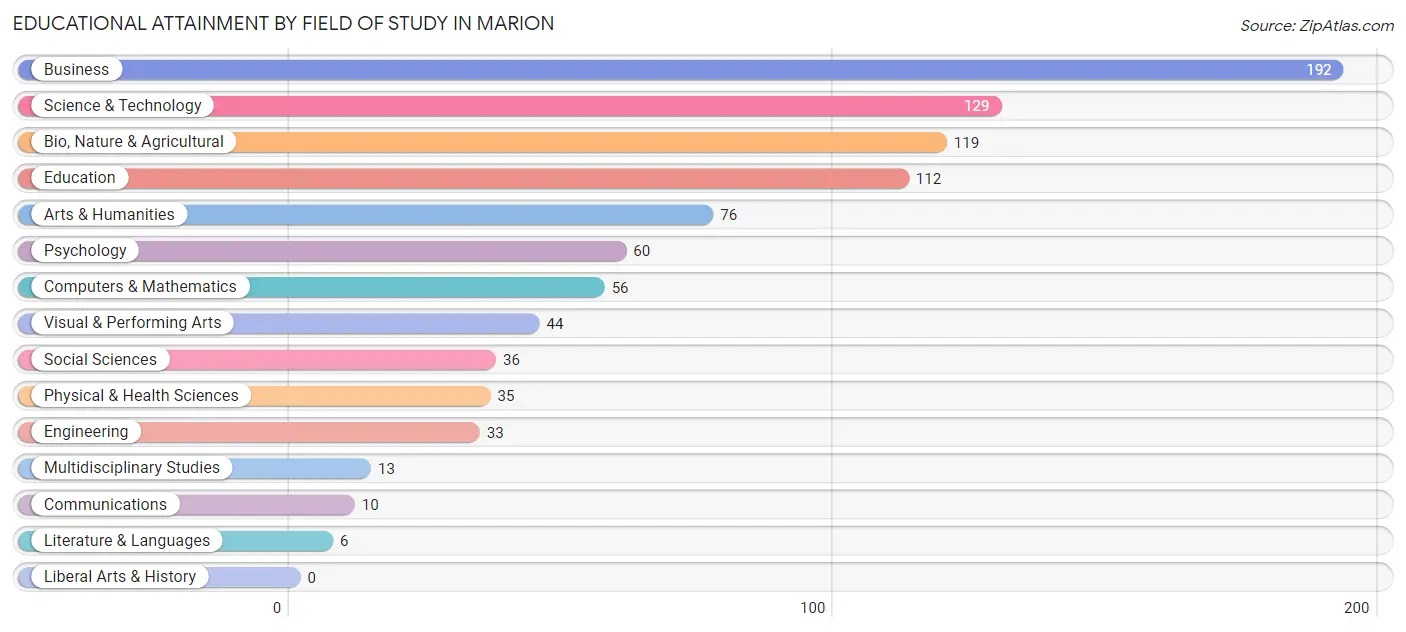
| Field of Study | # Graduates | % Graduates |
| Computers & Mathematics | 56 | 6.1% |
| Bio, Nature & Agricultural | 119 | 12.9% |
| Physical & Health Sciences | 35 | 3.8% |
| Psychology | 60 | 6.5% |
| Social Sciences | 36 | 3.9% |
| Engineering | 33 | 3.6% |
| Multidisciplinary Studies | 13 | 1.4% |
| Science & Technology | 129 | 14.0% |
| Business | 192 | 20.8% |
| Education | 112 | 12.2% |
| Literature & Languages | 6 | 0.6% |
| Liberal Arts & History | 0 | 0.0% |
| Visual & Performing Arts | 44 | 4.8% |
| Communications | 10 | 1.1% |
| Arts & Humanities | 76 | 8.3% |
| Total | 921 | 100.0% |
Transportation & Commute in Marion
Vehicle Availability by Sex in Marion
The most prevalent vehicle ownership categories in Marion are males with 2 vehicles (396, accounting for 38.2%) and females with 2 vehicles (390, making up 34.7%).
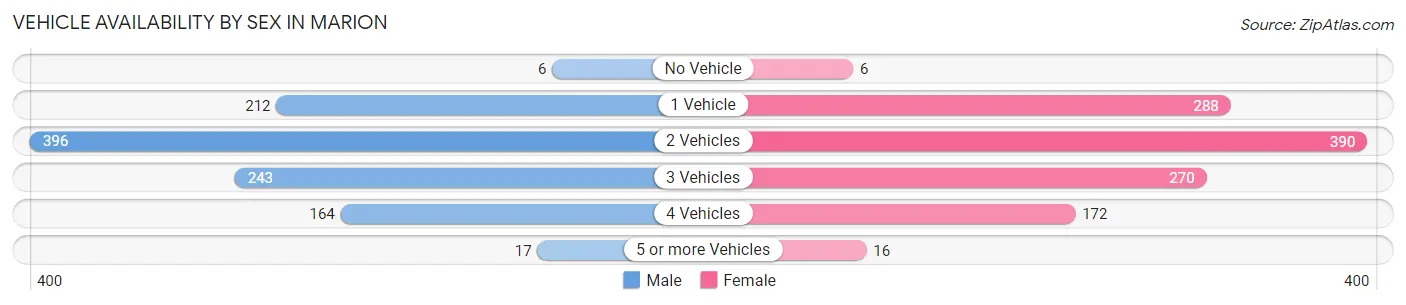
| Vehicles Available | Male | Female |
| No Vehicle | 6 (0.6%) | 6 (0.5%) |
| 1 Vehicle | 212 (20.4%) | 288 (25.2%) |
| 2 Vehicles | 396 (38.2%) | 390 (34.2%) |
| 3 Vehicles | 243 (23.4%) | 270 (23.6%) |
| 4 Vehicles | 164 (15.8%) | 172 (15.1%) |
| 5 or more Vehicles | 17 (1.6%) | 16 (1.4%) |
| Total | 1,038 (100.0%) | 1,142 (100.0%) |
Commute Time in Marion
The most frequently occuring commute durations in Marion are 5 to 9 minutes (720 commuters, 35.5%), 10 to 14 minutes (403 commuters, 19.9%), and 15 to 19 minutes (211 commuters, 10.4%).
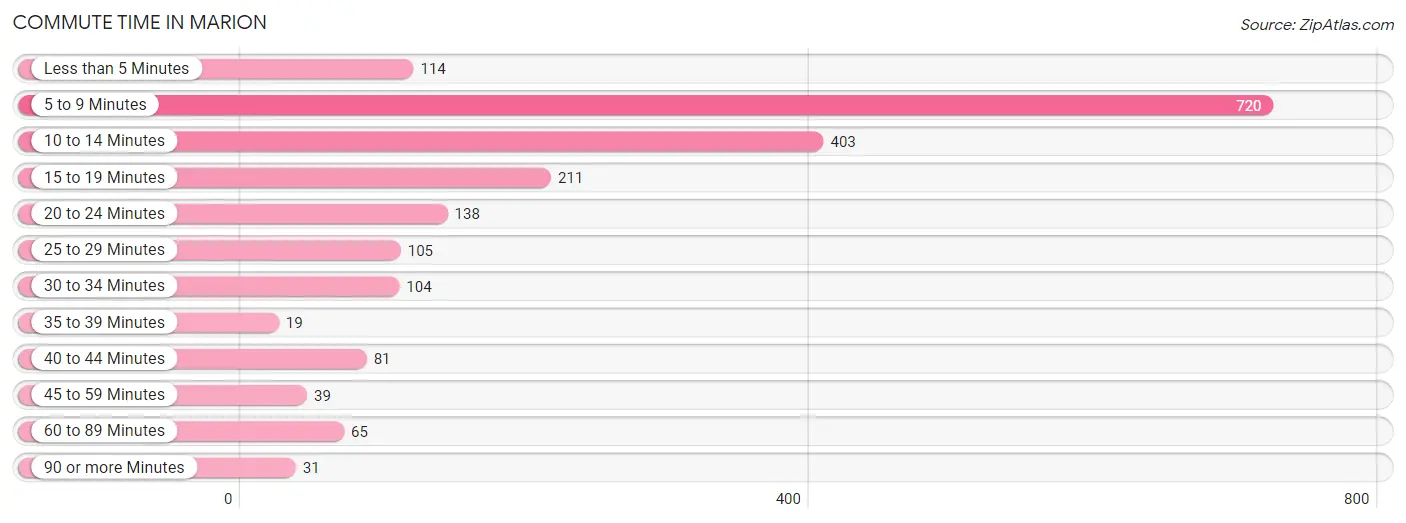
| Commute Time | # Commuters | % Commuters |
| Less than 5 Minutes | 114 | 5.6% |
| 5 to 9 Minutes | 720 | 35.5% |
| 10 to 14 Minutes | 403 | 19.9% |
| 15 to 19 Minutes | 211 | 10.4% |
| 20 to 24 Minutes | 138 | 6.8% |
| 25 to 29 Minutes | 105 | 5.2% |
| 30 to 34 Minutes | 104 | 5.1% |
| 35 to 39 Minutes | 19 | 0.9% |
| 40 to 44 Minutes | 81 | 4.0% |
| 45 to 59 Minutes | 39 | 1.9% |
| 60 to 89 Minutes | 65 | 3.2% |
| 90 or more Minutes | 31 | 1.5% |
Commute Time by Sex in Marion
The most common commute times in Marion are 5 to 9 minutes (258 commuters, 26.4%) for males and 5 to 9 minutes (462 commuters, 43.8%) for females.
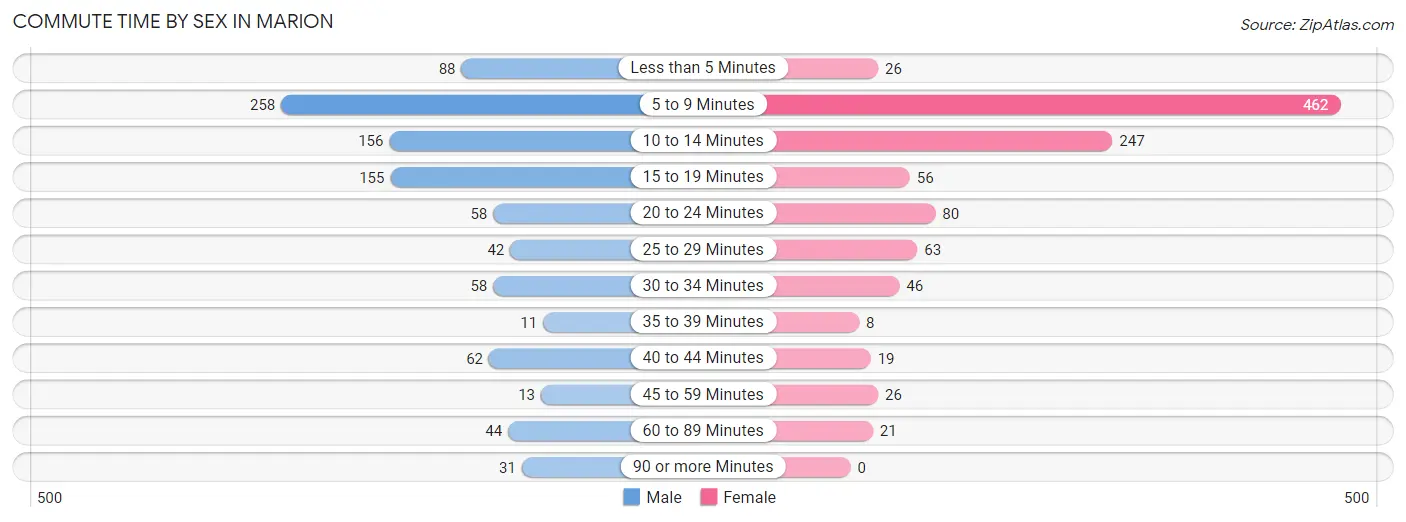
| Commute Time | Male | Female |
| Less than 5 Minutes | 88 (9.0%) | 26 (2.5%) |
| 5 to 9 Minutes | 258 (26.4%) | 462 (43.8%) |
| 10 to 14 Minutes | 156 (16.0%) | 247 (23.4%) |
| 15 to 19 Minutes | 155 (15.9%) | 56 (5.3%) |
| 20 to 24 Minutes | 58 (5.9%) | 80 (7.6%) |
| 25 to 29 Minutes | 42 (4.3%) | 63 (6.0%) |
| 30 to 34 Minutes | 58 (5.9%) | 46 (4.4%) |
| 35 to 39 Minutes | 11 (1.1%) | 8 (0.8%) |
| 40 to 44 Minutes | 62 (6.4%) | 19 (1.8%) |
| 45 to 59 Minutes | 13 (1.3%) | 26 (2.5%) |
| 60 to 89 Minutes | 44 (4.5%) | 21 (2.0%) |
| 90 or more Minutes | 31 (3.2%) | 0 (0.0%) |
Time of Departure to Work by Sex in Marion
The most frequent times of departure to work in Marion are 8:00 AM to 8:29 AM (223, 22.9%) for males and 8:00 AM to 8:29 AM (181, 17.2%) for females.
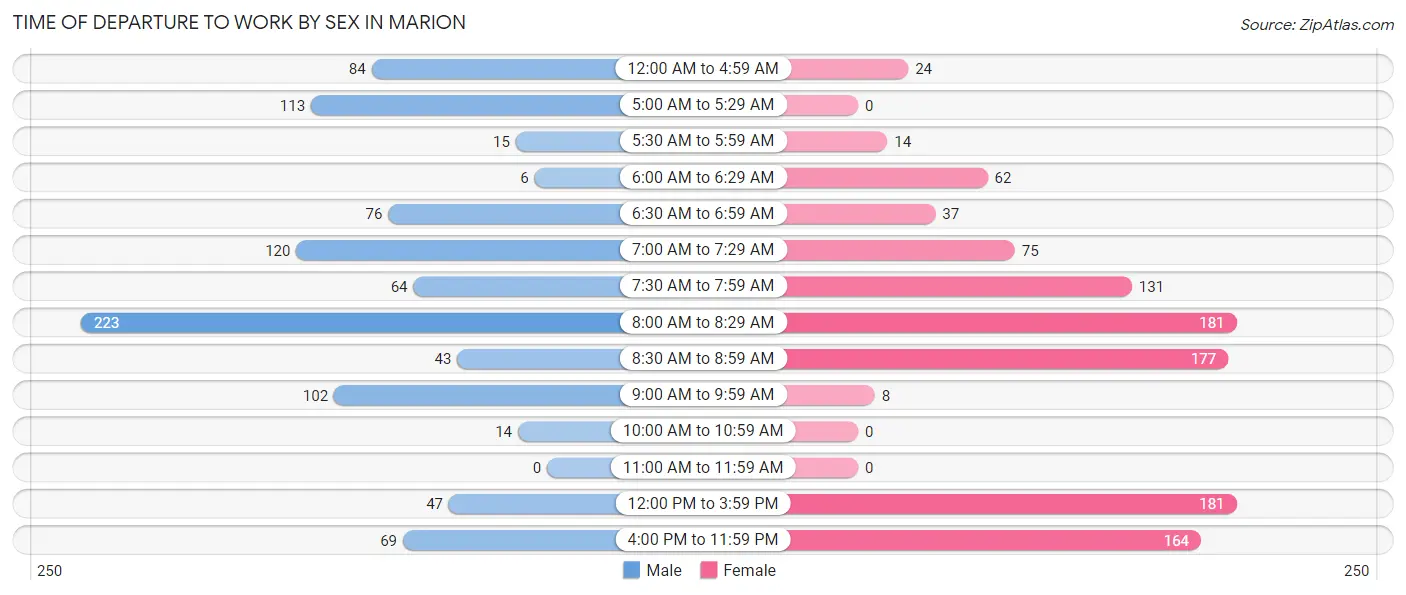
| Time of Departure | Male | Female |
| 12:00 AM to 4:59 AM | 84 (8.6%) | 24 (2.3%) |
| 5:00 AM to 5:29 AM | 113 (11.6%) | 0 (0.0%) |
| 5:30 AM to 5:59 AM | 15 (1.5%) | 14 (1.3%) |
| 6:00 AM to 6:29 AM | 6 (0.6%) | 62 (5.9%) |
| 6:30 AM to 6:59 AM | 76 (7.8%) | 37 (3.5%) |
| 7:00 AM to 7:29 AM | 120 (12.3%) | 75 (7.1%) |
| 7:30 AM to 7:59 AM | 64 (6.6%) | 131 (12.4%) |
| 8:00 AM to 8:29 AM | 223 (22.9%) | 181 (17.2%) |
| 8:30 AM to 8:59 AM | 43 (4.4%) | 177 (16.8%) |
| 9:00 AM to 9:59 AM | 102 (10.4%) | 8 (0.8%) |
| 10:00 AM to 10:59 AM | 14 (1.4%) | 0 (0.0%) |
| 11:00 AM to 11:59 AM | 0 (0.0%) | 0 (0.0%) |
| 12:00 PM to 3:59 PM | 47 (4.8%) | 181 (17.2%) |
| 4:00 PM to 11:59 PM | 69 (7.1%) | 164 (15.6%) |
| Total | 976 (100.0%) | 1,054 (100.0%) |
Housing Occupancy in Marion
Occupancy by Ownership in Marion
Of the total 2,385 dwellings in Marion, owner-occupied units account for 1,196 (50.1%), while renter-occupied units make up 1,189 (49.8%).
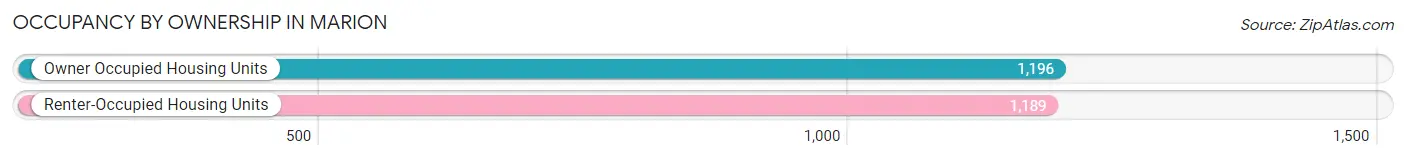
| Occupancy | # Housing Units | % Housing Units |
| Owner Occupied Housing Units | 1,196 | 50.1% |
| Renter-Occupied Housing Units | 1,189 | 49.8% |
| Total Occupied Housing Units | 2,385 | 100.0% |
Occupancy by Household Size in Marion
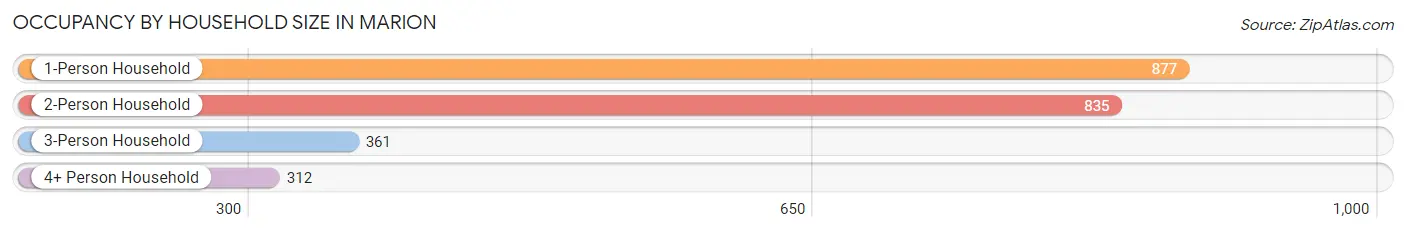
| Household Size | # Housing Units | % Housing Units |
| 1-Person Household | 877 | 36.8% |
| 2-Person Household | 835 | 35.0% |
| 3-Person Household | 361 | 15.1% |
| 4+ Person Household | 312 | 13.1% |
| Total Housing Units | 2,385 | 100.0% |
Occupancy by Ownership by Household Size in Marion
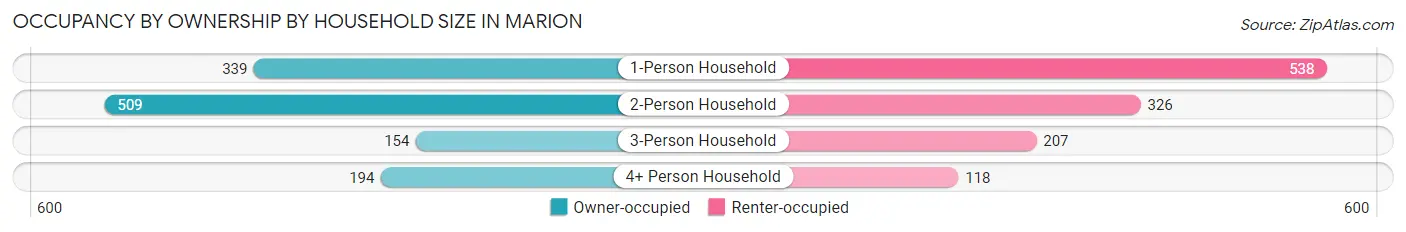
| Household Size | Owner-occupied | Renter-occupied |
| 1-Person Household | 339 (38.7%) | 538 (61.4%) |
| 2-Person Household | 509 (61.0%) | 326 (39.0%) |
| 3-Person Household | 154 (42.7%) | 207 (57.3%) |
| 4+ Person Household | 194 (62.2%) | 118 (37.8%) |
| Total Housing Units | 1,196 (50.1%) | 1,189 (49.8%) |
Occupancy by Educational Attainment in Marion
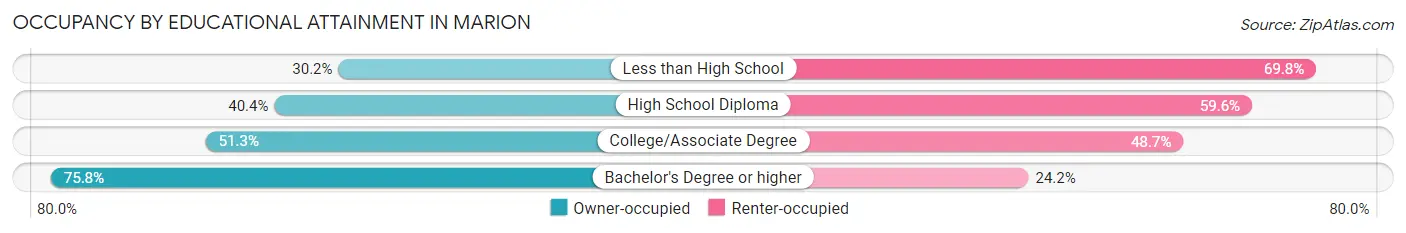
| Household Size | Owner-occupied | Renter-occupied |
| Less than High School | 104 (30.2%) | 240 (69.8%) |
| High School Diploma | 326 (40.4%) | 481 (59.6%) |
| College/Associate Degree | 355 (51.3%) | 337 (48.7%) |
| Bachelor's Degree or higher | 411 (75.8%) | 131 (24.2%) |
Occupancy by Age of Householder in Marion
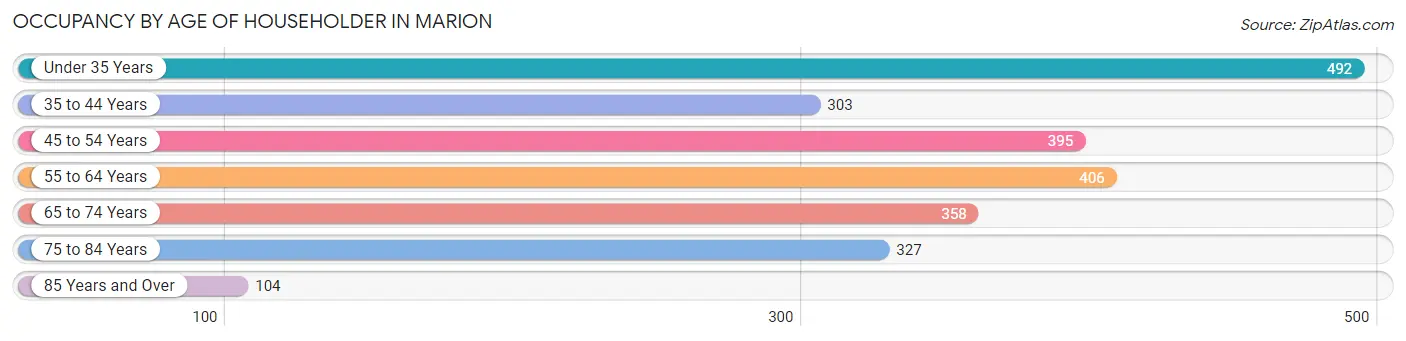
| Age Bracket | # Households | % Households |
| Under 35 Years | 492 | 20.6% |
| 35 to 44 Years | 303 | 12.7% |
| 45 to 54 Years | 395 | 16.6% |
| 55 to 64 Years | 406 | 17.0% |
| 65 to 74 Years | 358 | 15.0% |
| 75 to 84 Years | 327 | 13.7% |
| 85 Years and Over | 104 | 4.4% |
| Total | 2,385 | 100.0% |
Housing Finances in Marion
Median Income by Occupancy in Marion
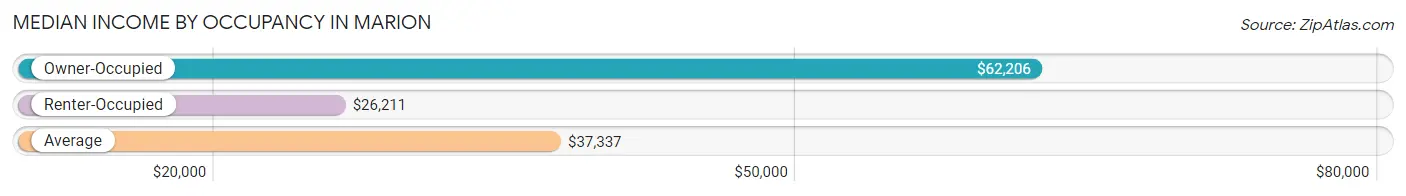
| Occupancy Type | # Households | Median Income |
| Owner-Occupied | 1,196 (50.1%) | $62,206 |
| Renter-Occupied | 1,189 (49.8%) | $26,211 |
| Average | 2,385 (100.0%) | $37,337 |
Occupancy by Householder Income Bracket in Marion
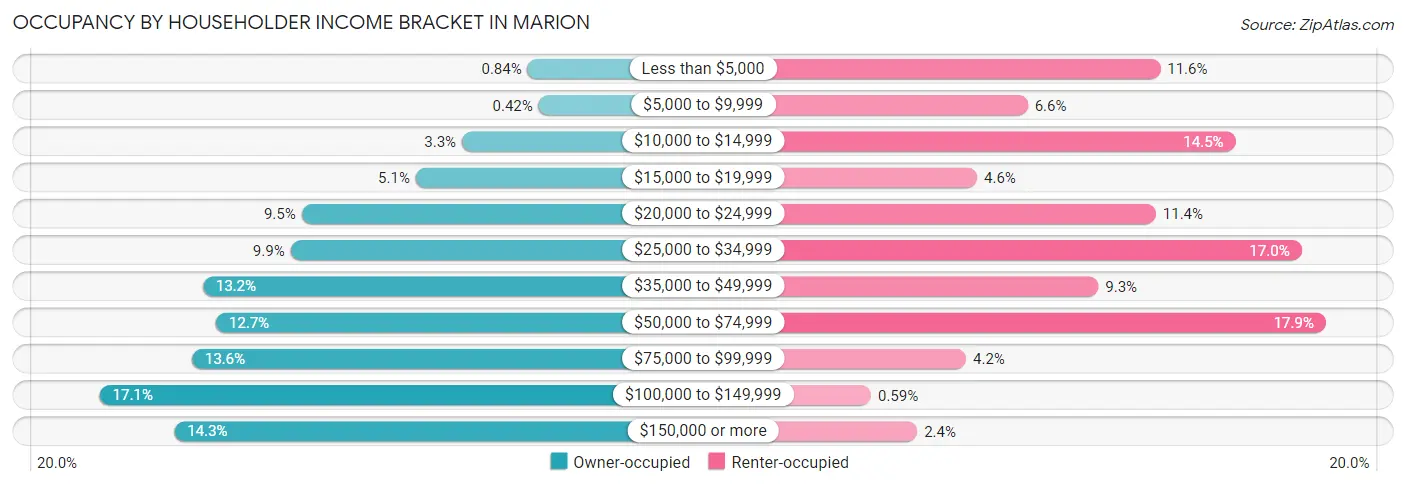
| Income Bracket | Owner-occupied | Renter-occupied |
| Less than $5,000 | 10 (0.8%) | 138 (11.6%) |
| $5,000 to $9,999 | 5 (0.4%) | 78 (6.6%) |
| $10,000 to $14,999 | 40 (3.3%) | 172 (14.5%) |
| $15,000 to $19,999 | 61 (5.1%) | 55 (4.6%) |
| $20,000 to $24,999 | 113 (9.5%) | 136 (11.4%) |
| $25,000 to $34,999 | 118 (9.9%) | 202 (17.0%) |
| $35,000 to $49,999 | 158 (13.2%) | 110 (9.2%) |
| $50,000 to $74,999 | 152 (12.7%) | 213 (17.9%) |
| $75,000 to $99,999 | 163 (13.6%) | 50 (4.2%) |
| $100,000 to $149,999 | 205 (17.1%) | 7 (0.6%) |
| $150,000 or more | 171 (14.3%) | 28 (2.4%) |
| Total | 1,196 (100.0%) | 1,189 (100.0%) |
Monthly Housing Cost Tiers in Marion
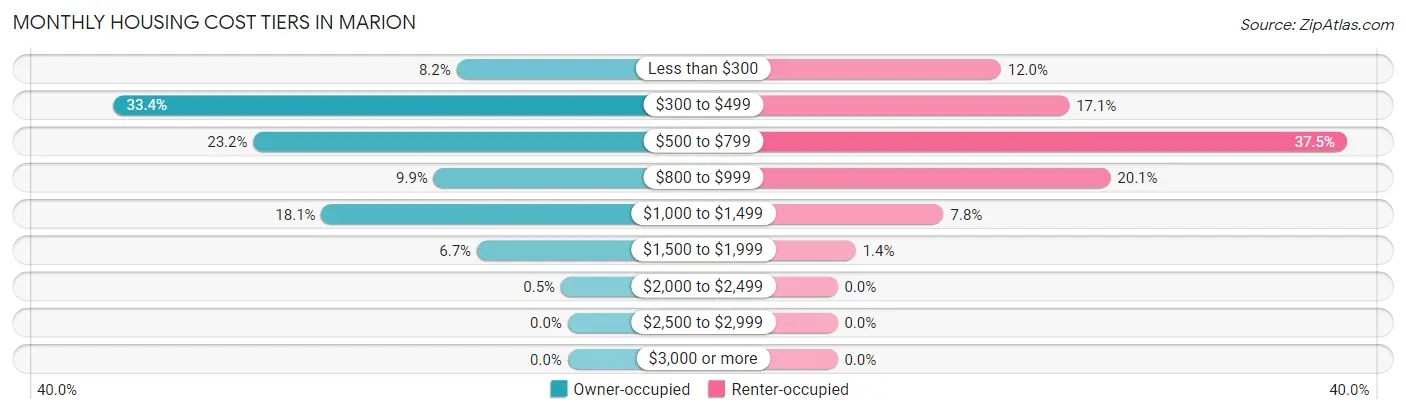
| Monthly Cost | Owner-occupied | Renter-occupied |
| Less than $300 | 98 (8.2%) | 143 (12.0%) |
| $300 to $499 | 400 (33.4%) | 203 (17.1%) |
| $500 to $799 | 277 (23.2%) | 446 (37.5%) |
| $800 to $999 | 118 (9.9%) | 239 (20.1%) |
| $1,000 to $1,499 | 217 (18.1%) | 93 (7.8%) |
| $1,500 to $1,999 | 80 (6.7%) | 16 (1.3%) |
| $2,000 to $2,499 | 6 (0.5%) | 0 (0.0%) |
| $2,500 to $2,999 | 0 (0.0%) | 0 (0.0%) |
| $3,000 or more | 0 (0.0%) | 0 (0.0%) |
| Total | 1,196 (100.0%) | 1,189 (100.0%) |
Physical Housing Characteristics in Marion
Housing Structures in Marion
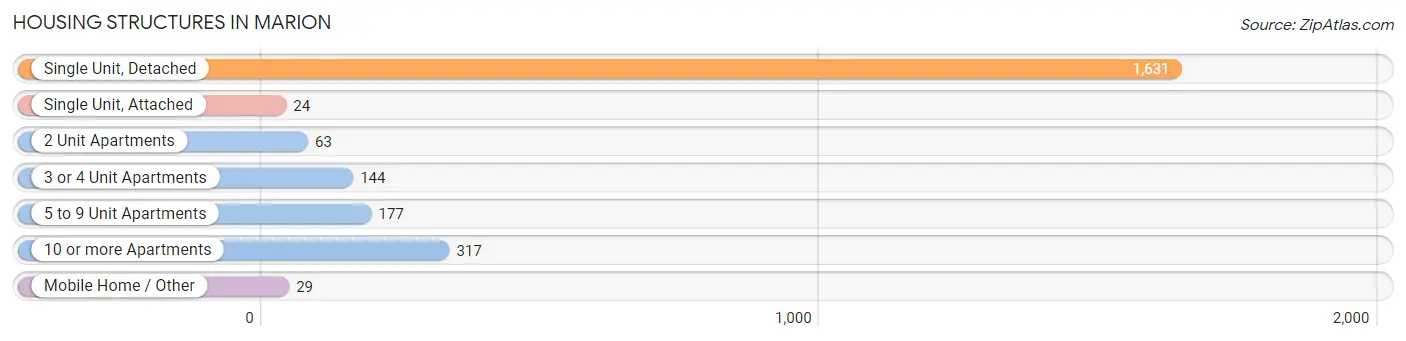
| Structure Type | # Housing Units | % Housing Units |
| Single Unit, Detached | 1,631 | 68.4% |
| Single Unit, Attached | 24 | 1.0% |
| 2 Unit Apartments | 63 | 2.6% |
| 3 or 4 Unit Apartments | 144 | 6.0% |
| 5 to 9 Unit Apartments | 177 | 7.4% |
| 10 or more Apartments | 317 | 13.3% |
| Mobile Home / Other | 29 | 1.2% |
| Total | 2,385 | 100.0% |
Housing Structures by Occupancy in Marion
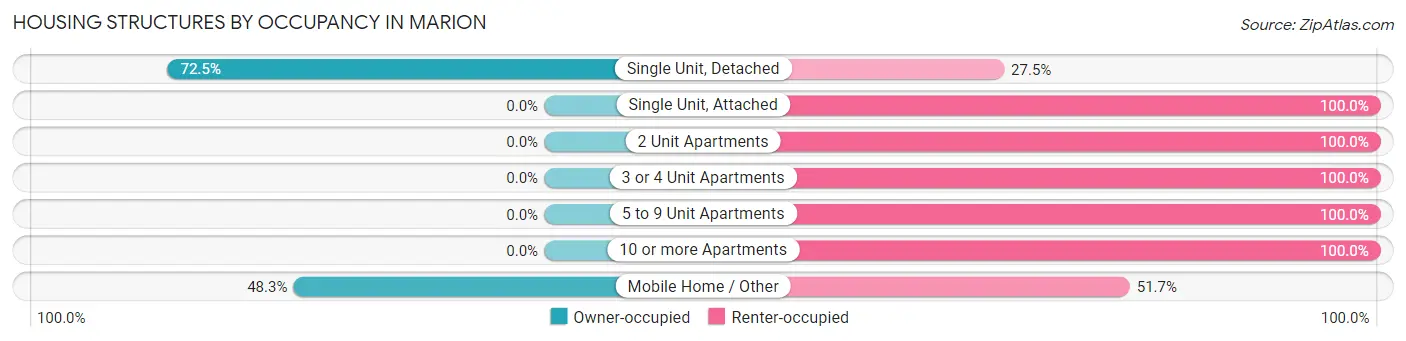
| Structure Type | Owner-occupied | Renter-occupied |
| Single Unit, Detached | 1,182 (72.5%) | 449 (27.5%) |
| Single Unit, Attached | 0 (0.0%) | 24 (100.0%) |
| 2 Unit Apartments | 0 (0.0%) | 63 (100.0%) |
| 3 or 4 Unit Apartments | 0 (0.0%) | 144 (100.0%) |
| 5 to 9 Unit Apartments | 0 (0.0%) | 177 (100.0%) |
| 10 or more Apartments | 0 (0.0%) | 317 (100.0%) |
| Mobile Home / Other | 14 (48.3%) | 15 (51.7%) |
| Total | 1,196 (50.1%) | 1,189 (49.8%) |
Housing Structures by Number of Rooms in Marion
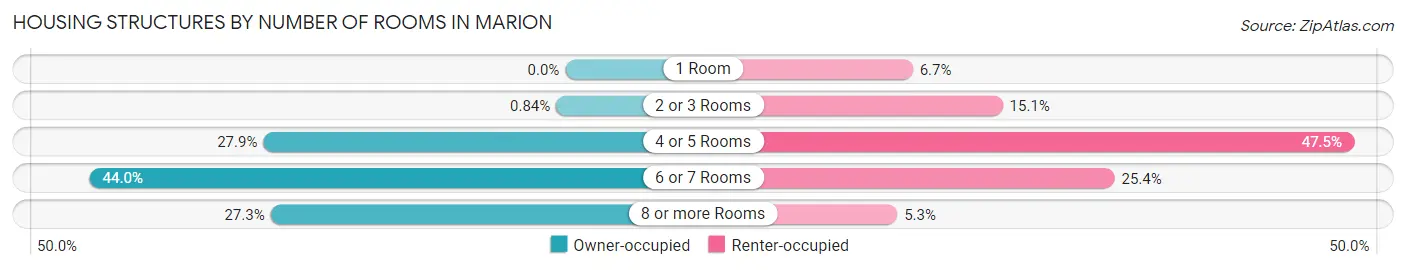
| Number of Rooms | Owner-occupied | Renter-occupied |
| 1 Room | 0 (0.0%) | 80 (6.7%) |
| 2 or 3 Rooms | 10 (0.8%) | 179 (15.0%) |
| 4 or 5 Rooms | 334 (27.9%) | 565 (47.5%) |
| 6 or 7 Rooms | 526 (44.0%) | 302 (25.4%) |
| 8 or more Rooms | 326 (27.3%) | 63 (5.3%) |
| Total | 1,196 (100.0%) | 1,189 (100.0%) |
Housing Structure by Heating Type in Marion
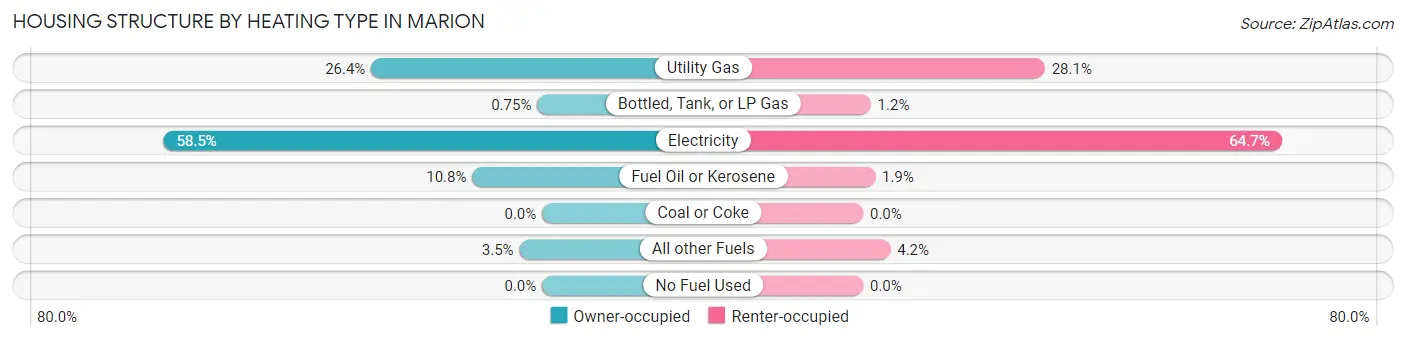
| Heating Type | Owner-occupied | Renter-occupied |
| Utility Gas | 316 (26.4%) | 334 (28.1%) |
| Bottled, Tank, or LP Gas | 9 (0.7%) | 14 (1.2%) |
| Electricity | 700 (58.5%) | 769 (64.7%) |
| Fuel Oil or Kerosene | 129 (10.8%) | 22 (1.8%) |
| Coal or Coke | 0 (0.0%) | 0 (0.0%) |
| All other Fuels | 42 (3.5%) | 50 (4.2%) |
| No Fuel Used | 0 (0.0%) | 0 (0.0%) |
| Total | 1,196 (100.0%) | 1,189 (100.0%) |
Household Vehicle Usage in Marion
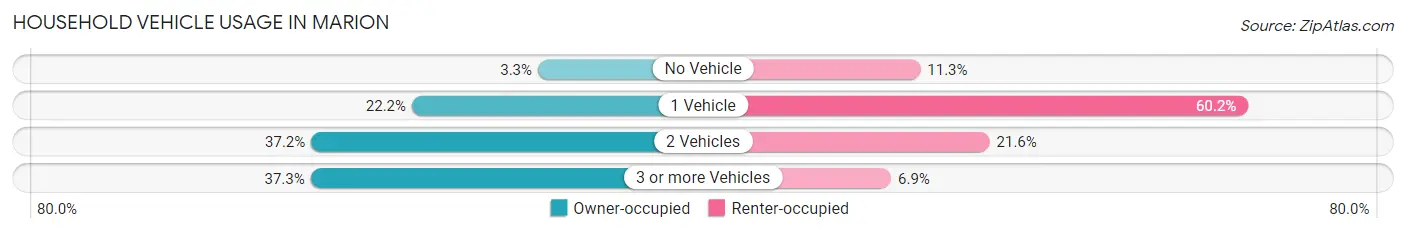
| Vehicles per Household | Owner-occupied | Renter-occupied |
| No Vehicle | 40 (3.3%) | 134 (11.3%) |
| 1 Vehicle | 265 (22.2%) | 716 (60.2%) |
| 2 Vehicles | 445 (37.2%) | 257 (21.6%) |
| 3 or more Vehicles | 446 (37.3%) | 82 (6.9%) |
| Total | 1,196 (100.0%) | 1,189 (100.0%) |
Real Estate & Mortgages in Marion
Real Estate and Mortgage Overview in Marion
| Characteristic | Without Mortgage | With Mortgage |
| Housing Units | 618 | 578 |
| Median Property Value | $166,800 | $138,900 |
| Median Household Income | $47,500 | $90 |
| Monthly Housing Costs | $391 | $0 |
| Real Estate Taxes | $921 | $17 |
Property Value by Mortgage Status in Marion
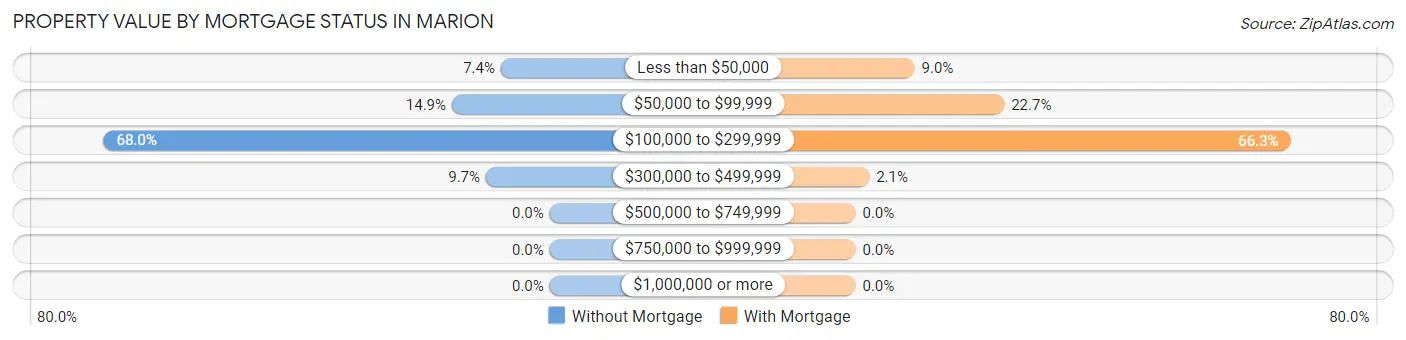
| Property Value | Without Mortgage | With Mortgage |
| Less than $50,000 | 46 (7.4%) | 52 (9.0%) |
| $50,000 to $99,999 | 92 (14.9%) | 131 (22.7%) |
| $100,000 to $299,999 | 420 (68.0%) | 383 (66.3%) |
| $300,000 to $499,999 | 60 (9.7%) | 12 (2.1%) |
| $500,000 to $749,999 | 0 (0.0%) | 0 (0.0%) |
| $750,000 to $999,999 | 0 (0.0%) | 0 (0.0%) |
| $1,000,000 or more | 0 (0.0%) | 0 (0.0%) |
| Total | 618 (100.0%) | 578 (100.0%) |
Household Income by Mortgage Status in Marion
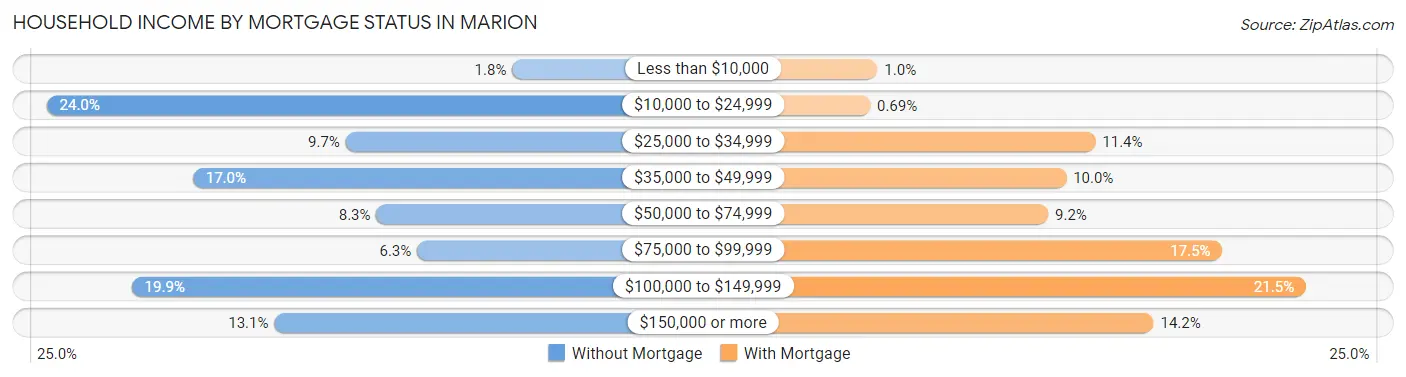
| Household Income | Without Mortgage | With Mortgage |
| Less than $10,000 | 11 (1.8%) | 6 (1.0%) |
| $10,000 to $24,999 | 148 (23.9%) | 4 (0.7%) |
| $25,000 to $34,999 | 60 (9.7%) | 66 (11.4%) |
| $35,000 to $49,999 | 105 (17.0%) | 58 (10.0%) |
| $50,000 to $74,999 | 51 (8.3%) | 53 (9.2%) |
| $75,000 to $99,999 | 39 (6.3%) | 101 (17.5%) |
| $100,000 to $149,999 | 123 (19.9%) | 124 (21.4%) |
| $150,000 or more | 81 (13.1%) | 82 (14.2%) |
| Total | 618 (100.0%) | 578 (100.0%) |
Property Value to Household Income Ratio in Marion
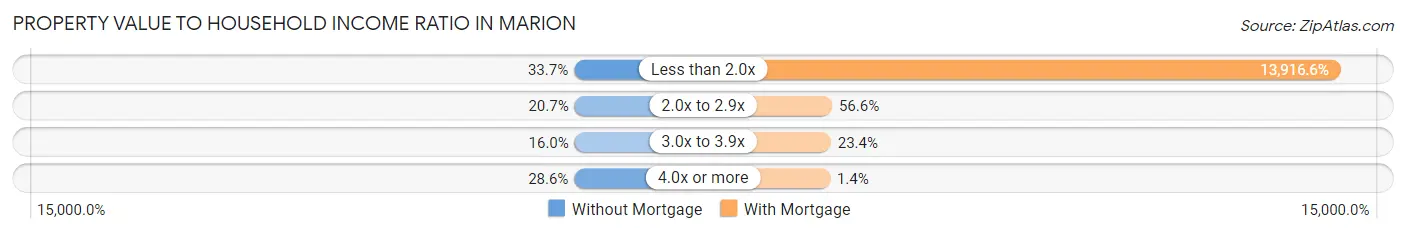
| Value-to-Income Ratio | Without Mortgage | With Mortgage |
| Less than 2.0x | 208 (33.7%) | 80,438 (13,916.6%) |
| 2.0x to 2.9x | 128 (20.7%) | 327 (56.6%) |
| 3.0x to 3.9x | 99 (16.0%) | 135 (23.4%) |
| 4.0x or more | 177 (28.6%) | 8 (1.4%) |
| Total | 618 (100.0%) | 578 (100.0%) |
Real Estate Taxes by Mortgage Status in Marion
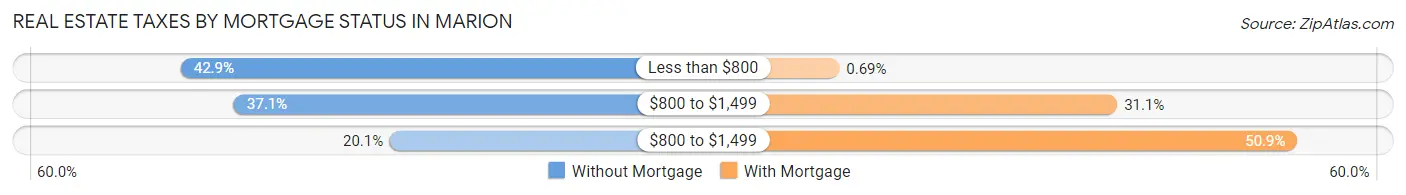
| Property Taxes | Without Mortgage | With Mortgage |
| Less than $800 | 265 (42.9%) | 4 (0.7%) |
| $800 to $1,499 | 229 (37.1%) | 180 (31.1%) |
| $800 to $1,499 | 124 (20.1%) | 294 (50.9%) |
| Total | 618 (100.0%) | 578 (100.0%) |
Health & Disability in Marion
Health Insurance Coverage by Age in Marion
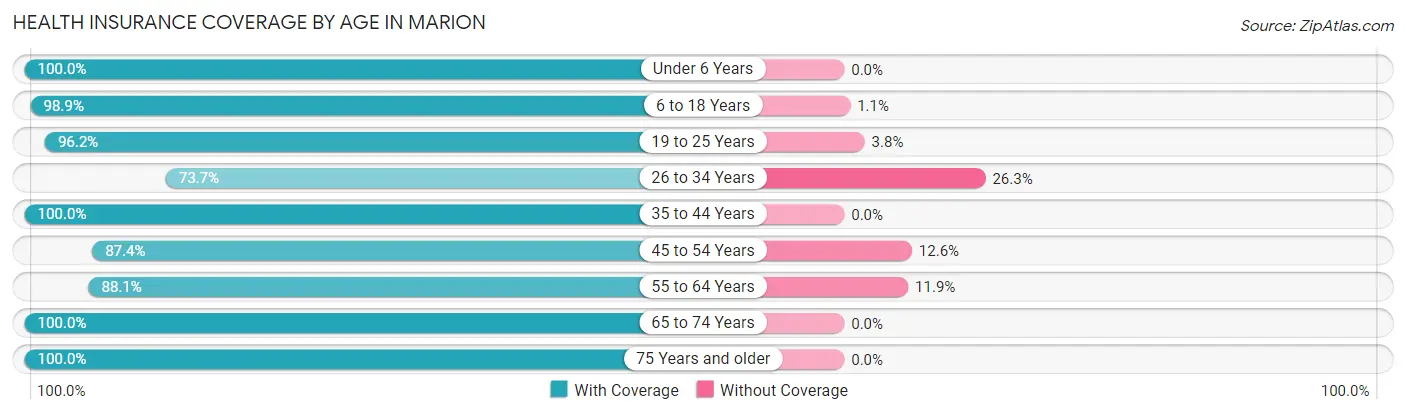
| Age Bracket | With Coverage | Without Coverage |
| Under 6 Years | 204 (100.0%) | 0 (0.0%) |
| 6 to 18 Years | 896 (98.9%) | 10 (1.1%) |
| 19 to 25 Years | 506 (96.2%) | 20 (3.8%) |
| 26 to 34 Years | 456 (73.7%) | 163 (26.3%) |
| 35 to 44 Years | 508 (100.0%) | 0 (0.0%) |
| 45 to 54 Years | 714 (87.4%) | 103 (12.6%) |
| 55 to 64 Years | 540 (88.1%) | 73 (11.9%) |
| 65 to 74 Years | 473 (100.0%) | 0 (0.0%) |
| 75 Years and older | 603 (100.0%) | 0 (0.0%) |
| Total | 4,900 (93.0%) | 369 (7.0%) |
Health Insurance Coverage by Citizenship Status in Marion
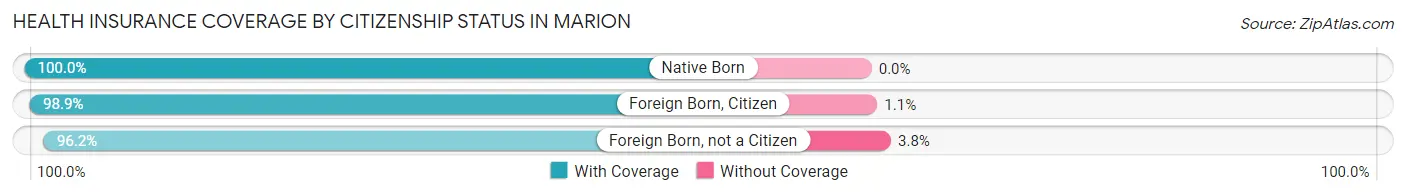
| Citizenship Status | With Coverage | Without Coverage |
| Native Born | 204 (100.0%) | 0 (0.0%) |
| Foreign Born, Citizen | 896 (98.9%) | 10 (1.1%) |
| Foreign Born, not a Citizen | 506 (96.2%) | 20 (3.8%) |
Health Insurance Coverage by Household Income in Marion
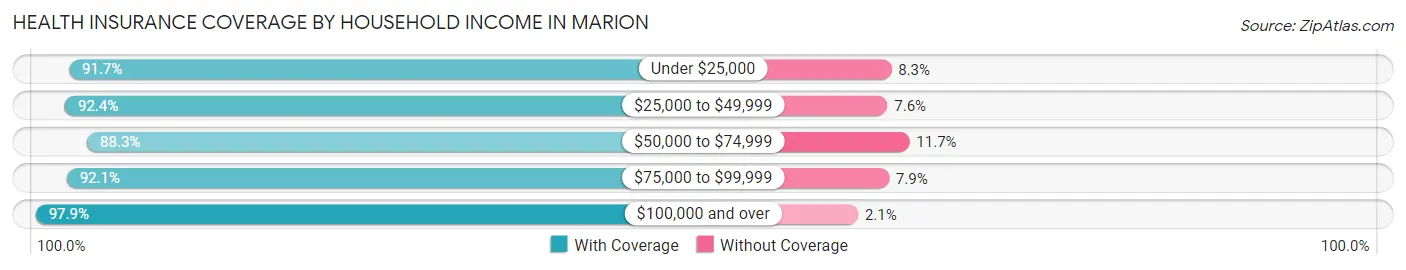
| Household Income | With Coverage | Without Coverage |
| Under $25,000 | 1,188 (91.7%) | 108 (8.3%) |
| $25,000 to $49,999 | 949 (92.4%) | 78 (7.6%) |
| $50,000 to $74,999 | 798 (88.3%) | 106 (11.7%) |
| $75,000 to $99,999 | 560 (92.1%) | 48 (7.9%) |
| $100,000 and over | 1,359 (97.9%) | 29 (2.1%) |
Public vs Private Health Insurance Coverage by Age in Marion
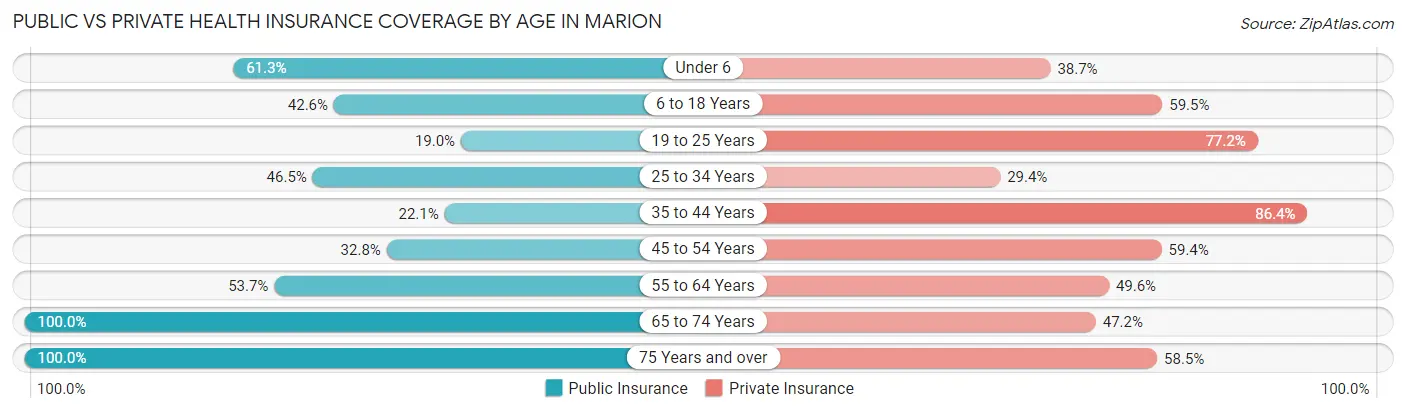
| Age Bracket | Public Insurance | Private Insurance |
| Under 6 | 125 (61.3%) | 79 (38.7%) |
| 6 to 18 Years | 386 (42.6%) | 539 (59.5%) |
| 19 to 25 Years | 100 (19.0%) | 406 (77.2%) |
| 25 to 34 Years | 288 (46.5%) | 182 (29.4%) |
| 35 to 44 Years | 112 (22.1%) | 439 (86.4%) |
| 45 to 54 Years | 268 (32.8%) | 485 (59.4%) |
| 55 to 64 Years | 329 (53.7%) | 304 (49.6%) |
| 65 to 74 Years | 473 (100.0%) | 223 (47.1%) |
| 75 Years and over | 603 (100.0%) | 353 (58.5%) |
| Total | 2,684 (50.9%) | 3,010 (57.1%) |
Disability Status by Sex by Age in Marion
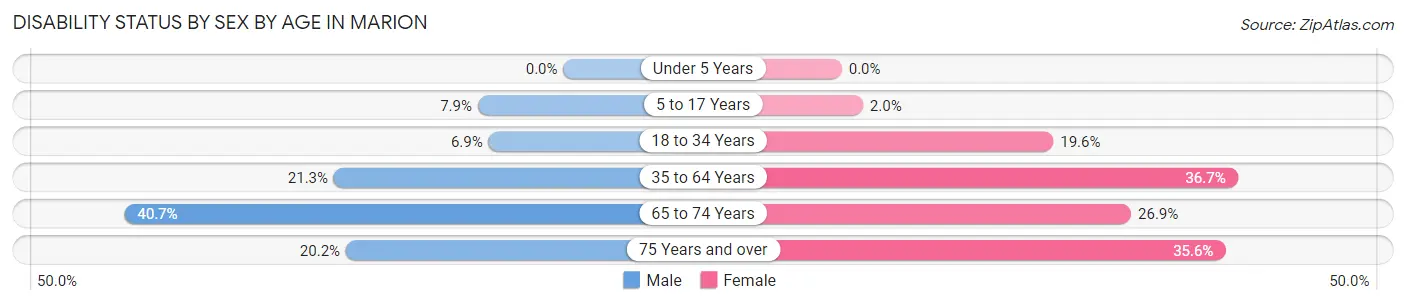
| Age Bracket | Male | Female |
| Under 5 Years | 0 (0.0%) | 0 (0.0%) |
| 5 to 17 Years | 37 (7.9%) | 8 (2.0%) |
| 18 to 34 Years | 36 (6.9%) | 129 (19.6%) |
| 35 to 64 Years | 197 (21.3%) | 372 (36.7%) |
| 65 to 74 Years | 88 (40.7%) | 69 (26.9%) |
| 75 Years and over | 44 (20.2%) | 137 (35.6%) |
Disability Class by Sex by Age in Marion
Disability Class: Hearing Difficulty
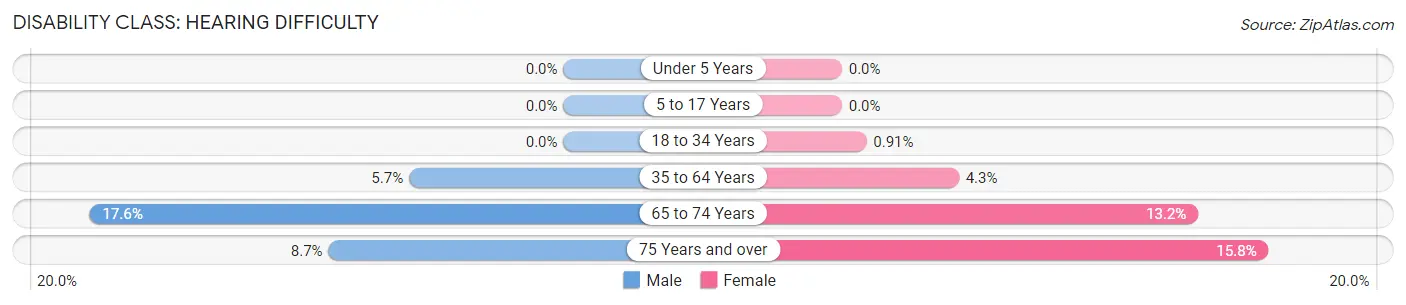
| Age Bracket | Male | Female |
| Under 5 Years | 0 (0.0%) | 0 (0.0%) |
| 5 to 17 Years | 0 (0.0%) | 0 (0.0%) |
| 18 to 34 Years | 0 (0.0%) | 6 (0.9%) |
| 35 to 64 Years | 53 (5.7%) | 44 (4.3%) |
| 65 to 74 Years | 38 (17.6%) | 34 (13.2%) |
| 75 Years and over | 19 (8.7%) | 61 (15.8%) |
Disability Class: Vision Difficulty
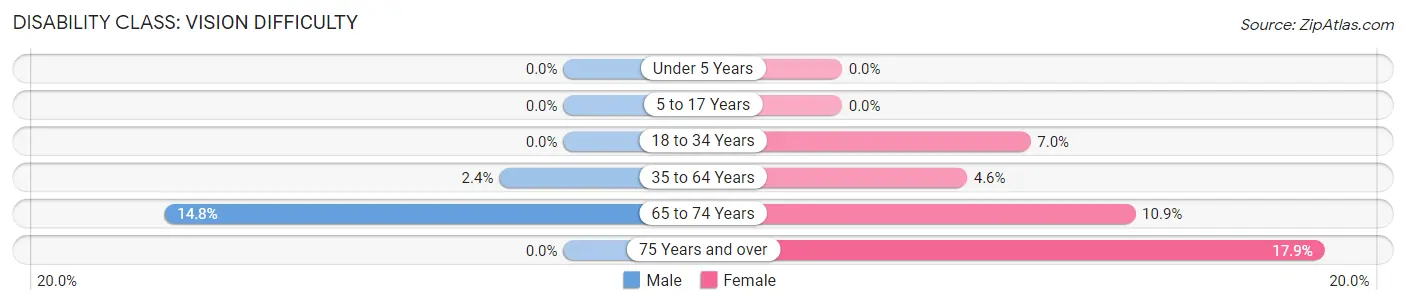
| Age Bracket | Male | Female |
| Under 5 Years | 0 (0.0%) | 0 (0.0%) |
| 5 to 17 Years | 0 (0.0%) | 0 (0.0%) |
| 18 to 34 Years | 0 (0.0%) | 46 (7.0%) |
| 35 to 64 Years | 22 (2.4%) | 47 (4.6%) |
| 65 to 74 Years | 32 (14.8%) | 28 (10.9%) |
| 75 Years and over | 0 (0.0%) | 69 (17.9%) |
Disability Class: Cognitive Difficulty
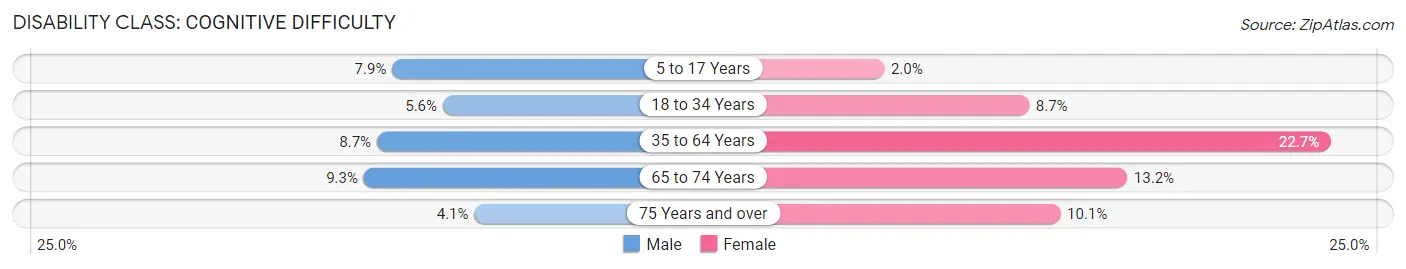
| Age Bracket | Male | Female |
| 5 to 17 Years | 37 (7.9%) | 8 (2.0%) |
| 18 to 34 Years | 29 (5.6%) | 57 (8.7%) |
| 35 to 64 Years | 80 (8.6%) | 230 (22.7%) |
| 65 to 74 Years | 20 (9.3%) | 34 (13.2%) |
| 75 Years and over | 9 (4.1%) | 39 (10.1%) |
Disability Class: Ambulatory Difficulty
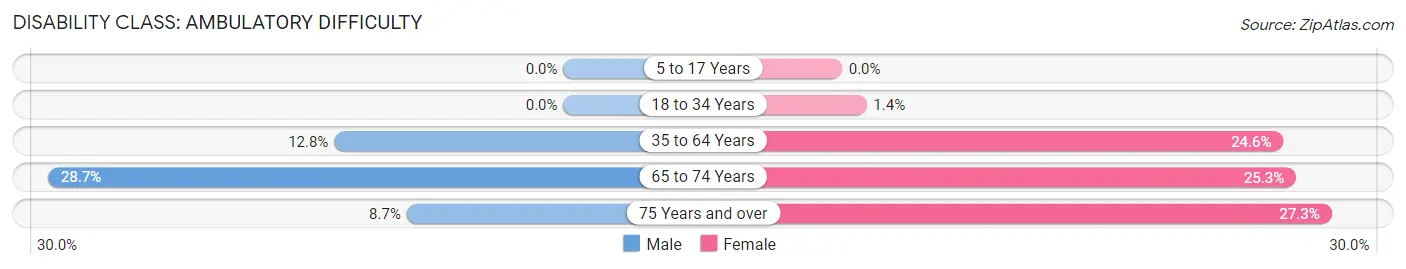
| Age Bracket | Male | Female |
| 5 to 17 Years | 0 (0.0%) | 0 (0.0%) |
| 18 to 34 Years | 0 (0.0%) | 9 (1.4%) |
| 35 to 64 Years | 118 (12.8%) | 249 (24.6%) |
| 65 to 74 Years | 62 (28.7%) | 65 (25.3%) |
| 75 Years and over | 19 (8.7%) | 105 (27.3%) |
Disability Class: Self-Care Difficulty
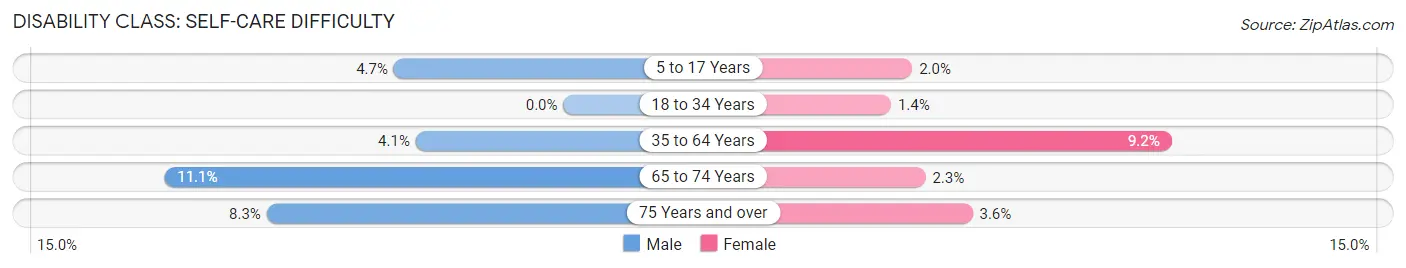
| Age Bracket | Male | Female |
| 5 to 17 Years | 22 (4.7%) | 8 (2.0%) |
| 18 to 34 Years | 0 (0.0%) | 9 (1.4%) |
| 35 to 64 Years | 38 (4.1%) | 93 (9.2%) |
| 65 to 74 Years | 24 (11.1%) | 6 (2.3%) |
| 75 Years and over | 18 (8.3%) | 14 (3.6%) |
Technology Access in Marion
Computing Device Access in Marion
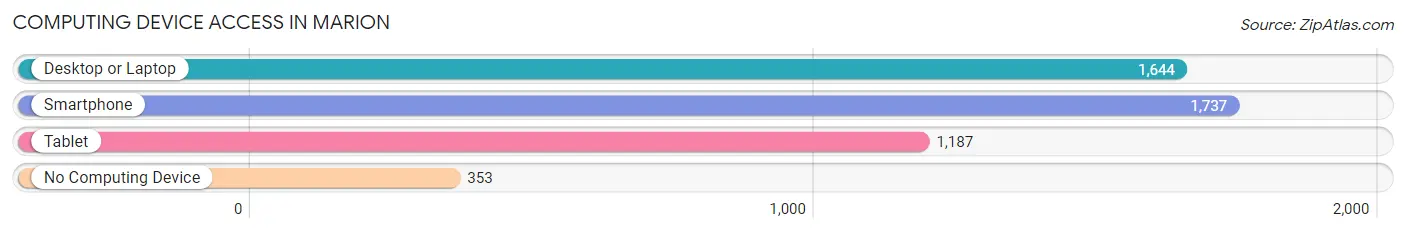
| Device Type | # Households | % Households |
| Desktop or Laptop | 1,644 | 68.9% |
| Smartphone | 1,737 | 72.8% |
| Tablet | 1,187 | 49.8% |
| No Computing Device | 353 | 14.8% |
| Total | 2,385 | 100.0% |
Internet Access in Marion
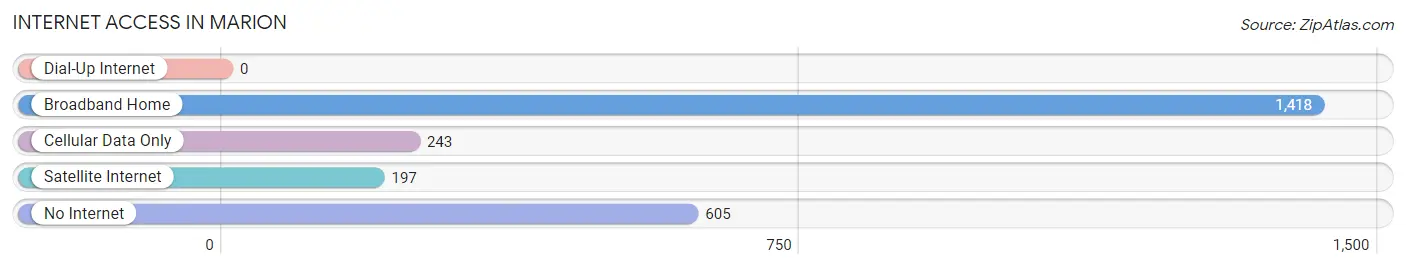
| Internet Type | # Households | % Households |
| Dial-Up Internet | 0 | 0.0% |
| Broadband Home | 1,418 | 59.5% |
| Cellular Data Only | 243 | 10.2% |
| Satellite Internet | 197 | 8.3% |
| No Internet | 605 | 25.4% |
| Total | 2,385 | 100.0% |
Marion Summary
Marion, Virginia is a small town located in Smyth County, in the southwestern part of the state. It is situated in the Appalachian Mountains, and is part of the Appalachian Regional Commission. The town was founded in 1799, and was named after Francis Marion, a Revolutionary War hero. The town has a population of 5,068, according to the 2010 census.
Geography
Marion is located in the Appalachian Mountains, and is part of the Appalachian Regional Commission. The town is situated in the valley of the North Fork of the Holston River, and is surrounded by the Blue Ridge Mountains. The town is located at an elevation of 1,890 feet above sea level. The town is located in the Eastern Time Zone, and is about a two-hour drive from the state capital of Richmond.
Economy
Marion’s economy is largely based on agriculture and manufacturing. The town is home to several large manufacturing companies, including General Electric, which produces electrical components, and the Marion Manufacturing Company, which produces furniture. The town is also home to several small businesses, including restaurants, retail stores, and service providers.
The town is also home to several educational institutions, including the University of Virginia’s College at Wise, which offers undergraduate and graduate degrees. The town is also home to the Smyth County Community College, which offers associate degrees and certificate programs.
Demographics
According to the 2010 census, the population of Marion was 5,068. The racial makeup of the town was 95.3% White, 1.7% African American, 0.3% Native American, 0.3% Asian, 0.1% Pacific Islander, 0.7% from other races, and 1.9% from two or more races. Hispanic or Latino of any race were 2.2% of the population.
The median income for a household in the town was $30,938, and the median income for a family was $37,917. The per capita income for the town was $17,845. About 17.2% of families and 20.2% of the population were below the poverty line, including 28.2% of those under age 18 and 14.2% of those age 65 or over.
Marion is a small town with a rich history and a diverse economy. The town is home to several large manufacturing companies, as well as small businesses and educational institutions. The town has a population of 5,068, and the median income for a household is $30,938. The town is part of the Appalachian Regional Commission, and is located in the Eastern Time Zone.
Common Questions
What is Per Capita Income in Marion?
Per Capita income in Marion is $26,766.
What is the Median Family Income in Marion?
Median Family Income in Marion is $57,798.
What is the Median Household income in Marion?
Median Household Income in Marion is $37,337.
What is Income or Wage Gap in Marion?
Income or Wage Gap in Marion is 29.5%.
Women in Marion earn 70.5 cents for every dollar earned by a man.
What is Inequality or Gini Index in Marion?
Inequality or Gini Index in Marion is 0.50.
What is the Total Population of Marion?
Total Population of Marion is 5,722.
What is the Total Male Population of Marion?
Total Male Population of Marion is 2,728.
What is the Total Female Population of Marion?
Total Female Population of Marion is 2,994.
What is the Ratio of Males per 100 Females in Marion?
There are 91.12 Males per 100 Females in Marion.
What is the Ratio of Females per 100 Males in Marion?
There are 109.75 Females per 100 Males in Marion.
What is the Median Population Age in Marion?
Median Population Age in Marion is 44.3 Years.
What is the Average Family Size in Marion
Average Family Size in Marion is 2.8 People.
What is the Average Household Size in Marion
Average Household Size in Marion is 2.2 People.
How Large is the Labor Force in Marion?
There are 2,393 People in the Labor Forcein in Marion.
What is the Percentage of People in the Labor Force in Marion?
49.5% of People are in the Labor Force in Marion.
What is the Unemployment Rate in Marion?
Unemployment Rate in Marion is 5.1%.