Mappsville, VA Map & Demographics
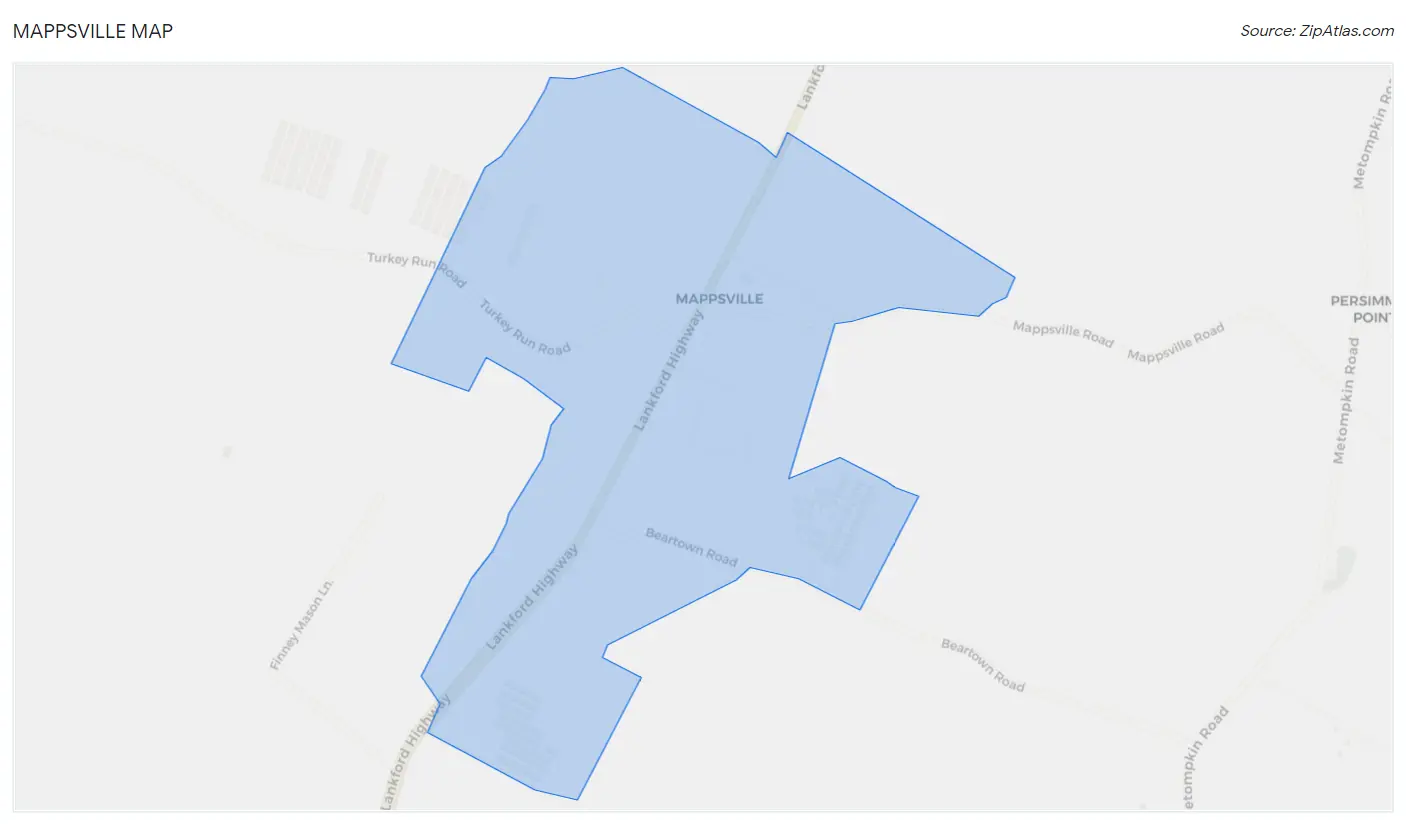
Mappsville Map
Mappsville Overview
$21,169
PER CAPITA INCOME
$65,463
AVG FAMILY INCOME
$65,463
AVG HOUSEHOLD INCOME
0.34
INEQUALITY / GINI INDEX
445
TOTAL POPULATION
267
MALE POPULATION
178
FEMALE POPULATION
150.00
MALES / 100 FEMALES
66.67
FEMALES / 100 MALES
55.1
MEDIAN AGE
2.5
AVG FAMILY SIZE
2.5
AVG HOUSEHOLD SIZE
353
LABOR FORCE [ PEOPLE ]
88.9%
PERCENT IN LABOR FORCE
Mappsville Zip Codes
Mappsville Area Codes
Income in Mappsville
Income Overview in Mappsville
Per Capita Income in Mappsville is $21,169, while median incomes of families and households are $65,463 and $65,463 respectively.
| Characteristic | Number | Measure |
| Per Capita Income | 445 | $21,169 |
| Median Family Income | 178 | $65,463 |
| Mean Family Income | 178 | $58,016 |
| Median Household Income | 178 | $65,463 |
| Mean Household Income | 178 | $58,016 |
| Income Deficit | 178 | $0 |
| Wage / Income Gap (%) | 445 | 0.00% |
| Wage / Income Gap ($) | 445 | 100.00¢ per $1 |
| Gini / Inequality Index | 445 | 0.34 |
Earnings by Sex in Mappsville
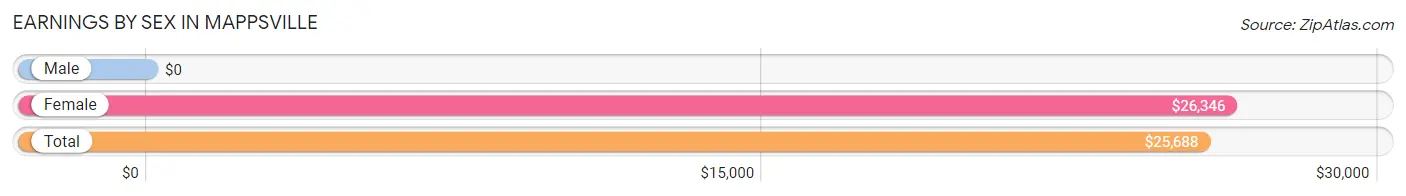
| Sex | Number | Average Earnings |
| Male | 175 (49.6%) | $0 |
| Female | 178 (50.4%) | $26,346 |
| Total | 353 (100.0%) | $25,688 |
Earnings by Sex by Income Bracket in Mappsville
The most common earnings brackets in Mappsville are $2,499 or less for men (58 | 33.1%) and $25,000 to $29,999 for women (65 | 36.5%).
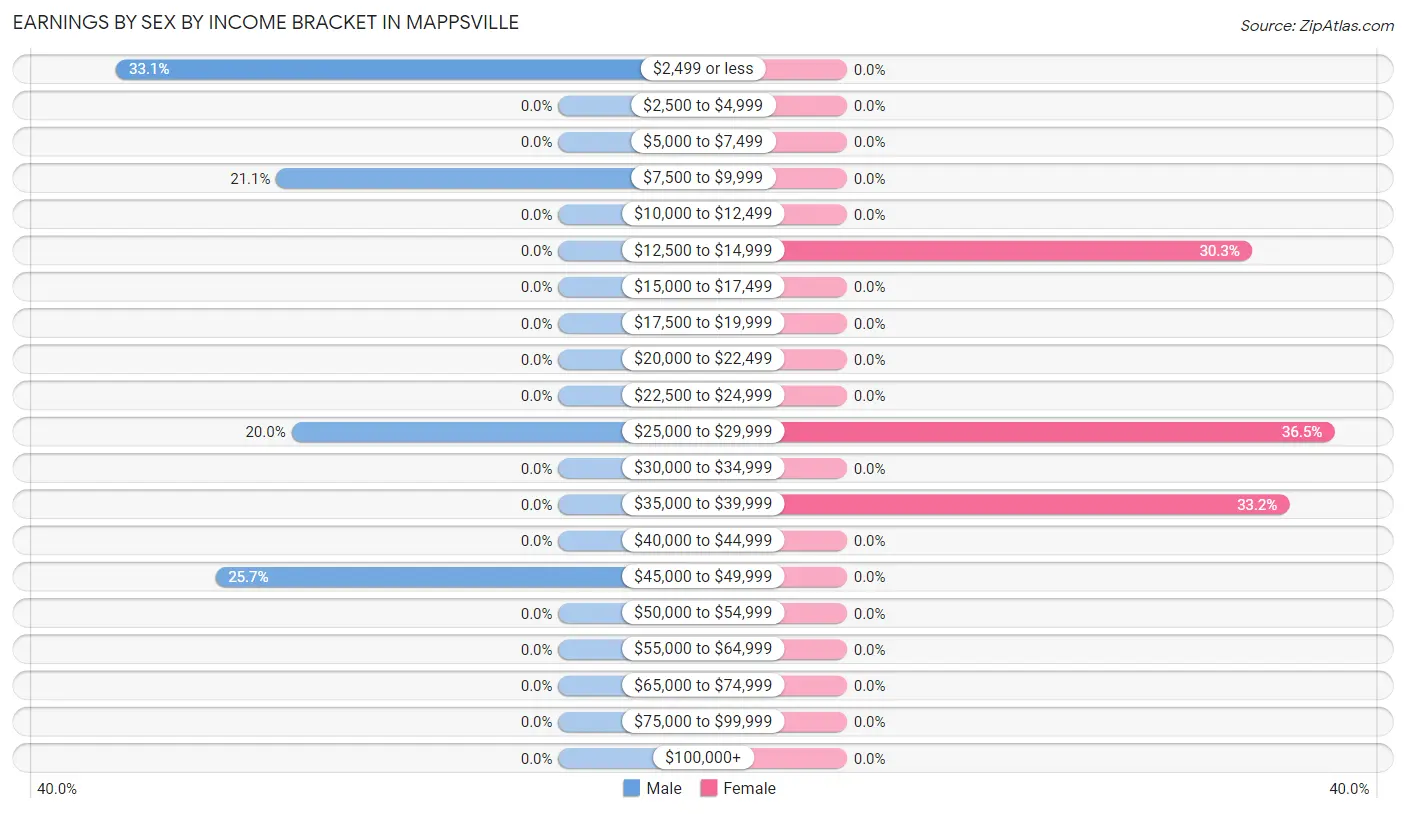
| Income | Male | Female |
| $2,499 or less | 58 (33.1%) | 0 (0.0%) |
| $2,500 to $4,999 | 0 (0.0%) | 0 (0.0%) |
| $5,000 to $7,499 | 0 (0.0%) | 0 (0.0%) |
| $7,500 to $9,999 | 37 (21.1%) | 0 (0.0%) |
| $10,000 to $12,499 | 0 (0.0%) | 0 (0.0%) |
| $12,500 to $14,999 | 0 (0.0%) | 54 (30.3%) |
| $15,000 to $17,499 | 0 (0.0%) | 0 (0.0%) |
| $17,500 to $19,999 | 0 (0.0%) | 0 (0.0%) |
| $20,000 to $22,499 | 0 (0.0%) | 0 (0.0%) |
| $22,500 to $24,999 | 0 (0.0%) | 0 (0.0%) |
| $25,000 to $29,999 | 35 (20.0%) | 65 (36.5%) |
| $30,000 to $34,999 | 0 (0.0%) | 0 (0.0%) |
| $35,000 to $39,999 | 0 (0.0%) | 59 (33.2%) |
| $40,000 to $44,999 | 0 (0.0%) | 0 (0.0%) |
| $45,000 to $49,999 | 45 (25.7%) | 0 (0.0%) |
| $50,000 to $54,999 | 0 (0.0%) | 0 (0.0%) |
| $55,000 to $64,999 | 0 (0.0%) | 0 (0.0%) |
| $65,000 to $74,999 | 0 (0.0%) | 0 (0.0%) |
| $75,000 to $99,999 | 0 (0.0%) | 0 (0.0%) |
| $100,000+ | 0 (0.0%) | 0 (0.0%) |
| Total | 175 (100.0%) | 178 (100.0%) |
Earnings by Sex by Educational Attainment in Mappsville
| Educational Attainment | Male Income | Female Income |
| Less than High School | - | - |
| High School Diploma | - | - |
| College or Associate's Degree | - | - |
| Bachelor's Degree | - | - |
| Graduate Degree | - | - |
| Total | - | - |
Family Income in Mappsville
Family Income Brackets in Mappsville
According to the Mappsville family income data, there are 54 families falling into the $50,000 to $74,999 income range, which is the most common income bracket and makes up 30.3% of all families.
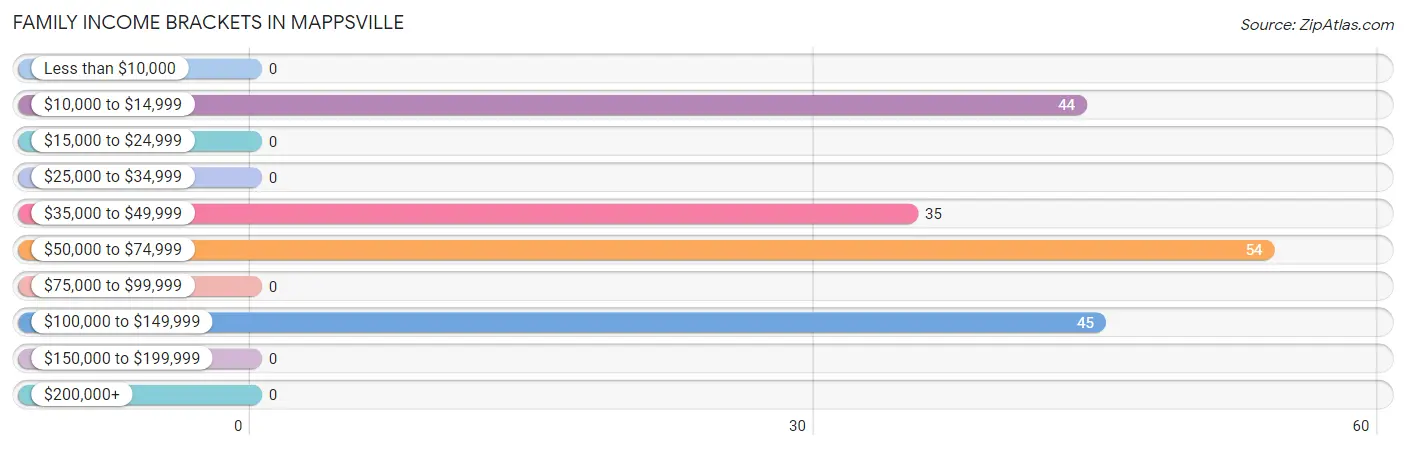
| Income Bracket | # Families | % Families |
| Less than $10,000 | 0 | 0.0% |
| $10,000 to $14,999 | 44 | 24.7% |
| $15,000 to $24,999 | 0 | 0.0% |
| $25,000 to $34,999 | 0 | 0.0% |
| $35,000 to $49,999 | 35 | 19.7% |
| $50,000 to $74,999 | 54 | 30.3% |
| $75,000 to $99,999 | 0 | 0.0% |
| $100,000 to $149,999 | 45 | 25.3% |
| $150,000 to $199,999 | 0 | 0.0% |
| $200,000+ | 0 | 0.0% |
Family Income by Famaliy Size in Mappsville
| Income Bracket | # Families | Median Income |
| 2-Person Families | 89 (50.0%) | $0 |
| 3-Person Families | 45 (25.3%) | $0 |
| 4-Person Families | 44 (24.7%) | $0 |
| 5-Person Families | 0 (0.0%) | $0 |
| 6-Person Families | 0 (0.0%) | $0 |
| 7+ Person Families | 0 (0.0%) | $0 |
| Total | 178 (100.0%) | $65,463 |
Family Income by Number of Earners in Mappsville
| Number of Earners | # Families | Median Income |
| No Earners | 0 (0.0%) | $0 |
| 1 Earner | 44 (24.7%) | $0 |
| 2 Earners | 89 (50.0%) | $0 |
| 3+ Earners | 45 (25.3%) | $0 |
| Total | 178 (100.0%) | $65,463 |
Household Income in Mappsville
Household Income Brackets in Mappsville
With 54 households falling in the category, the $50,000 to $74,999 income range is the most frequent in Mappsville, accounting for 30.3% of all households.
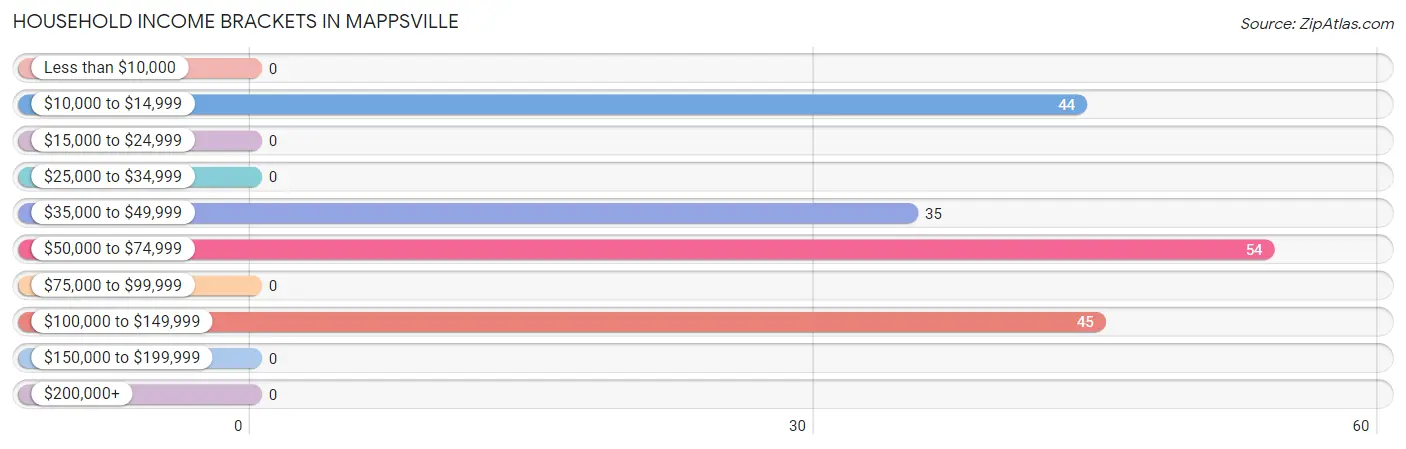
| Income Bracket | # Households | % Households |
| Less than $10,000 | 0 | 0.0% |
| $10,000 to $14,999 | 44 | 24.7% |
| $15,000 to $24,999 | 0 | 0.0% |
| $25,000 to $34,999 | 0 | 0.0% |
| $35,000 to $49,999 | 35 | 19.7% |
| $50,000 to $74,999 | 54 | 30.3% |
| $75,000 to $99,999 | 0 | 0.0% |
| $100,000 to $149,999 | 45 | 25.3% |
| $150,000 to $199,999 | 0 | 0.0% |
| $200,000+ | 0 | 0.0% |
Household Income by Householder Age in Mappsville
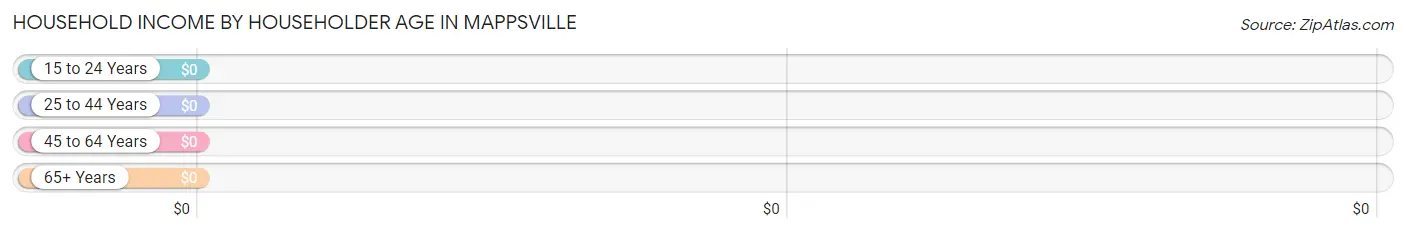
| Income Bracket | # Households | Median Income |
| 15 to 24 Years | 0 (0.0%) | $0 |
| 25 to 44 Years | 0 (0.0%) | $0 |
| 45 to 64 Years | 89 (50.0%) | $0 |
| 65+ Years | 89 (50.0%) | $0 |
| Total | 178 (100.0%) | $65,463 |
Poverty in Mappsville
Income Below Poverty by Sex and Age in Mappsville
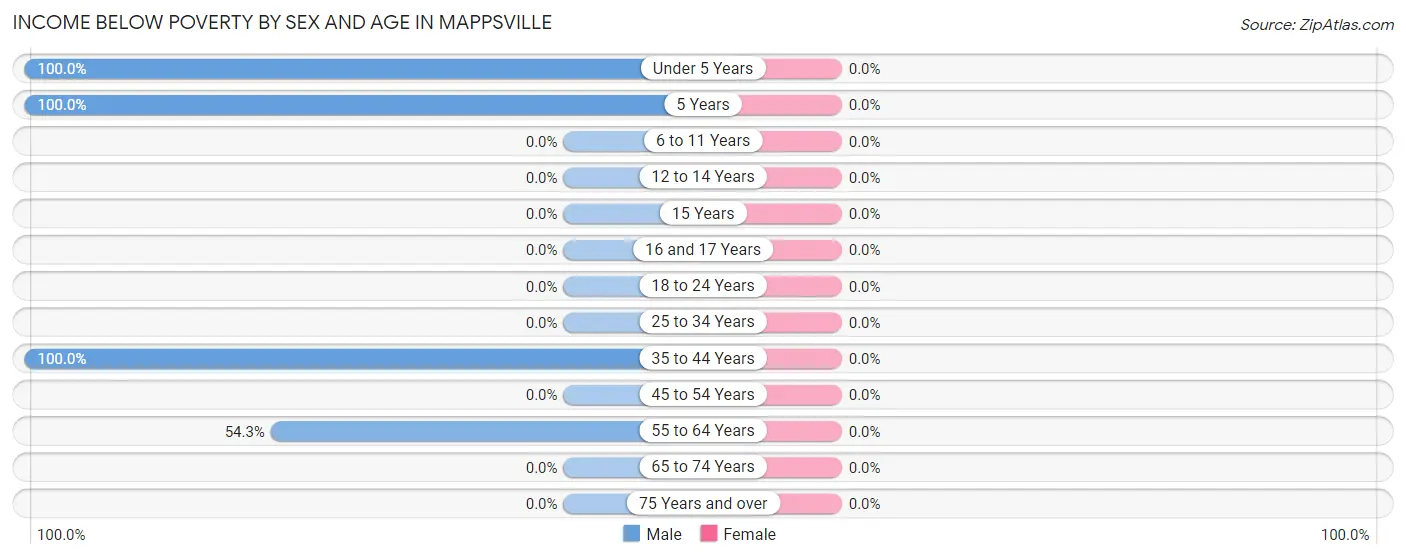
| Age Bracket | Male | Female |
| Under 5 Years | 32 (100.0%) | 0 (0.0%) |
| 5 Years | 16 (100.0%) | 0 (0.0%) |
| 6 to 11 Years | 0 (0.0%) | 0 (0.0%) |
| 12 to 14 Years | 0 (0.0%) | 0 (0.0%) |
| 15 Years | 0 (0.0%) | 0 (0.0%) |
| 16 and 17 Years | 0 (0.0%) | 0 (0.0%) |
| 18 to 24 Years | 0 (0.0%) | 0 (0.0%) |
| 25 to 34 Years | 0 (0.0%) | 0 (0.0%) |
| 35 to 44 Years | 58 (100.0%) | 0 (0.0%) |
| 45 to 54 Years | 0 (0.0%) | 0 (0.0%) |
| 55 to 64 Years | 44 (54.3%) | 0 (0.0%) |
| 65 to 74 Years | 0 (0.0%) | 0 (0.0%) |
| 75 Years and over | 0 (0.0%) | 0 (0.0%) |
| Total | 150 (56.2%) | 0 (0.0%) |
Income Above Poverty by Sex and Age in Mappsville
According to the poverty statistics in Mappsville, males aged 45 to 54 years and females aged 18 to 24 years are the age groups that are most secure financially, with 100.0% of males and 100.0% of females in these age groups living above the poverty line.
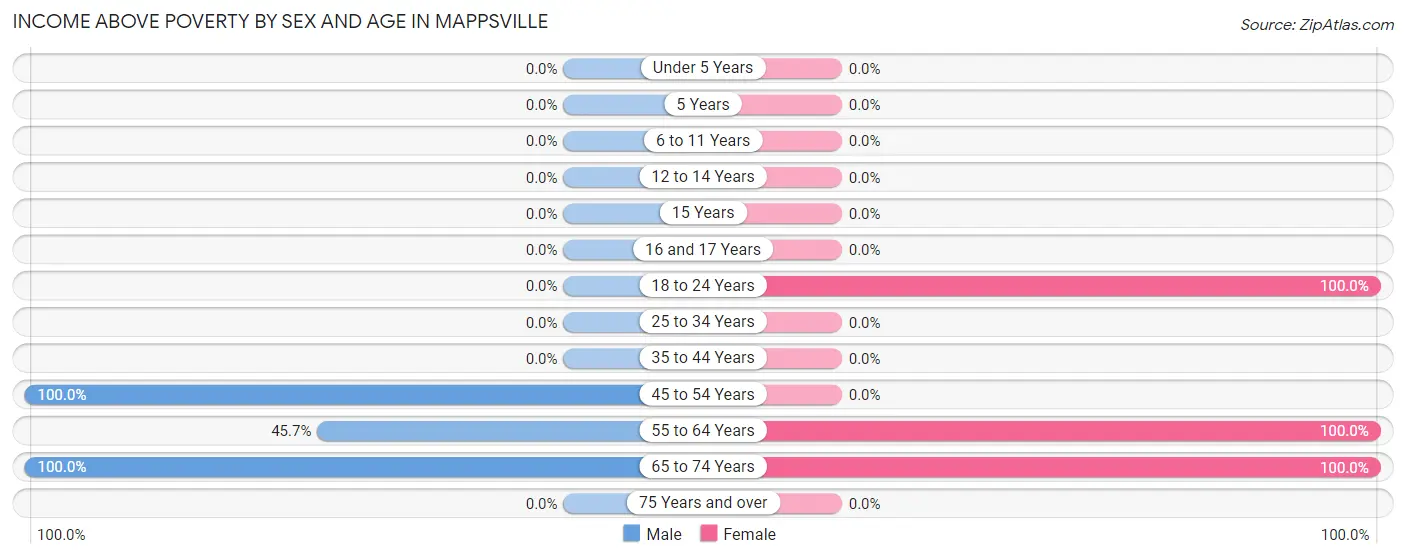
| Age Bracket | Male | Female |
| Under 5 Years | 0 (0.0%) | 0 (0.0%) |
| 5 Years | 0 (0.0%) | 0 (0.0%) |
| 6 to 11 Years | 0 (0.0%) | 0 (0.0%) |
| 12 to 14 Years | 0 (0.0%) | 0 (0.0%) |
| 15 Years | 0 (0.0%) | 0 (0.0%) |
| 16 and 17 Years | 0 (0.0%) | 0 (0.0%) |
| 18 to 24 Years | 0 (0.0%) | 65 (100.0%) |
| 25 to 34 Years | 0 (0.0%) | 0 (0.0%) |
| 35 to 44 Years | 0 (0.0%) | 0 (0.0%) |
| 45 to 54 Years | 45 (100.0%) | 0 (0.0%) |
| 55 to 64 Years | 37 (45.7%) | 59 (100.0%) |
| 65 to 74 Years | 35 (100.0%) | 54 (100.0%) |
| 75 Years and over | 0 (0.0%) | 0 (0.0%) |
| Total | 117 (43.8%) | 178 (100.0%) |
Income Below Poverty Among Married-Couple Families in Mappsville
| Children | Above Poverty | Below Poverty |
| No Children | 45 (100.0%) | 0 (0.0%) |
| 1 or 2 Children | 0 (0.0%) | 0 (0.0%) |
| 3 or 4 Children | 0 (0.0%) | 0 (0.0%) |
| 5 or more Children | 0 (0.0%) | 0 (0.0%) |
| Total | 45 (100.0%) | 0 (0.0%) |
Income Below Poverty Among Single-Parent Households in Mappsville
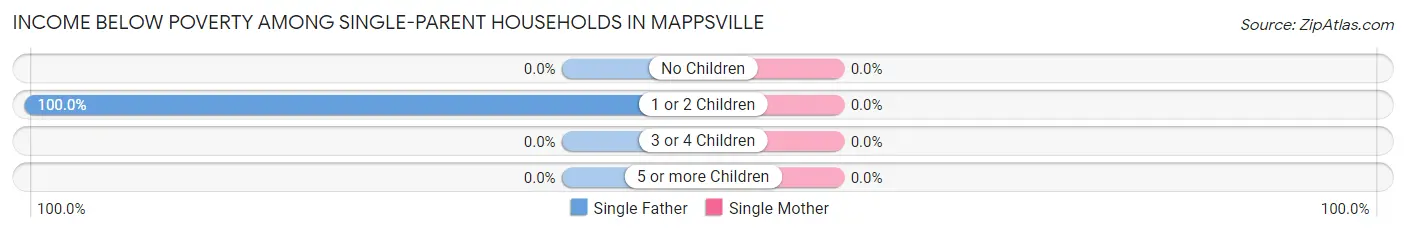
| Children | Single Father | Single Mother |
| No Children | 0 (0.0%) | 0 (0.0%) |
| 1 or 2 Children | 44 (100.0%) | 0 (0.0%) |
| 3 or 4 Children | 0 (0.0%) | 0 (0.0%) |
| 5 or more Children | 0 (0.0%) | 0 (0.0%) |
| Total | 44 (55.7%) | 0 (0.0%) |
Income Below Poverty Among Married-Couple vs Single-Parent Households in Mappsville
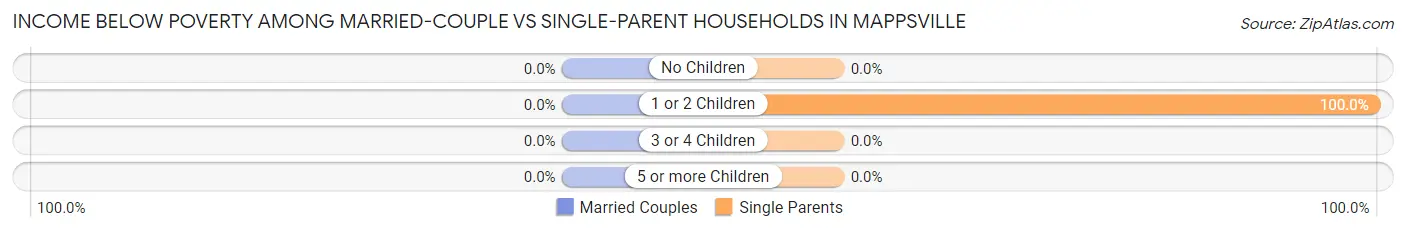
| Children | Married-Couple Families | Single-Parent Households |
| No Children | 0 (0.0%) | 0 (0.0%) |
| 1 or 2 Children | 0 (0.0%) | 44 (100.0%) |
| 3 or 4 Children | 0 (0.0%) | 0 (0.0%) |
| 5 or more Children | 0 (0.0%) | 0 (0.0%) |
| Total | 0 (0.0%) | 44 (33.1%) |
Race in Mappsville
The most populous races in Mappsville are , and Black / African American (445 | 100.0%).
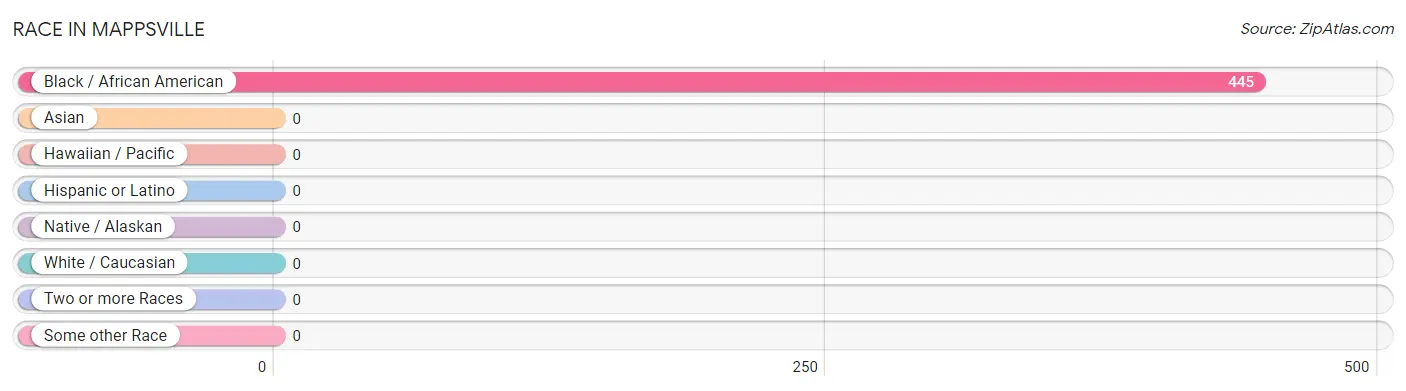
| Race | # Population | % Population |
| Asian | 0 | 0.0% |
| Black / African American | 445 | 100.0% |
| Hawaiian / Pacific | 0 | 0.0% |
| Hispanic or Latino | 0 | 0.0% |
| Native / Alaskan | 0 | 0.0% |
| White / Caucasian | 0 | 0.0% |
| Two or more Races | 0 | 0.0% |
| Some other Race | 0 | 0.0% |
| Total | 445 | 100.0% |
Ancestry in Mappsville
The most populous ancestries reported in Mappsville are American (301 | 67.6%), and Haitian (144 | 32.4%), together accounting for 100.0% of all Mappsville residents.
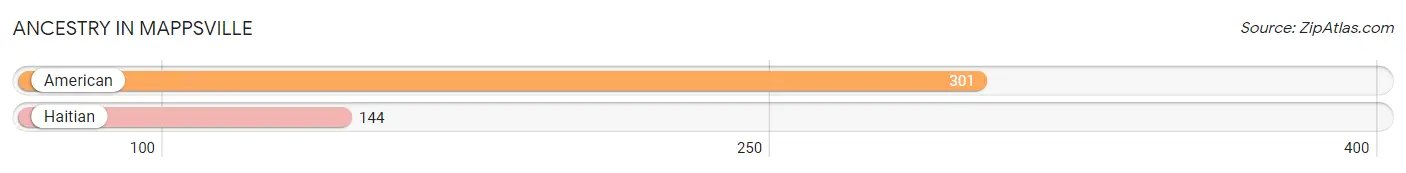
| Ancestry | # Population | % Population |
| American | 301 | 67.6% |
| Haitian | 144 | 32.4% | View All 2 Rows |
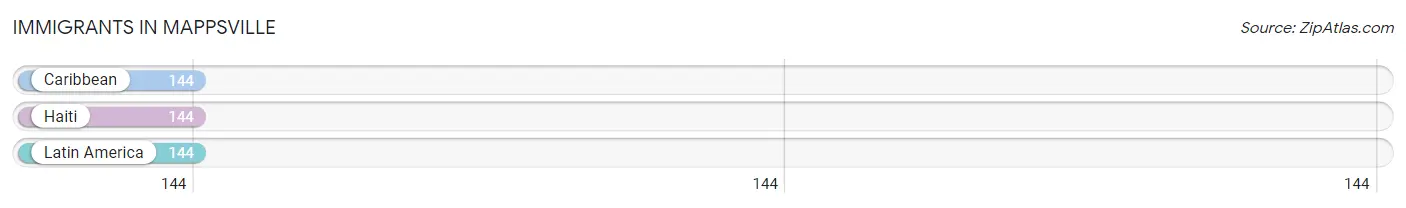
Immigrants in Mappsville
The most numerous immigrant groups reported in Mappsville came from Caribbean (144 | 32.4%), Haiti (144 | 32.4%), and Latin America (144 | 32.4%), together accounting for 97.1% of all Mappsville residents.
| Immigration Origin | # Population | % Population |
| Caribbean | 144 | 32.4% |
| Haiti | 144 | 32.4% |
| Latin America | 144 | 32.4% | View All 3 Rows |
Sex and Age in Mappsville
Sex and Age in Mappsville
The most populous age groups in Mappsville are 40 to 44 Years (58 | 21.7%) for men and 15 to 19 Years (65 | 36.5%) for women.
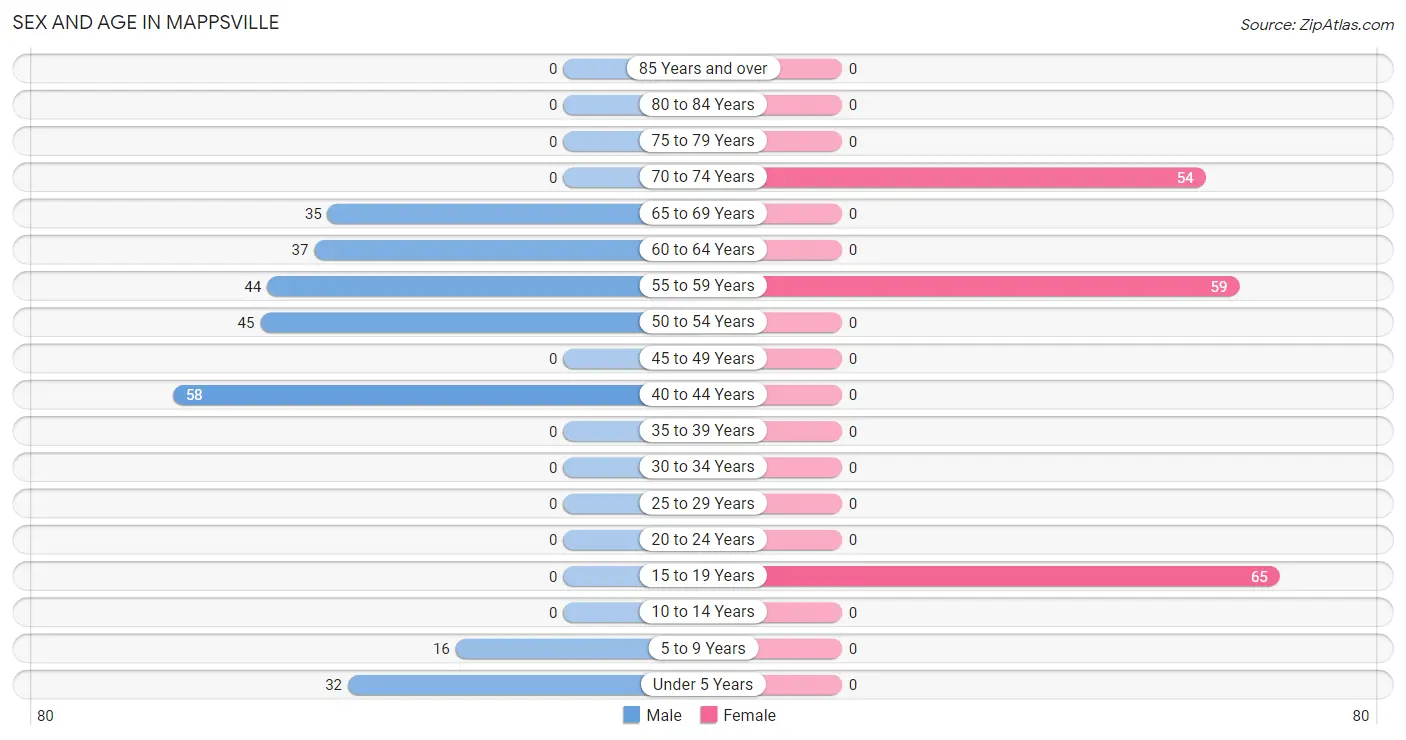
| Age Bracket | Male | Female |
| Under 5 Years | 32 (12.0%) | 0 (0.0%) |
| 5 to 9 Years | 16 (6.0%) | 0 (0.0%) |
| 10 to 14 Years | 0 (0.0%) | 0 (0.0%) |
| 15 to 19 Years | 0 (0.0%) | 65 (36.5%) |
| 20 to 24 Years | 0 (0.0%) | 0 (0.0%) |
| 25 to 29 Years | 0 (0.0%) | 0 (0.0%) |
| 30 to 34 Years | 0 (0.0%) | 0 (0.0%) |
| 35 to 39 Years | 0 (0.0%) | 0 (0.0%) |
| 40 to 44 Years | 58 (21.7%) | 0 (0.0%) |
| 45 to 49 Years | 0 (0.0%) | 0 (0.0%) |
| 50 to 54 Years | 45 (16.9%) | 0 (0.0%) |
| 55 to 59 Years | 44 (16.5%) | 59 (33.2%) |
| 60 to 64 Years | 37 (13.9%) | 0 (0.0%) |
| 65 to 69 Years | 35 (13.1%) | 0 (0.0%) |
| 70 to 74 Years | 0 (0.0%) | 54 (30.3%) |
| 75 to 79 Years | 0 (0.0%) | 0 (0.0%) |
| 80 to 84 Years | 0 (0.0%) | 0 (0.0%) |
| 85 Years and over | 0 (0.0%) | 0 (0.0%) |
| Total | 267 (100.0%) | 178 (100.0%) |
Families and Households in Mappsville
Median Family Size in Mappsville
The median family size in Mappsville is 2.50 persons per family, with married-couple families (45 | 25.3%) accounting for the largest median family size of 3.2 persons per family. On the other hand, single female/mother families (54 | 30.3%) represent the smallest median family size with 1.46 persons per family.
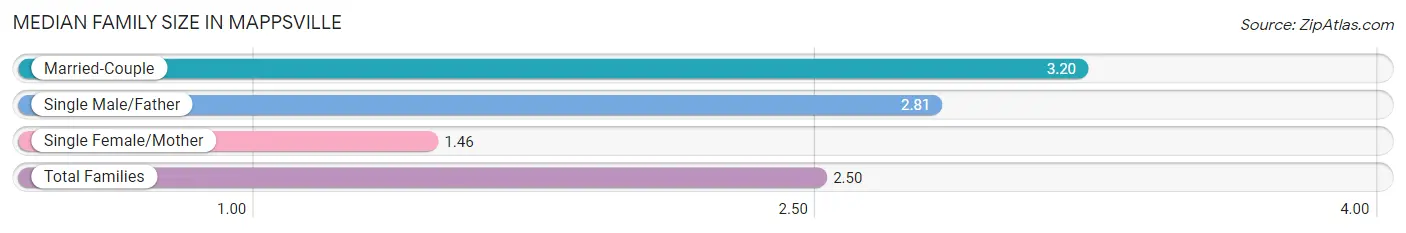
| Family Type | # Families | Family Size |
| Married-Couple | 45 (25.3%) | 3.20 |
| Single Male/Father | 79 (44.4%) | 2.81 |
| Single Female/Mother | 54 (30.3%) | 1.46 |
| Total Families | 178 (100.0%) | 2.50 |
Median Household Size in Mappsville
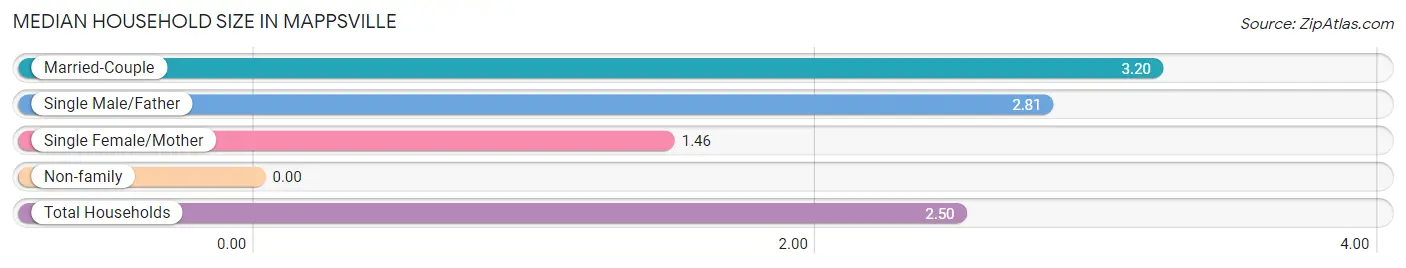
| Household Type | # Households | Household Size |
| Married-Couple | 45 (25.3%) | 3.20 |
| Single Male/Father | 79 (44.4%) | 2.81 |
| Single Female/Mother | 54 (30.3%) | 1.46 |
| Non-family | 0 (0.0%) | - |
| Total Households | 178 (100.0%) | 2.50 |
Household Size by Marriage Status in Mappsville
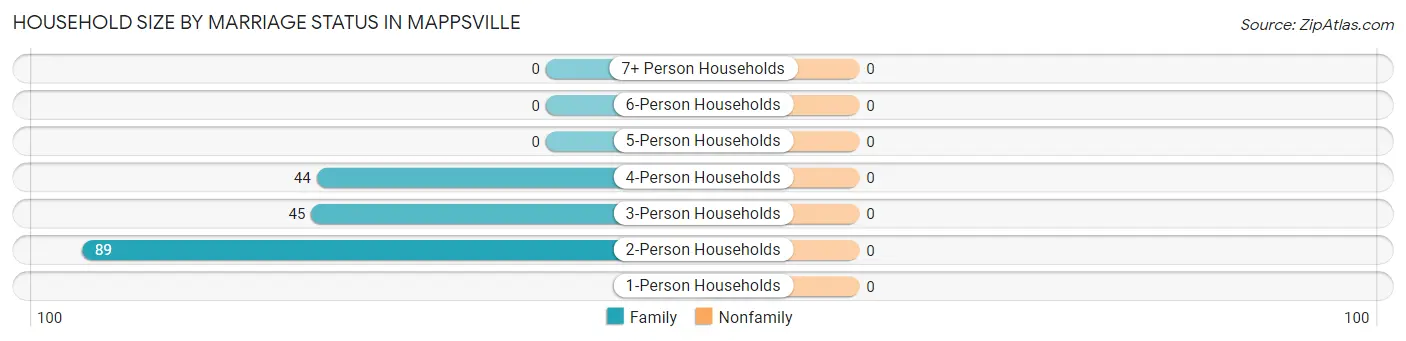
| Household Size | Family Households | Nonfamily Households |
| 1-Person Households | - | 0 (0.0%) |
| 2-Person Households | 89 (50.0%) | 0 (0.0%) |
| 3-Person Households | 45 (25.3%) | 0 (0.0%) |
| 4-Person Households | 44 (24.7%) | 0 (0.0%) |
| 5-Person Households | 0 (0.0%) | 0 (0.0%) |
| 6-Person Households | 0 (0.0%) | 0 (0.0%) |
| 7+ Person Households | 0 (0.0%) | 0 (0.0%) |
| Total | 178 (100.0%) | 0 (0.0%) |
Female Fertility in Mappsville
Fertility by Age in Mappsville
| Age Bracket | Women with Births | Births / 1,000 Women |
| 15 to 19 years | 0 (0.0%) | 0.0 |
| 20 to 34 years | 0 (0.0%) | 0.0 |
| 35 to 50 years | 0 (0.0%) | 0.0 |
| Total | 0 (0.0%) | 0.0 |
Fertility by Age by Marriage Status in Mappsville
| Age Bracket | Married | Unmarried |
| 15 to 19 years | 0 (0.0%) | 0 (0.0%) |
| 20 to 34 years | 0 (0.0%) | 0 (0.0%) |
| 35 to 50 years | 0 (0.0%) | 0 (0.0%) |
| Total | 0 (0.0%) | 0 (0.0%) |
Fertility by Education in Mappsville
| Educational Attainment | Women with Births | Births / 1,000 Women |
| Less than High School | 0 (0.0%) | 0.0 |
| High School Diploma | 0 (0.0%) | 0.0 |
| College or Associate's Degree | 0 (0.0%) | 0.0 |
| Bachelor's Degree | 0 (0.0%) | 0.0 |
| Graduate Degree | 0 (0.0%) | 0.0 |
| Total | 0 (0.0%) | 0.0 |
Fertility by Education by Marriage Status in Mappsville
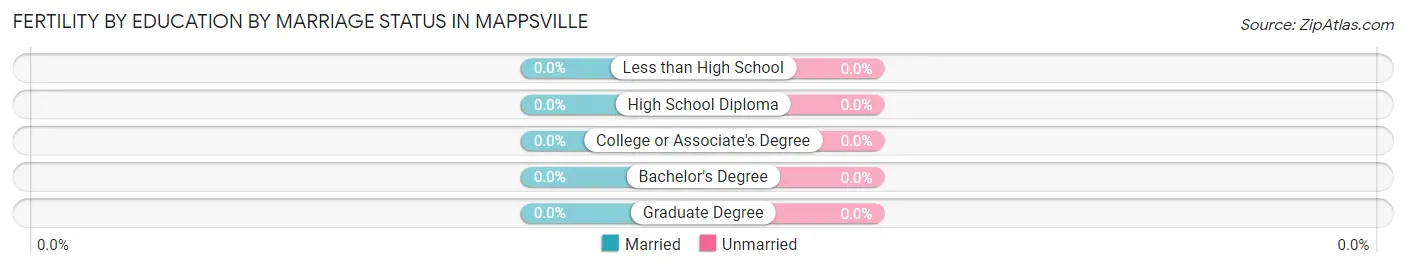
| Educational Attainment | Married | Unmarried |
| Less than High School | 0 (0.0%) | 0 (0.0%) |
| High School Diploma | 0 (0.0%) | 0 (0.0%) |
| College or Associate's Degree | 0 (0.0%) | 0 (0.0%) |
| Bachelor's Degree | 0 (0.0%) | 0 (0.0%) |
| Graduate Degree | 0 (0.0%) | 0 (0.0%) |
| Total | 0 (0.0%) | 0 (0.0%) |
Employment Characteristics in Mappsville
Employment by Class of Employer in Mappsville
Among the 353 employed individuals in Mappsville, private company employees (316 | 89.5%), and not-for-profit organizations (37 | 10.5%) make up the most common classes of employment.
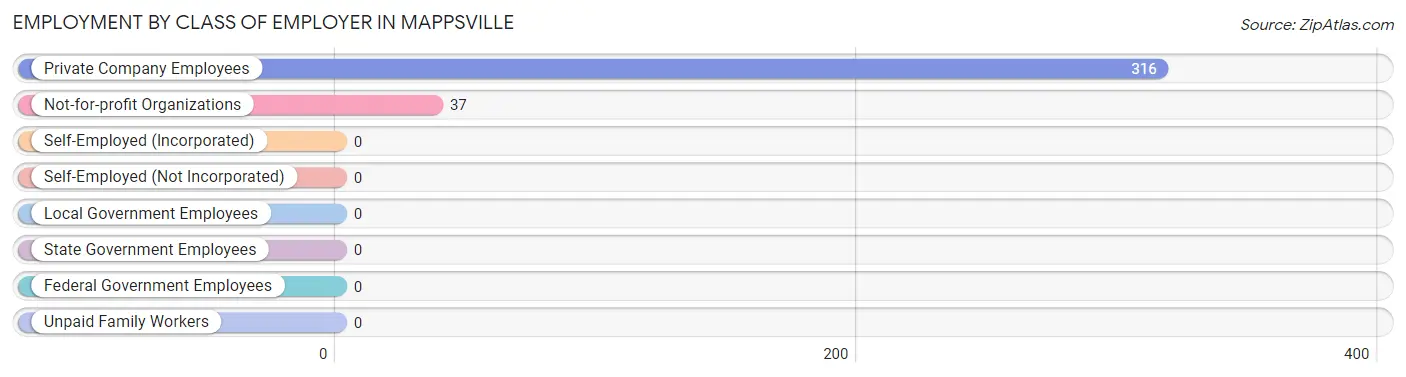
| Employer Class | # Employees | % Employees |
| Private Company Employees | 316 | 89.5% |
| Self-Employed (Incorporated) | 0 | 0.0% |
| Self-Employed (Not Incorporated) | 0 | 0.0% |
| Not-for-profit Organizations | 37 | 10.5% |
| Local Government Employees | 0 | 0.0% |
| State Government Employees | 0 | 0.0% |
| Federal Government Employees | 0 | 0.0% |
| Unpaid Family Workers | 0 | 0.0% |
| Total | 353 | 100.0% |
Employment Status by Age in Mappsville
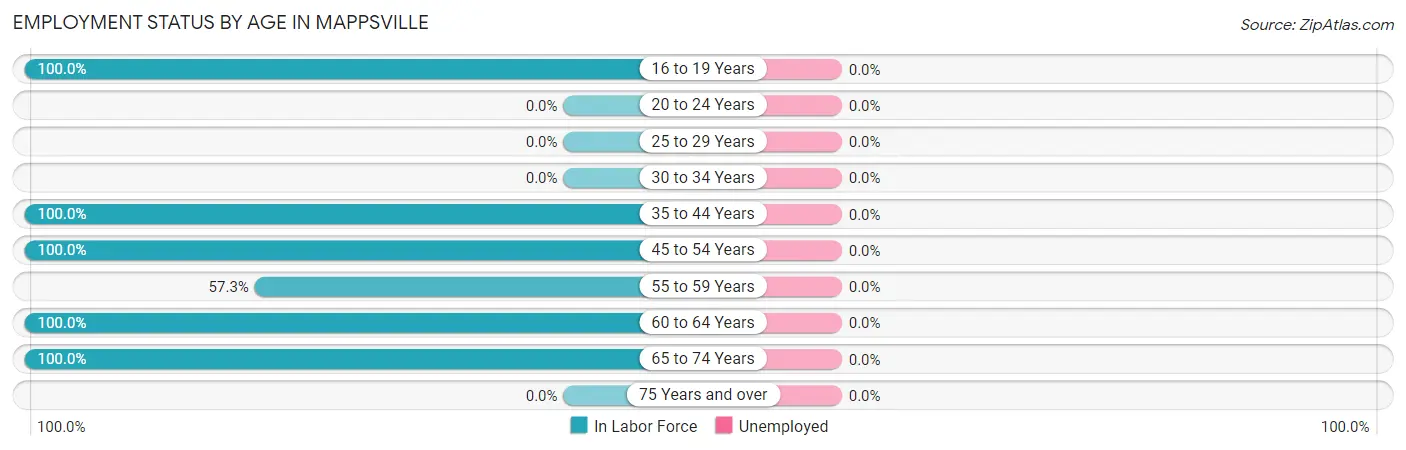
| Age Bracket | In Labor Force | Unemployed |
| 16 to 19 Years | 65 (100.0%) | 0 (0.0%) |
| 20 to 24 Years | 0 (0.0%) | 0 (0.0%) |
| 25 to 29 Years | 0 (0.0%) | 0 (0.0%) |
| 30 to 34 Years | 0 (0.0%) | 0 (0.0%) |
| 35 to 44 Years | 58 (100.0%) | 0 (0.0%) |
| 45 to 54 Years | 45 (100.0%) | 0 (0.0%) |
| 55 to 59 Years | 59 (57.3%) | 0 (0.0%) |
| 60 to 64 Years | 37 (100.0%) | 0 (0.0%) |
| 65 to 74 Years | 89 (100.0%) | 0 (0.0%) |
| 75 Years and over | 0 (0.0%) | 0 (0.0%) |
| Total | 353 (88.9%) | 0 (0.0%) |
Employment Status by Educational Attainment in Mappsville
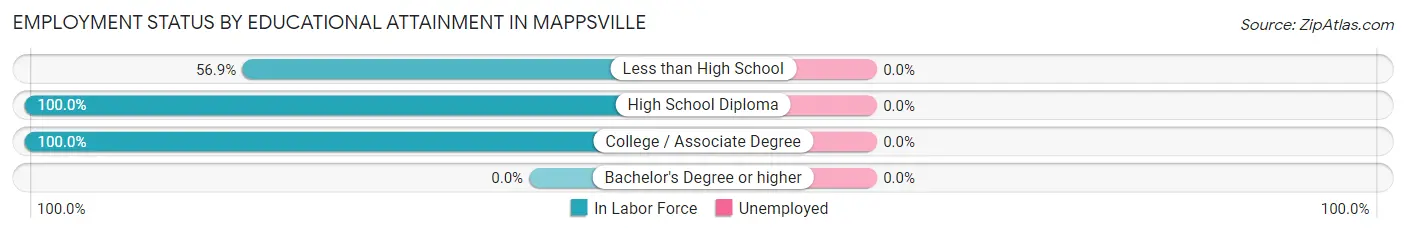
| Educational Attainment | In Labor Force | Unemployed |
| Less than High School | 58 (56.9%) | 0 (0.0%) |
| High School Diploma | 45 (100.0%) | 0 (0.0%) |
| College / Associate Degree | 96 (100.0%) | 0 (0.0%) |
| Bachelor's Degree or higher | 0 (0.0%) | 0 (0.0%) |
| Total | 199 (81.9%) | 0 (0.0%) |
Employment Occupations by Sex in Mappsville
Management, Business, Science and Arts Occupations
Management, Business, Science and Arts Occupations by Sex
| Occupation | Male | Female |
| Management | 0 (0.0%) | 0 (0.0%) |
| Business & Financial | 0 (0.0%) | 0 (0.0%) |
| Computers, Engineering & Science | 0 (0.0%) | 0 (0.0%) |
| Computers & Mathematics | 0 (0.0%) | 0 (0.0%) |
| Architecture & Engineering | 0 (0.0%) | 0 (0.0%) |
| Life, Physical & Social Science | 0 (0.0%) | 0 (0.0%) |
| Community & Social Service | 0 (0.0%) | 0 (0.0%) |
| Education, Arts & Media | 0 (0.0%) | 0 (0.0%) |
| Legal Services & Support | 0 (0.0%) | 0 (0.0%) |
| Education Instruction & Library | 0 (0.0%) | 0 (0.0%) |
| Arts, Media & Entertainment | 0 (0.0%) | 0 (0.0%) |
| Health Diagnosing & Treating | 0 (0.0%) | 0 (0.0%) |
| Health Technologists | 0 (0.0%) | 0 (0.0%) |
| Total (Category) | 0 (0.0%) | 0 (0.0%) |
| Total (Overall) | 175 (49.6%) | 178 (50.4%) |
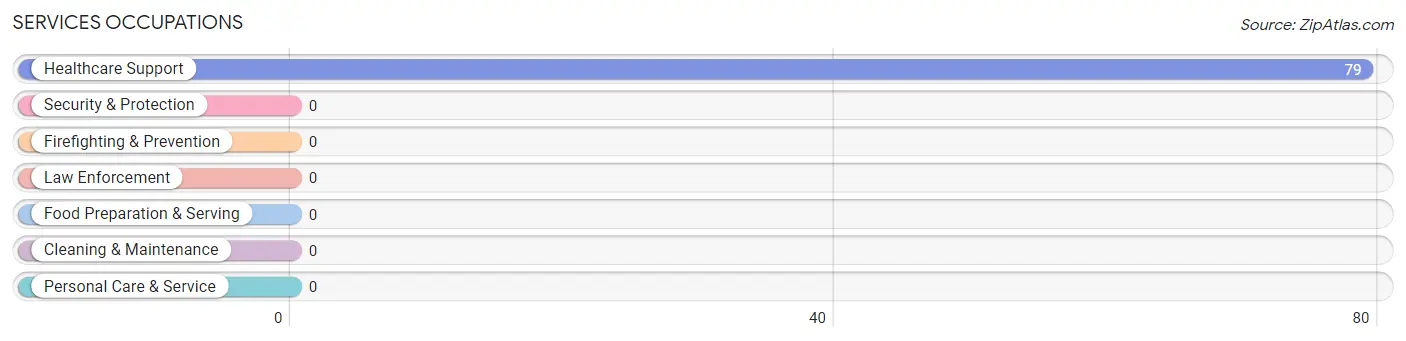
Services Occupations
The most common Services occupations in Mappsville are , and Healthcare Support (79 | 22.4%).
Services Occupations by Sex
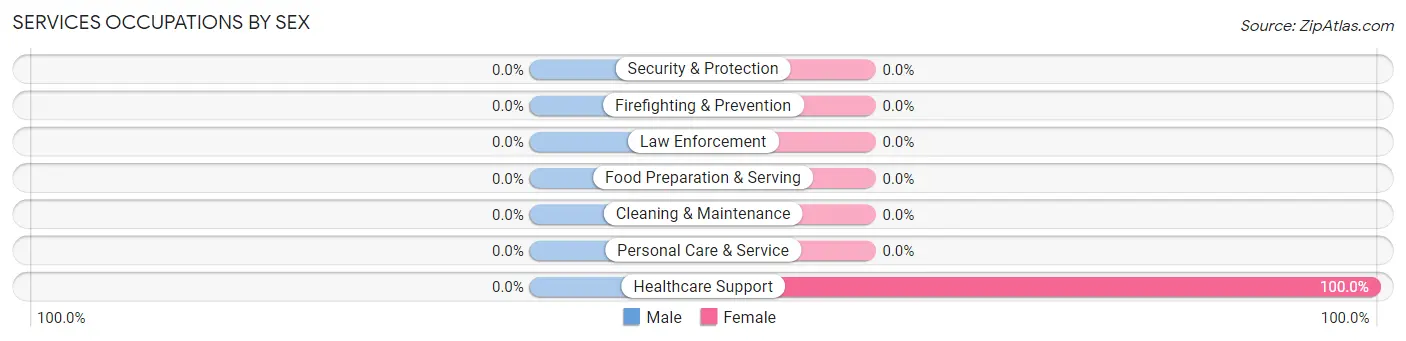
| Occupation | Male | Female |
| Healthcare Support | 0 (0.0%) | 79 (100.0%) |
| Security & Protection | 0 (0.0%) | 0 (0.0%) |
| Firefighting & Prevention | 0 (0.0%) | 0 (0.0%) |
| Law Enforcement | 0 (0.0%) | 0 (0.0%) |
| Food Preparation & Serving | 0 (0.0%) | 0 (0.0%) |
| Cleaning & Maintenance | 0 (0.0%) | 0 (0.0%) |
| Personal Care & Service | 0 (0.0%) | 0 (0.0%) |
| Total (Category) | 0 (0.0%) | 79 (100.0%) |
| Total (Overall) | 175 (49.6%) | 178 (50.4%) |
Sales and Office Occupations
Sales and Office Occupations by Sex
| Occupation | Male | Female |
| Sales & Related | 0 (0.0%) | 0 (0.0%) |
| Office & Administration | 0 (0.0%) | 0 (0.0%) |
| Total (Category) | 0 (0.0%) | 0 (0.0%) |
| Total (Overall) | 175 (49.6%) | 178 (50.4%) |
Natural Resources, Construction and Maintenance Occupations
The most common Natural Resources, Construction and Maintenance occupations in Mappsville are Farming, Fishing & Forestry (102 | 28.9%), and Construction & Extraction (58 | 16.4%).
Natural Resources, Construction and Maintenance Occupations by Sex
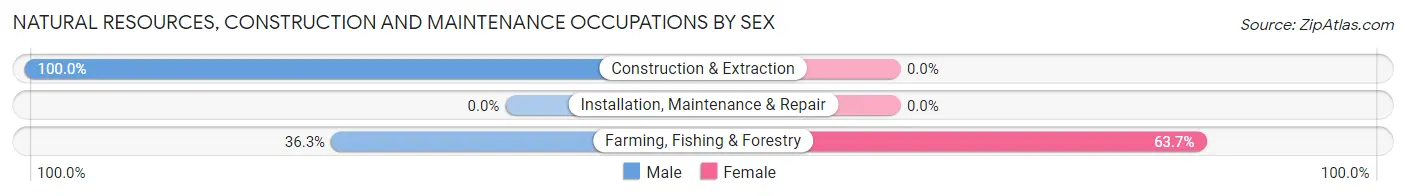
| Occupation | Male | Female |
| Farming, Fishing & Forestry | 37 (36.3%) | 65 (63.7%) |
| Construction & Extraction | 58 (100.0%) | 0 (0.0%) |
| Installation, Maintenance & Repair | 0 (0.0%) | 0 (0.0%) |
| Total (Category) | 95 (59.4%) | 65 (40.6%) |
| Total (Overall) | 175 (49.6%) | 178 (50.4%) |
Production, Transportation and Moving Occupations
The most common Production, Transportation and Moving occupations in Mappsville are , and Production (114 | 32.3%).
Production, Transportation and Moving Occupations by Sex
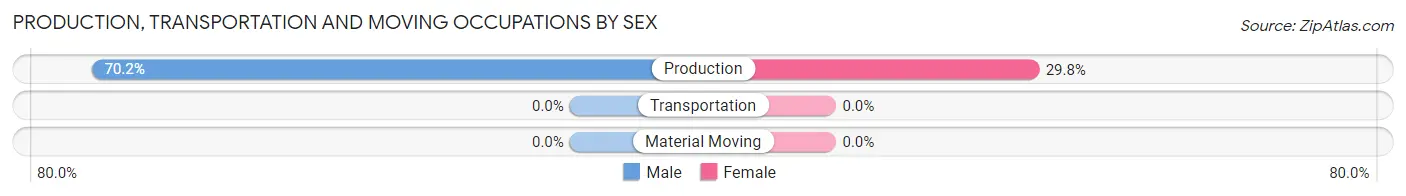
| Occupation | Male | Female |
| Production | 80 (70.2%) | 34 (29.8%) |
| Transportation | 0 (0.0%) | 0 (0.0%) |
| Material Moving | 0 (0.0%) | 0 (0.0%) |
| Total (Category) | 80 (70.2%) | 34 (29.8%) |
| Total (Overall) | 175 (49.6%) | 178 (50.4%) |
Employment Industries by Sex in Mappsville
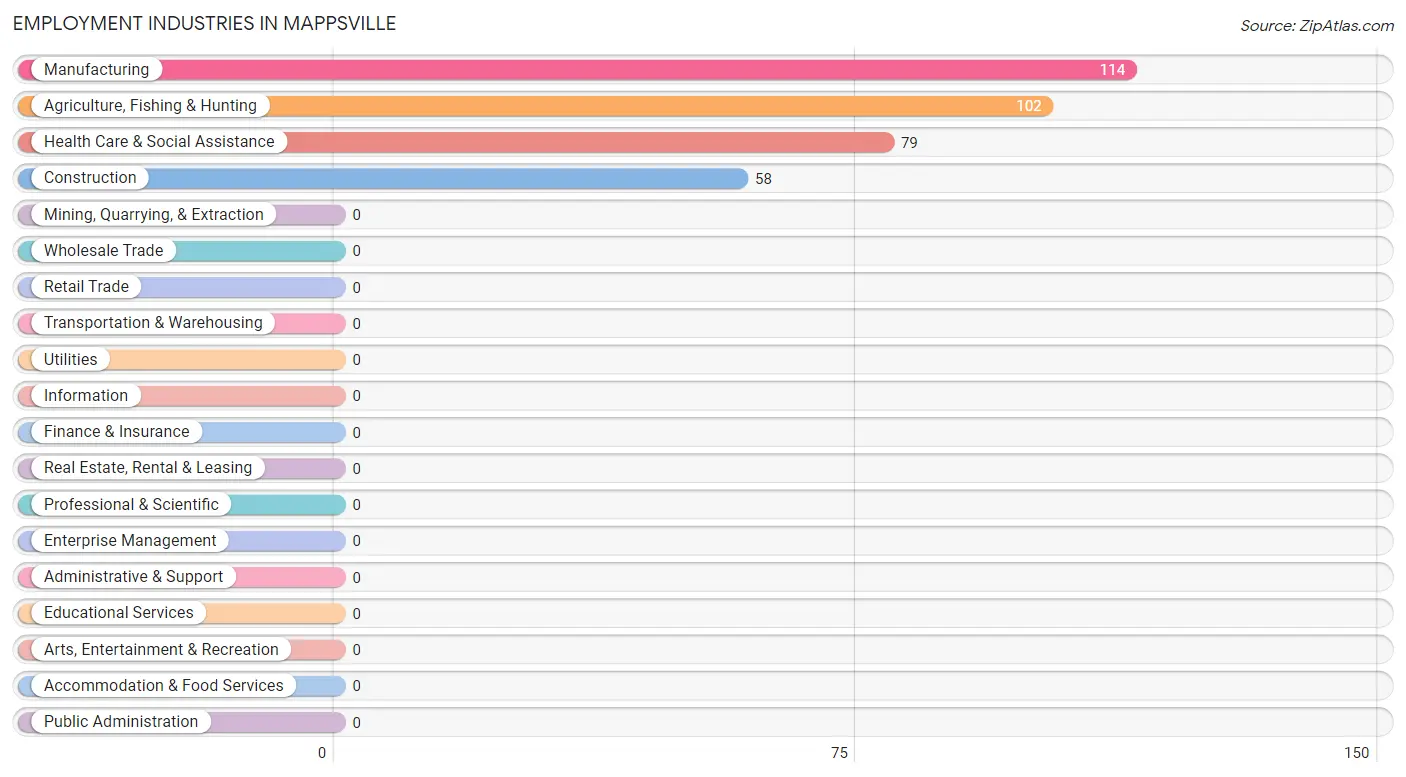
Employment Industries in Mappsville
The major employment industries in Mappsville include Manufacturing (114 | 32.3%), Agriculture, Fishing & Hunting (102 | 28.9%), Health Care & Social Assistance (79 | 22.4%), and Construction (58 | 16.4%).
Employment Industries by Sex in Mappsville
The Mappsville industries that see more men than women are Construction (100.0%), Manufacturing (70.2%), and Agriculture, Fishing & Hunting (36.3%), whereas the industries that tend to have a higher number of women are Health Care & Social Assistance (100.0%), Agriculture, Fishing & Hunting (63.7%), and Manufacturing (29.8%).
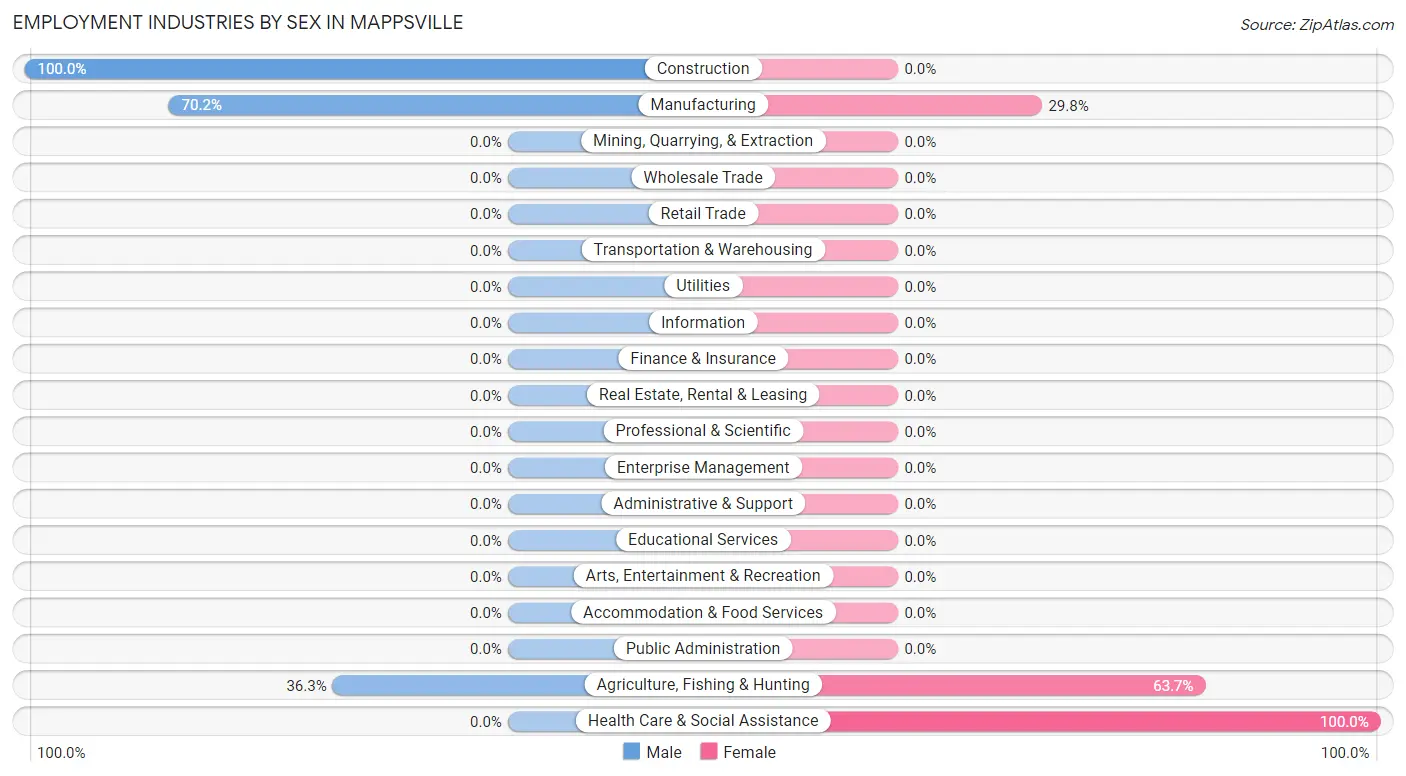
| Industry | Male | Female |
| Agriculture, Fishing & Hunting | 37 (36.3%) | 65 (63.7%) |
| Mining, Quarrying, & Extraction | 0 (0.0%) | 0 (0.0%) |
| Construction | 58 (100.0%) | 0 (0.0%) |
| Manufacturing | 80 (70.2%) | 34 (29.8%) |
| Wholesale Trade | 0 (0.0%) | 0 (0.0%) |
| Retail Trade | 0 (0.0%) | 0 (0.0%) |
| Transportation & Warehousing | 0 (0.0%) | 0 (0.0%) |
| Utilities | 0 (0.0%) | 0 (0.0%) |
| Information | 0 (0.0%) | 0 (0.0%) |
| Finance & Insurance | 0 (0.0%) | 0 (0.0%) |
| Real Estate, Rental & Leasing | 0 (0.0%) | 0 (0.0%) |
| Professional & Scientific | 0 (0.0%) | 0 (0.0%) |
| Enterprise Management | 0 (0.0%) | 0 (0.0%) |
| Administrative & Support | 0 (0.0%) | 0 (0.0%) |
| Educational Services | 0 (0.0%) | 0 (0.0%) |
| Health Care & Social Assistance | 0 (0.0%) | 79 (100.0%) |
| Arts, Entertainment & Recreation | 0 (0.0%) | 0 (0.0%) |
| Accommodation & Food Services | 0 (0.0%) | 0 (0.0%) |
| Public Administration | 0 (0.0%) | 0 (0.0%) |
| Total | 175 (49.6%) | 178 (50.4%) |
Education in Mappsville
School Enrollment in Mappsville
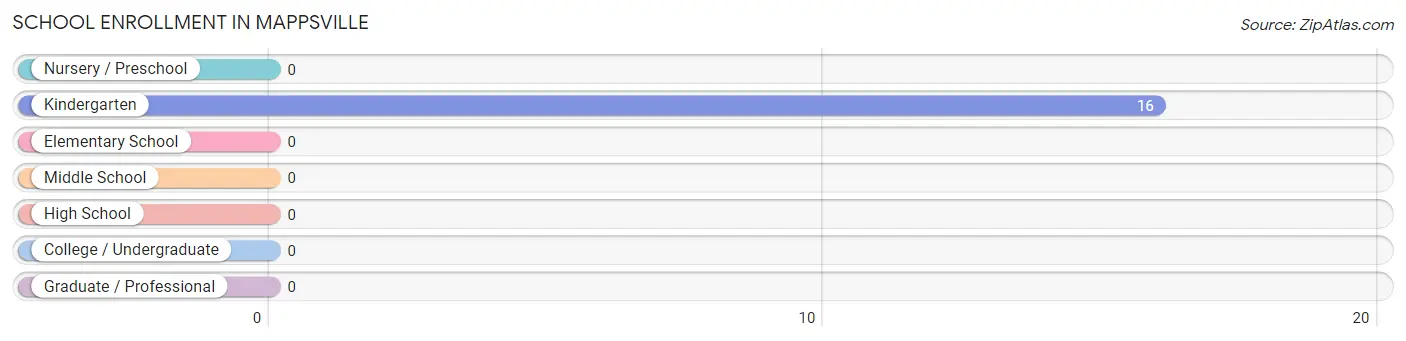
| School Level | # Students | % Students |
| Nursery / Preschool | 0 | 0.0% |
| Kindergarten | 16 | 100.0% |
| Elementary School | 0 | 0.0% |
| Middle School | 0 | 0.0% |
| High School | 0 | 0.0% |
| College / Undergraduate | 0 | 0.0% |
| Graduate / Professional | 0 | 0.0% |
| Total | 16 | 100.0% |
School Enrollment by Age by Funding Source in Mappsville
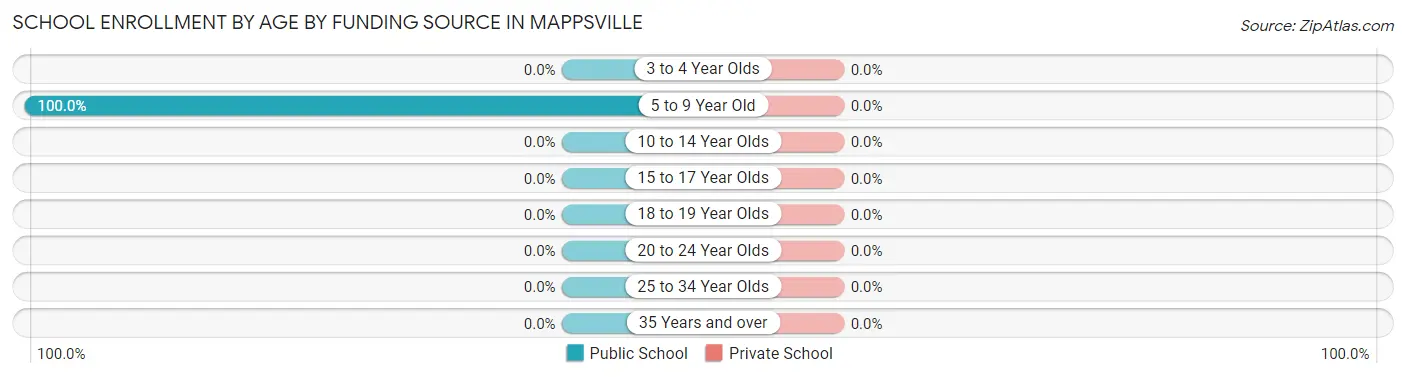
| Age Bracket | Public School | Private School |
| 3 to 4 Year Olds | 0 (0.0%) | 0 (0.0%) |
| 5 to 9 Year Old | 16 (100.0%) | 0 (0.0%) |
| 10 to 14 Year Olds | 0 (0.0%) | 0 (0.0%) |
| 15 to 17 Year Olds | 0 (0.0%) | 0 (0.0%) |
| 18 to 19 Year Olds | 0 (0.0%) | 0 (0.0%) |
| 20 to 24 Year Olds | 0 (0.0%) | 0 (0.0%) |
| 25 to 34 Year Olds | 0 (0.0%) | 0 (0.0%) |
| 35 Years and over | 0 (0.0%) | 0 (0.0%) |
| Total | 16 (100.0%) | 0 (0.0%) |
Educational Attainment by Field of Study in Mappsville
| Field of Study | # Graduates | % Graduates |
| Computers & Mathematics | 0 | 0.0% |
| Bio, Nature & Agricultural | 0 | 0.0% |
| Physical & Health Sciences | 0 | 0.0% |
| Psychology | 0 | 0.0% |
| Social Sciences | 0 | 0.0% |
| Engineering | 0 | 0.0% |
| Multidisciplinary Studies | 0 | 0.0% |
| Science & Technology | 0 | 0.0% |
| Business | 0 | 0.0% |
| Education | 0 | 0.0% |
| Literature & Languages | 0 | 0.0% |
| Liberal Arts & History | 0 | 0.0% |
| Visual & Performing Arts | 0 | 0.0% |
| Communications | 0 | 0.0% |
| Arts & Humanities | 0 | 0.0% |
| Total | 0 | 0.0% |
Transportation & Commute in Mappsville
Vehicle Availability by Sex in Mappsville
The most prevalent vehicle ownership categories in Mappsville are males with 2 vehicles (72, accounting for 41.1%) and females with 2 vehicles (79, making up 40.5%).
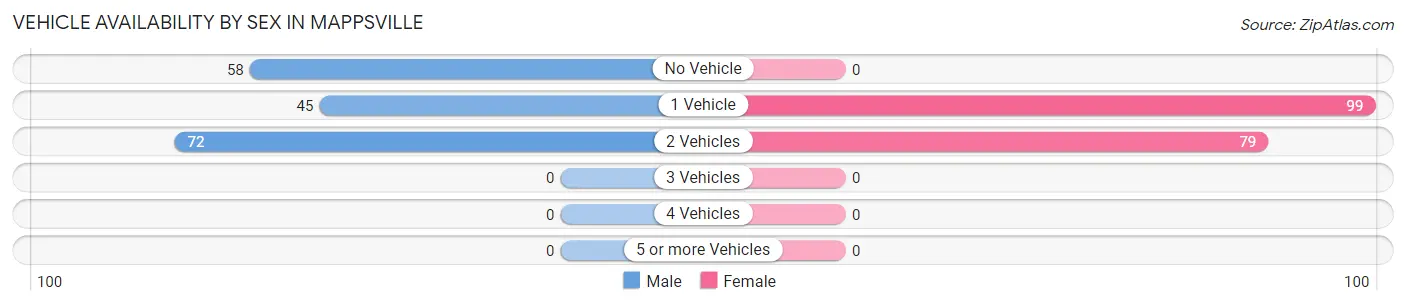
| Vehicles Available | Male | Female |
| No Vehicle | 58 (33.1%) | 0 (0.0%) |
| 1 Vehicle | 45 (25.7%) | 99 (55.6%) |
| 2 Vehicles | 72 (41.1%) | 79 (44.4%) |
| 3 Vehicles | 0 (0.0%) | 0 (0.0%) |
| 4 Vehicles | 0 (0.0%) | 0 (0.0%) |
| 5 or more Vehicles | 0 (0.0%) | 0 (0.0%) |
| Total | 175 (100.0%) | 178 (100.0%) |
Commute Time in Mappsville
The most frequently occuring commute durations in Mappsville are 15 to 19 minutes (258 commuters, 73.1%), 30 to 34 minutes (58 commuters, 16.4%), and 20 to 24 minutes (37 commuters, 10.5%).
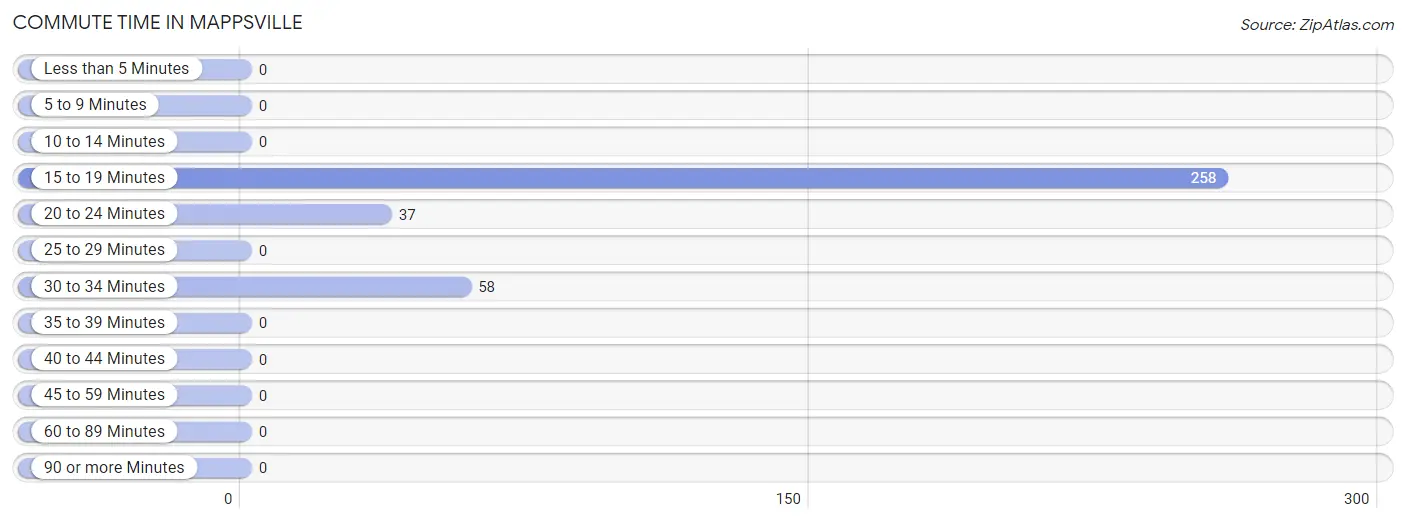
| Commute Time | # Commuters | % Commuters |
| Less than 5 Minutes | 0 | 0.0% |
| 5 to 9 Minutes | 0 | 0.0% |
| 10 to 14 Minutes | 0 | 0.0% |
| 15 to 19 Minutes | 258 | 73.1% |
| 20 to 24 Minutes | 37 | 10.5% |
| 25 to 29 Minutes | 0 | 0.0% |
| 30 to 34 Minutes | 58 | 16.4% |
| 35 to 39 Minutes | 0 | 0.0% |
| 40 to 44 Minutes | 0 | 0.0% |
| 45 to 59 Minutes | 0 | 0.0% |
| 60 to 89 Minutes | 0 | 0.0% |
| 90 or more Minutes | 0 | 0.0% |
Commute Time by Sex in Mappsville
The most common commute times in Mappsville are 15 to 19 minutes (80 commuters, 45.7%) for males and 15 to 19 minutes (178 commuters, 100.0%) for females.
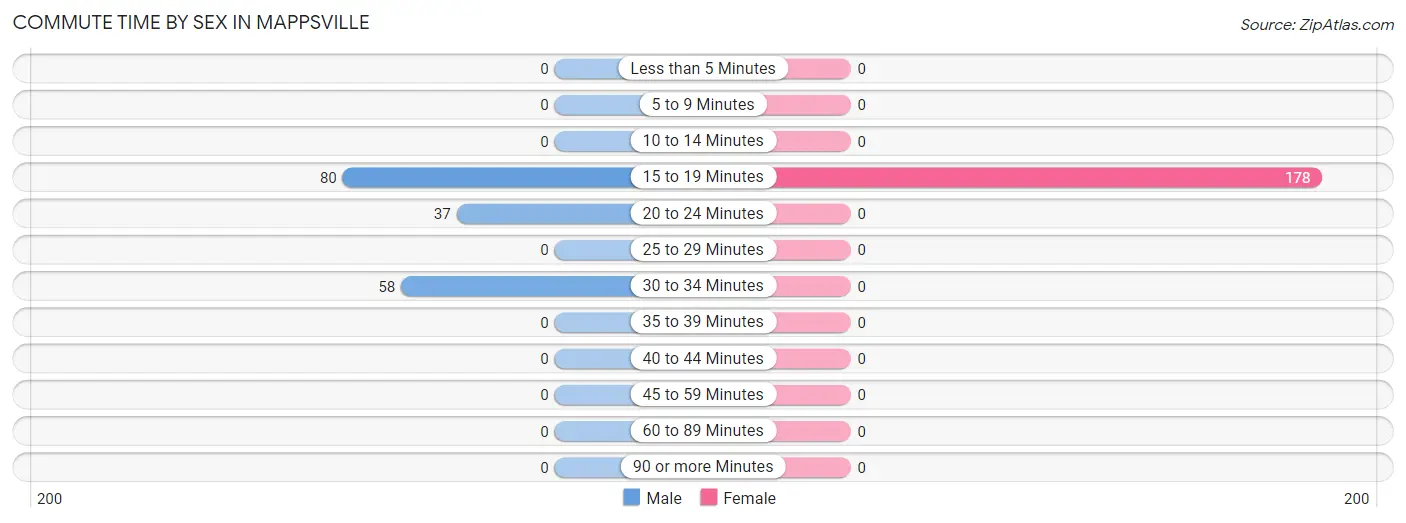
| Commute Time | Male | Female |
| Less than 5 Minutes | 0 (0.0%) | 0 (0.0%) |
| 5 to 9 Minutes | 0 (0.0%) | 0 (0.0%) |
| 10 to 14 Minutes | 0 (0.0%) | 0 (0.0%) |
| 15 to 19 Minutes | 80 (45.7%) | 178 (100.0%) |
| 20 to 24 Minutes | 37 (21.1%) | 0 (0.0%) |
| 25 to 29 Minutes | 0 (0.0%) | 0 (0.0%) |
| 30 to 34 Minutes | 58 (33.1%) | 0 (0.0%) |
| 35 to 39 Minutes | 0 (0.0%) | 0 (0.0%) |
| 40 to 44 Minutes | 0 (0.0%) | 0 (0.0%) |
| 45 to 59 Minutes | 0 (0.0%) | 0 (0.0%) |
| 60 to 89 Minutes | 0 (0.0%) | 0 (0.0%) |
| 90 or more Minutes | 0 (0.0%) | 0 (0.0%) |
Time of Departure to Work by Sex in Mappsville
The most frequent times of departure to work in Mappsville are 7:00 AM to 7:29 AM (58, 33.1%) for males and 12:00 PM to 3:59 PM (99, 55.6%) for females.
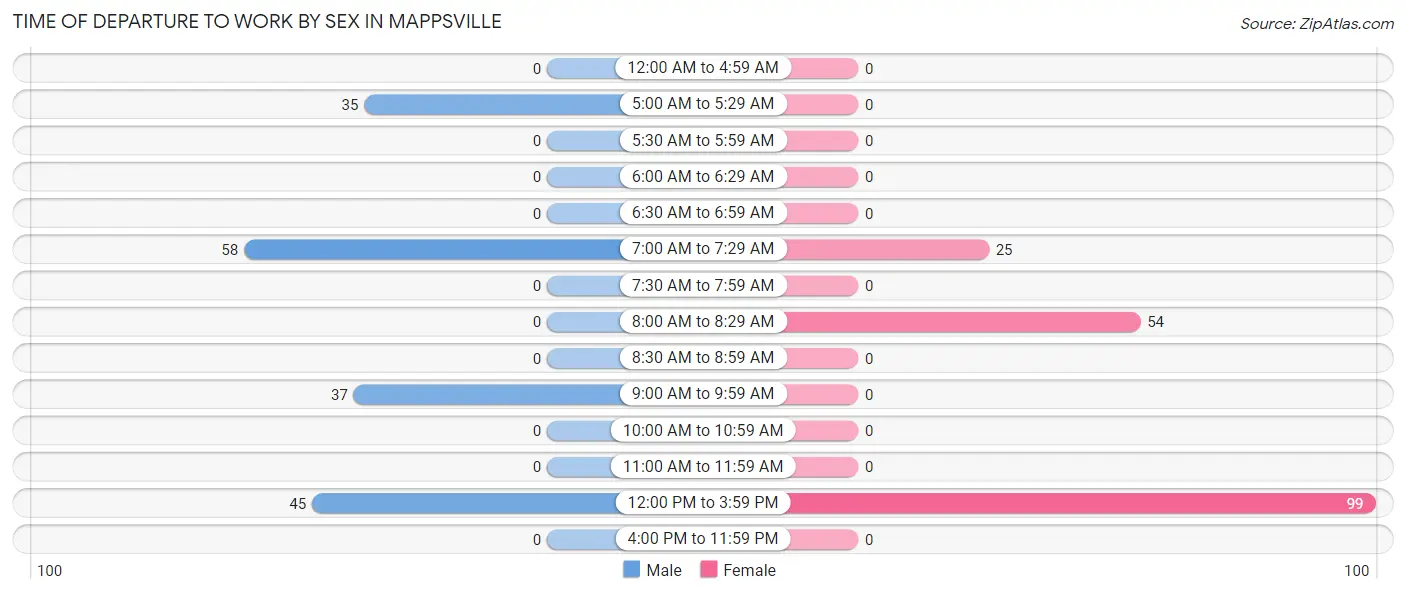
| Time of Departure | Male | Female |
| 12:00 AM to 4:59 AM | 0 (0.0%) | 0 (0.0%) |
| 5:00 AM to 5:29 AM | 35 (20.0%) | 0 (0.0%) |
| 5:30 AM to 5:59 AM | 0 (0.0%) | 0 (0.0%) |
| 6:00 AM to 6:29 AM | 0 (0.0%) | 0 (0.0%) |
| 6:30 AM to 6:59 AM | 0 (0.0%) | 0 (0.0%) |
| 7:00 AM to 7:29 AM | 58 (33.1%) | 25 (14.0%) |
| 7:30 AM to 7:59 AM | 0 (0.0%) | 0 (0.0%) |
| 8:00 AM to 8:29 AM | 0 (0.0%) | 54 (30.3%) |
| 8:30 AM to 8:59 AM | 0 (0.0%) | 0 (0.0%) |
| 9:00 AM to 9:59 AM | 37 (21.1%) | 0 (0.0%) |
| 10:00 AM to 10:59 AM | 0 (0.0%) | 0 (0.0%) |
| 11:00 AM to 11:59 AM | 0 (0.0%) | 0 (0.0%) |
| 12:00 PM to 3:59 PM | 45 (25.7%) | 99 (55.6%) |
| 4:00 PM to 11:59 PM | 0 (0.0%) | 0 (0.0%) |
| Total | 175 (100.0%) | 178 (100.0%) |
Housing Occupancy in Mappsville
Occupancy by Ownership in Mappsville
Of the total 178 dwellings in Mappsville, owner-occupied units account for 54 (30.3%), while renter-occupied units make up 124 (69.7%).
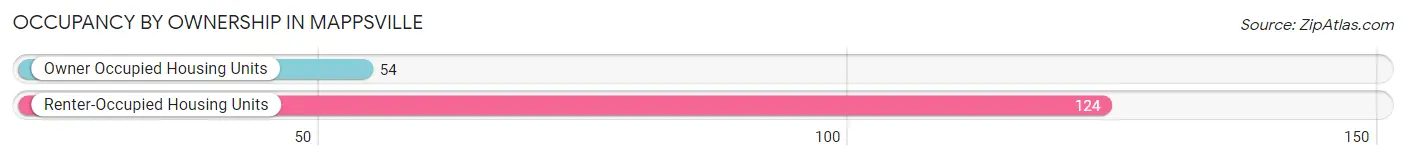
| Occupancy | # Housing Units | % Housing Units |
| Owner Occupied Housing Units | 54 | 30.3% |
| Renter-Occupied Housing Units | 124 | 69.7% |
| Total Occupied Housing Units | 178 | 100.0% |
Occupancy by Household Size in Mappsville
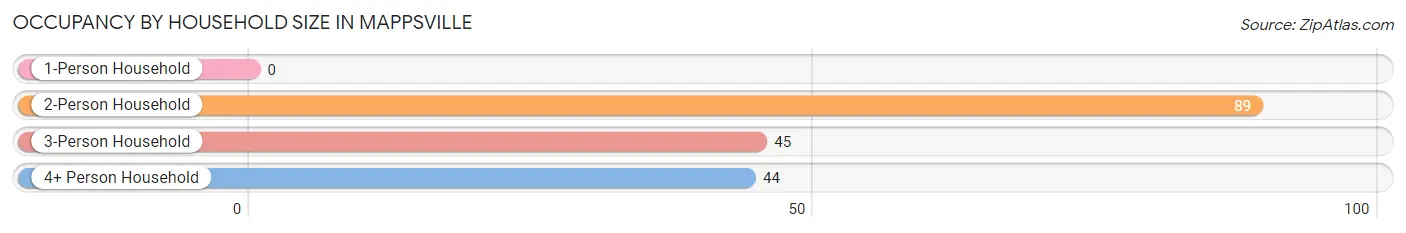
| Household Size | # Housing Units | % Housing Units |
| 1-Person Household | 0 | 0.0% |
| 2-Person Household | 89 | 50.0% |
| 3-Person Household | 45 | 25.3% |
| 4+ Person Household | 44 | 24.7% |
| Total Housing Units | 178 | 100.0% |
Occupancy by Ownership by Household Size in Mappsville
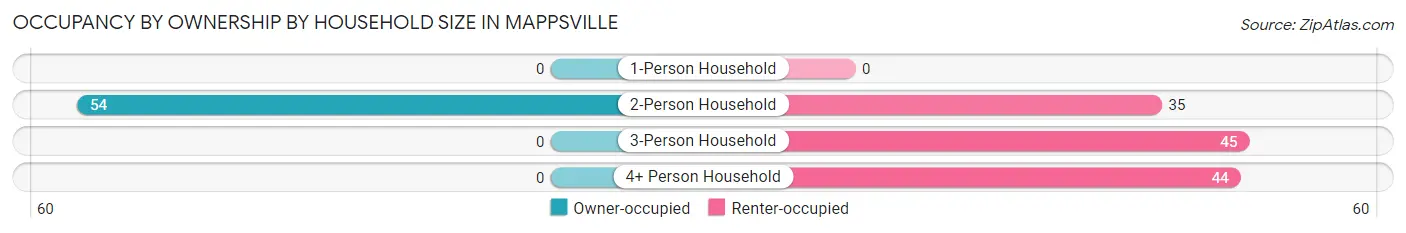
| Household Size | Owner-occupied | Renter-occupied |
| 1-Person Household | 0 (0.0%) | 0 (0.0%) |
| 2-Person Household | 54 (60.7%) | 35 (39.3%) |
| 3-Person Household | 0 (0.0%) | 45 (100.0%) |
| 4+ Person Household | 0 (0.0%) | 44 (100.0%) |
| Total Housing Units | 54 (30.3%) | 124 (69.7%) |
Occupancy by Educational Attainment in Mappsville
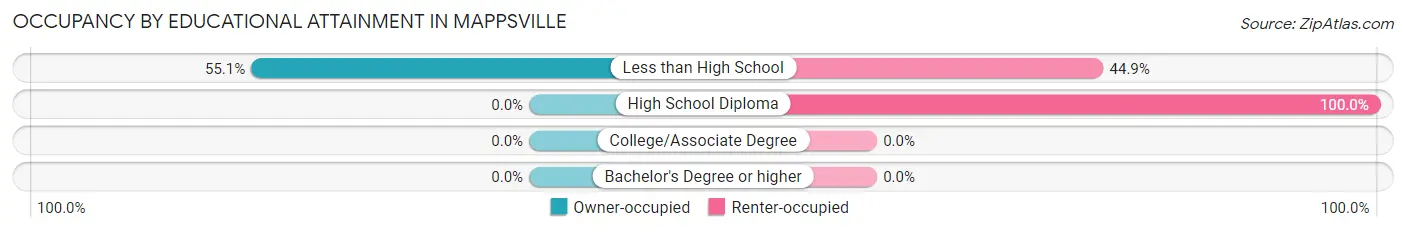
| Household Size | Owner-occupied | Renter-occupied |
| Less than High School | 54 (55.1%) | 44 (44.9%) |
| High School Diploma | 0 (0.0%) | 80 (100.0%) |
| College/Associate Degree | 0 (0.0%) | 0 (0.0%) |
| Bachelor's Degree or higher | 0 (0.0%) | 0 (0.0%) |
Occupancy by Age of Householder in Mappsville
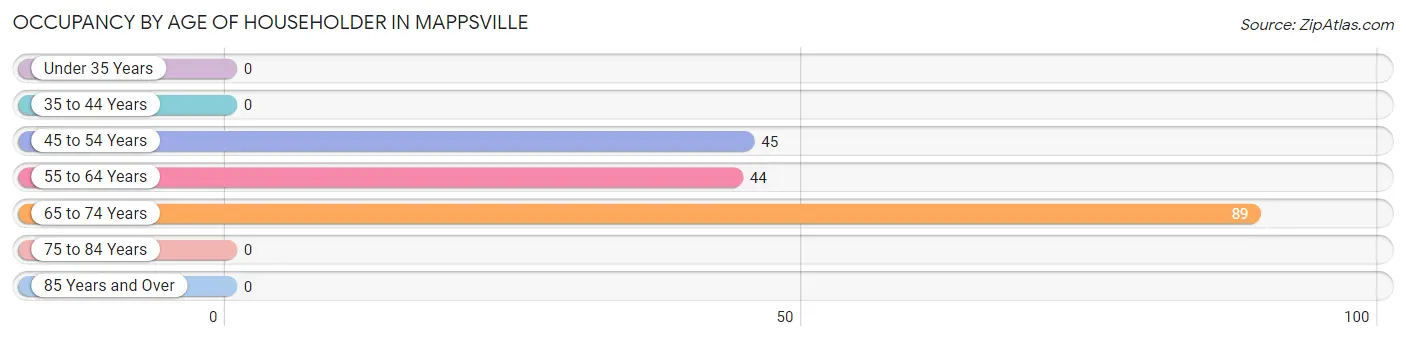
| Age Bracket | # Households | % Households |
| Under 35 Years | 0 | 0.0% |
| 35 to 44 Years | 0 | 0.0% |
| 45 to 54 Years | 45 | 25.3% |
| 55 to 64 Years | 44 | 24.7% |
| 65 to 74 Years | 89 | 50.0% |
| 75 to 84 Years | 0 | 0.0% |
| 85 Years and Over | 0 | 0.0% |
| Total | 178 | 100.0% |
Housing Finances in Mappsville
Median Income by Occupancy in Mappsville
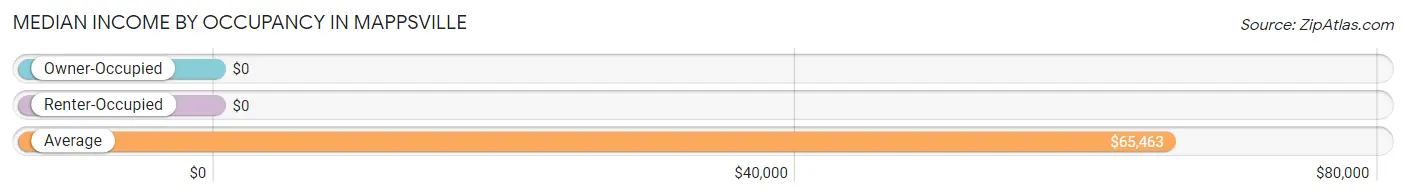
| Occupancy Type | # Households | Median Income |
| Owner-Occupied | 54 (30.3%) | $0 |
| Renter-Occupied | 124 (69.7%) | $0 |
| Average | 178 (100.0%) | $65,463 |
Occupancy by Householder Income Bracket in Mappsville
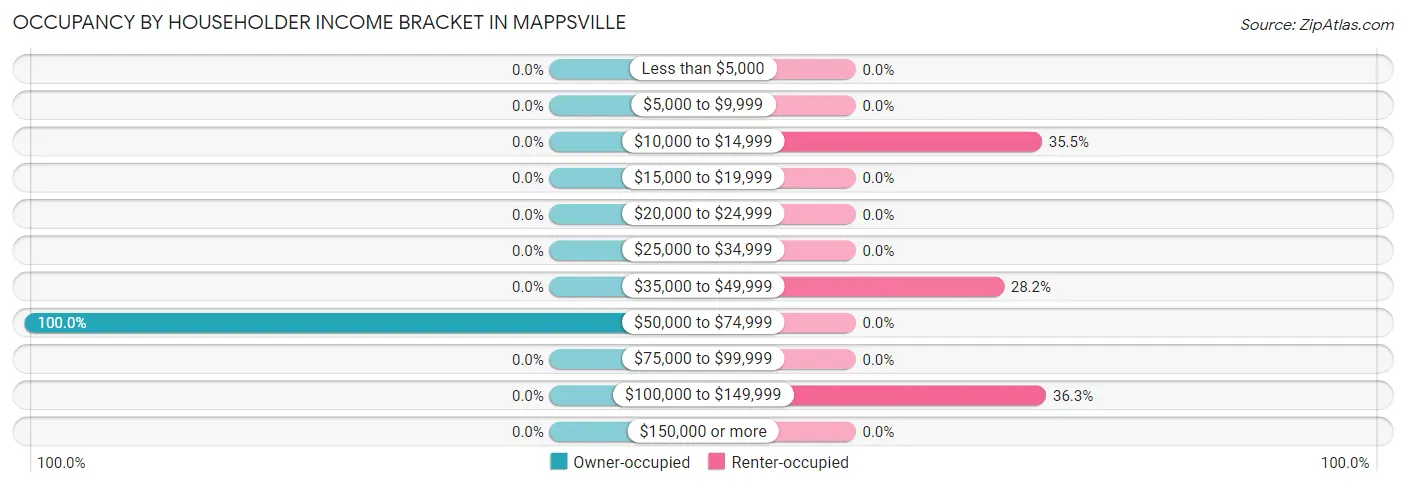
| Income Bracket | Owner-occupied | Renter-occupied |
| Less than $5,000 | 0 (0.0%) | 0 (0.0%) |
| $5,000 to $9,999 | 0 (0.0%) | 0 (0.0%) |
| $10,000 to $14,999 | 0 (0.0%) | 44 (35.5%) |
| $15,000 to $19,999 | 0 (0.0%) | 0 (0.0%) |
| $20,000 to $24,999 | 0 (0.0%) | 0 (0.0%) |
| $25,000 to $34,999 | 0 (0.0%) | 0 (0.0%) |
| $35,000 to $49,999 | 0 (0.0%) | 35 (28.2%) |
| $50,000 to $74,999 | 54 (100.0%) | 0 (0.0%) |
| $75,000 to $99,999 | 0 (0.0%) | 0 (0.0%) |
| $100,000 to $149,999 | 0 (0.0%) | 45 (36.3%) |
| $150,000 or more | 0 (0.0%) | 0 (0.0%) |
| Total | 54 (100.0%) | 124 (100.0%) |
Monthly Housing Cost Tiers in Mappsville
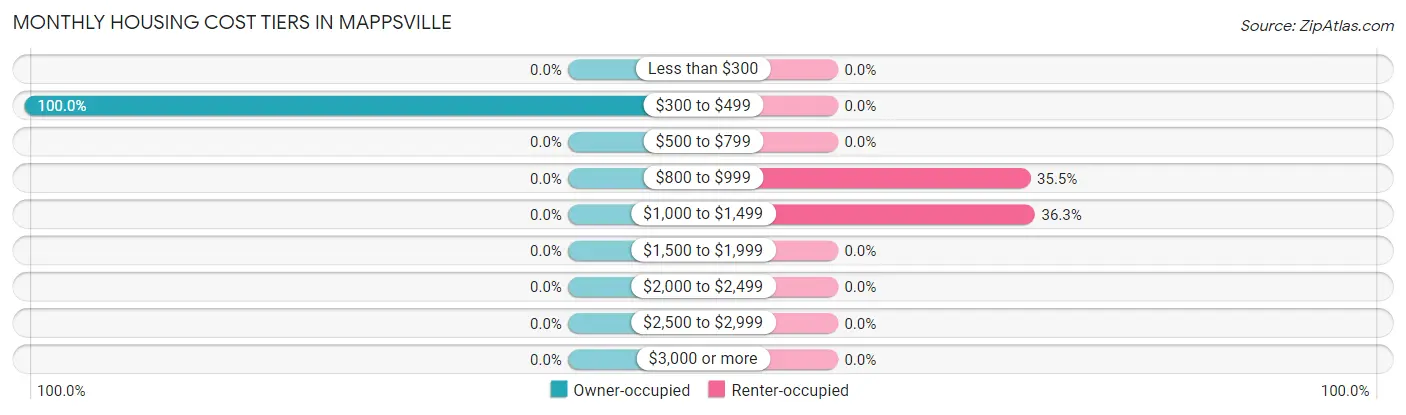
| Monthly Cost | Owner-occupied | Renter-occupied |
| Less than $300 | 0 (0.0%) | 0 (0.0%) |
| $300 to $499 | 54 (100.0%) | 0 (0.0%) |
| $500 to $799 | 0 (0.0%) | 0 (0.0%) |
| $800 to $999 | 0 (0.0%) | 44 (35.5%) |
| $1,000 to $1,499 | 0 (0.0%) | 45 (36.3%) |
| $1,500 to $1,999 | 0 (0.0%) | 0 (0.0%) |
| $2,000 to $2,499 | 0 (0.0%) | 0 (0.0%) |
| $2,500 to $2,999 | 0 (0.0%) | 0 (0.0%) |
| $3,000 or more | 0 (0.0%) | 0 (0.0%) |
| Total | 54 (100.0%) | 124 (100.0%) |
Physical Housing Characteristics in Mappsville
Housing Structures in Mappsville
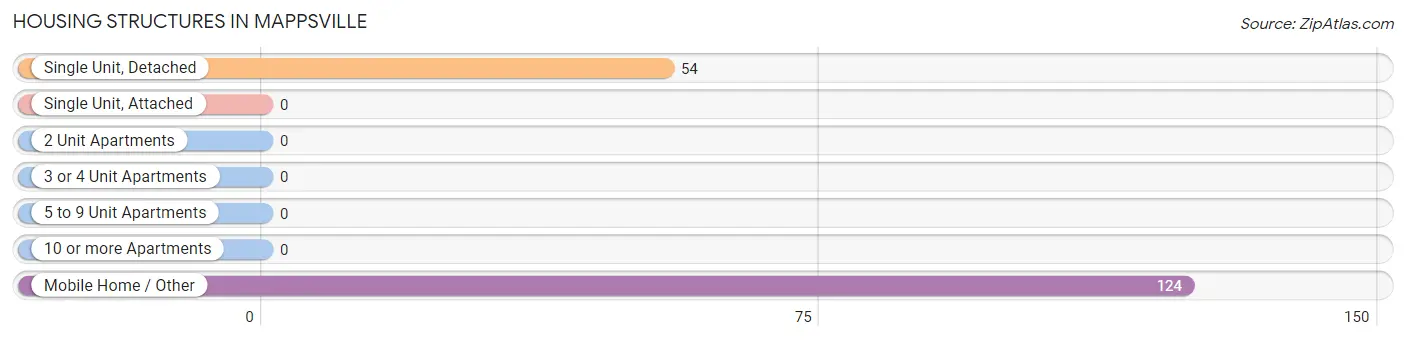
| Structure Type | # Housing Units | % Housing Units |
| Single Unit, Detached | 54 | 30.3% |
| Single Unit, Attached | 0 | 0.0% |
| 2 Unit Apartments | 0 | 0.0% |
| 3 or 4 Unit Apartments | 0 | 0.0% |
| 5 to 9 Unit Apartments | 0 | 0.0% |
| 10 or more Apartments | 0 | 0.0% |
| Mobile Home / Other | 124 | 69.7% |
| Total | 178 | 100.0% |
Housing Structures by Occupancy in Mappsville
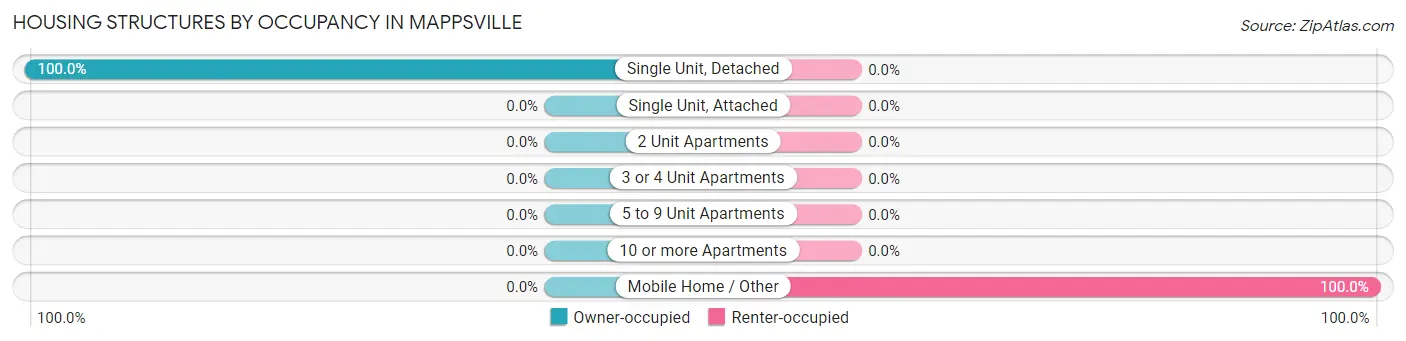
| Structure Type | Owner-occupied | Renter-occupied |
| Single Unit, Detached | 54 (100.0%) | 0 (0.0%) |
| Single Unit, Attached | 0 (0.0%) | 0 (0.0%) |
| 2 Unit Apartments | 0 (0.0%) | 0 (0.0%) |
| 3 or 4 Unit Apartments | 0 (0.0%) | 0 (0.0%) |
| 5 to 9 Unit Apartments | 0 (0.0%) | 0 (0.0%) |
| 10 or more Apartments | 0 (0.0%) | 0 (0.0%) |
| Mobile Home / Other | 0 (0.0%) | 124 (100.0%) |
| Total | 54 (30.3%) | 124 (69.7%) |
Housing Structures by Number of Rooms in Mappsville
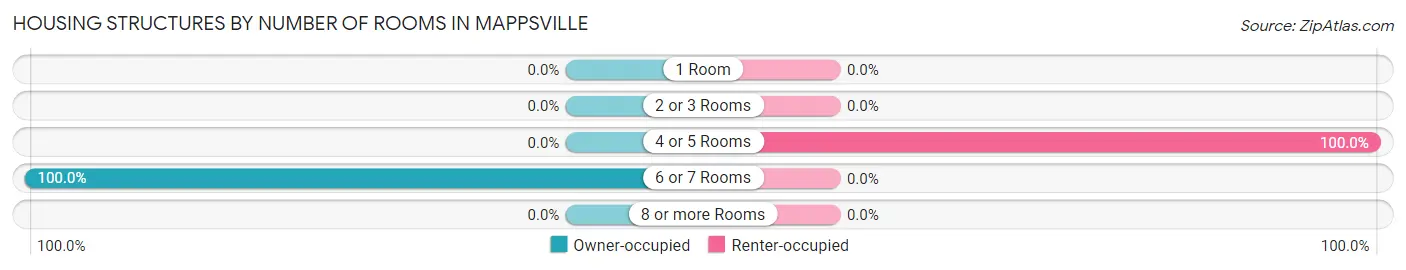
| Number of Rooms | Owner-occupied | Renter-occupied |
| 1 Room | 0 (0.0%) | 0 (0.0%) |
| 2 or 3 Rooms | 0 (0.0%) | 0 (0.0%) |
| 4 or 5 Rooms | 0 (0.0%) | 124 (100.0%) |
| 6 or 7 Rooms | 54 (100.0%) | 0 (0.0%) |
| 8 or more Rooms | 0 (0.0%) | 0 (0.0%) |
| Total | 54 (100.0%) | 124 (100.0%) |
Housing Structure by Heating Type in Mappsville
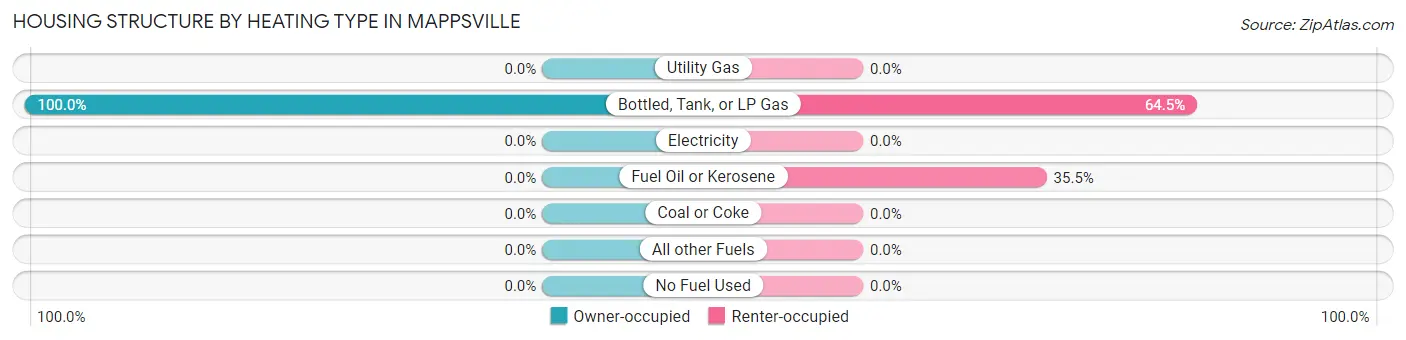
| Heating Type | Owner-occupied | Renter-occupied |
| Utility Gas | 0 (0.0%) | 0 (0.0%) |
| Bottled, Tank, or LP Gas | 54 (100.0%) | 80 (64.5%) |
| Electricity | 0 (0.0%) | 0 (0.0%) |
| Fuel Oil or Kerosene | 0 (0.0%) | 44 (35.5%) |
| Coal or Coke | 0 (0.0%) | 0 (0.0%) |
| All other Fuels | 0 (0.0%) | 0 (0.0%) |
| No Fuel Used | 0 (0.0%) | 0 (0.0%) |
| Total | 54 (100.0%) | 124 (100.0%) |
Household Vehicle Usage in Mappsville
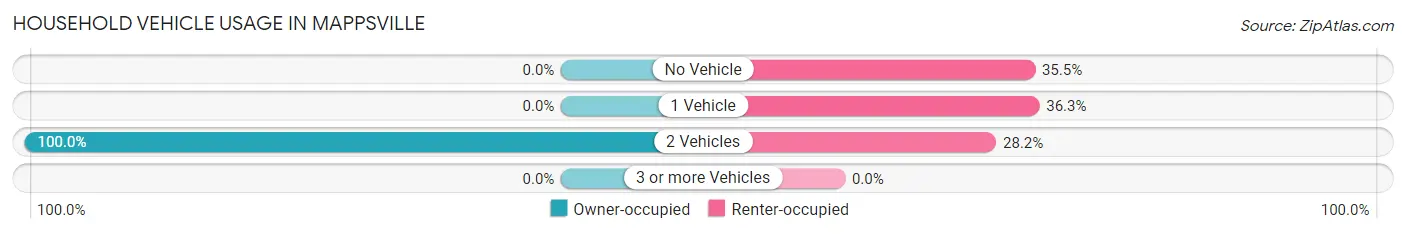
| Vehicles per Household | Owner-occupied | Renter-occupied |
| No Vehicle | 0 (0.0%) | 44 (35.5%) |
| 1 Vehicle | 0 (0.0%) | 45 (36.3%) |
| 2 Vehicles | 54 (100.0%) | 35 (28.2%) |
| 3 or more Vehicles | 0 (0.0%) | 0 (0.0%) |
| Total | 54 (100.0%) | 124 (100.0%) |
Real Estate & Mortgages in Mappsville
Real Estate and Mortgage Overview in Mappsville
| Characteristic | Without Mortgage | With Mortgage |
| Housing Units | 54 | 0 |
| Median Property Value | - | - |
| Median Household Income | - | - |
| Monthly Housing Costs | - | - |
| Real Estate Taxes | - | - |
Property Value by Mortgage Status in Mappsville
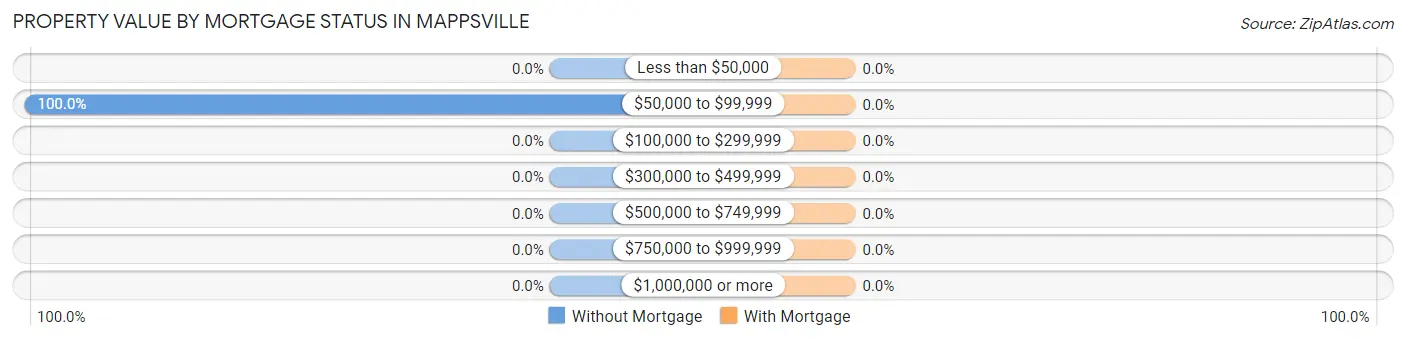
| Property Value | Without Mortgage | With Mortgage |
| Less than $50,000 | 0 (0.0%) | 0 (0.0%) |
| $50,000 to $99,999 | 54 (100.0%) | 0 (0.0%) |
| $100,000 to $299,999 | 0 (0.0%) | 0 (0.0%) |
| $300,000 to $499,999 | 0 (0.0%) | 0 (0.0%) |
| $500,000 to $749,999 | 0 (0.0%) | 0 (0.0%) |
| $750,000 to $999,999 | 0 (0.0%) | 0 (0.0%) |
| $1,000,000 or more | 0 (0.0%) | 0 (0.0%) |
| Total | 54 (100.0%) | 0 (0.0%) |
Household Income by Mortgage Status in Mappsville
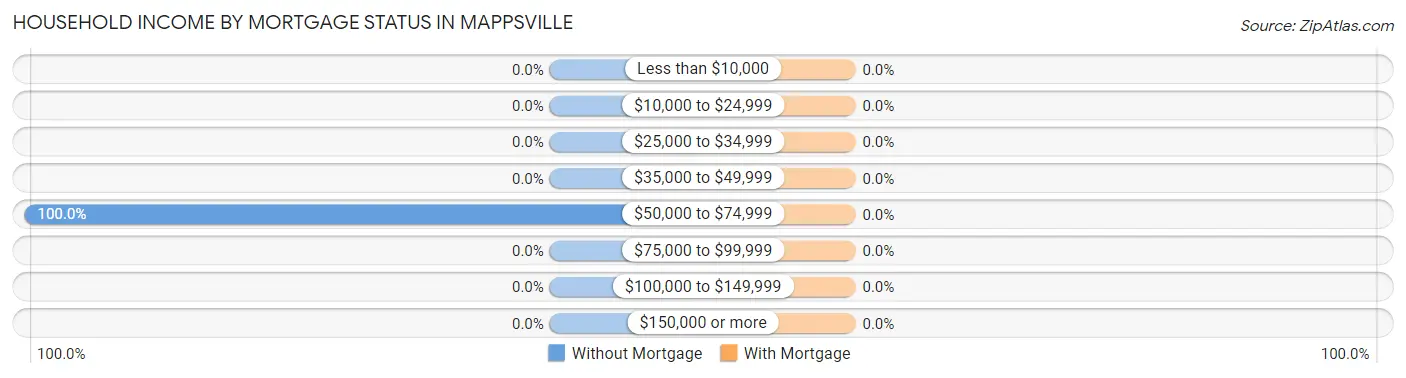
| Household Income | Without Mortgage | With Mortgage |
| Less than $10,000 | 0 (0.0%) | 0 (0.0%) |
| $10,000 to $24,999 | 0 (0.0%) | 0 (0.0%) |
| $25,000 to $34,999 | 0 (0.0%) | 0 (0.0%) |
| $35,000 to $49,999 | 0 (0.0%) | 0 (0.0%) |
| $50,000 to $74,999 | 54 (100.0%) | 0 (0.0%) |
| $75,000 to $99,999 | 0 (0.0%) | 0 (0.0%) |
| $100,000 to $149,999 | 0 (0.0%) | 0 (0.0%) |
| $150,000 or more | 0 (0.0%) | 0 (0.0%) |
| Total | 54 (100.0%) | 0 (0.0%) |
Property Value to Household Income Ratio in Mappsville
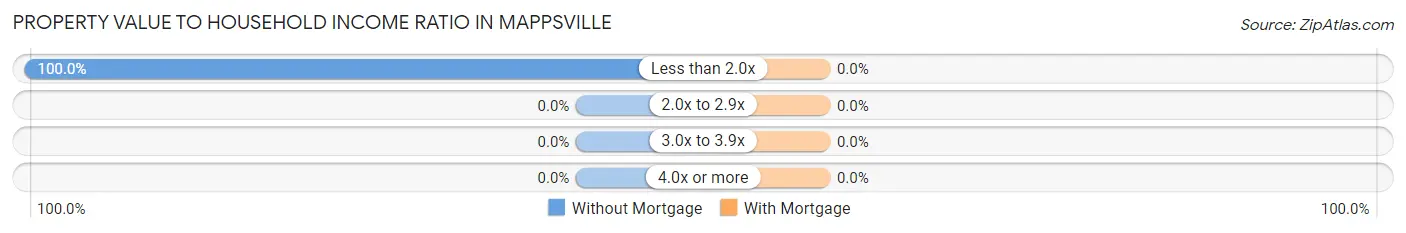
| Value-to-Income Ratio | Without Mortgage | With Mortgage |
| Less than 2.0x | 54 (100.0%) | 0 (0.0%) |
| 2.0x to 2.9x | 0 (0.0%) | 0 (0.0%) |
| 3.0x to 3.9x | 0 (0.0%) | 0 (0.0%) |
| 4.0x or more | 0 (0.0%) | 0 (0.0%) |
| Total | 54 (100.0%) | 0 (0.0%) |
Real Estate Taxes by Mortgage Status in Mappsville
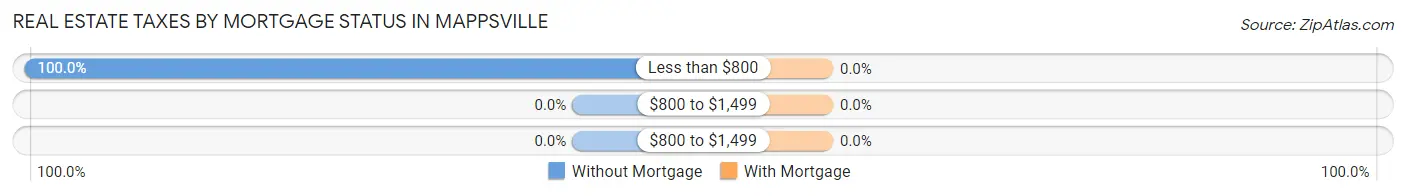
| Property Taxes | Without Mortgage | With Mortgage |
| Less than $800 | 54 (100.0%) | 0 (0.0%) |
| $800 to $1,499 | 0 (0.0%) | 0 (0.0%) |
| $800 to $1,499 | 0 (0.0%) | 0 (0.0%) |
| Total | 54 (100.0%) | 0 (0.0%) |
Health & Disability in Mappsville
Health Insurance Coverage by Age in Mappsville
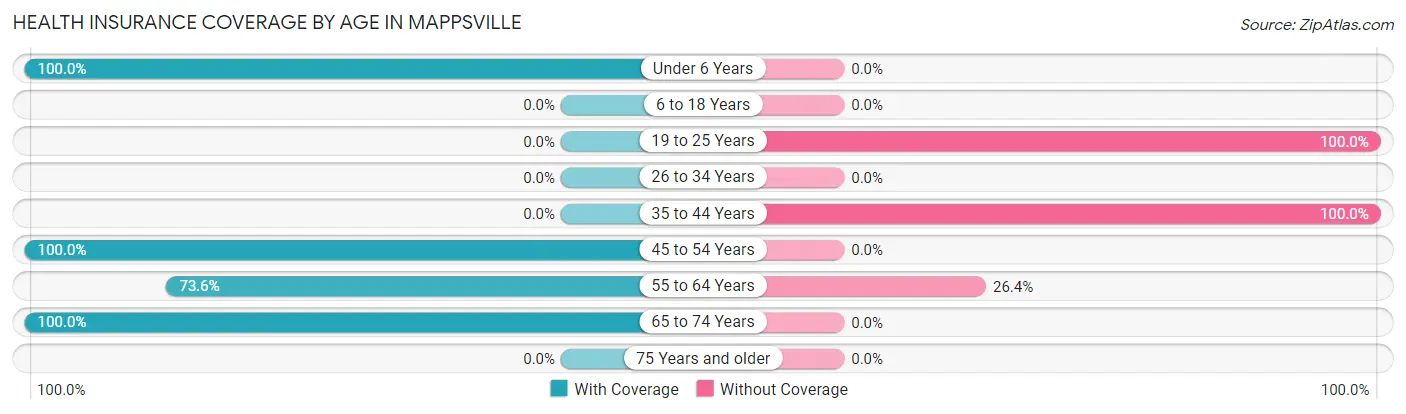
| Age Bracket | With Coverage | Without Coverage |
| Under 6 Years | 48 (100.0%) | 0 (0.0%) |
| 6 to 18 Years | 0 (0.0%) | 0 (0.0%) |
| 19 to 25 Years | 0 (0.0%) | 65 (100.0%) |
| 26 to 34 Years | 0 (0.0%) | 0 (0.0%) |
| 35 to 44 Years | 0 (0.0%) | 58 (100.0%) |
| 45 to 54 Years | 45 (100.0%) | 0 (0.0%) |
| 55 to 64 Years | 103 (73.6%) | 37 (26.4%) |
| 65 to 74 Years | 89 (100.0%) | 0 (0.0%) |
| 75 Years and older | 0 (0.0%) | 0 (0.0%) |
| Total | 285 (64.0%) | 160 (36.0%) |
Health Insurance Coverage by Citizenship Status in Mappsville
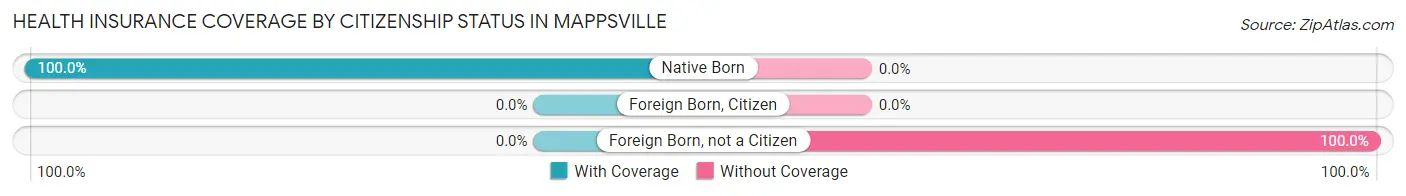
| Citizenship Status | With Coverage | Without Coverage |
| Native Born | 48 (100.0%) | 0 (0.0%) |
| Foreign Born, Citizen | 0 (0.0%) | 0 (0.0%) |
| Foreign Born, not a Citizen | 0 (0.0%) | 65 (100.0%) |
Health Insurance Coverage by Household Income in Mappsville
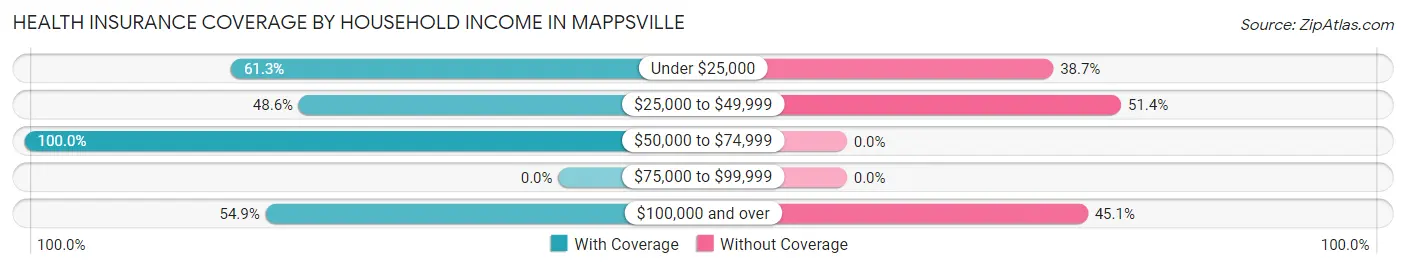
| Household Income | With Coverage | Without Coverage |
| Under $25,000 | 92 (61.3%) | 58 (38.7%) |
| $25,000 to $49,999 | 35 (48.6%) | 37 (51.4%) |
| $50,000 to $74,999 | 79 (100.0%) | 0 (0.0%) |
| $75,000 to $99,999 | 0 (0.0%) | 0 (0.0%) |
| $100,000 and over | 79 (54.9%) | 65 (45.1%) |
Public vs Private Health Insurance Coverage by Age in Mappsville
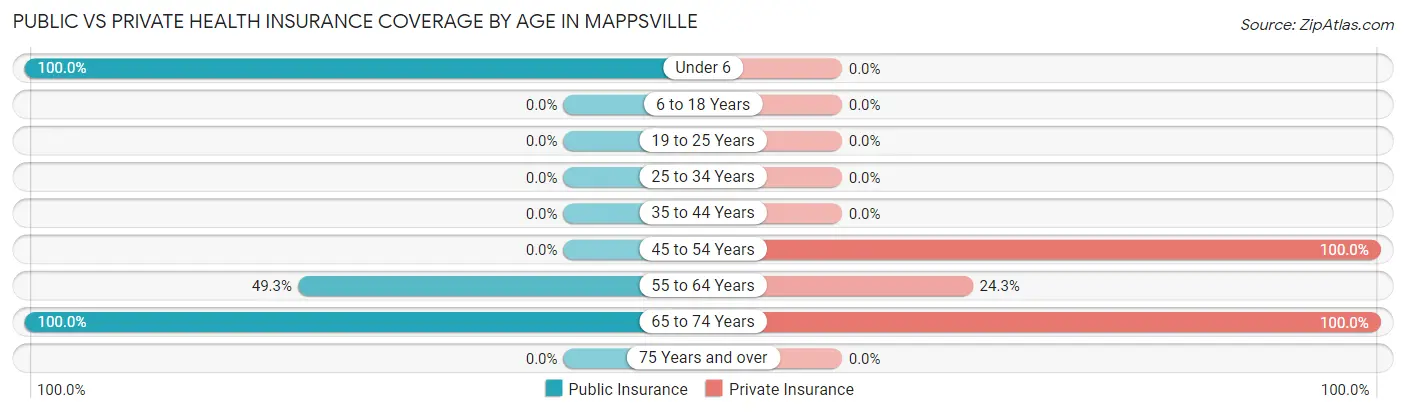
| Age Bracket | Public Insurance | Private Insurance |
| Under 6 | 48 (100.0%) | 0 (0.0%) |
| 6 to 18 Years | 0 (0.0%) | 0 (0.0%) |
| 19 to 25 Years | 0 (0.0%) | 0 (0.0%) |
| 25 to 34 Years | 0 (0.0%) | 0 (0.0%) |
| 35 to 44 Years | 0 (0.0%) | 0 (0.0%) |
| 45 to 54 Years | 0 (0.0%) | 45 (100.0%) |
| 55 to 64 Years | 69 (49.3%) | 34 (24.3%) |
| 65 to 74 Years | 89 (100.0%) | 89 (100.0%) |
| 75 Years and over | 0 (0.0%) | 0 (0.0%) |
| Total | 206 (46.3%) | 168 (37.8%) |
Disability Status by Sex by Age in Mappsville
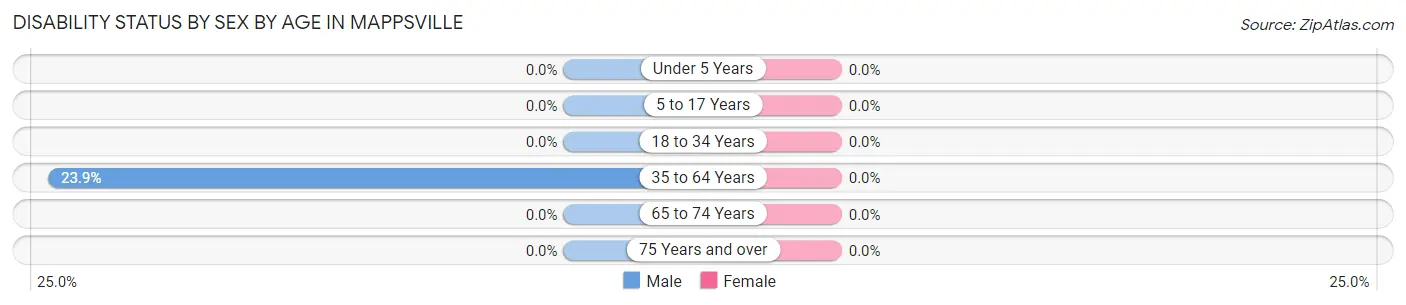
| Age Bracket | Male | Female |
| Under 5 Years | 0 (0.0%) | 0 (0.0%) |
| 5 to 17 Years | 0 (0.0%) | 0 (0.0%) |
| 18 to 34 Years | 0 (0.0%) | 0 (0.0%) |
| 35 to 64 Years | 44 (23.9%) | 0 (0.0%) |
| 65 to 74 Years | 0 (0.0%) | 0 (0.0%) |
| 75 Years and over | 0 (0.0%) | 0 (0.0%) |
Disability Class by Sex by Age in Mappsville
Disability Class: Hearing Difficulty
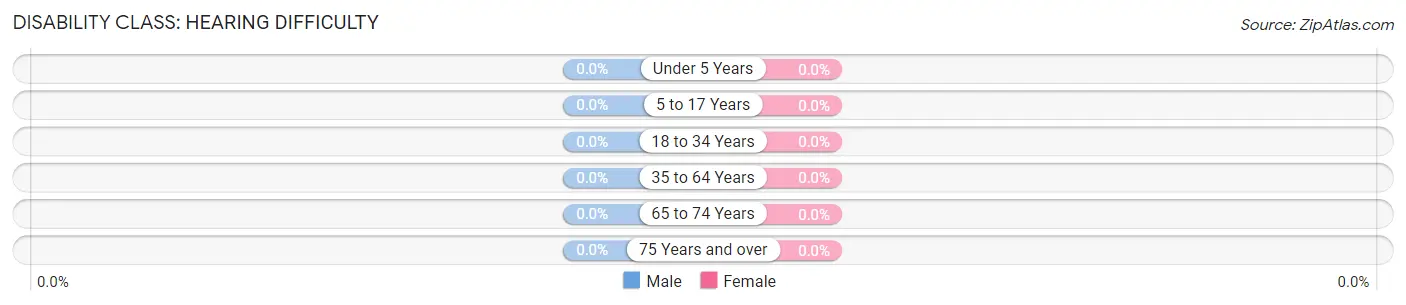
| Age Bracket | Male | Female |
| Under 5 Years | 0 (0.0%) | 0 (0.0%) |
| 5 to 17 Years | 0 (0.0%) | 0 (0.0%) |
| 18 to 34 Years | 0 (0.0%) | 0 (0.0%) |
| 35 to 64 Years | 0 (0.0%) | 0 (0.0%) |
| 65 to 74 Years | 0 (0.0%) | 0 (0.0%) |
| 75 Years and over | 0 (0.0%) | 0 (0.0%) |
Disability Class: Vision Difficulty
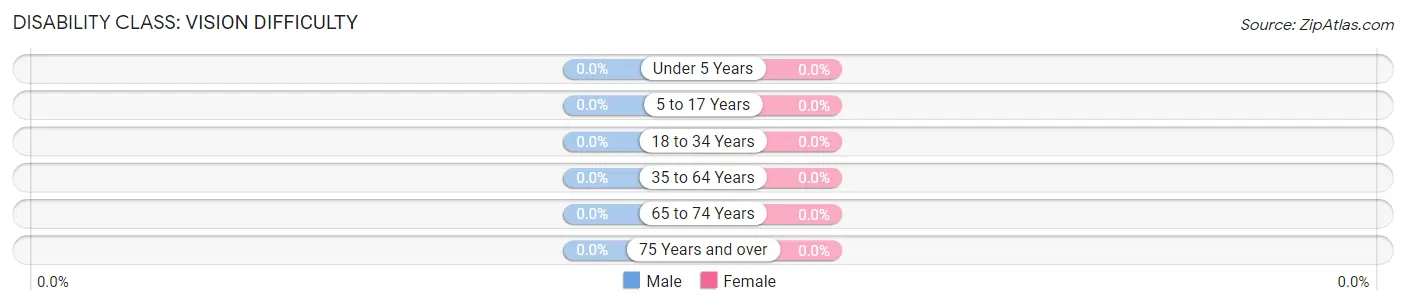
| Age Bracket | Male | Female |
| Under 5 Years | 0 (0.0%) | 0 (0.0%) |
| 5 to 17 Years | 0 (0.0%) | 0 (0.0%) |
| 18 to 34 Years | 0 (0.0%) | 0 (0.0%) |
| 35 to 64 Years | 0 (0.0%) | 0 (0.0%) |
| 65 to 74 Years | 0 (0.0%) | 0 (0.0%) |
| 75 Years and over | 0 (0.0%) | 0 (0.0%) |
Disability Class: Cognitive Difficulty

| Age Bracket | Male | Female |
| 5 to 17 Years | 0 (0.0%) | 0 (0.0%) |
| 18 to 34 Years | 0 (0.0%) | 0 (0.0%) |
| 35 to 64 Years | 0 (0.0%) | 0 (0.0%) |
| 65 to 74 Years | 0 (0.0%) | 0 (0.0%) |
| 75 Years and over | 0 (0.0%) | 0 (0.0%) |
Disability Class: Ambulatory Difficulty
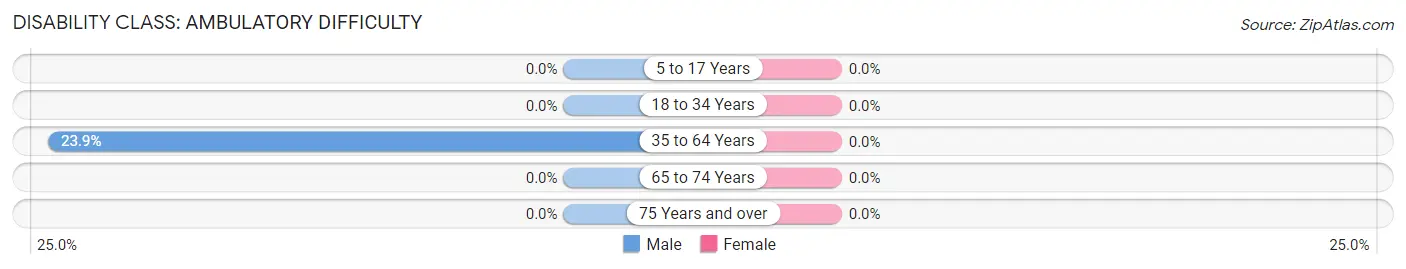
| Age Bracket | Male | Female |
| 5 to 17 Years | 0 (0.0%) | 0 (0.0%) |
| 18 to 34 Years | 0 (0.0%) | 0 (0.0%) |
| 35 to 64 Years | 44 (23.9%) | 0 (0.0%) |
| 65 to 74 Years | 0 (0.0%) | 0 (0.0%) |
| 75 Years and over | 0 (0.0%) | 0 (0.0%) |
Disability Class: Self-Care Difficulty
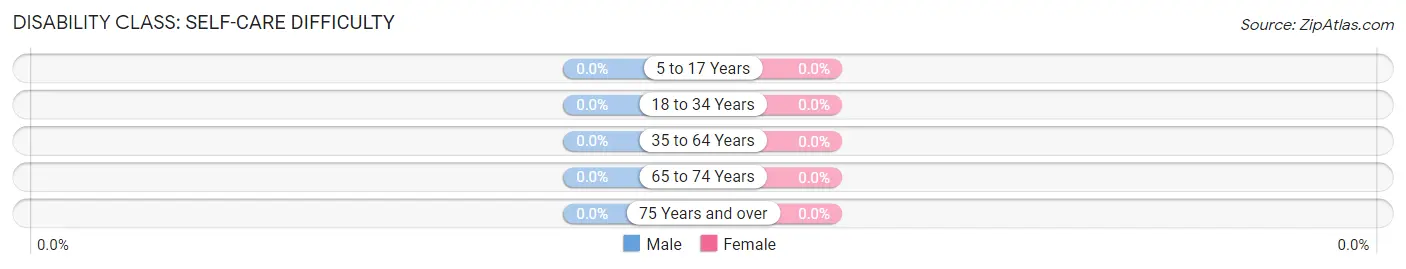
| Age Bracket | Male | Female |
| 5 to 17 Years | 0 (0.0%) | 0 (0.0%) |
| 18 to 34 Years | 0 (0.0%) | 0 (0.0%) |
| 35 to 64 Years | 0 (0.0%) | 0 (0.0%) |
| 65 to 74 Years | 0 (0.0%) | 0 (0.0%) |
| 75 Years and over | 0 (0.0%) | 0 (0.0%) |
Technology Access in Mappsville
Computing Device Access in Mappsville
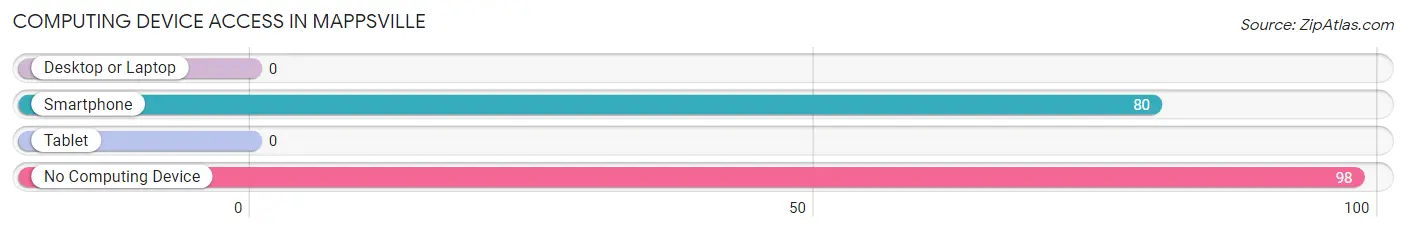
| Device Type | # Households | % Households |
| Desktop or Laptop | 0 | 0.0% |
| Smartphone | 80 | 44.9% |
| Tablet | 0 | 0.0% |
| No Computing Device | 98 | 55.1% |
| Total | 178 | 100.0% |
Internet Access in Mappsville
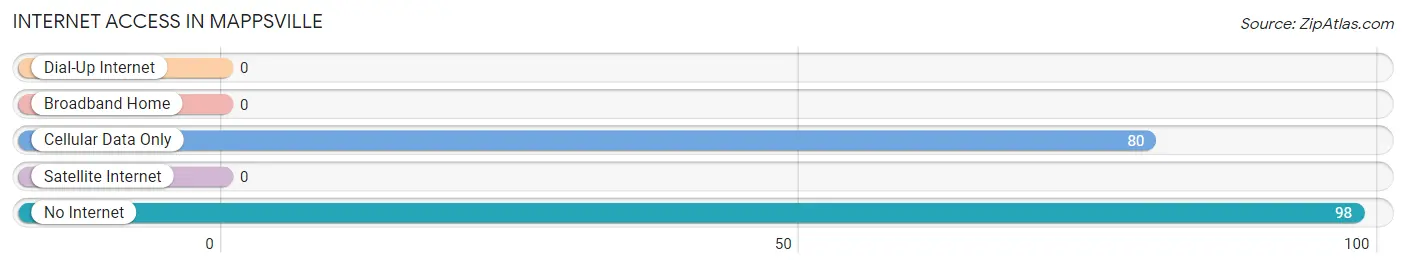
| Internet Type | # Households | % Households |
| Dial-Up Internet | 0 | 0.0% |
| Broadband Home | 0 | 0.0% |
| Cellular Data Only | 80 | 44.9% |
| Satellite Internet | 0 | 0.0% |
| No Internet | 98 | 55.1% |
| Total | 178 | 100.0% |
Mappsville Summary
Mappsville, Virginia is a small unincorporated community located in Northampton County, Virginia. It is situated on the Eastern Shore of Virginia, approximately 20 miles south of the Chesapeake Bay Bridge-Tunnel. The population of Mappsville was estimated to be around 500 people in 2000.
History
Mappsville was first settled in the early 1700s by the Mapp family, who were among the first settlers of Northampton County. The Mapp family owned a large plantation in the area, and the town was named after them. The town was officially established in 1820, and the first post office was established in 1821.
In the late 1800s, Mappsville was a thriving agricultural community. The town was home to several farms, a general store, a blacksmith shop, and a sawmill. The town also had a school, a church, and a post office.
In the early 1900s, Mappsville began to decline as the agricultural industry shifted away from the area. The town’s population began to decline, and many of the businesses closed. In the 1950s, the town was almost completely abandoned.
In the late 1970s, Mappsville began to experience a resurgence. The town was revitalized by the opening of a new seafood processing plant, which brought new jobs and economic activity to the area. The town also experienced a population increase as people moved to the area to take advantage of the new jobs.
Geography
Mappsville is located in Northampton County, Virginia, on the Eastern Shore of Virginia. The town is situated on the south side of the Chesapeake Bay, approximately 20 miles south of the Chesapeake Bay Bridge-Tunnel. The town is bordered by the towns of Exmore, Nassawadox, and Cheriton.
The town is located in a rural area, and is surrounded by farmland and forests. The town is located near several bodies of water, including the Chesapeake Bay, the Atlantic Ocean, and the Chesapeake Bay Bridge-Tunnel.
Economy
Mappsville’s economy is largely based on agriculture and seafood processing. The town is home to several farms, and the surrounding area is used for growing crops such as corn, soybeans, and wheat. The town is also home to a seafood processing plant, which processes and packages seafood for distribution throughout the region.
The town also has several small businesses, including a general store, a hardware store, and a few restaurants. The town also has a post office, a bank, and a library.
Demographics
As of the 2000 census, the population of Mappsville was estimated to be around 500 people. The town is predominantly white, with a small African American population. The median household income in Mappsville is around $30,000, and the median home value is around $90,000. The town has a high rate of poverty, with around 25% of the population living below the poverty line.
Common Questions
What is Per Capita Income in Mappsville?
Per Capita income in Mappsville is $21,169.
What is the Median Family Income in Mappsville?
Median Family Income in Mappsville is $65,463.
What is the Median Household income in Mappsville?
Median Household Income in Mappsville is $65,463.
What is Inequality or Gini Index in Mappsville?
Inequality or Gini Index in Mappsville is 0.34.
What is the Total Population of Mappsville?
Total Population of Mappsville is 445.
What is the Total Male Population of Mappsville?
Total Male Population of Mappsville is 267.
What is the Total Female Population of Mappsville?
Total Female Population of Mappsville is 178.
What is the Ratio of Males per 100 Females in Mappsville?
There are 150.00 Males per 100 Females in Mappsville.
What is the Ratio of Females per 100 Males in Mappsville?
There are 66.67 Females per 100 Males in Mappsville.
What is the Median Population Age in Mappsville?
Median Population Age in Mappsville is 55.1 Years.
What is the Average Family Size in Mappsville
Average Family Size in Mappsville is 2.5 People.
What is the Average Household Size in Mappsville
Average Household Size in Mappsville is 2.5 People.
How Large is the Labor Force in Mappsville?
There are 353 People in the Labor Forcein in Mappsville.
What is the Percentage of People in the Labor Force in Mappsville?
88.9% of People are in the Labor Force in Mappsville.