Luray, VA Map & Demographics
Luray Map
Luray Overview
$31,547
PER CAPITA INCOME
$70,893
AVG FAMILY INCOME
$50,327
AVG HOUSEHOLD INCOME
31.8%
WAGE / INCOME GAP [ % ]
68.2¢/ $1
WAGE / INCOME GAP [ $ ]
0.39
INEQUALITY / GINI INDEX
4,838
TOTAL POPULATION
2,370
MALE POPULATION
2,468
FEMALE POPULATION
96.03
MALES / 100 FEMALES
104.14
FEMALES / 100 MALES
51.4
MEDIAN AGE
2.8
AVG FAMILY SIZE
2.0
AVG HOUSEHOLD SIZE
2,401
LABOR FORCE [ PEOPLE ]
56.5%
PERCENT IN LABOR FORCE
5.8%
UNEMPLOYMENT RATE
Luray Zip Codes
Luray Area Codes
Income in Luray
Income Overview in Luray
Per Capita Income in Luray is $31,547, while median incomes of families and households are $70,893 and $50,327 respectively.
| Characteristic | Number | Measure |
| Per Capita Income | 4,838 | $31,547 |
| Median Family Income | 1,162 | $70,893 |
| Mean Family Income | 1,162 | $77,304 |
| Median Household Income | 2,333 | $50,327 |
| Mean Household Income | 2,333 | $61,209 |
| Income Deficit | 1,162 | $0 |
| Wage / Income Gap (%) | 4,838 | 31.83% |
| Wage / Income Gap ($) | 4,838 | 68.17¢ per $1 |
| Gini / Inequality Index | 4,838 | 0.39 |
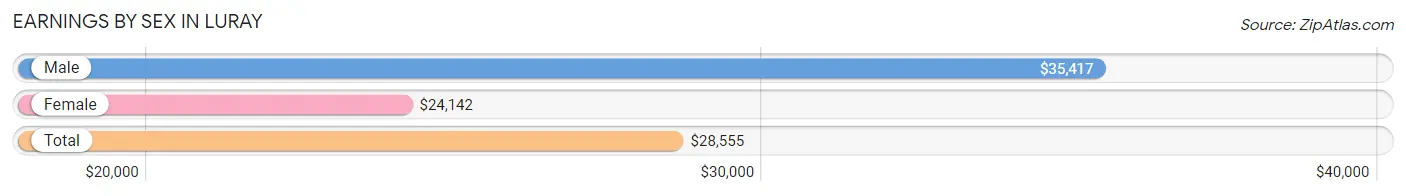
Earnings by Sex in Luray
Average Earnings in Luray are $28,555, $35,417 for men and $24,142 for women, a difference of 31.8%.
| Sex | Number | Average Earnings |
| Male | 1,254 (47.4%) | $35,417 |
| Female | 1,390 (52.6%) | $24,142 |
| Total | 2,644 (100.0%) | $28,555 |
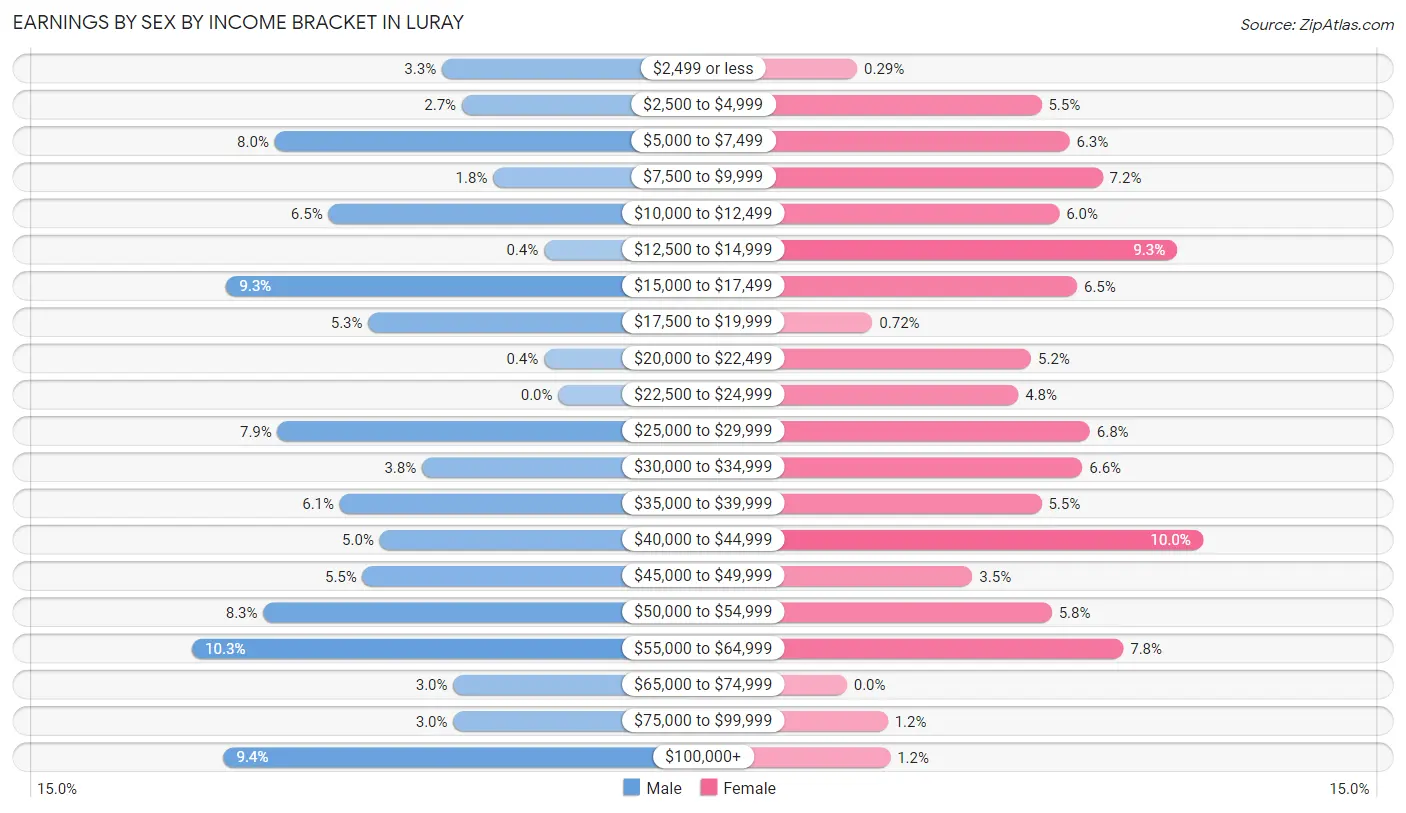
Earnings by Sex by Income Bracket in Luray
The most common earnings brackets in Luray are $55,000 to $64,999 for men (129 | 10.3%) and $40,000 to $44,999 for women (139 | 10.0%).
| Income | Male | Female |
| $2,499 or less | 41 (3.3%) | 4 (0.3%) |
| $2,500 to $4,999 | 34 (2.7%) | 76 (5.5%) |
| $5,000 to $7,499 | 100 (8.0%) | 87 (6.3%) |
| $7,500 to $9,999 | 23 (1.8%) | 100 (7.2%) |
| $10,000 to $12,499 | 81 (6.5%) | 83 (6.0%) |
| $12,500 to $14,999 | 5 (0.4%) | 129 (9.3%) |
| $15,000 to $17,499 | 117 (9.3%) | 90 (6.5%) |
| $17,500 to $19,999 | 67 (5.3%) | 10 (0.7%) |
| $20,000 to $22,499 | 5 (0.4%) | 72 (5.2%) |
| $22,500 to $24,999 | 0 (0.0%) | 67 (4.8%) |
| $25,000 to $29,999 | 99 (7.9%) | 95 (6.8%) |
| $30,000 to $34,999 | 48 (3.8%) | 92 (6.6%) |
| $35,000 to $39,999 | 77 (6.1%) | 76 (5.5%) |
| $40,000 to $44,999 | 63 (5.0%) | 139 (10.0%) |
| $45,000 to $49,999 | 69 (5.5%) | 49 (3.5%) |
| $50,000 to $54,999 | 104 (8.3%) | 80 (5.8%) |
| $55,000 to $64,999 | 129 (10.3%) | 108 (7.8%) |
| $65,000 to $74,999 | 37 (2.9%) | 0 (0.0%) |
| $75,000 to $99,999 | 37 (2.9%) | 16 (1.1%) |
| $100,000+ | 118 (9.4%) | 17 (1.2%) |
| Total | 1,254 (100.0%) | 1,390 (100.0%) |
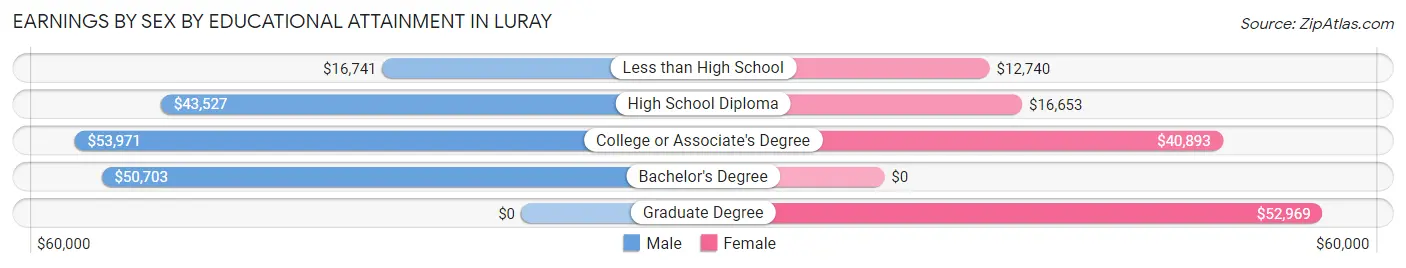
Earnings by Sex by Educational Attainment in Luray
Average earnings in Luray are $43,869 for men and $26,228 for women, a difference of 40.2%. Men with an educational attainment of college or associate's degree enjoy the highest average annual earnings of $53,971, while those with less than high school education earn the least with $16,741. Women with an educational attainment of graduate degree earn the most with the average annual earnings of $52,969, while those with less than high school education have the smallest earnings of $12,740.
| Educational Attainment | Male Income | Female Income |
| Less than High School | $16,741 | $12,740 |
| High School Diploma | $43,527 | $16,653 |
| College or Associate's Degree | $53,971 | $40,893 |
| Bachelor's Degree | $50,703 | $0 |
| Graduate Degree | - | - |
| Total | $43,869 | $26,228 |
Family Income in Luray
Family Income Brackets in Luray
According to the Luray family income data, there are 300 families falling into the $50,000 to $74,999 income range, which is the most common income bracket and makes up 25.8% of all families. Conversely, the $10,000 to $14,999 income bracket is the least frequent group with only 8 families (0.7%) belonging to this category.
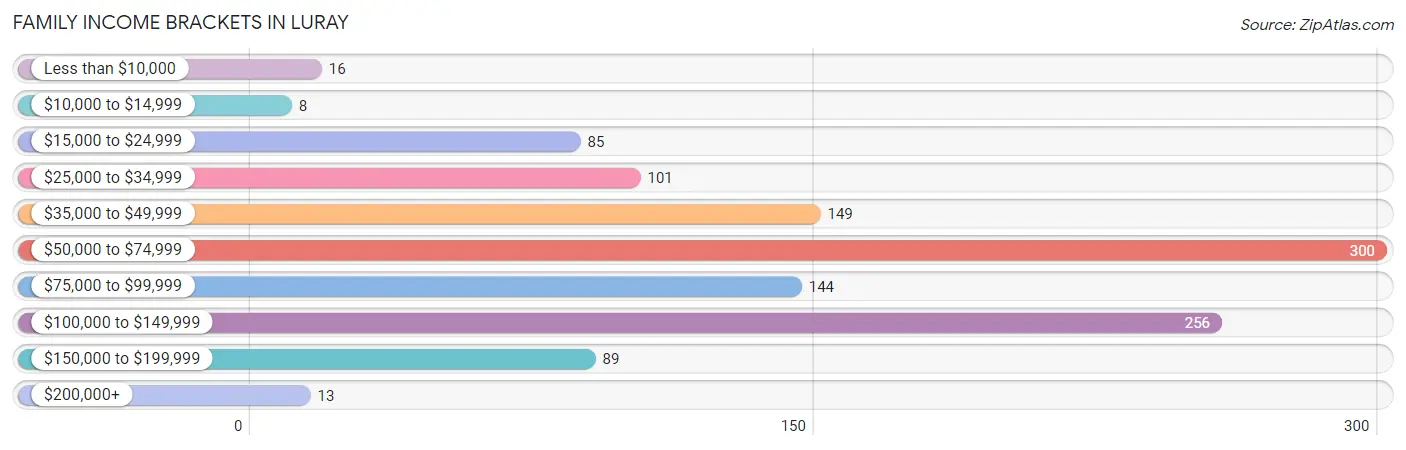
| Income Bracket | # Families | % Families |
| Less than $10,000 | 16 | 1.4% |
| $10,000 to $14,999 | 8 | 0.7% |
| $15,000 to $24,999 | 85 | 7.3% |
| $25,000 to $34,999 | 101 | 8.7% |
| $35,000 to $49,999 | 149 | 12.8% |
| $50,000 to $74,999 | 300 | 25.8% |
| $75,000 to $99,999 | 144 | 12.4% |
| $100,000 to $149,999 | 256 | 22.0% |
| $150,000 to $199,999 | 89 | 7.7% |
| $200,000+ | 13 | 1.1% |
Family Income by Famaliy Size in Luray
5-person families (75 | 6.5%) account for the highest median family income in Luray with $118,869 per family, while 2-person families (835 | 71.9%) have the highest median income of $35,968 per family member.
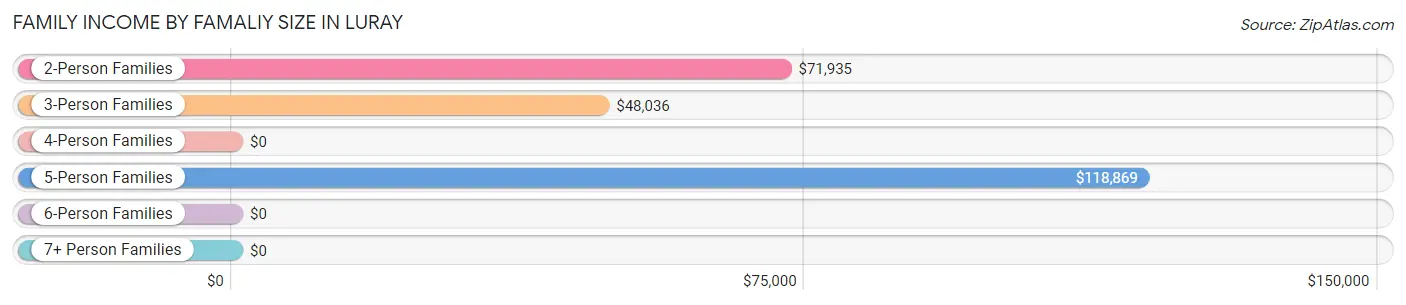
| Income Bracket | # Families | Median Income |
| 2-Person Families | 835 (71.9%) | $71,935 |
| 3-Person Families | 152 (13.1%) | $48,036 |
| 4-Person Families | 85 (7.3%) | $0 |
| 5-Person Families | 75 (6.5%) | $118,869 |
| 6-Person Families | 15 (1.3%) | $0 |
| 7+ Person Families | 0 (0.0%) | $0 |
| Total | 1,162 (100.0%) | $70,893 |
Family Income by Number of Earners in Luray
The median family income in Luray is $70,893, with families comprising 3+ earners (109) having the highest median family income of $98,906, while families with no earners (255) have the lowest median family income of $57,404, accounting for 9.4% and 21.9% of families, respectively.
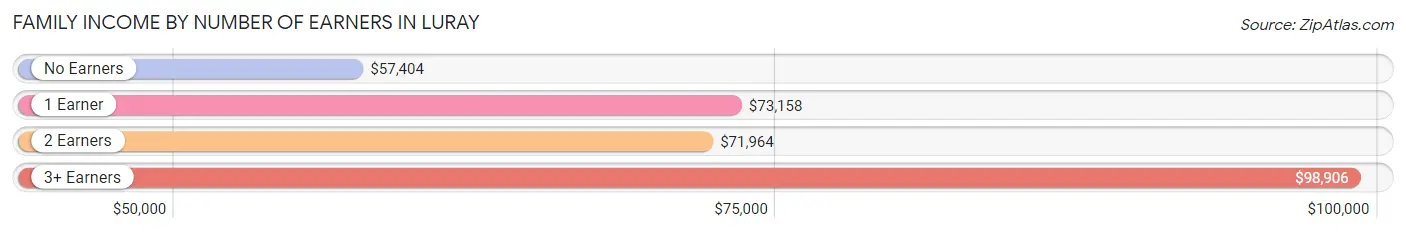
| Number of Earners | # Families | Median Income |
| No Earners | 255 (21.9%) | $57,404 |
| 1 Earner | 366 (31.5%) | $73,158 |
| 2 Earners | 432 (37.2%) | $71,964 |
| 3+ Earners | 109 (9.4%) | $98,906 |
| Total | 1,162 (100.0%) | $70,893 |
Household Income in Luray
Household Income Brackets in Luray
With 548 households falling in the category, the $50,000 to $74,999 income range is the most frequent in Luray, accounting for 23.5% of all households. In contrast, only 30 households (1.3%) fall into the $200,000+ income bracket, making it the least populous group.
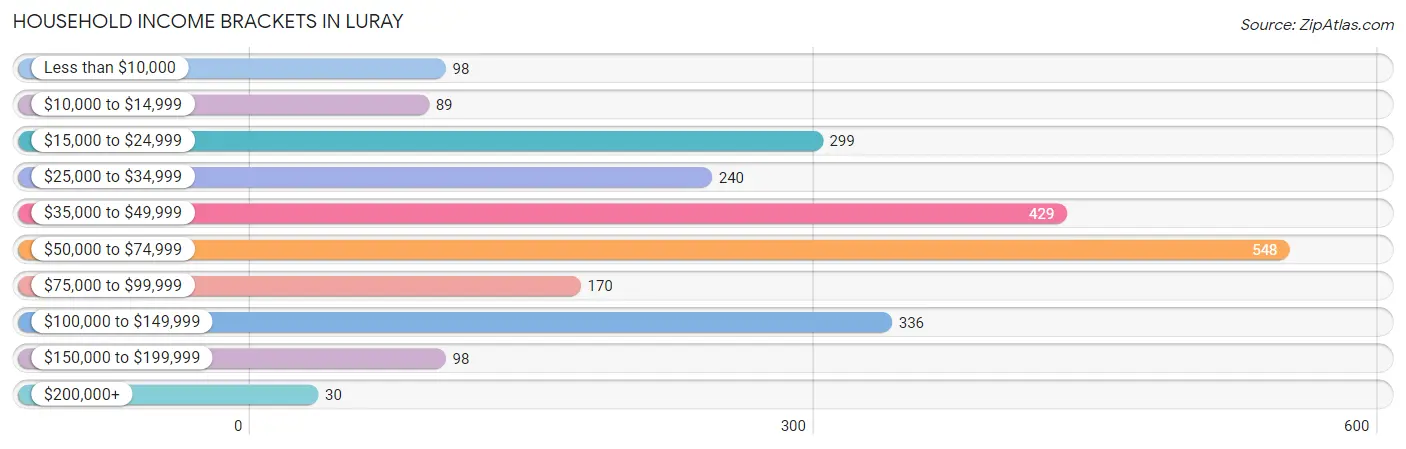
| Income Bracket | # Households | % Households |
| Less than $10,000 | 98 | 4.2% |
| $10,000 to $14,999 | 89 | 3.8% |
| $15,000 to $24,999 | 299 | 12.8% |
| $25,000 to $34,999 | 240 | 10.3% |
| $35,000 to $49,999 | 429 | 18.4% |
| $50,000 to $74,999 | 548 | 23.5% |
| $75,000 to $99,999 | 170 | 7.3% |
| $100,000 to $149,999 | 336 | 14.4% |
| $150,000 to $199,999 | 98 | 4.2% |
| $200,000+ | 30 | 1.3% |
Household Income by Householder Age in Luray
The median household income in Luray is $50,327, with the highest median household income of $55,192 found in the 45 to 64 years age bracket for the primary householder. A total of 864 households (37.0%) fall into this category. Meanwhile, the 25 to 44 years age bracket for the primary householder has the lowest median household income of $0, with 424 households (18.2%) in this group.
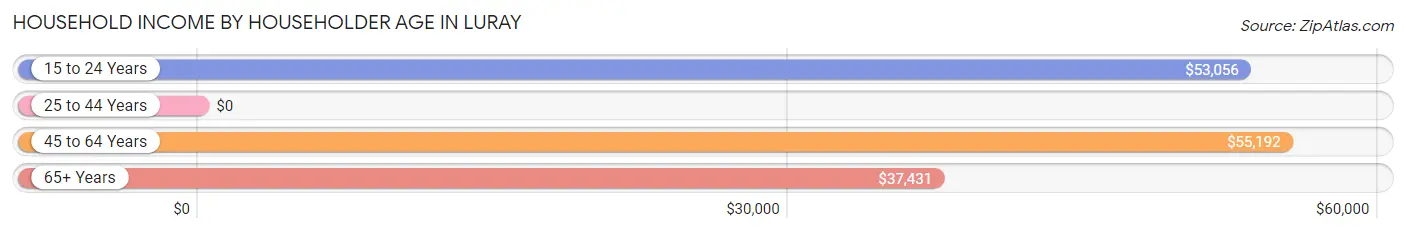
| Income Bracket | # Households | Median Income |
| 15 to 24 Years | 28 (1.2%) | $53,056 |
| 25 to 44 Years | 424 (18.2%) | $0 |
| 45 to 64 Years | 864 (37.0%) | $55,192 |
| 65+ Years | 1,017 (43.6%) | $37,431 |
| Total | 2,333 (100.0%) | $50,327 |
Poverty in Luray
Income Below Poverty by Sex and Age in Luray
With 4.3% poverty level for males and 8.9% for females among the residents of Luray, 18 to 24 year old males and 18 to 24 year old females are the most vulnerable to poverty, with 36 males (20.2%) and 40 females (32.5%) in their respective age groups living below the poverty level.
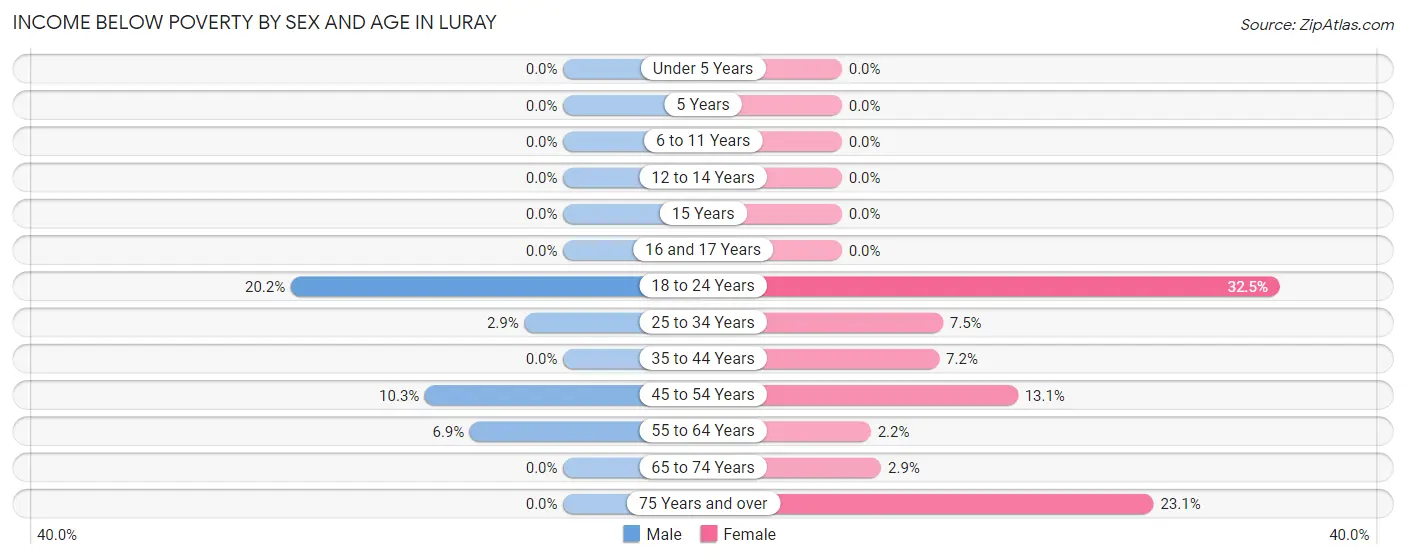
| Age Bracket | Male | Female |
| Under 5 Years | 0 (0.0%) | 0 (0.0%) |
| 5 Years | 0 (0.0%) | 0 (0.0%) |
| 6 to 11 Years | 0 (0.0%) | 0 (0.0%) |
| 12 to 14 Years | 0 (0.0%) | 0 (0.0%) |
| 15 Years | 0 (0.0%) | 0 (0.0%) |
| 16 and 17 Years | 0 (0.0%) | 0 (0.0%) |
| 18 to 24 Years | 36 (20.2%) | 40 (32.5%) |
| 25 to 34 Years | 9 (2.9%) | 9 (7.5%) |
| 35 to 44 Years | 0 (0.0%) | 24 (7.2%) |
| 45 to 54 Years | 31 (10.3%) | 32 (13.1%) |
| 55 to 64 Years | 22 (6.9%) | 9 (2.1%) |
| 65 to 74 Years | 0 (0.0%) | 15 (2.9%) |
| 75 Years and over | 0 (0.0%) | 81 (23.1%) |
| Total | 98 (4.3%) | 210 (8.9%) |
Income Above Poverty by Sex and Age in Luray
According to the poverty statistics in Luray, males aged under 5 years and females aged under 5 years are the age groups that are most secure financially, with 100.0% of males and 100.0% of females in these age groups living above the poverty line.
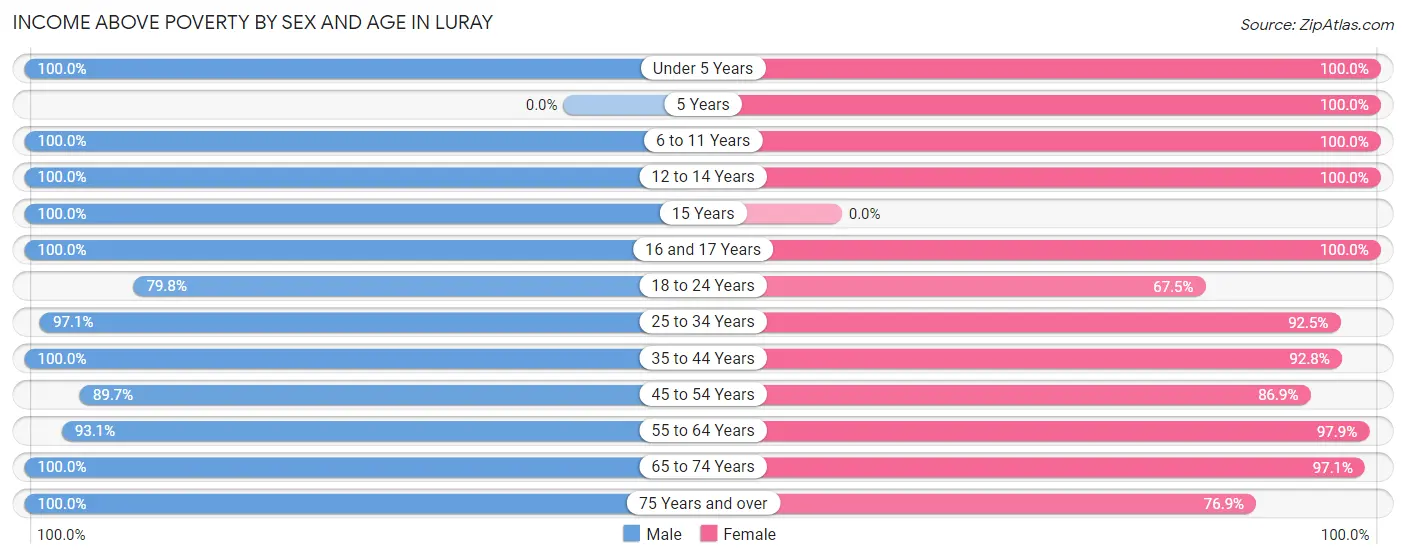
| Age Bracket | Male | Female |
| Under 5 Years | 92 (100.0%) | 27 (100.0%) |
| 5 Years | 0 (0.0%) | 28 (100.0%) |
| 6 to 11 Years | 184 (100.0%) | 84 (100.0%) |
| 12 to 14 Years | 69 (100.0%) | 84 (100.0%) |
| 15 Years | 21 (100.0%) | 0 (0.0%) |
| 16 and 17 Years | 67 (100.0%) | 22 (100.0%) |
| 18 to 24 Years | 142 (79.8%) | 83 (67.5%) |
| 25 to 34 Years | 303 (97.1%) | 111 (92.5%) |
| 35 to 44 Years | 257 (100.0%) | 308 (92.8%) |
| 45 to 54 Years | 271 (89.7%) | 213 (86.9%) |
| 55 to 64 Years | 296 (93.1%) | 410 (97.9%) |
| 65 to 74 Years | 245 (100.0%) | 498 (97.1%) |
| 75 Years and over | 235 (100.0%) | 269 (76.9%) |
| Total | 2,182 (95.7%) | 2,137 (91.0%) |
Income Below Poverty Among Married-Couple Families in Luray
The poverty statistics for married-couple families in Luray show that 1.8% or 16 of the total 865 families live below the poverty line. Families with no children have the highest poverty rate of 2.3%, comprising of 16 families. On the other hand, families with 1 or 2 children have the lowest poverty rate of 0.0%, which includes 0 families.
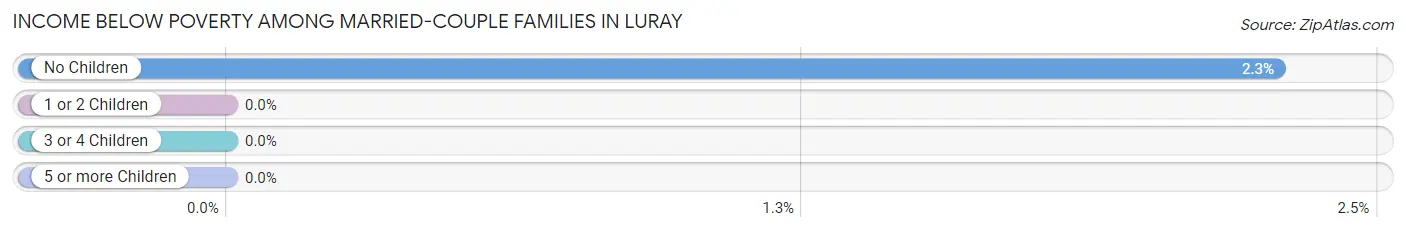
| Children | Above Poverty | Below Poverty |
| No Children | 687 (97.7%) | 16 (2.3%) |
| 1 or 2 Children | 98 (100.0%) | 0 (0.0%) |
| 3 or 4 Children | 64 (100.0%) | 0 (0.0%) |
| 5 or more Children | 0 (0.0%) | 0 (0.0%) |
| Total | 849 (98.2%) | 16 (1.8%) |
Income Below Poverty Among Single-Parent Households in Luray
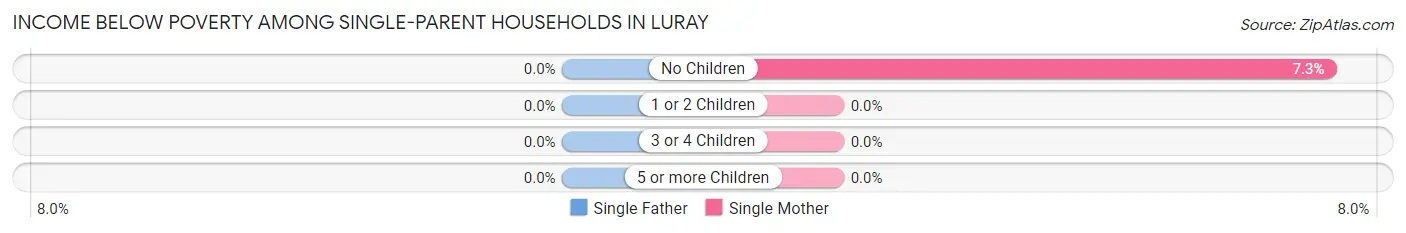
| Children | Single Father | Single Mother |
| No Children | 0 (0.0%) | 8 (7.3%) |
| 1 or 2 Children | 0 (0.0%) | 0 (0.0%) |
| 3 or 4 Children | 0 (0.0%) | 0 (0.0%) |
| 5 or more Children | 0 (0.0%) | 0 (0.0%) |
| Total | 0 (0.0%) | 8 (3.0%) |
Income Below Poverty Among Married-Couple vs Single-Parent Households in Luray
The poverty data for Luray shows that 16 of the married-couple family households (1.8%) and 8 of the single-parent households (2.7%) are living below the poverty level. Within the married-couple family households, those with no children have the highest poverty rate, with 16 households (2.3%) falling below the poverty line. Among the single-parent households, those with no children have the highest poverty rate, with 8 household (5.8%) living below poverty.
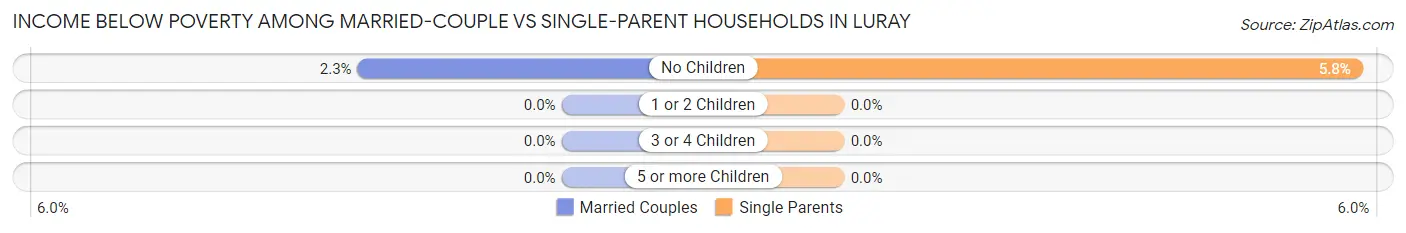
| Children | Married-Couple Families | Single-Parent Households |
| No Children | 16 (2.3%) | 8 (5.8%) |
| 1 or 2 Children | 0 (0.0%) | 0 (0.0%) |
| 3 or 4 Children | 0 (0.0%) | 0 (0.0%) |
| 5 or more Children | 0 (0.0%) | 0 (0.0%) |
| Total | 16 (1.8%) | 8 (2.7%) |
Race in Luray
The most populous races in Luray are White / Caucasian (4,350 | 89.9%), Black / African American (270 | 5.6%), and Two or more Races (168 | 3.5%).
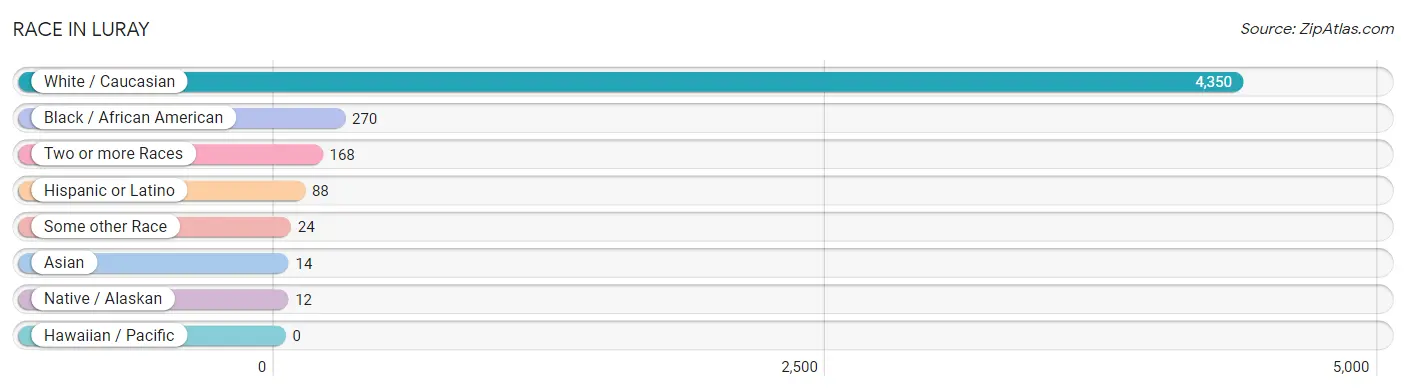
| Race | # Population | % Population |
| Asian | 14 | 0.3% |
| Black / African American | 270 | 5.6% |
| Hawaiian / Pacific | 0 | 0.0% |
| Hispanic or Latino | 88 | 1.8% |
| Native / Alaskan | 12 | 0.3% |
| White / Caucasian | 4,350 | 89.9% |
| Two or more Races | 168 | 3.5% |
| Some other Race | 24 | 0.5% |
| Total | 4,838 | 100.0% |
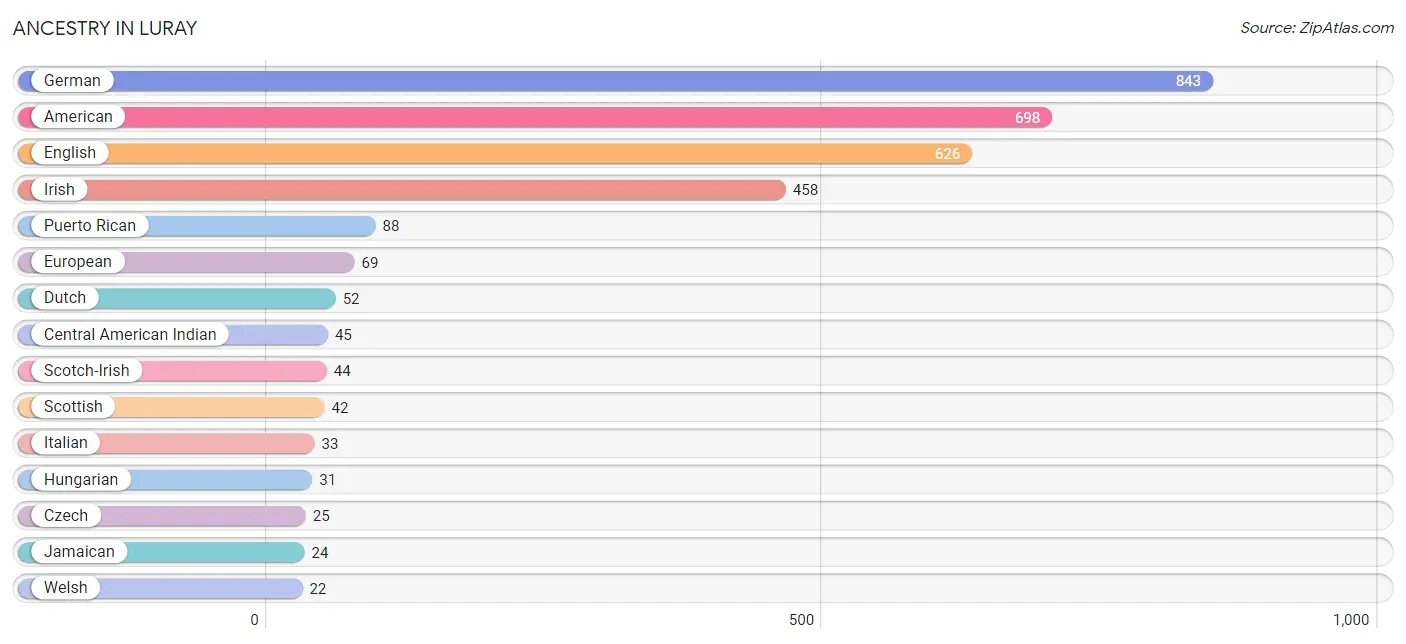
Ancestry in Luray
The most populous ancestries reported in Luray are German (843 | 17.4%), American (698 | 14.4%), English (626 | 12.9%), Irish (458 | 9.5%), and Puerto Rican (88 | 1.8%), together accounting for 56.1% of all Luray residents.
| Ancestry | # Population | % Population |
| African | 6 | 0.1% |
| American | 698 | 14.4% |
| British | 13 | 0.3% |
| Central American Indian | 45 | 0.9% |
| Cherokee | 9 | 0.2% |
| Chippewa | 12 | 0.3% |
| Czech | 25 | 0.5% |
| Dutch | 52 | 1.1% |
| Eastern European | 13 | 0.3% |
| English | 626 | 12.9% |
| European | 69 | 1.4% |
| French | 16 | 0.3% |
| French Canadian | 9 | 0.2% |
| German | 843 | 17.4% |
| Greek | 4 | 0.1% |
| Hungarian | 31 | 0.6% |
| Indian (Asian) | 5 | 0.1% |
| Irish | 458 | 9.5% |
| Italian | 33 | 0.7% |
| Jamaican | 24 | 0.5% |
| Norwegian | 6 | 0.1% |
| Polish | 21 | 0.4% |
| Puerto Rican | 88 | 1.8% |
| Scotch-Irish | 44 | 0.9% |
| Scottish | 42 | 0.9% |
| Sri Lankan | 9 | 0.2% |
| Subsaharan African | 6 | 0.1% |
| Welsh | 22 | 0.4% | View All 28 Rows |
Immigrants in Luray
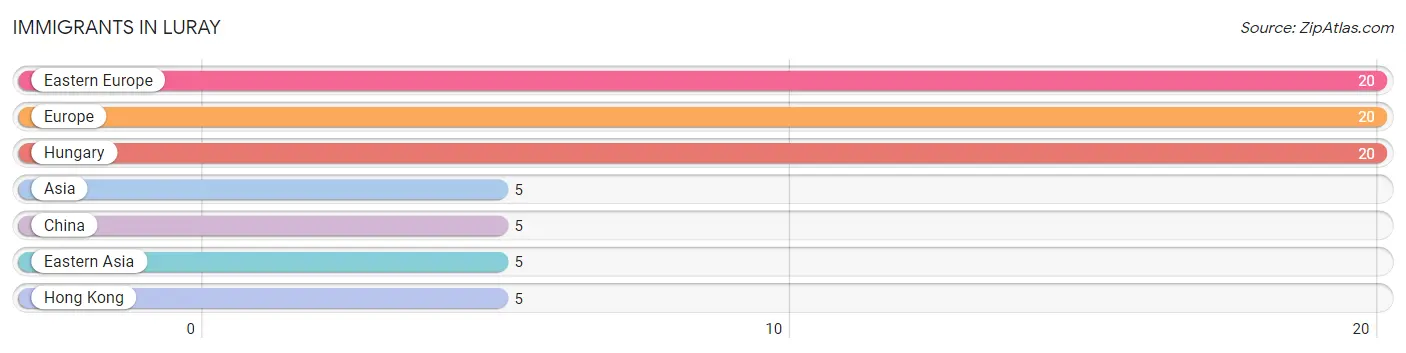
The most numerous immigrant groups reported in Luray came from Eastern Europe (20 | 0.4%), Europe (20 | 0.4%), Hungary (20 | 0.4%), Asia (5 | 0.1%), and China (5 | 0.1%), together accounting for 1.4% of all Luray residents.
| Immigration Origin | # Population | % Population |
| Asia | 5 | 0.1% |
| China | 5 | 0.1% |
| Eastern Asia | 5 | 0.1% |
| Eastern Europe | 20 | 0.4% |
| Europe | 20 | 0.4% |
| Hong Kong | 5 | 0.1% |
| Hungary | 20 | 0.4% | View All 7 Rows |
Sex and Age in Luray
Sex and Age in Luray
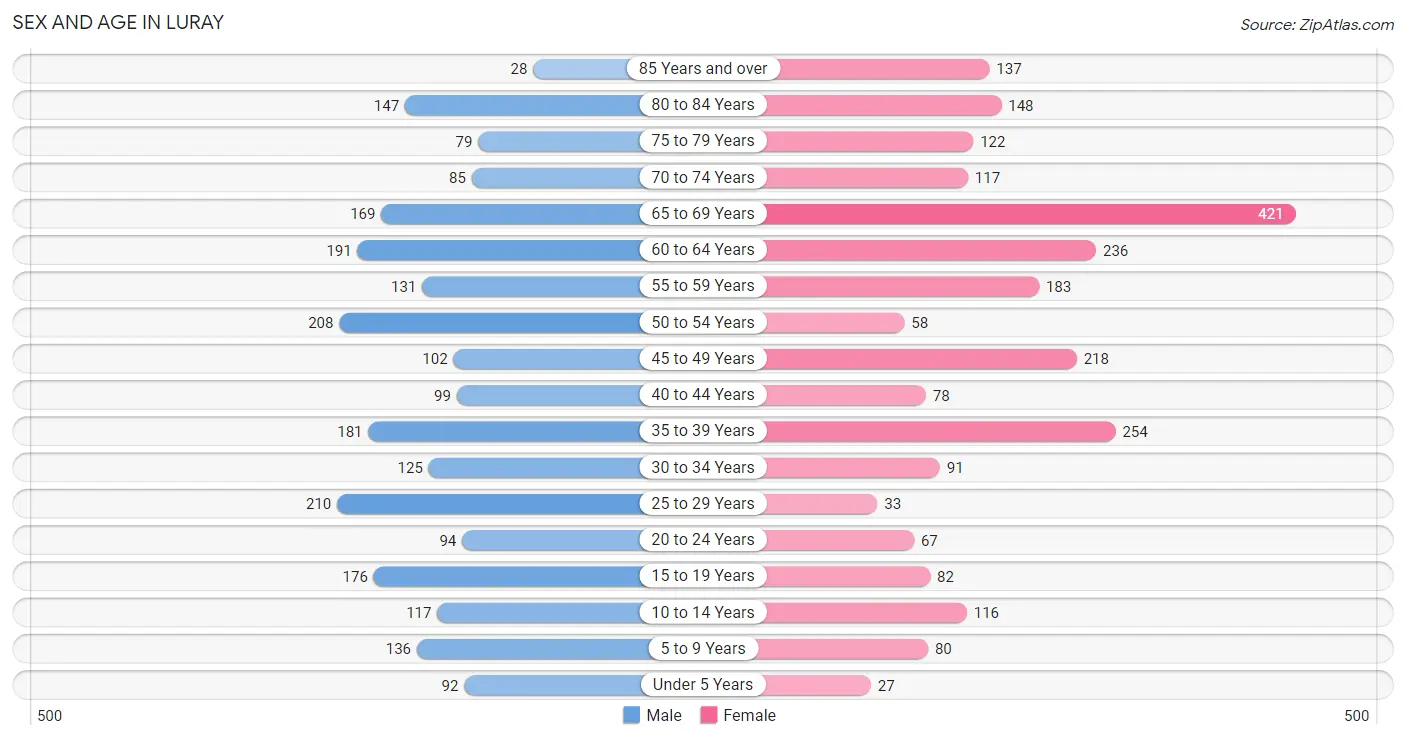
The most populous age groups in Luray are 25 to 29 Years (210 | 8.9%) for men and 65 to 69 Years (421 | 17.1%) for women.
| Age Bracket | Male | Female |
| Under 5 Years | 92 (3.9%) | 27 (1.1%) |
| 5 to 9 Years | 136 (5.7%) | 80 (3.2%) |
| 10 to 14 Years | 117 (4.9%) | 116 (4.7%) |
| 15 to 19 Years | 176 (7.4%) | 82 (3.3%) |
| 20 to 24 Years | 94 (4.0%) | 67 (2.7%) |
| 25 to 29 Years | 210 (8.9%) | 33 (1.3%) |
| 30 to 34 Years | 125 (5.3%) | 91 (3.7%) |
| 35 to 39 Years | 181 (7.6%) | 254 (10.3%) |
| 40 to 44 Years | 99 (4.2%) | 78 (3.2%) |
| 45 to 49 Years | 102 (4.3%) | 218 (8.8%) |
| 50 to 54 Years | 208 (8.8%) | 58 (2.4%) |
| 55 to 59 Years | 131 (5.5%) | 183 (7.4%) |
| 60 to 64 Years | 191 (8.1%) | 236 (9.6%) |
| 65 to 69 Years | 169 (7.1%) | 421 (17.1%) |
| 70 to 74 Years | 85 (3.6%) | 117 (4.7%) |
| 75 to 79 Years | 79 (3.3%) | 122 (4.9%) |
| 80 to 84 Years | 147 (6.2%) | 148 (6.0%) |
| 85 Years and over | 28 (1.2%) | 137 (5.6%) |
| Total | 2,370 (100.0%) | 2,468 (100.0%) |
Families and Households in Luray
Median Family Size in Luray
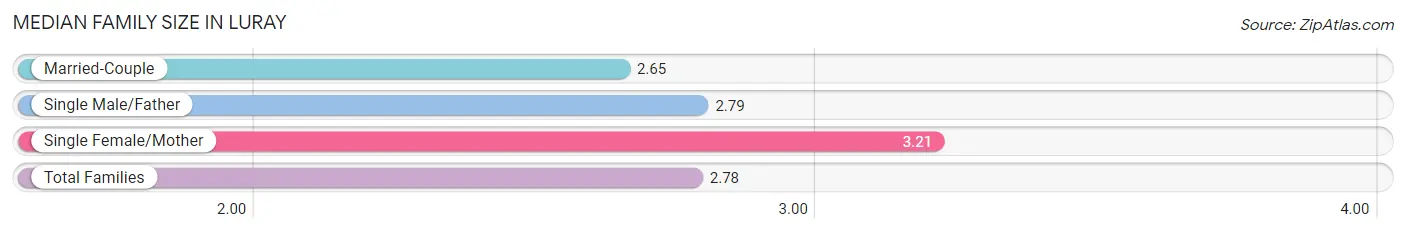
The median family size in Luray is 2.78 persons per family, with single female/mother families (268 | 23.1%) accounting for the largest median family size of 3.21 persons per family. On the other hand, married-couple families (865 | 74.4%) represent the smallest median family size with 2.65 persons per family.
| Family Type | # Families | Family Size |
| Married-Couple | 865 (74.4%) | 2.65 |
| Single Male/Father | 29 (2.5%) | 2.79 |
| Single Female/Mother | 268 (23.1%) | 3.21 |
| Total Families | 1,162 (100.0%) | 2.78 |
Median Household Size in Luray
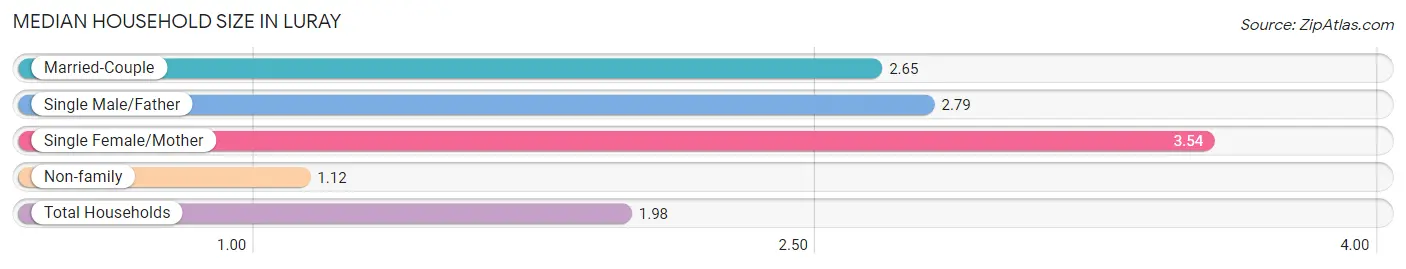
The median household size in Luray is 1.98 persons per household, with single female/mother households (268 | 11.5%) accounting for the largest median household size of 3.54 persons per household. non-family households (1,171 | 50.2%) represent the smallest median household size with 1.12 persons per household.
| Household Type | # Households | Household Size |
| Married-Couple | 865 (37.1%) | 2.65 |
| Single Male/Father | 29 (1.2%) | 2.79 |
| Single Female/Mother | 268 (11.5%) | 3.54 |
| Non-family | 1,171 (50.2%) | 1.12 |
| Total Households | 2,333 (100.0%) | 1.98 |
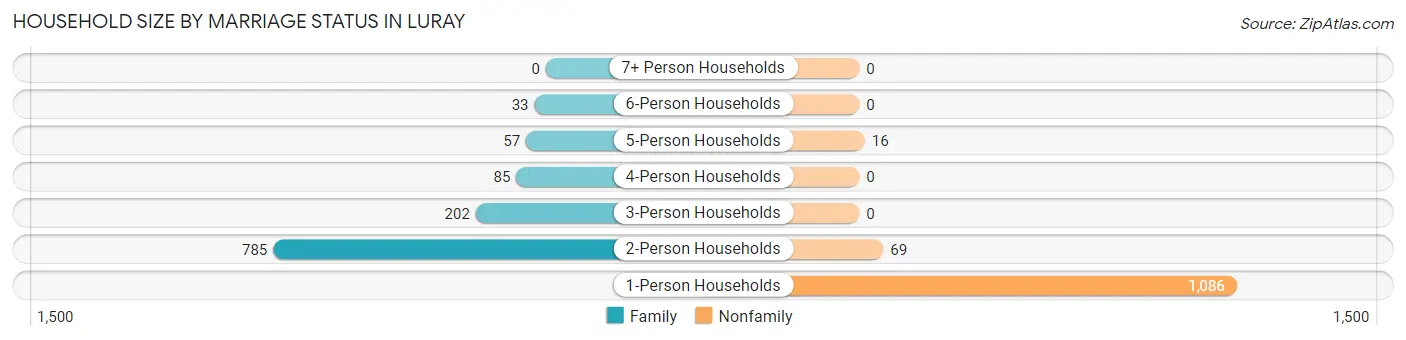
Household Size by Marriage Status in Luray
Out of a total of 2,333 households in Luray, 1,162 (49.8%) are family households, while 1,171 (50.2%) are nonfamily households. The most numerous type of family households are 2-person households, comprising 785, and the most common type of nonfamily households are 1-person households, comprising 1,086.
| Household Size | Family Households | Nonfamily Households |
| 1-Person Households | - | 1,086 (46.6%) |
| 2-Person Households | 785 (33.7%) | 69 (3.0%) |
| 3-Person Households | 202 (8.7%) | 0 (0.0%) |
| 4-Person Households | 85 (3.6%) | 0 (0.0%) |
| 5-Person Households | 57 (2.4%) | 16 (0.7%) |
| 6-Person Households | 33 (1.4%) | 0 (0.0%) |
| 7+ Person Households | 0 (0.0%) | 0 (0.0%) |
| Total | 1,162 (49.8%) | 1,171 (50.2%) |
Female Fertility in Luray
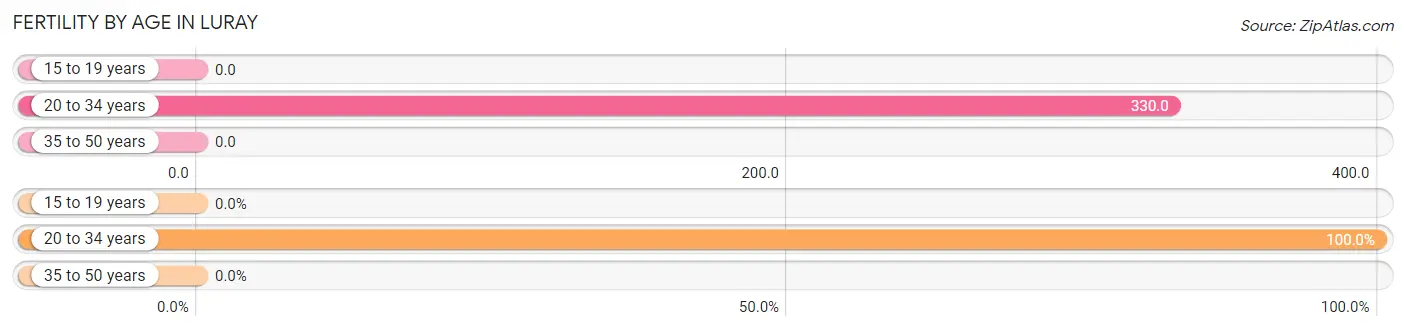
Fertility by Age in Luray
Average fertility rate in Luray is 76.0 births per 1,000 women. Women in the age bracket of 20 to 34 years have the highest fertility rate with 330.0 births per 1,000 women. Women in the age bracket of 20 to 34 years acount for 100.0% of all women with births.
| Age Bracket | Women with Births | Births / 1,000 Women |
| 15 to 19 years | 0 (0.0%) | 0.0 |
| 20 to 34 years | 63 (100.0%) | 330.0 |
| 35 to 50 years | 0 (0.0%) | 0.0 |
| Total | 63 (100.0%) | 76.0 |
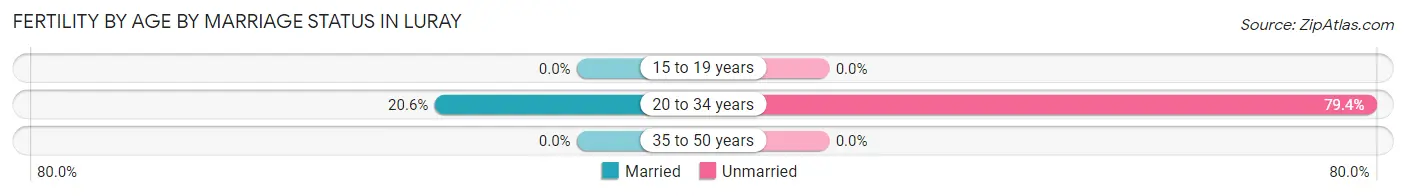
Fertility by Age by Marriage Status in Luray
20.6% of women with births (63) in Luray are married. The highest percentage of unmarried women with births falls into 20 to 34 years age bracket with 79.4% of them unmarried at the time of birth, while the lowest percentage of unmarried women with births belong to 20 to 34 years age bracket with 79.4% of them unmarried.
| Age Bracket | Married | Unmarried |
| 15 to 19 years | 0 (0.0%) | 0 (0.0%) |
| 20 to 34 years | 13 (20.6%) | 50 (79.4%) |
| 35 to 50 years | 0 (0.0%) | 0 (0.0%) |
| Total | 13 (20.6%) | 50 (79.4%) |
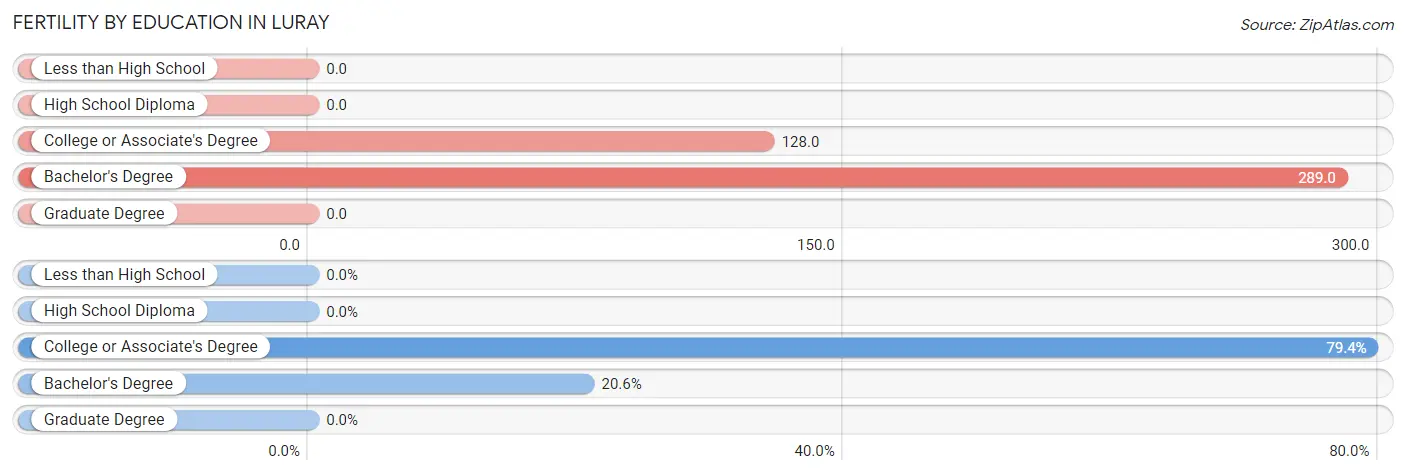
Fertility by Education in Luray
| Educational Attainment | Women with Births | Births / 1,000 Women |
| Less than High School | 0 (0.0%) | 0.0 |
| High School Diploma | 0 (0.0%) | 0.0 |
| College or Associate's Degree | 50 (79.4%) | 128.0 |
| Bachelor's Degree | 13 (20.6%) | 289.0 |
| Graduate Degree | 0 (0.0%) | 0.0 |
| Total | 63 (100.0%) | 76.0 |
Fertility by Education by Marriage Status in Luray
79.4% of women with births in Luray are unmarried. Women with the educational attainment of bachelor's degree are most likely to be married with 100.0% of them married at childbirth, while women with the educational attainment of college or associate's degree are least likely to be married with 100.0% of them unmarried at childbirth.
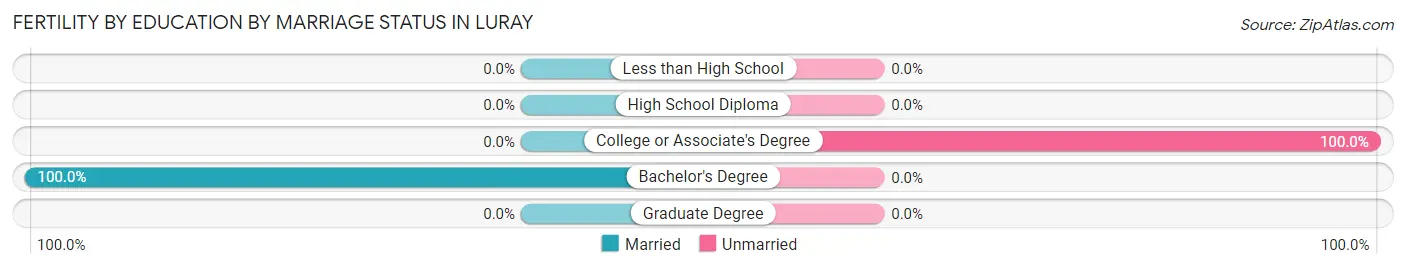
| Educational Attainment | Married | Unmarried |
| Less than High School | 0 (0.0%) | 0 (0.0%) |
| High School Diploma | 0 (0.0%) | 0 (0.0%) |
| College or Associate's Degree | 0 (0.0%) | 50 (100.0%) |
| Bachelor's Degree | 13 (100.0%) | 0 (0.0%) |
| Graduate Degree | 0 (0.0%) | 0 (0.0%) |
| Total | 13 (20.6%) | 50 (79.4%) |
Employment Characteristics in Luray
Employment by Class of Employer in Luray
Among the 2,247 employed individuals in Luray, private company employees (1,487 | 66.2%), state government employees (190 | 8.5%), and not-for-profit organizations (182 | 8.1%) make up the most common classes of employment.
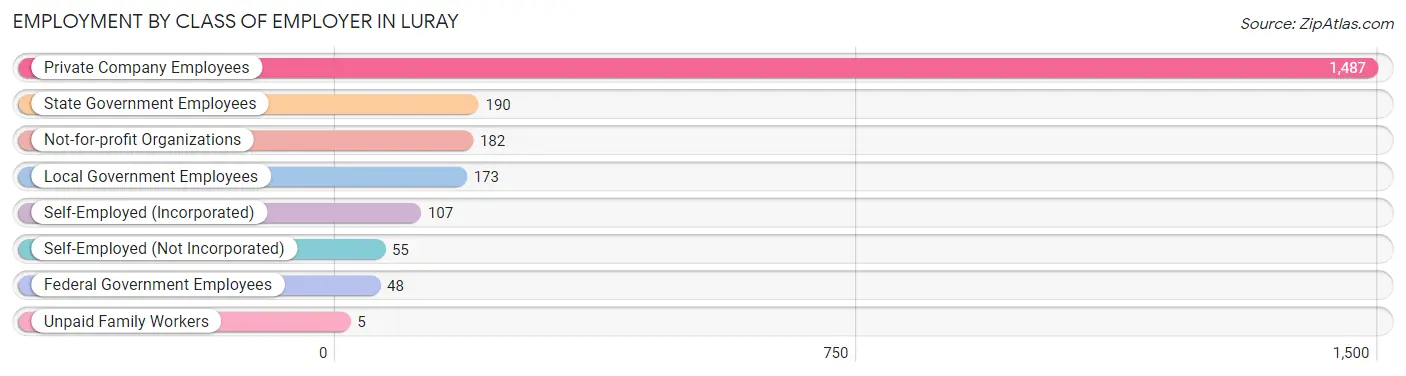
| Employer Class | # Employees | % Employees |
| Private Company Employees | 1,487 | 66.2% |
| Self-Employed (Incorporated) | 107 | 4.8% |
| Self-Employed (Not Incorporated) | 55 | 2.5% |
| Not-for-profit Organizations | 182 | 8.1% |
| Local Government Employees | 173 | 7.7% |
| State Government Employees | 190 | 8.5% |
| Federal Government Employees | 48 | 2.1% |
| Unpaid Family Workers | 5 | 0.2% |
| Total | 2,247 | 100.0% |
Employment Status by Age in Luray
According to the labor force statistics for Luray, out of the total population over 16 years of age (4,249), 56.5% or 2,401 individuals are in the labor force, with 5.8% or 139 of them unemployed. The age group with the highest labor force participation rate is 16 to 19 years, with 89.5% or 212 individuals in the labor force. Within the labor force, the 30 to 34 years age range has the highest percentage of unemployed individuals, with 24.7% or 23 of them being unemployed.
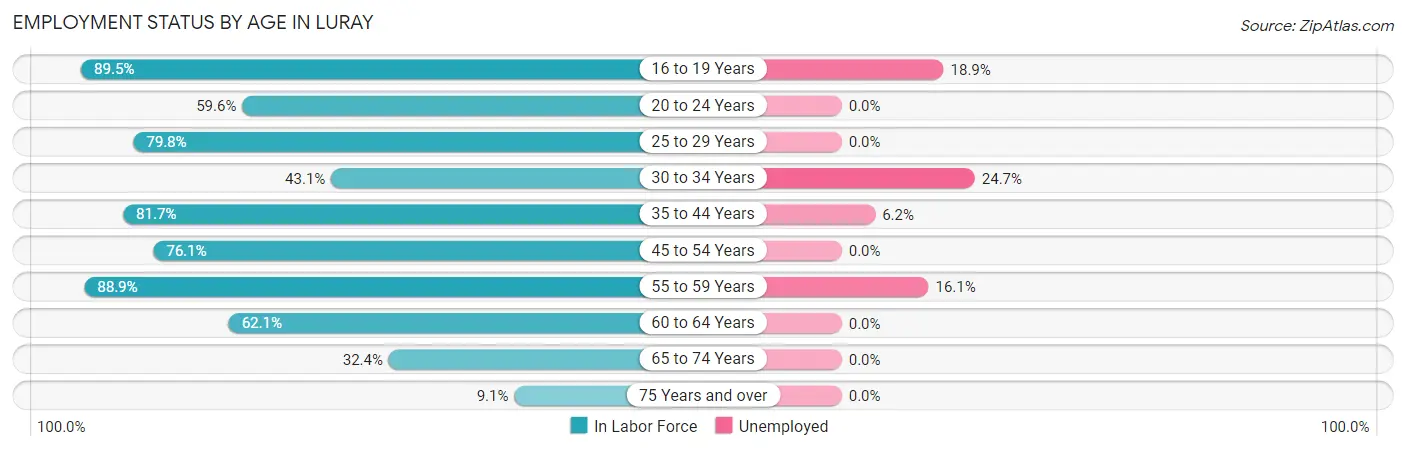
| Age Bracket | In Labor Force | Unemployed |
| 16 to 19 Years | 212 (89.5%) | 40 (18.9%) |
| 20 to 24 Years | 96 (59.6%) | 0 (0.0%) |
| 25 to 29 Years | 194 (79.8%) | 0 (0.0%) |
| 30 to 34 Years | 93 (43.1%) | 23 (24.7%) |
| 35 to 44 Years | 500 (81.7%) | 31 (6.2%) |
| 45 to 54 Years | 446 (76.1%) | 0 (0.0%) |
| 55 to 59 Years | 279 (88.9%) | 45 (16.1%) |
| 60 to 64 Years | 265 (62.1%) | 0 (0.0%) |
| 65 to 74 Years | 257 (32.4%) | 0 (0.0%) |
| 75 Years and over | 60 (9.1%) | 0 (0.0%) |
| Total | 2,401 (56.5%) | 139 (5.8%) |
Employment Status by Educational Attainment in Luray
According to labor force statistics for Luray, 74.1% of individuals (1,777) out of the total population between 25 and 64 years of age (2,398) are in the labor force, with 5.6% or 100 of them being unemployed. The group with the highest labor force participation rate are those with the educational attainment of college / associate degree, with 85.4% or 620 individuals in the labor force. Within the labor force, individuals with less than high school education have the highest percentage of unemployment, with 21.5% or 45 of them being unemployed.
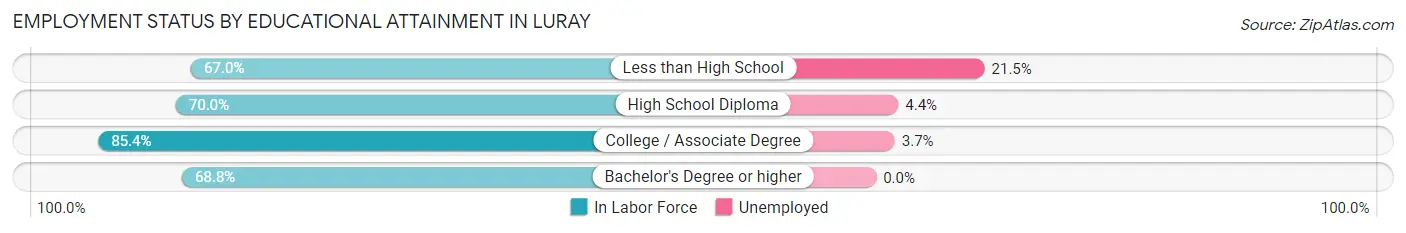
| Educational Attainment | In Labor Force | Unemployed |
| Less than High School | 209 (67.0%) | 67 (21.5%) |
| High School Diploma | 710 (70.0%) | 45 (4.4%) |
| College / Associate Degree | 620 (85.4%) | 27 (3.7%) |
| Bachelor's Degree or higher | 238 (68.8%) | 0 (0.0%) |
| Total | 1,777 (74.1%) | 134 (5.6%) |
Employment Occupations by Sex in Luray
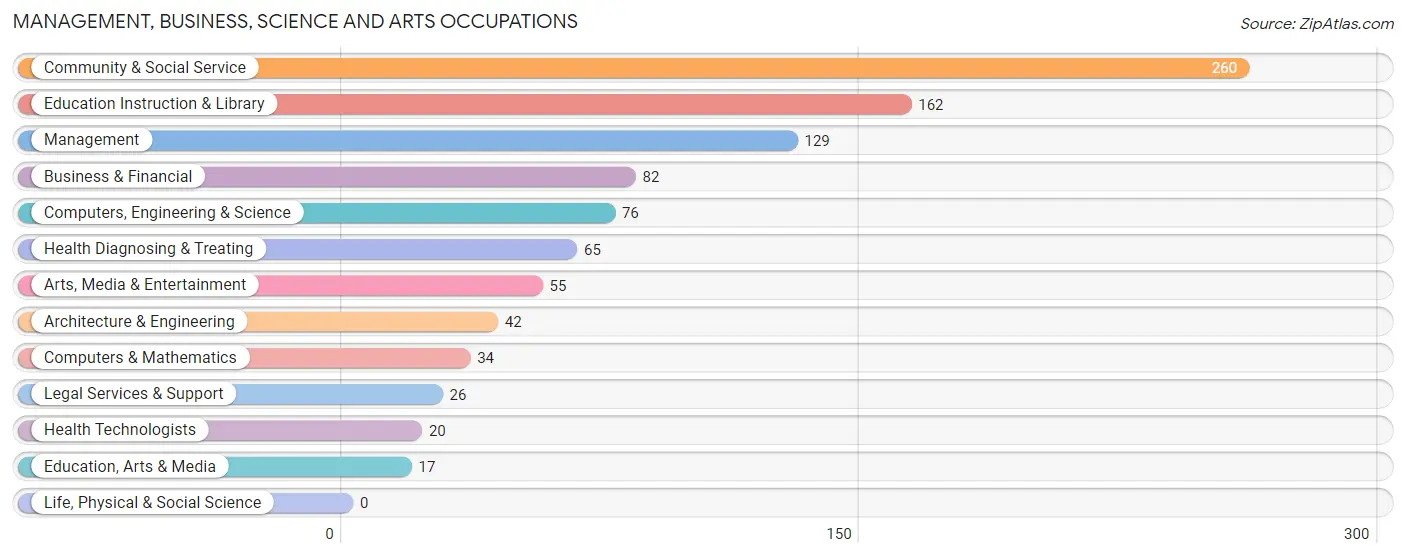
Management, Business, Science and Arts Occupations
The most common Management, Business, Science and Arts occupations in Luray are Community & Social Service (260 | 11.5%), Education Instruction & Library (162 | 7.2%), Management (129 | 5.7%), Business & Financial (82 | 3.6%), and Computers, Engineering & Science (76 | 3.4%).
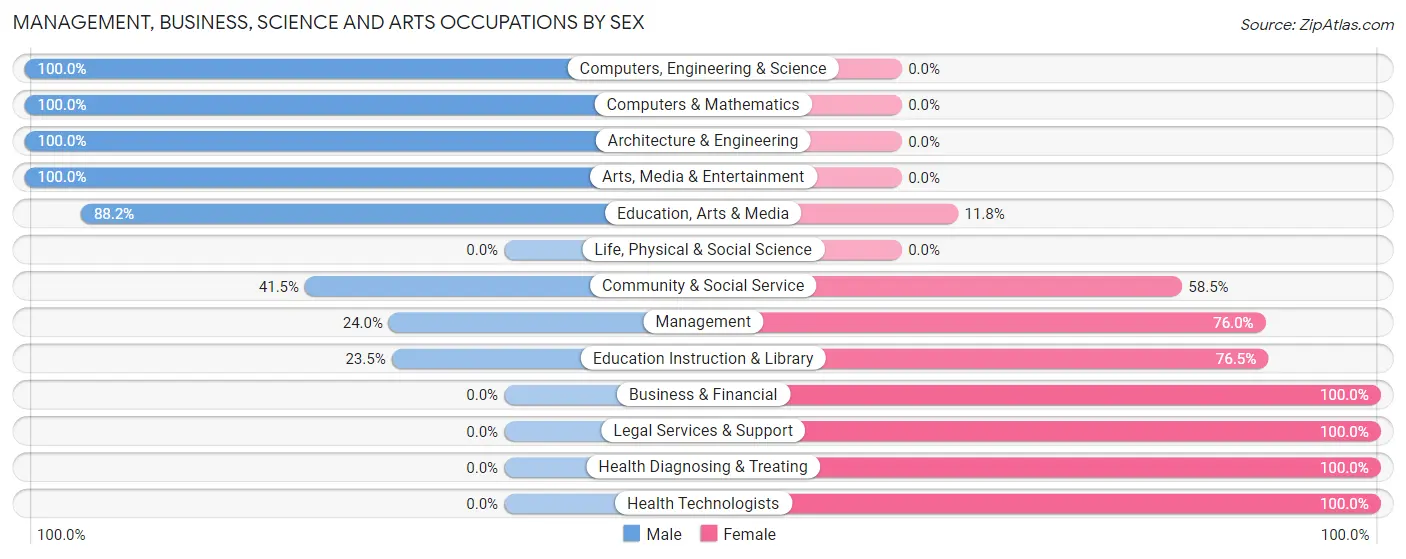
Management, Business, Science and Arts Occupations by Sex
Within the Management, Business, Science and Arts occupations in Luray, the most male-oriented occupations are Computers, Engineering & Science (100.0%), Computers & Mathematics (100.0%), and Architecture & Engineering (100.0%), while the most female-oriented occupations are Business & Financial (100.0%), Legal Services & Support (100.0%), and Health Diagnosing & Treating (100.0%).
| Occupation | Male | Female |
| Management | 31 (24.0%) | 98 (76.0%) |
| Business & Financial | 0 (0.0%) | 82 (100.0%) |
| Computers, Engineering & Science | 76 (100.0%) | 0 (0.0%) |
| Computers & Mathematics | 34 (100.0%) | 0 (0.0%) |
| Architecture & Engineering | 42 (100.0%) | 0 (0.0%) |
| Life, Physical & Social Science | 0 (0.0%) | 0 (0.0%) |
| Community & Social Service | 108 (41.5%) | 152 (58.5%) |
| Education, Arts & Media | 15 (88.2%) | 2 (11.8%) |
| Legal Services & Support | 0 (0.0%) | 26 (100.0%) |
| Education Instruction & Library | 38 (23.5%) | 124 (76.5%) |
| Arts, Media & Entertainment | 55 (100.0%) | 0 (0.0%) |
| Health Diagnosing & Treating | 0 (0.0%) | 65 (100.0%) |
| Health Technologists | 0 (0.0%) | 20 (100.0%) |
| Total (Category) | 215 (35.1%) | 397 (64.9%) |
| Total (Overall) | 1,058 (46.8%) | 1,205 (53.2%) |
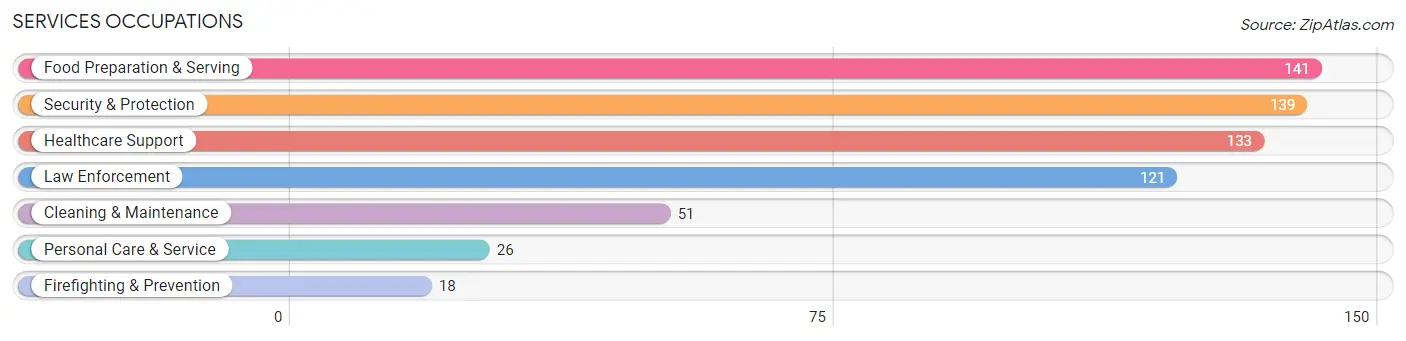
Services Occupations
The most common Services occupations in Luray are Food Preparation & Serving (141 | 6.2%), Security & Protection (139 | 6.1%), Healthcare Support (133 | 5.9%), Law Enforcement (121 | 5.3%), and Cleaning & Maintenance (51 | 2.2%).
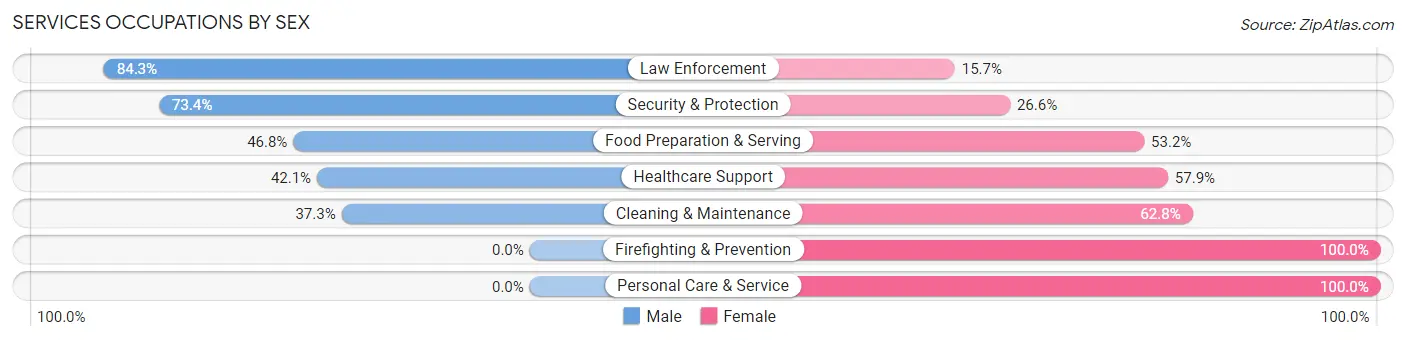
Services Occupations by Sex
Within the Services occupations in Luray, the most male-oriented occupations are Law Enforcement (84.3%), Security & Protection (73.4%), and Food Preparation & Serving (46.8%), while the most female-oriented occupations are Firefighting & Prevention (100.0%), Personal Care & Service (100.0%), and Cleaning & Maintenance (62.7%).
| Occupation | Male | Female |
| Healthcare Support | 56 (42.1%) | 77 (57.9%) |
| Security & Protection | 102 (73.4%) | 37 (26.6%) |
| Firefighting & Prevention | 0 (0.0%) | 18 (100.0%) |
| Law Enforcement | 102 (84.3%) | 19 (15.7%) |
| Food Preparation & Serving | 66 (46.8%) | 75 (53.2%) |
| Cleaning & Maintenance | 19 (37.2%) | 32 (62.7%) |
| Personal Care & Service | 0 (0.0%) | 26 (100.0%) |
| Total (Category) | 243 (49.6%) | 247 (50.4%) |
| Total (Overall) | 1,058 (46.8%) | 1,205 (53.2%) |
Sales and Office Occupations
The most common Sales and Office occupations in Luray are Sales & Related (301 | 13.3%), and Office & Administration (277 | 12.2%).

Sales and Office Occupations by Sex
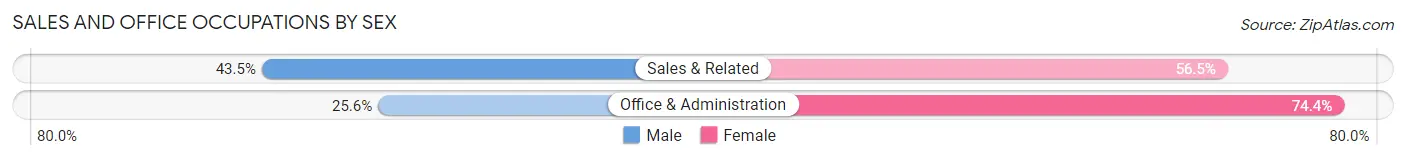
| Occupation | Male | Female |
| Sales & Related | 131 (43.5%) | 170 (56.5%) |
| Office & Administration | 71 (25.6%) | 206 (74.4%) |
| Total (Category) | 202 (34.9%) | 376 (65.0%) |
| Total (Overall) | 1,058 (46.8%) | 1,205 (53.2%) |
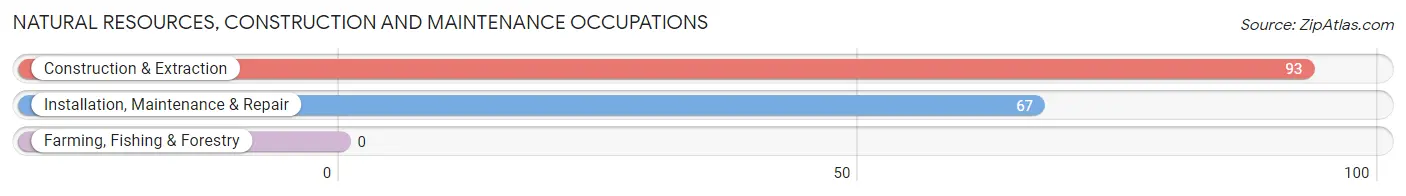
Natural Resources, Construction and Maintenance Occupations
The most common Natural Resources, Construction and Maintenance occupations in Luray are Construction & Extraction (93 | 4.1%), and Installation, Maintenance & Repair (67 | 3.0%).
Natural Resources, Construction and Maintenance Occupations by Sex
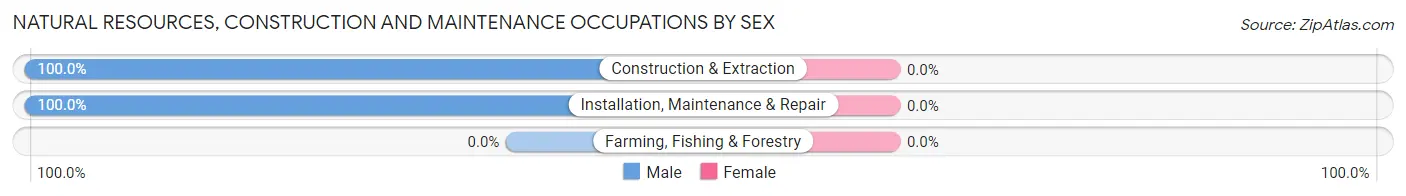
| Occupation | Male | Female |
| Farming, Fishing & Forestry | 0 (0.0%) | 0 (0.0%) |
| Construction & Extraction | 93 (100.0%) | 0 (0.0%) |
| Installation, Maintenance & Repair | 67 (100.0%) | 0 (0.0%) |
| Total (Category) | 160 (100.0%) | 0 (0.0%) |
| Total (Overall) | 1,058 (46.8%) | 1,205 (53.2%) |
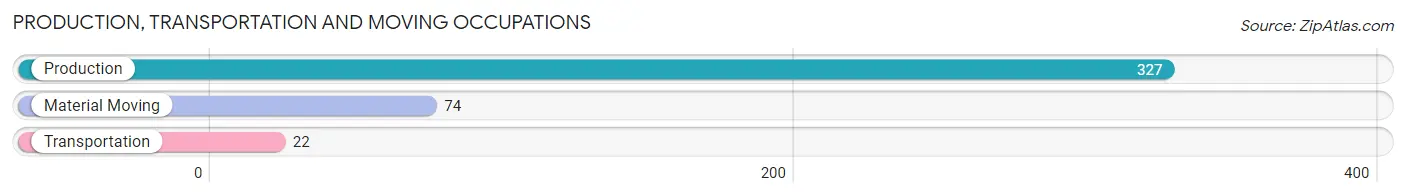
Production, Transportation and Moving Occupations
The most common Production, Transportation and Moving occupations in Luray are Production (327 | 14.4%), Material Moving (74 | 3.3%), and Transportation (22 | 1.0%).
Production, Transportation and Moving Occupations by Sex
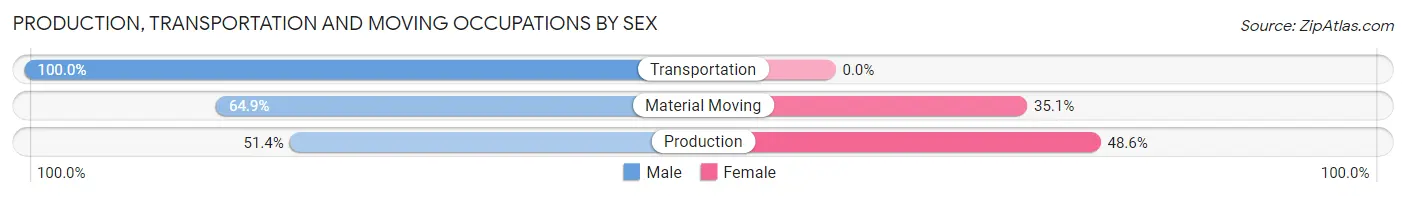
| Occupation | Male | Female |
| Production | 168 (51.4%) | 159 (48.6%) |
| Transportation | 22 (100.0%) | 0 (0.0%) |
| Material Moving | 48 (64.9%) | 26 (35.1%) |
| Total (Category) | 238 (56.3%) | 185 (43.7%) |
| Total (Overall) | 1,058 (46.8%) | 1,205 (53.2%) |
Employment Industries by Sex in Luray
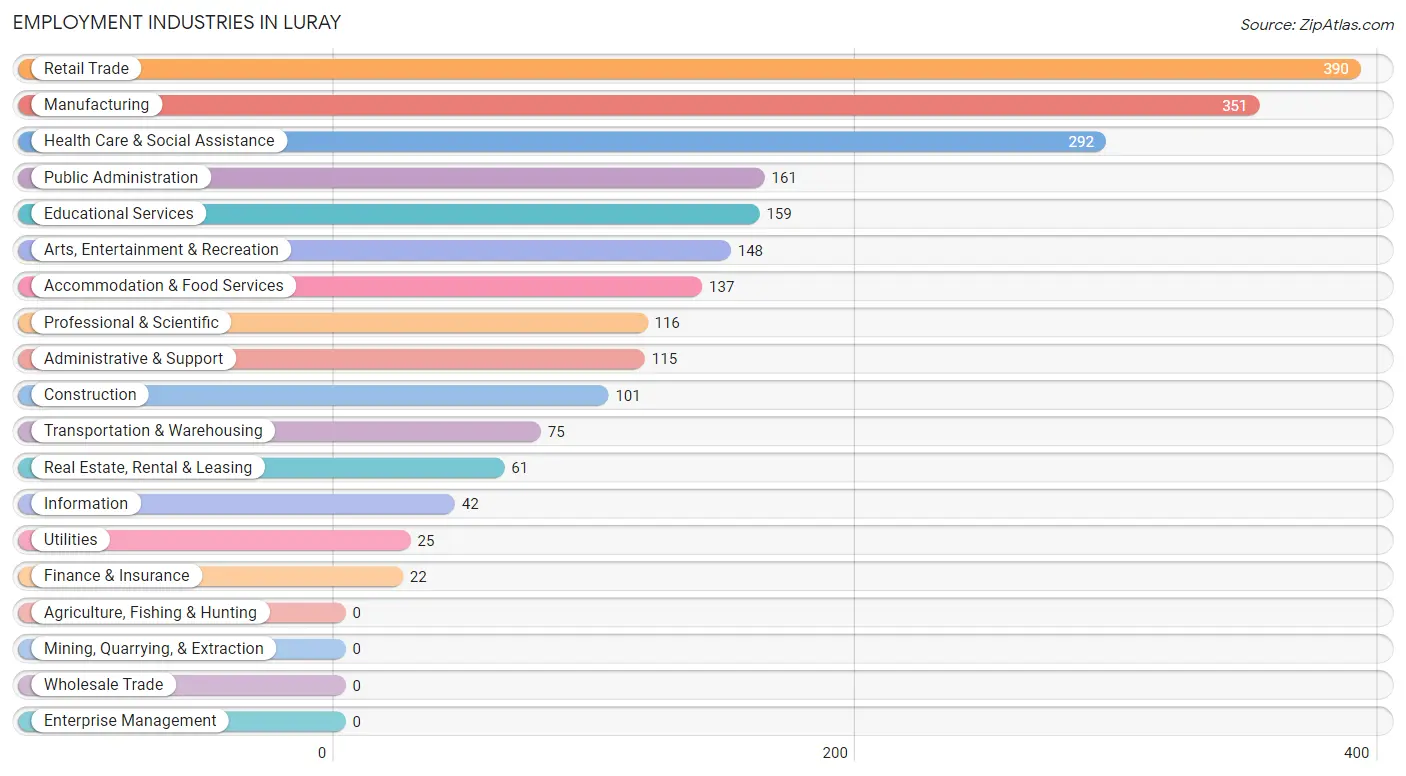
Employment Industries in Luray
The major employment industries in Luray include Retail Trade (390 | 17.2%), Manufacturing (351 | 15.5%), Health Care & Social Assistance (292 | 12.9%), Public Administration (161 | 7.1%), and Educational Services (159 | 7.0%).
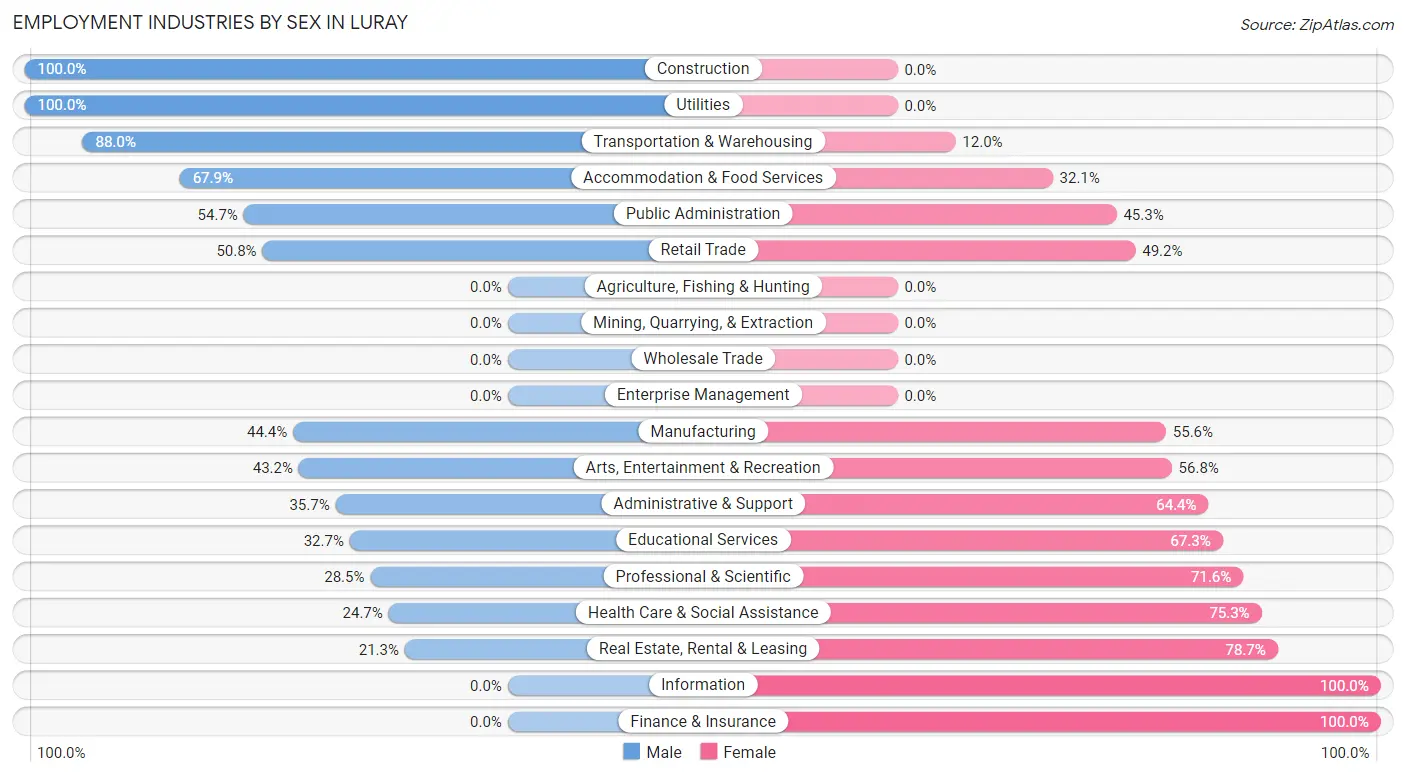
Employment Industries by Sex in Luray
The Luray industries that see more men than women are Construction (100.0%), Utilities (100.0%), and Transportation & Warehousing (88.0%), whereas the industries that tend to have a higher number of women are Information (100.0%), Finance & Insurance (100.0%), and Real Estate, Rental & Leasing (78.7%).
| Industry | Male | Female |
| Agriculture, Fishing & Hunting | 0 (0.0%) | 0 (0.0%) |
| Mining, Quarrying, & Extraction | 0 (0.0%) | 0 (0.0%) |
| Construction | 101 (100.0%) | 0 (0.0%) |
| Manufacturing | 156 (44.4%) | 195 (55.6%) |
| Wholesale Trade | 0 (0.0%) | 0 (0.0%) |
| Retail Trade | 198 (50.8%) | 192 (49.2%) |
| Transportation & Warehousing | 66 (88.0%) | 9 (12.0%) |
| Utilities | 25 (100.0%) | 0 (0.0%) |
| Information | 0 (0.0%) | 42 (100.0%) |
| Finance & Insurance | 0 (0.0%) | 22 (100.0%) |
| Real Estate, Rental & Leasing | 13 (21.3%) | 48 (78.7%) |
| Professional & Scientific | 33 (28.4%) | 83 (71.6%) |
| Enterprise Management | 0 (0.0%) | 0 (0.0%) |
| Administrative & Support | 41 (35.6%) | 74 (64.3%) |
| Educational Services | 52 (32.7%) | 107 (67.3%) |
| Health Care & Social Assistance | 72 (24.7%) | 220 (75.3%) |
| Arts, Entertainment & Recreation | 64 (43.2%) | 84 (56.8%) |
| Accommodation & Food Services | 93 (67.9%) | 44 (32.1%) |
| Public Administration | 88 (54.7%) | 73 (45.3%) |
| Total | 1,058 (46.8%) | 1,205 (53.2%) |
Education in Luray
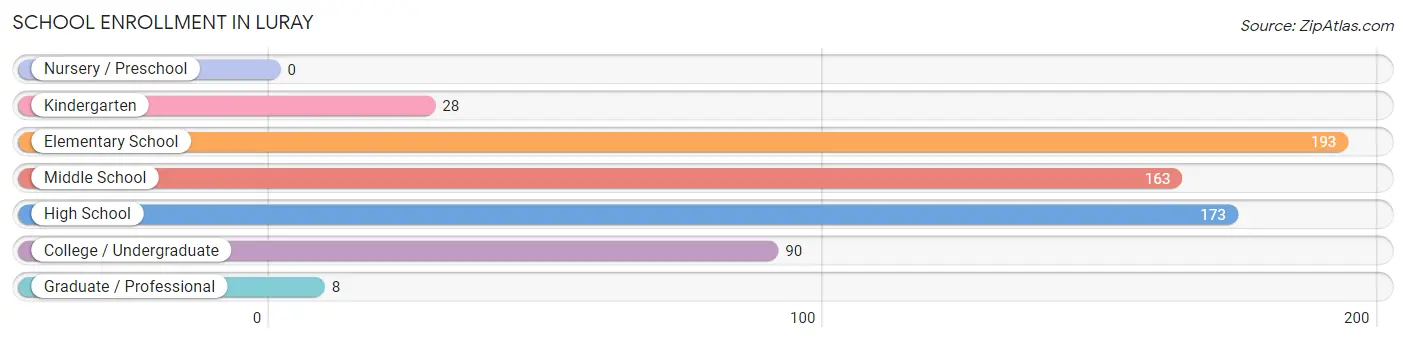
School Enrollment in Luray
The most common levels of schooling among the 655 students in Luray are elementary school (193 | 29.5%), high school (173 | 26.4%), and middle school (163 | 24.9%).
| School Level | # Students | % Students |
| Nursery / Preschool | 0 | 0.0% |
| Kindergarten | 28 | 4.3% |
| Elementary School | 193 | 29.5% |
| Middle School | 163 | 24.9% |
| High School | 173 | 26.4% |
| College / Undergraduate | 90 | 13.7% |
| Graduate / Professional | 8 | 1.2% |
| Total | 655 | 100.0% |
School Enrollment by Age by Funding Source in Luray
Out of a total of 655 students who are enrolled in schools in Luray, 76 (11.6%) attend a private institution, while the remaining 579 (88.4%) are enrolled in public schools. The age group of 10 to 14 year olds has the highest likelihood of being enrolled in private schools, with 68 (29.2% in the age bracket) enrolled. Conversely, the age group of 5 to 9 year old has the lowest likelihood of being enrolled in a private school, with 193 (100.0% in the age bracket) attending a public institution.
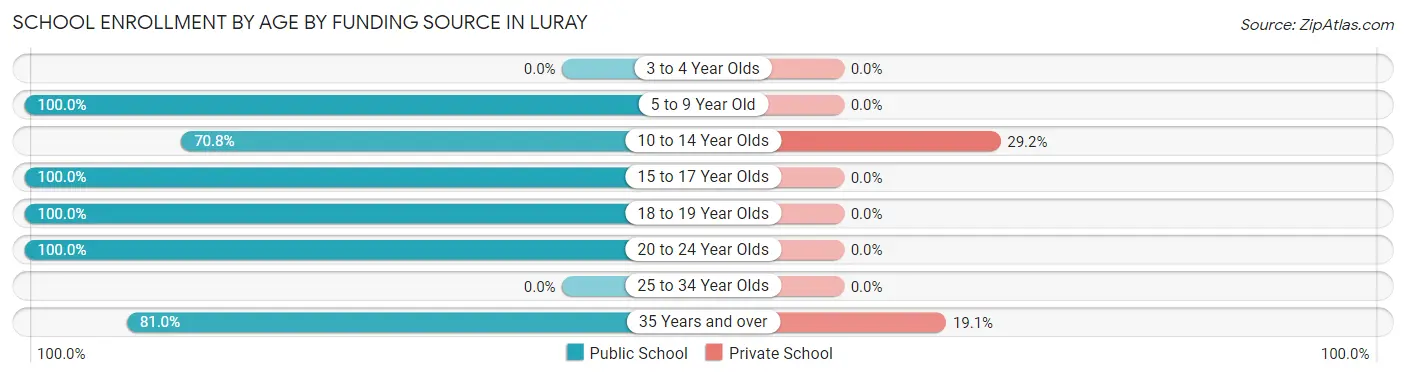
| Age Bracket | Public School | Private School |
| 3 to 4 Year Olds | 0 (0.0%) | 0 (0.0%) |
| 5 to 9 Year Old | 193 (100.0%) | 0 (0.0%) |
| 10 to 14 Year Olds | 165 (70.8%) | 68 (29.2%) |
| 15 to 17 Year Olds | 110 (100.0%) | 0 (0.0%) |
| 18 to 19 Year Olds | 30 (100.0%) | 0 (0.0%) |
| 20 to 24 Year Olds | 47 (100.0%) | 0 (0.0%) |
| 25 to 34 Year Olds | 0 (0.0%) | 0 (0.0%) |
| 35 Years and over | 34 (80.9%) | 8 (19.1%) |
| Total | 579 (88.4%) | 76 (11.6%) |
Educational Attainment by Field of Study in Luray
Arts & humanities (151 | 19.6%), bio, nature & agricultural (119 | 15.4%), liberal arts & history (91 | 11.8%), education (87 | 11.3%), and business (73 | 9.5%) are the most common fields of study among 770 individuals in Luray who have obtained a bachelor's degree or higher.
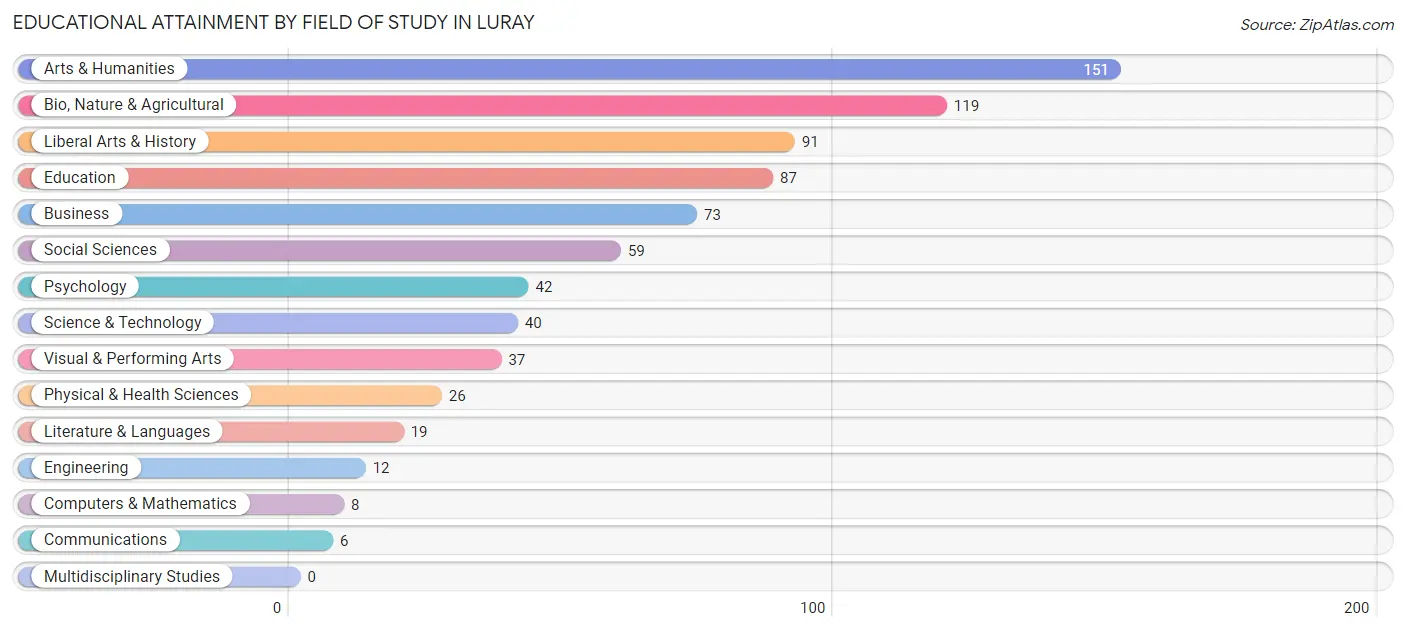
| Field of Study | # Graduates | % Graduates |
| Computers & Mathematics | 8 | 1.0% |
| Bio, Nature & Agricultural | 119 | 15.4% |
| Physical & Health Sciences | 26 | 3.4% |
| Psychology | 42 | 5.4% |
| Social Sciences | 59 | 7.7% |
| Engineering | 12 | 1.6% |
| Multidisciplinary Studies | 0 | 0.0% |
| Science & Technology | 40 | 5.2% |
| Business | 73 | 9.5% |
| Education | 87 | 11.3% |
| Literature & Languages | 19 | 2.5% |
| Liberal Arts & History | 91 | 11.8% |
| Visual & Performing Arts | 37 | 4.8% |
| Communications | 6 | 0.8% |
| Arts & Humanities | 151 | 19.6% |
| Total | 770 | 100.0% |
Transportation & Commute in Luray
Vehicle Availability by Sex in Luray
The most prevalent vehicle ownership categories in Luray are males with 2 vehicles (459, accounting for 43.4%) and females with 2 vehicles (422, making up 38.6%).
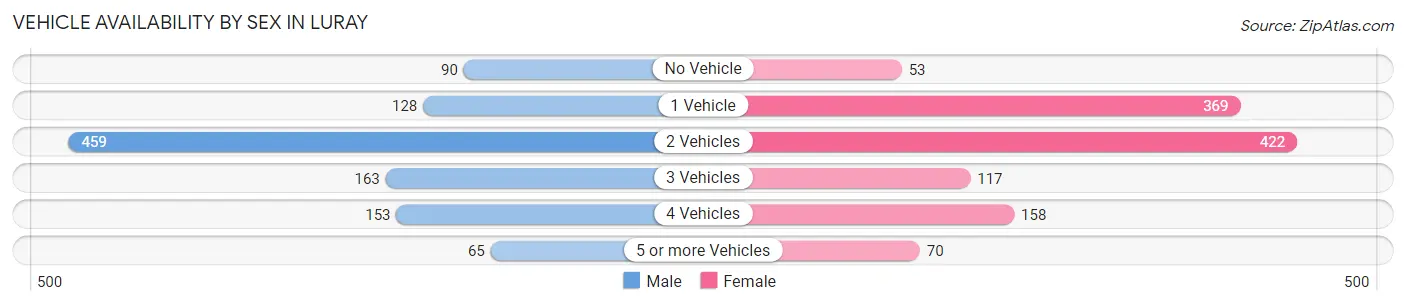
| Vehicles Available | Male | Female |
| No Vehicle | 90 (8.5%) | 53 (4.5%) |
| 1 Vehicle | 128 (12.1%) | 369 (31.0%) |
| 2 Vehicles | 459 (43.4%) | 422 (35.5%) |
| 3 Vehicles | 163 (15.4%) | 117 (9.8%) |
| 4 Vehicles | 153 (14.5%) | 158 (13.3%) |
| 5 or more Vehicles | 65 (6.1%) | 70 (5.9%) |
| Total | 1,058 (100.0%) | 1,189 (100.0%) |
Commute Time in Luray
The most frequently occuring commute durations in Luray are 5 to 9 minutes (578 commuters, 27.5%), less than 5 minutes (354 commuters, 16.8%), and 10 to 14 minutes (238 commuters, 11.3%).
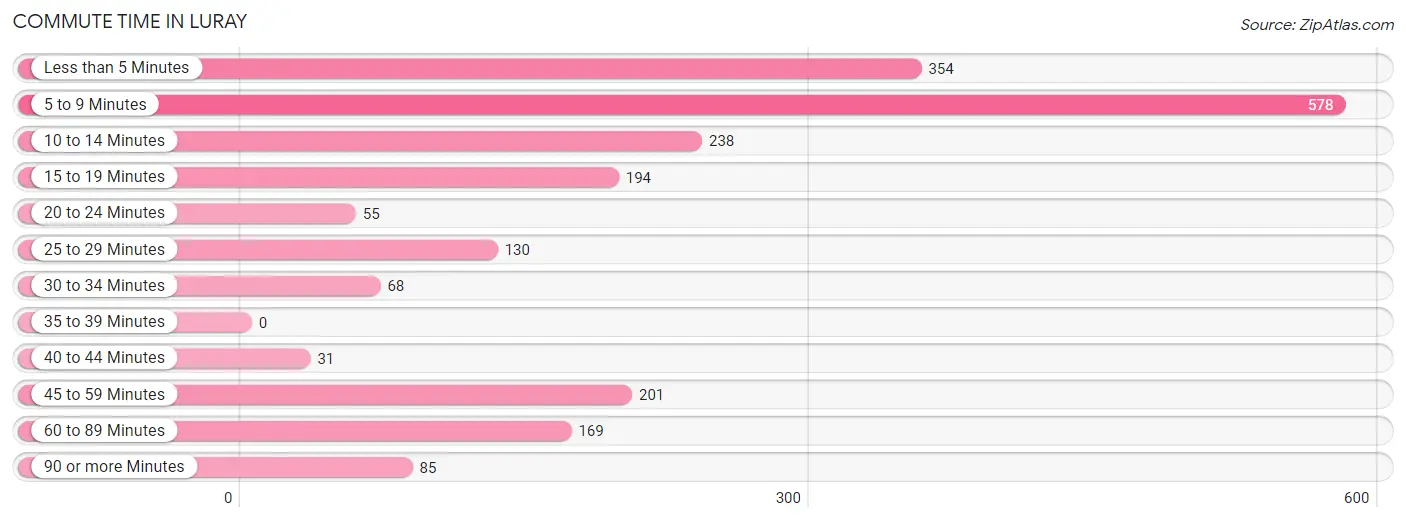
| Commute Time | # Commuters | % Commuters |
| Less than 5 Minutes | 354 | 16.8% |
| 5 to 9 Minutes | 578 | 27.5% |
| 10 to 14 Minutes | 238 | 11.3% |
| 15 to 19 Minutes | 194 | 9.2% |
| 20 to 24 Minutes | 55 | 2.6% |
| 25 to 29 Minutes | 130 | 6.2% |
| 30 to 34 Minutes | 68 | 3.2% |
| 35 to 39 Minutes | 0 | 0.0% |
| 40 to 44 Minutes | 31 | 1.5% |
| 45 to 59 Minutes | 201 | 9.6% |
| 60 to 89 Minutes | 169 | 8.0% |
| 90 or more Minutes | 85 | 4.0% |
Commute Time by Sex in Luray
The most common commute times in Luray are 5 to 9 minutes (242 commuters, 24.7%) for males and 5 to 9 minutes (336 commuters, 29.9%) for females.
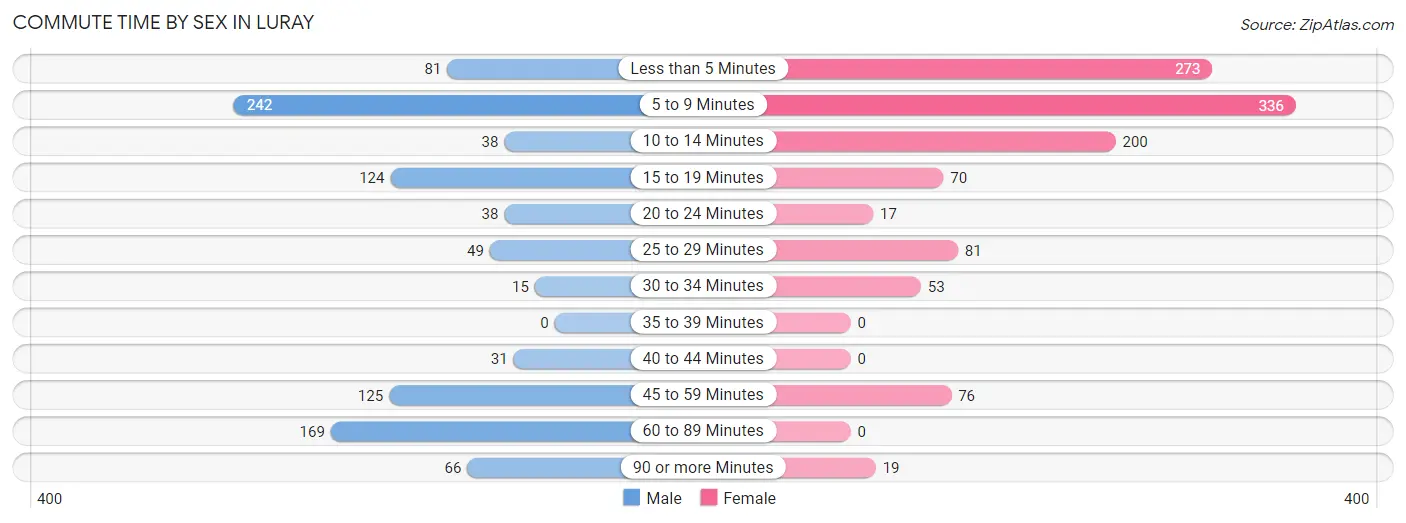
| Commute Time | Male | Female |
| Less than 5 Minutes | 81 (8.3%) | 273 (24.3%) |
| 5 to 9 Minutes | 242 (24.7%) | 336 (29.9%) |
| 10 to 14 Minutes | 38 (3.9%) | 200 (17.8%) |
| 15 to 19 Minutes | 124 (12.7%) | 70 (6.2%) |
| 20 to 24 Minutes | 38 (3.9%) | 17 (1.5%) |
| 25 to 29 Minutes | 49 (5.0%) | 81 (7.2%) |
| 30 to 34 Minutes | 15 (1.5%) | 53 (4.7%) |
| 35 to 39 Minutes | 0 (0.0%) | 0 (0.0%) |
| 40 to 44 Minutes | 31 (3.2%) | 0 (0.0%) |
| 45 to 59 Minutes | 125 (12.8%) | 76 (6.8%) |
| 60 to 89 Minutes | 169 (17.3%) | 0 (0.0%) |
| 90 or more Minutes | 66 (6.8%) | 19 (1.7%) |
Time of Departure to Work by Sex in Luray
The most frequent times of departure to work in Luray are 12:00 AM to 4:59 AM (134, 13.7%) for males and 7:30 AM to 7:59 AM (193, 17.2%) for females.
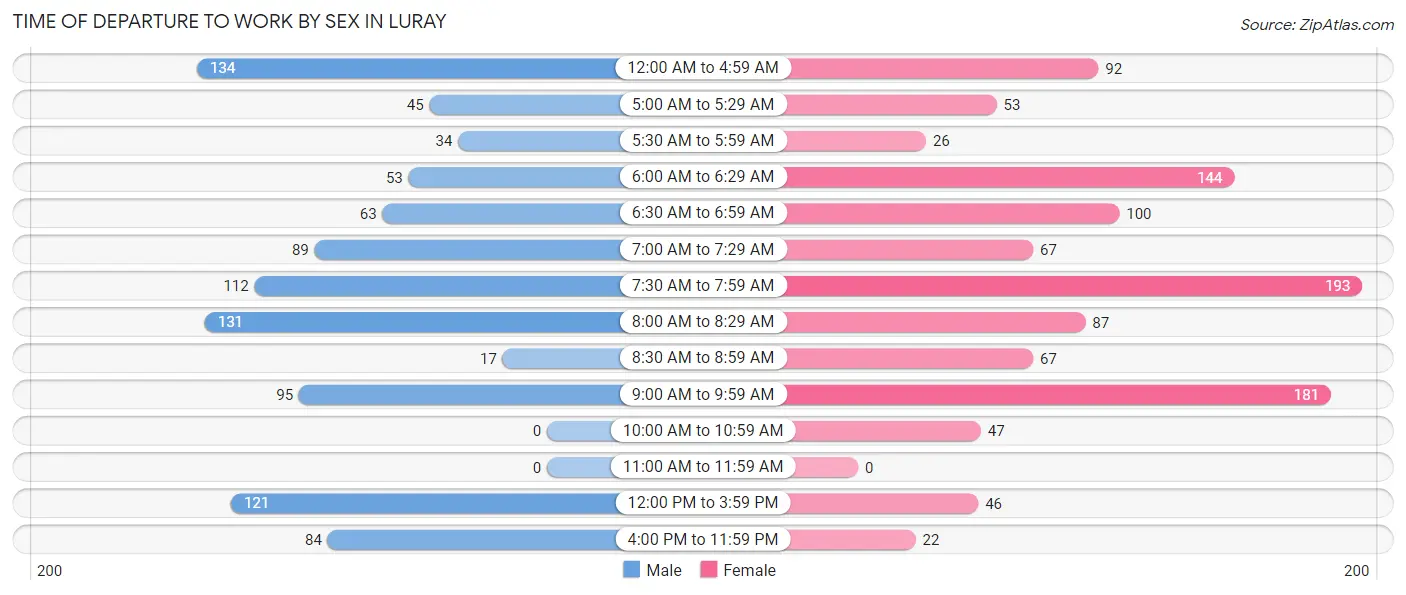
| Time of Departure | Male | Female |
| 12:00 AM to 4:59 AM | 134 (13.7%) | 92 (8.2%) |
| 5:00 AM to 5:29 AM | 45 (4.6%) | 53 (4.7%) |
| 5:30 AM to 5:59 AM | 34 (3.5%) | 26 (2.3%) |
| 6:00 AM to 6:29 AM | 53 (5.4%) | 144 (12.8%) |
| 6:30 AM to 6:59 AM | 63 (6.4%) | 100 (8.9%) |
| 7:00 AM to 7:29 AM | 89 (9.1%) | 67 (6.0%) |
| 7:30 AM to 7:59 AM | 112 (11.5%) | 193 (17.2%) |
| 8:00 AM to 8:29 AM | 131 (13.4%) | 87 (7.7%) |
| 8:30 AM to 8:59 AM | 17 (1.7%) | 67 (6.0%) |
| 9:00 AM to 9:59 AM | 95 (9.7%) | 181 (16.1%) |
| 10:00 AM to 10:59 AM | 0 (0.0%) | 47 (4.2%) |
| 11:00 AM to 11:59 AM | 0 (0.0%) | 0 (0.0%) |
| 12:00 PM to 3:59 PM | 121 (12.4%) | 46 (4.1%) |
| 4:00 PM to 11:59 PM | 84 (8.6%) | 22 (2.0%) |
| Total | 978 (100.0%) | 1,125 (100.0%) |
Housing Occupancy in Luray
Occupancy by Ownership in Luray
Of the total 2,333 dwellings in Luray, owner-occupied units account for 1,538 (65.9%), while renter-occupied units make up 795 (34.1%).
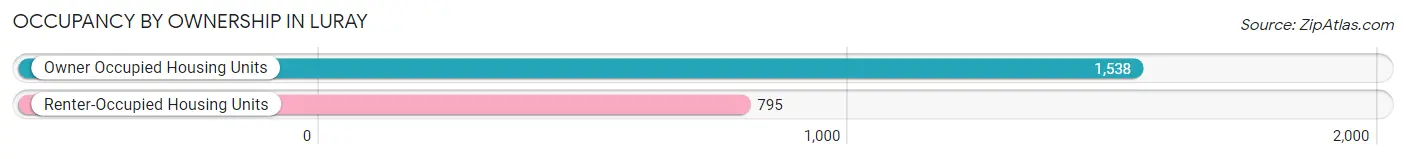
| Occupancy | # Housing Units | % Housing Units |
| Owner Occupied Housing Units | 1,538 | 65.9% |
| Renter-Occupied Housing Units | 795 | 34.1% |
| Total Occupied Housing Units | 2,333 | 100.0% |
Occupancy by Household Size in Luray
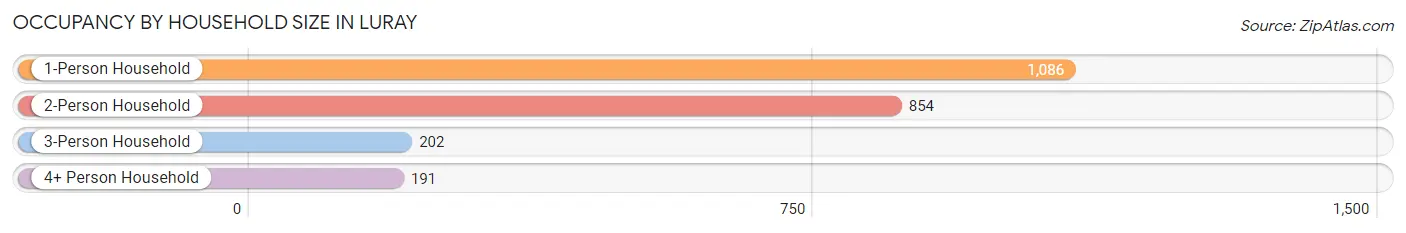
| Household Size | # Housing Units | % Housing Units |
| 1-Person Household | 1,086 | 46.6% |
| 2-Person Household | 854 | 36.6% |
| 3-Person Household | 202 | 8.7% |
| 4+ Person Household | 191 | 8.2% |
| Total Housing Units | 2,333 | 100.0% |
Occupancy by Ownership by Household Size in Luray
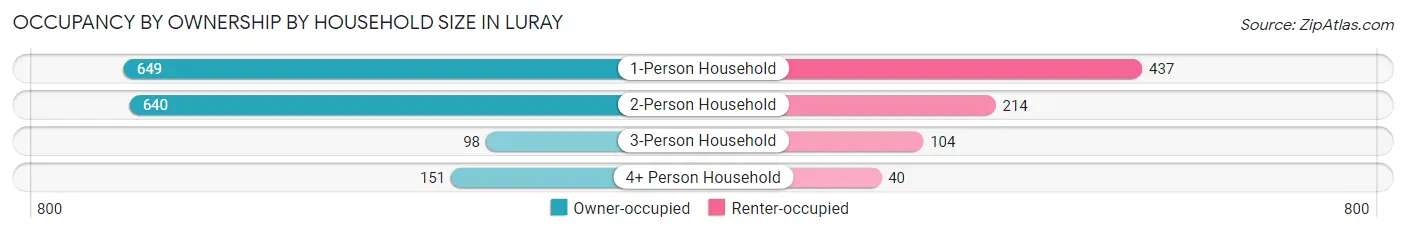
| Household Size | Owner-occupied | Renter-occupied |
| 1-Person Household | 649 (59.8%) | 437 (40.2%) |
| 2-Person Household | 640 (74.9%) | 214 (25.1%) |
| 3-Person Household | 98 (48.5%) | 104 (51.5%) |
| 4+ Person Household | 151 (79.1%) | 40 (20.9%) |
| Total Housing Units | 1,538 (65.9%) | 795 (34.1%) |
Occupancy by Educational Attainment in Luray
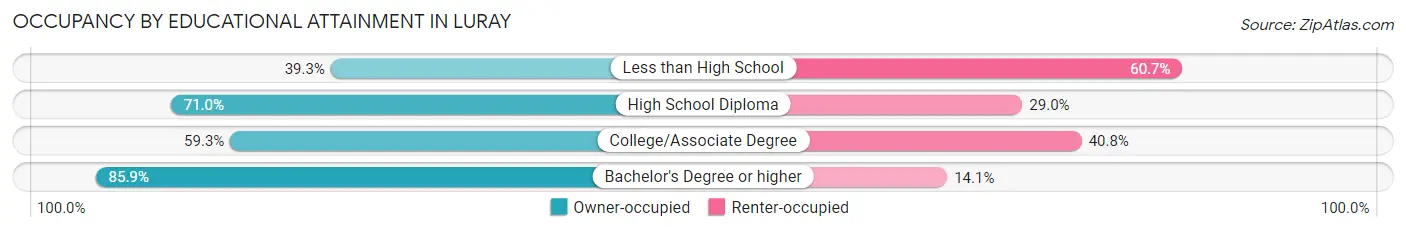
| Household Size | Owner-occupied | Renter-occupied |
| Less than High School | 136 (39.3%) | 210 (60.7%) |
| High School Diploma | 534 (71.0%) | 218 (29.0%) |
| College/Associate Degree | 429 (59.3%) | 295 (40.7%) |
| Bachelor's Degree or higher | 439 (85.9%) | 72 (14.1%) |
Occupancy by Age of Householder in Luray
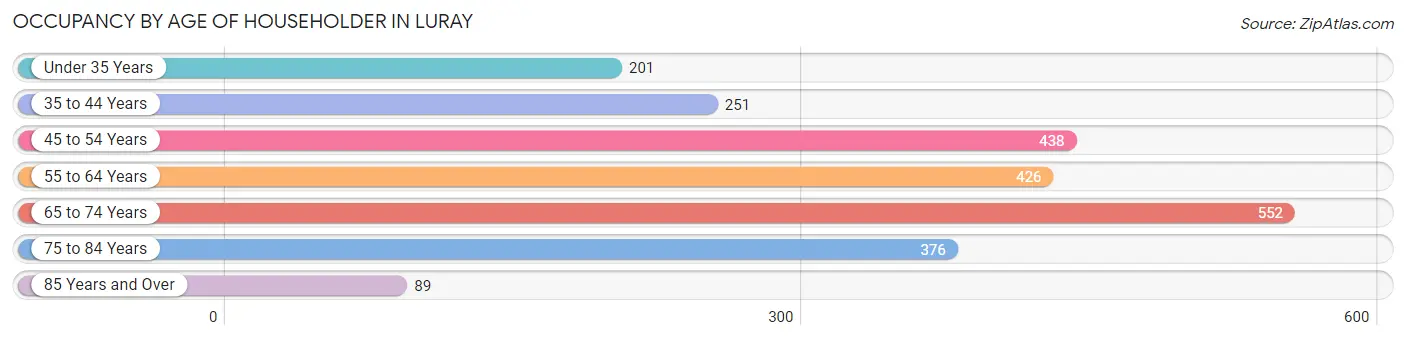
| Age Bracket | # Households | % Households |
| Under 35 Years | 201 | 8.6% |
| 35 to 44 Years | 251 | 10.8% |
| 45 to 54 Years | 438 | 18.8% |
| 55 to 64 Years | 426 | 18.3% |
| 65 to 74 Years | 552 | 23.7% |
| 75 to 84 Years | 376 | 16.1% |
| 85 Years and Over | 89 | 3.8% |
| Total | 2,333 | 100.0% |
Housing Finances in Luray
Median Income by Occupancy in Luray
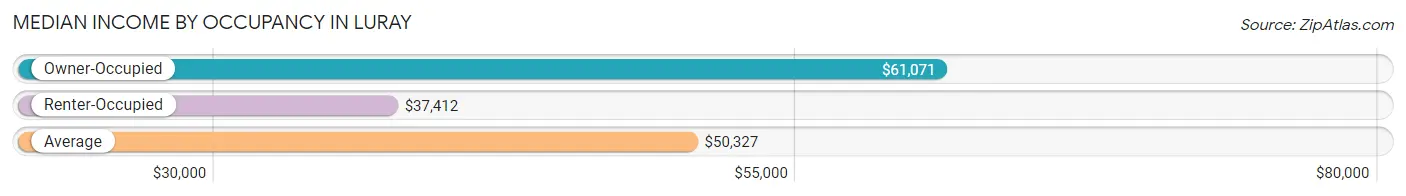
| Occupancy Type | # Households | Median Income |
| Owner-Occupied | 1,538 (65.9%) | $61,071 |
| Renter-Occupied | 795 (34.1%) | $37,412 |
| Average | 2,333 (100.0%) | $50,327 |
Occupancy by Householder Income Bracket in Luray
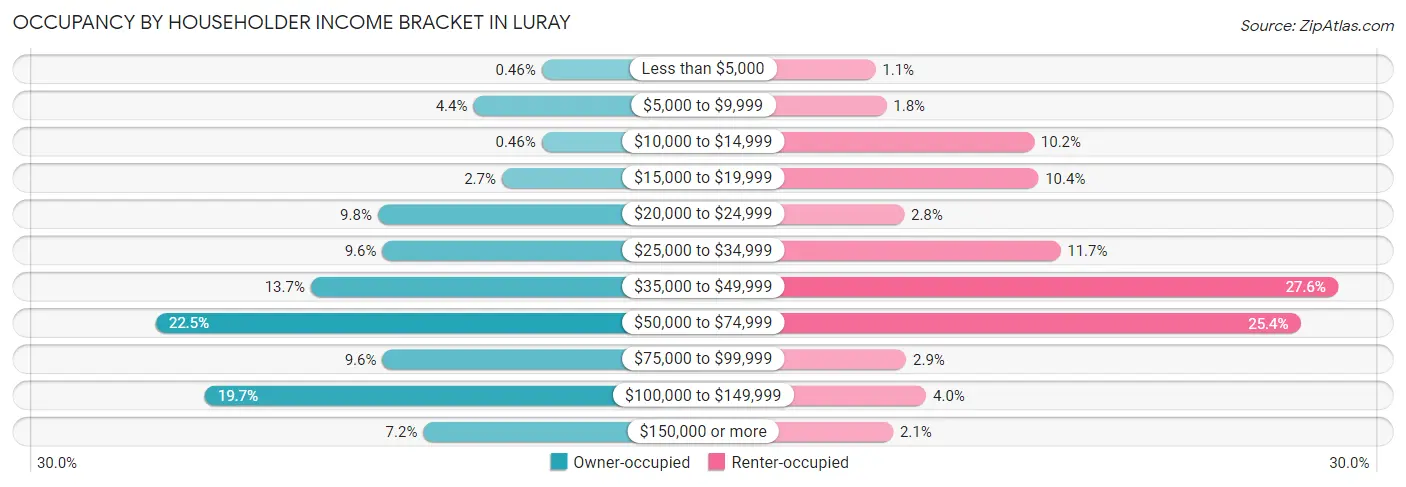
| Income Bracket | Owner-occupied | Renter-occupied |
| Less than $5,000 | 7 (0.5%) | 9 (1.1%) |
| $5,000 to $9,999 | 67 (4.4%) | 14 (1.8%) |
| $10,000 to $14,999 | 7 (0.5%) | 81 (10.2%) |
| $15,000 to $19,999 | 42 (2.7%) | 83 (10.4%) |
| $20,000 to $24,999 | 151 (9.8%) | 22 (2.8%) |
| $25,000 to $34,999 | 147 (9.6%) | 93 (11.7%) |
| $35,000 to $49,999 | 210 (13.7%) | 219 (27.6%) |
| $50,000 to $74,999 | 346 (22.5%) | 202 (25.4%) |
| $75,000 to $99,999 | 147 (9.6%) | 23 (2.9%) |
| $100,000 to $149,999 | 303 (19.7%) | 32 (4.0%) |
| $150,000 or more | 111 (7.2%) | 17 (2.1%) |
| Total | 1,538 (100.0%) | 795 (100.0%) |
Monthly Housing Cost Tiers in Luray
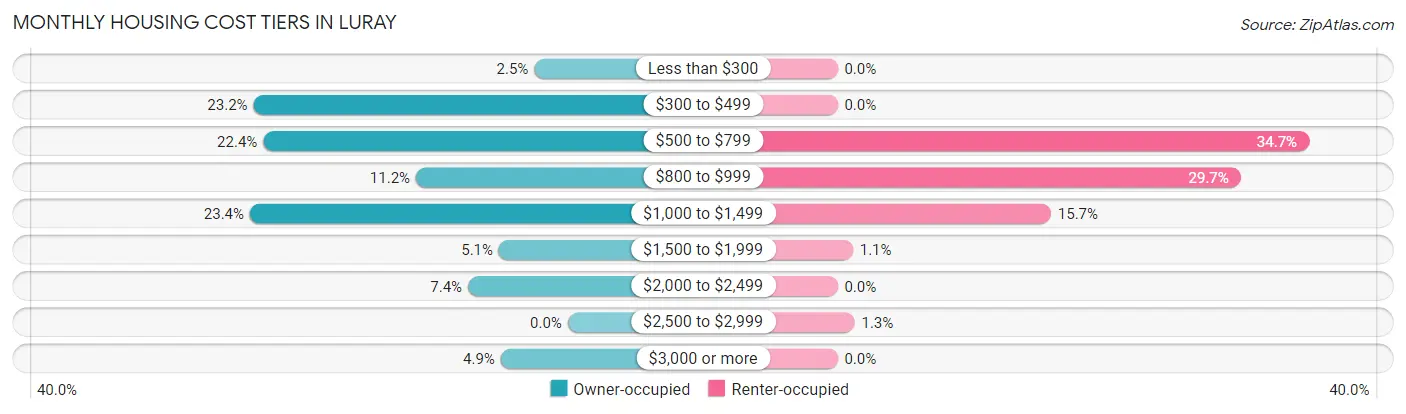
| Monthly Cost | Owner-occupied | Renter-occupied |
| Less than $300 | 38 (2.5%) | 0 (0.0%) |
| $300 to $499 | 356 (23.2%) | 0 (0.0%) |
| $500 to $799 | 345 (22.4%) | 276 (34.7%) |
| $800 to $999 | 172 (11.2%) | 236 (29.7%) |
| $1,000 to $1,499 | 360 (23.4%) | 125 (15.7%) |
| $1,500 to $1,999 | 78 (5.1%) | 9 (1.1%) |
| $2,000 to $2,499 | 113 (7.3%) | 0 (0.0%) |
| $2,500 to $2,999 | 0 (0.0%) | 10 (1.3%) |
| $3,000 or more | 76 (4.9%) | 0 (0.0%) |
| Total | 1,538 (100.0%) | 795 (100.0%) |
Physical Housing Characteristics in Luray
Housing Structures in Luray
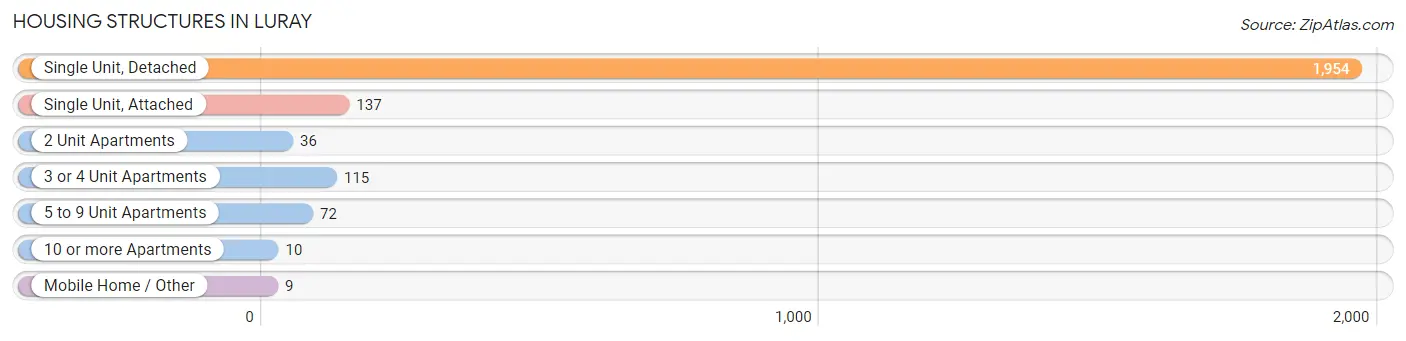
| Structure Type | # Housing Units | % Housing Units |
| Single Unit, Detached | 1,954 | 83.8% |
| Single Unit, Attached | 137 | 5.9% |
| 2 Unit Apartments | 36 | 1.5% |
| 3 or 4 Unit Apartments | 115 | 4.9% |
| 5 to 9 Unit Apartments | 72 | 3.1% |
| 10 or more Apartments | 10 | 0.4% |
| Mobile Home / Other | 9 | 0.4% |
| Total | 2,333 | 100.0% |
Housing Structures by Occupancy in Luray
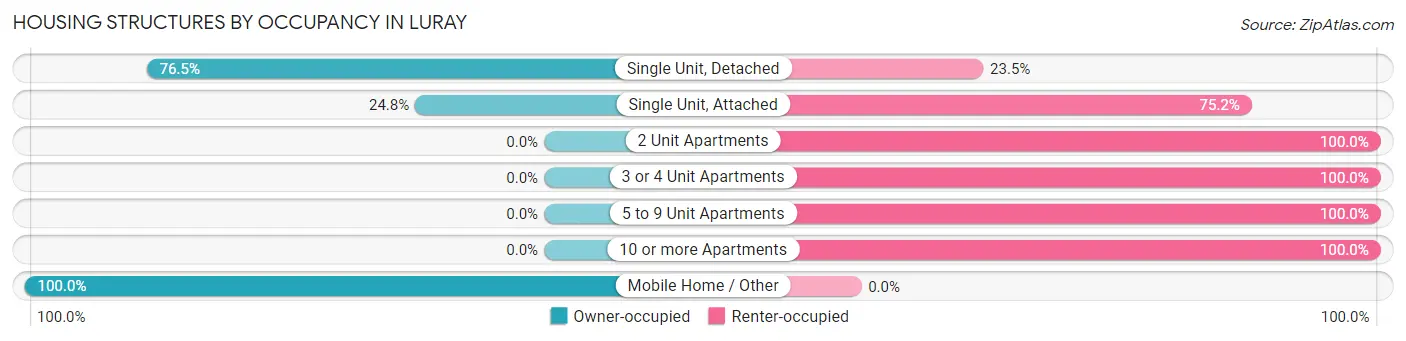
| Structure Type | Owner-occupied | Renter-occupied |
| Single Unit, Detached | 1,495 (76.5%) | 459 (23.5%) |
| Single Unit, Attached | 34 (24.8%) | 103 (75.2%) |
| 2 Unit Apartments | 0 (0.0%) | 36 (100.0%) |
| 3 or 4 Unit Apartments | 0 (0.0%) | 115 (100.0%) |
| 5 to 9 Unit Apartments | 0 (0.0%) | 72 (100.0%) |
| 10 or more Apartments | 0 (0.0%) | 10 (100.0%) |
| Mobile Home / Other | 9 (100.0%) | 0 (0.0%) |
| Total | 1,538 (65.9%) | 795 (34.1%) |
Housing Structures by Number of Rooms in Luray
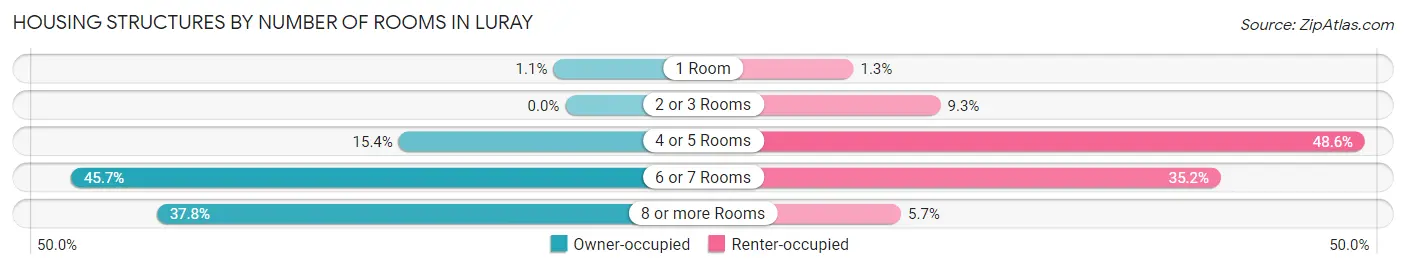
| Number of Rooms | Owner-occupied | Renter-occupied |
| 1 Room | 17 (1.1%) | 10 (1.3%) |
| 2 or 3 Rooms | 0 (0.0%) | 74 (9.3%) |
| 4 or 5 Rooms | 237 (15.4%) | 386 (48.5%) |
| 6 or 7 Rooms | 703 (45.7%) | 280 (35.2%) |
| 8 or more Rooms | 581 (37.8%) | 45 (5.7%) |
| Total | 1,538 (100.0%) | 795 (100.0%) |
Housing Structure by Heating Type in Luray
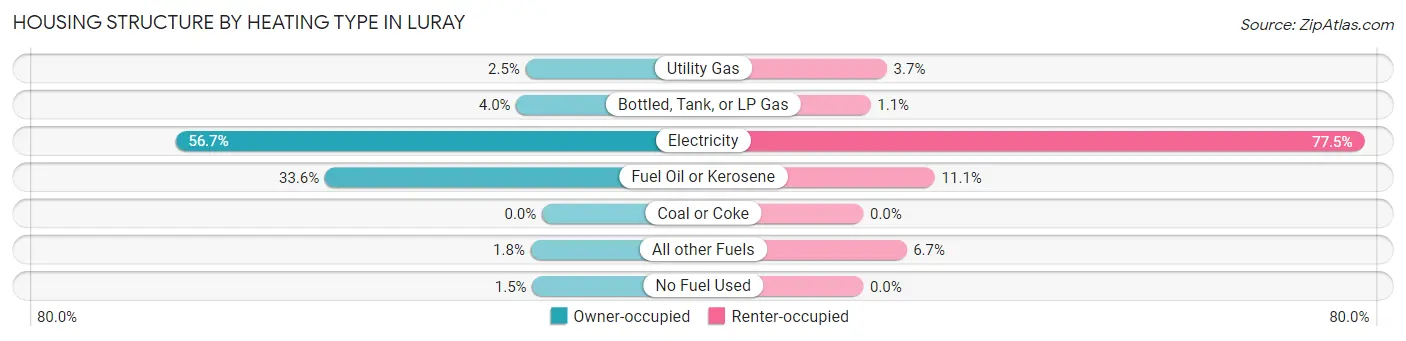
| Heating Type | Owner-occupied | Renter-occupied |
| Utility Gas | 39 (2.5%) | 29 (3.6%) |
| Bottled, Tank, or LP Gas | 61 (4.0%) | 9 (1.1%) |
| Electricity | 872 (56.7%) | 616 (77.5%) |
| Fuel Oil or Kerosene | 516 (33.6%) | 88 (11.1%) |
| Coal or Coke | 0 (0.0%) | 0 (0.0%) |
| All other Fuels | 27 (1.8%) | 53 (6.7%) |
| No Fuel Used | 23 (1.5%) | 0 (0.0%) |
| Total | 1,538 (100.0%) | 795 (100.0%) |
Household Vehicle Usage in Luray
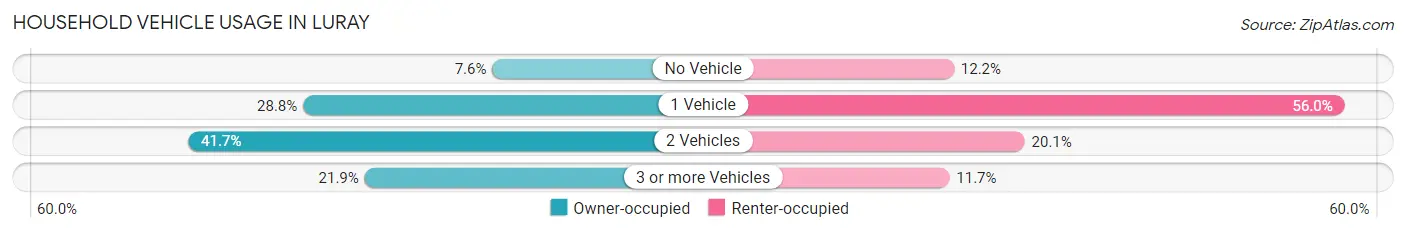
| Vehicles per Household | Owner-occupied | Renter-occupied |
| No Vehicle | 117 (7.6%) | 97 (12.2%) |
| 1 Vehicle | 443 (28.8%) | 445 (56.0%) |
| 2 Vehicles | 641 (41.7%) | 160 (20.1%) |
| 3 or more Vehicles | 337 (21.9%) | 93 (11.7%) |
| Total | 1,538 (100.0%) | 795 (100.0%) |
Real Estate & Mortgages in Luray
Real Estate and Mortgage Overview in Luray
| Characteristic | Without Mortgage | With Mortgage |
| Housing Units | 814 | 724 |
| Median Property Value | $218,600 | $219,100 |
| Median Household Income | $49,688 | $78 |
| Monthly Housing Costs | $510 | $76 |
| Real Estate Taxes | $2,108 | $55 |
Property Value by Mortgage Status in Luray
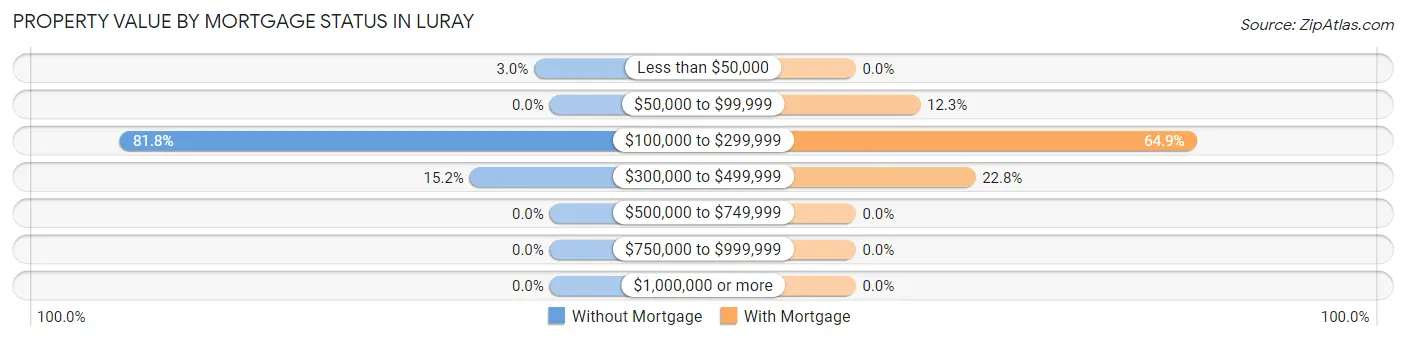
| Property Value | Without Mortgage | With Mortgage |
| Less than $50,000 | 24 (2.9%) | 0 (0.0%) |
| $50,000 to $99,999 | 0 (0.0%) | 89 (12.3%) |
| $100,000 to $299,999 | 666 (81.8%) | 470 (64.9%) |
| $300,000 to $499,999 | 124 (15.2%) | 165 (22.8%) |
| $500,000 to $749,999 | 0 (0.0%) | 0 (0.0%) |
| $750,000 to $999,999 | 0 (0.0%) | 0 (0.0%) |
| $1,000,000 or more | 0 (0.0%) | 0 (0.0%) |
| Total | 814 (100.0%) | 724 (100.0%) |
Household Income by Mortgage Status in Luray
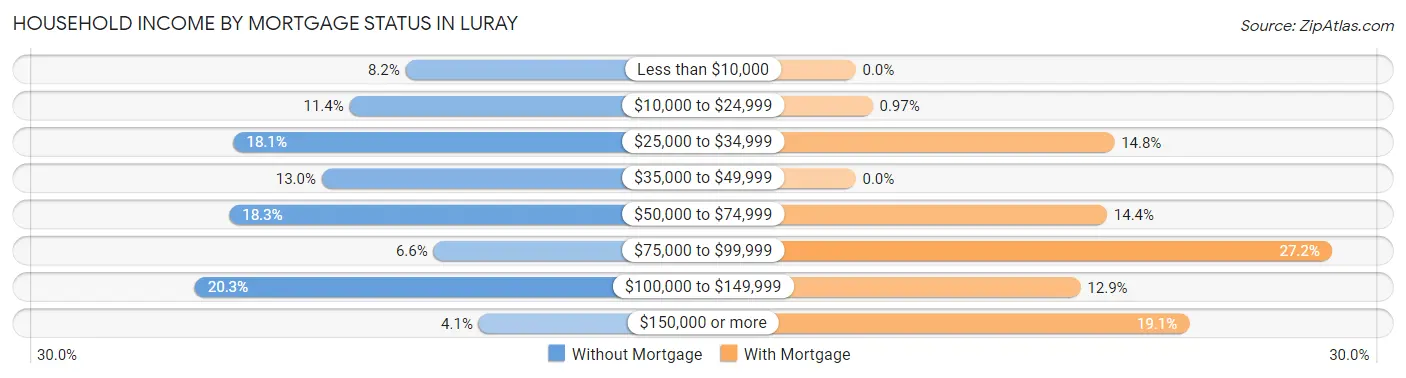
| Household Income | Without Mortgage | With Mortgage |
| Less than $10,000 | 67 (8.2%) | 0 (0.0%) |
| $10,000 to $24,999 | 93 (11.4%) | 7 (1.0%) |
| $25,000 to $34,999 | 147 (18.1%) | 107 (14.8%) |
| $35,000 to $49,999 | 106 (13.0%) | 0 (0.0%) |
| $50,000 to $74,999 | 149 (18.3%) | 104 (14.4%) |
| $75,000 to $99,999 | 54 (6.6%) | 197 (27.2%) |
| $100,000 to $149,999 | 165 (20.3%) | 93 (12.9%) |
| $150,000 or more | 33 (4.1%) | 138 (19.1%) |
| Total | 814 (100.0%) | 724 (100.0%) |
Property Value to Household Income Ratio in Luray
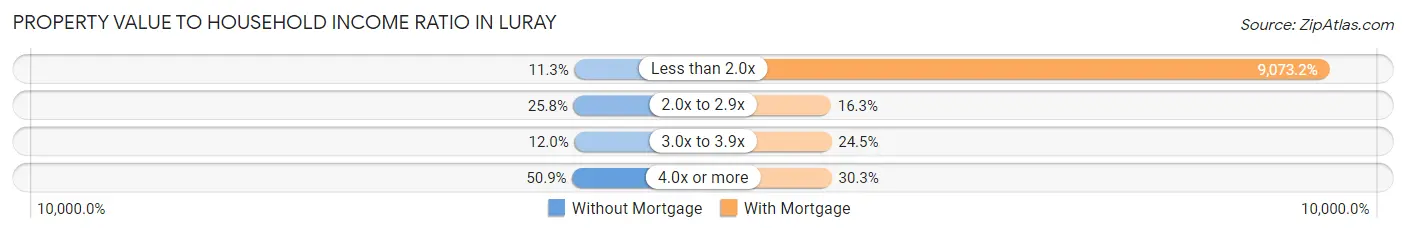
| Value-to-Income Ratio | Without Mortgage | With Mortgage |
| Less than 2.0x | 92 (11.3%) | 65,690 (9,073.2%) |
| 2.0x to 2.9x | 210 (25.8%) | 118 (16.3%) |
| 3.0x to 3.9x | 98 (12.0%) | 177 (24.4%) |
| 4.0x or more | 414 (50.9%) | 219 (30.2%) |
| Total | 814 (100.0%) | 724 (100.0%) |
Real Estate Taxes by Mortgage Status in Luray
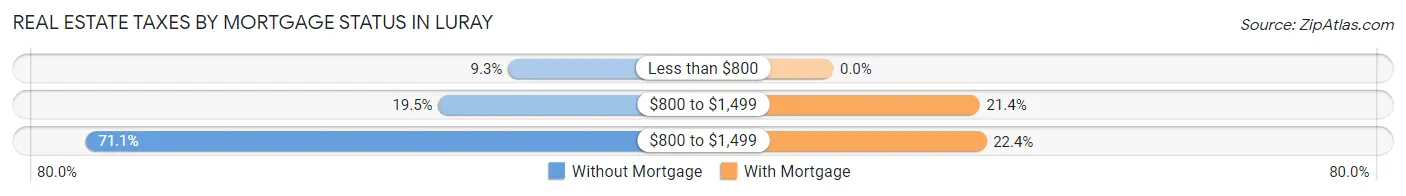
| Property Taxes | Without Mortgage | With Mortgage |
| Less than $800 | 76 (9.3%) | 0 (0.0%) |
| $800 to $1,499 | 159 (19.5%) | 155 (21.4%) |
| $800 to $1,499 | 579 (71.1%) | 162 (22.4%) |
| Total | 814 (100.0%) | 724 (100.0%) |
Health & Disability in Luray
Health Insurance Coverage by Age in Luray
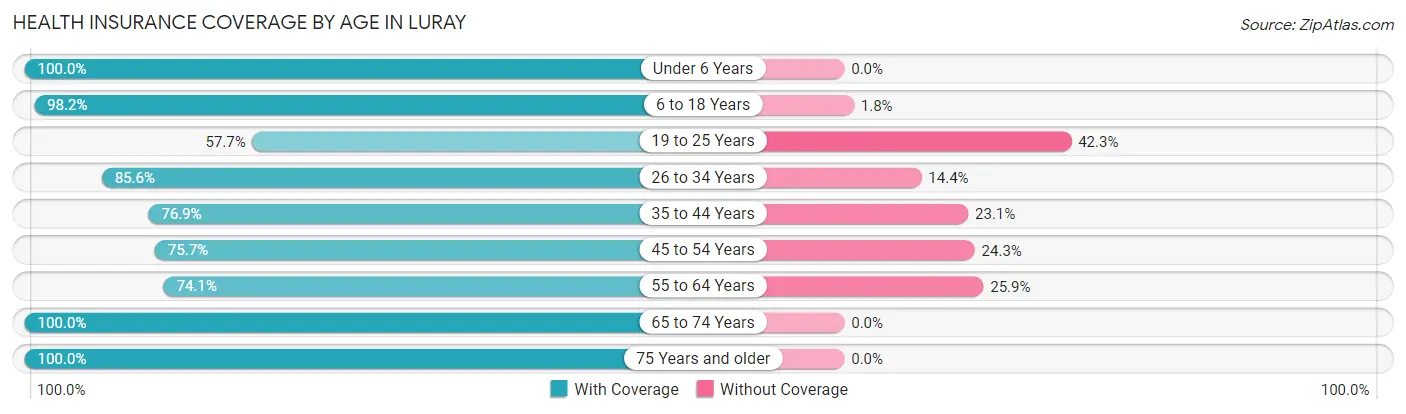
| Age Bracket | With Coverage | Without Coverage |
| Under 6 Years | 147 (100.0%) | 0 (0.0%) |
| 6 to 18 Years | 551 (98.2%) | 10 (1.8%) |
| 19 to 25 Years | 229 (57.7%) | 168 (42.3%) |
| 26 to 34 Years | 262 (85.6%) | 44 (14.4%) |
| 35 to 44 Years | 453 (76.9%) | 136 (23.1%) |
| 45 to 54 Years | 414 (75.7%) | 133 (24.3%) |
| 55 to 64 Years | 546 (74.1%) | 191 (25.9%) |
| 65 to 74 Years | 758 (100.0%) | 0 (0.0%) |
| 75 Years and older | 585 (100.0%) | 0 (0.0%) |
| Total | 3,945 (85.3%) | 682 (14.7%) |
Health Insurance Coverage by Citizenship Status in Luray
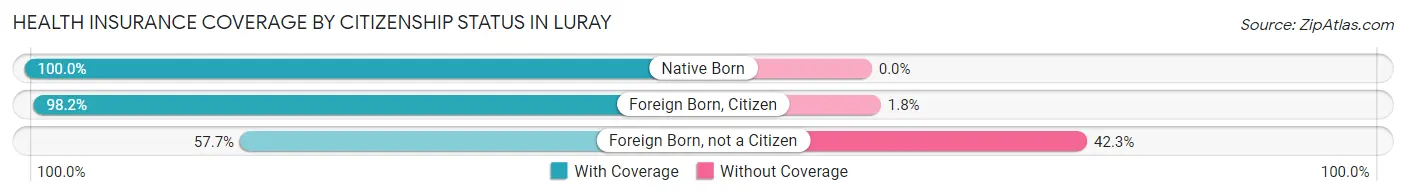
| Citizenship Status | With Coverage | Without Coverage |
| Native Born | 147 (100.0%) | 0 (0.0%) |
| Foreign Born, Citizen | 551 (98.2%) | 10 (1.8%) |
| Foreign Born, not a Citizen | 229 (57.7%) | 168 (42.3%) |
Health Insurance Coverage by Household Income in Luray
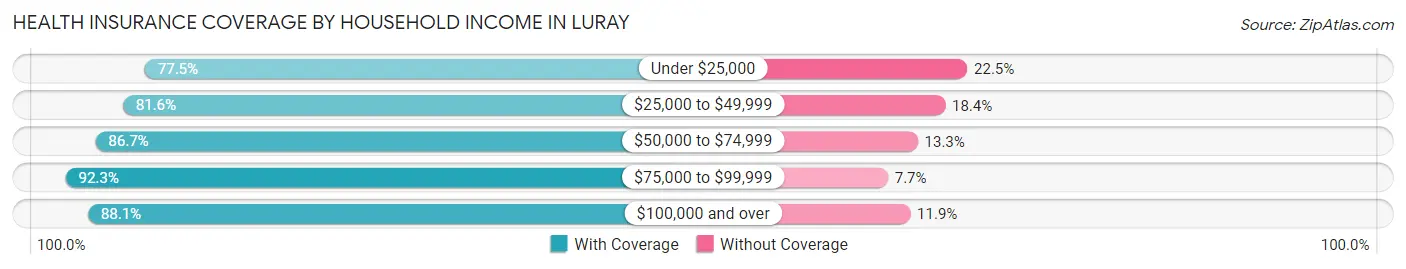
| Household Income | With Coverage | Without Coverage |
| Under $25,000 | 464 (77.5%) | 135 (22.5%) |
| $25,000 to $49,999 | 900 (81.6%) | 203 (18.4%) |
| $50,000 to $74,999 | 980 (86.7%) | 150 (13.3%) |
| $75,000 to $99,999 | 421 (92.3%) | 35 (7.7%) |
| $100,000 and over | 1,180 (88.1%) | 159 (11.9%) |
Public vs Private Health Insurance Coverage by Age in Luray
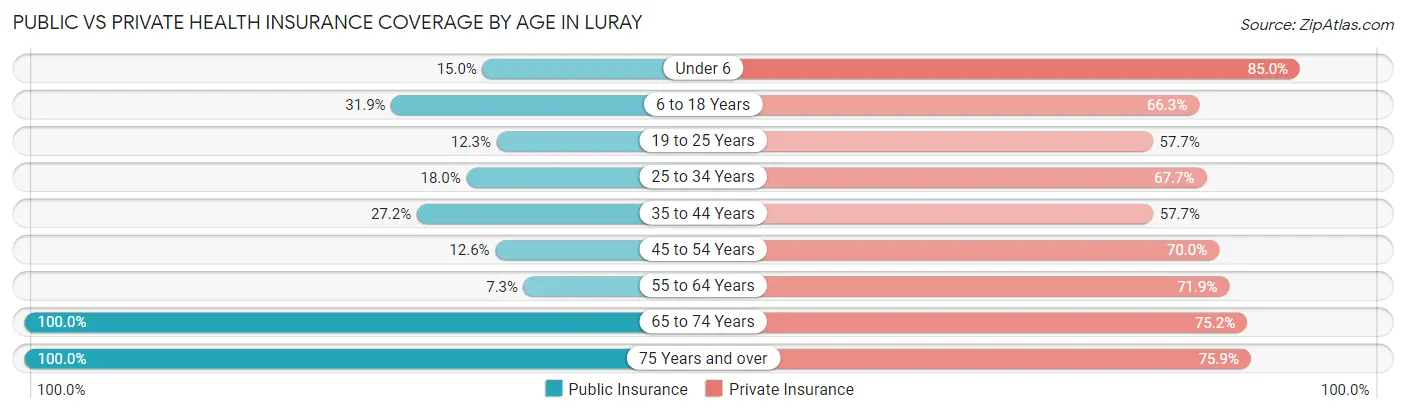
| Age Bracket | Public Insurance | Private Insurance |
| Under 6 | 22 (15.0%) | 125 (85.0%) |
| 6 to 18 Years | 179 (31.9%) | 372 (66.3%) |
| 19 to 25 Years | 49 (12.3%) | 229 (57.7%) |
| 25 to 34 Years | 55 (18.0%) | 207 (67.6%) |
| 35 to 44 Years | 160 (27.2%) | 340 (57.7%) |
| 45 to 54 Years | 69 (12.6%) | 383 (70.0%) |
| 55 to 64 Years | 54 (7.3%) | 530 (71.9%) |
| 65 to 74 Years | 758 (100.0%) | 570 (75.2%) |
| 75 Years and over | 585 (100.0%) | 444 (75.9%) |
| Total | 1,931 (41.7%) | 3,200 (69.2%) |
Disability Status by Sex by Age in Luray
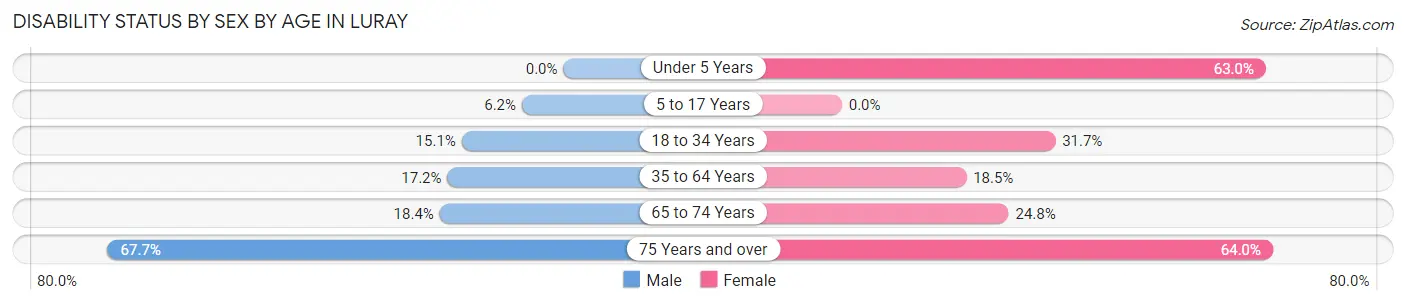
| Age Bracket | Male | Female |
| Under 5 Years | 0 (0.0%) | 17 (63.0%) |
| 5 to 17 Years | 21 (6.2%) | 0 (0.0%) |
| 18 to 34 Years | 74 (15.1%) | 77 (31.7%) |
| 35 to 64 Years | 151 (17.2%) | 184 (18.5%) |
| 65 to 74 Years | 45 (18.4%) | 127 (24.8%) |
| 75 Years and over | 159 (67.7%) | 224 (64.0%) |
Disability Class by Sex by Age in Luray
Disability Class: Hearing Difficulty
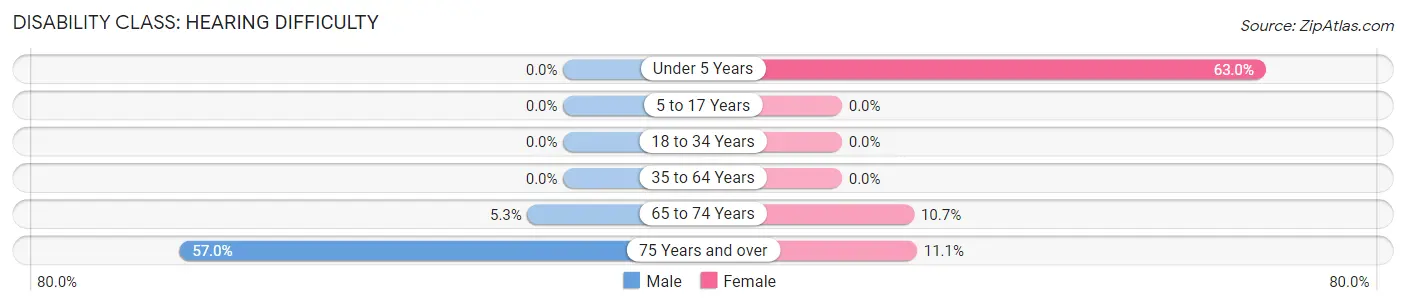
| Age Bracket | Male | Female |
| Under 5 Years | 0 (0.0%) | 17 (63.0%) |
| 5 to 17 Years | 0 (0.0%) | 0 (0.0%) |
| 18 to 34 Years | 0 (0.0%) | 0 (0.0%) |
| 35 to 64 Years | 0 (0.0%) | 0 (0.0%) |
| 65 to 74 Years | 13 (5.3%) | 55 (10.7%) |
| 75 Years and over | 134 (57.0%) | 39 (11.1%) |
Disability Class: Vision Difficulty
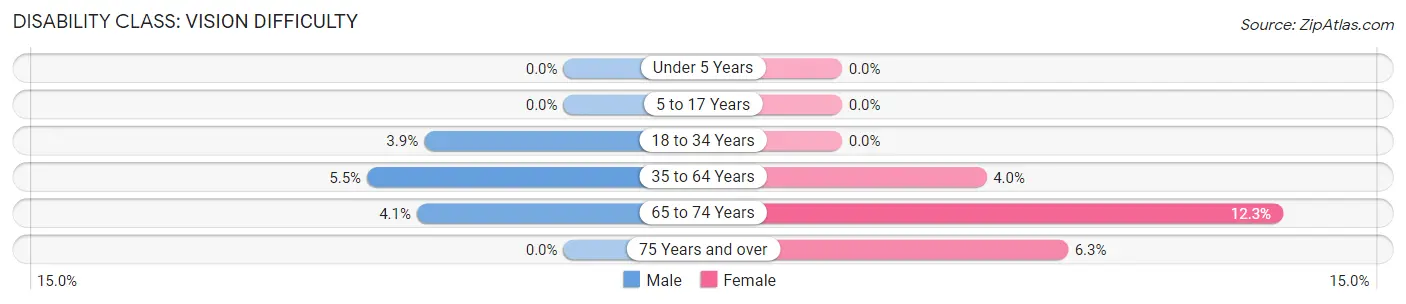
| Age Bracket | Male | Female |
| Under 5 Years | 0 (0.0%) | 0 (0.0%) |
| 5 to 17 Years | 0 (0.0%) | 0 (0.0%) |
| 18 to 34 Years | 19 (3.9%) | 0 (0.0%) |
| 35 to 64 Years | 48 (5.5%) | 40 (4.0%) |
| 65 to 74 Years | 10 (4.1%) | 63 (12.3%) |
| 75 Years and over | 0 (0.0%) | 22 (6.3%) |
Disability Class: Cognitive Difficulty
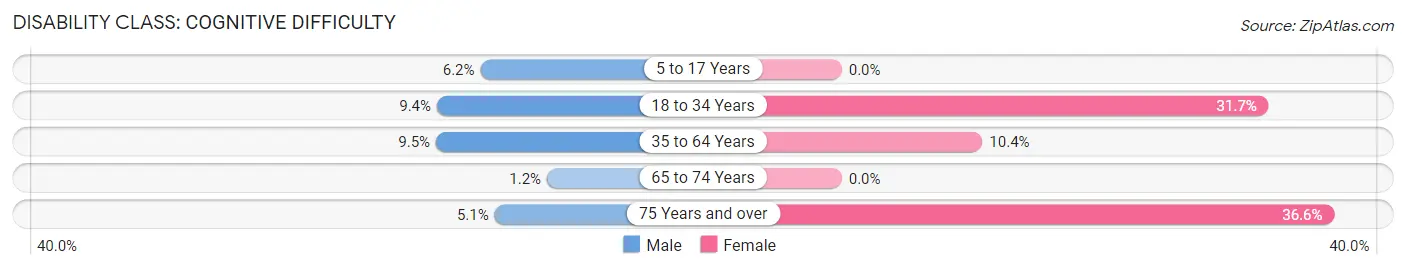
| Age Bracket | Male | Female |
| 5 to 17 Years | 21 (6.2%) | 0 (0.0%) |
| 18 to 34 Years | 46 (9.4%) | 77 (31.7%) |
| 35 to 64 Years | 83 (9.5%) | 104 (10.4%) |
| 65 to 74 Years | 3 (1.2%) | 0 (0.0%) |
| 75 Years and over | 12 (5.1%) | 128 (36.6%) |
Disability Class: Ambulatory Difficulty
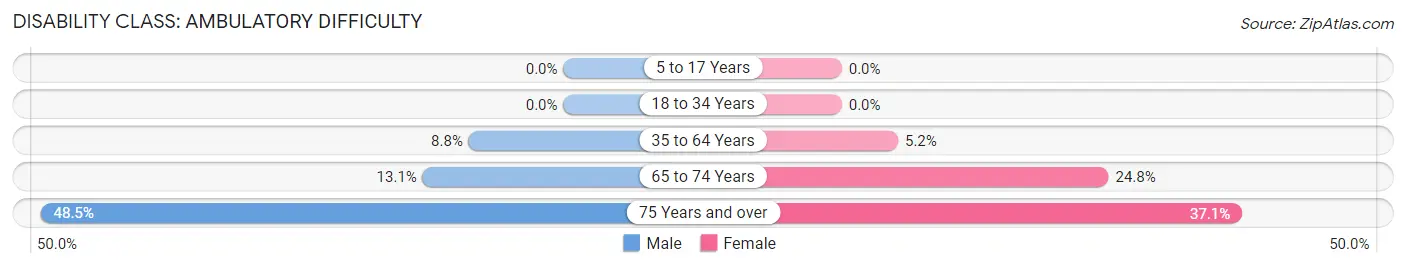
| Age Bracket | Male | Female |
| 5 to 17 Years | 0 (0.0%) | 0 (0.0%) |
| 18 to 34 Years | 0 (0.0%) | 0 (0.0%) |
| 35 to 64 Years | 77 (8.8%) | 52 (5.2%) |
| 65 to 74 Years | 32 (13.1%) | 127 (24.8%) |
| 75 Years and over | 114 (48.5%) | 130 (37.1%) |
Disability Class: Self-Care Difficulty
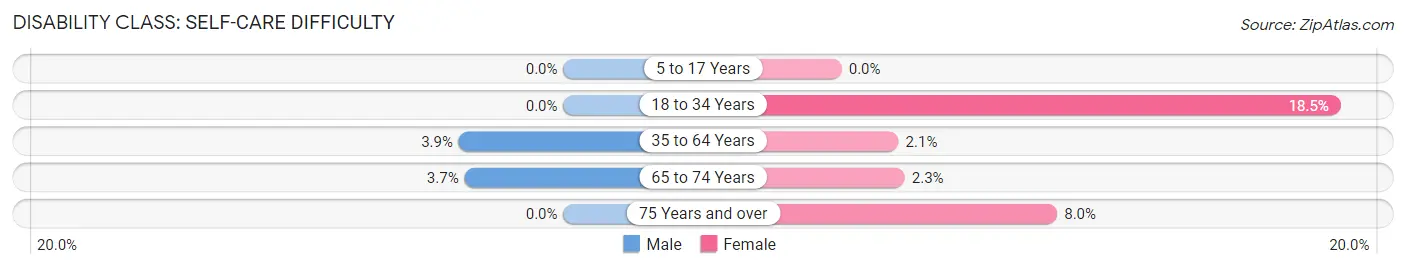
| Age Bracket | Male | Female |
| 5 to 17 Years | 0 (0.0%) | 0 (0.0%) |
| 18 to 34 Years | 0 (0.0%) | 45 (18.5%) |
| 35 to 64 Years | 34 (3.9%) | 21 (2.1%) |
| 65 to 74 Years | 9 (3.7%) | 12 (2.3%) |
| 75 Years and over | 0 (0.0%) | 28 (8.0%) |
Technology Access in Luray
Computing Device Access in Luray
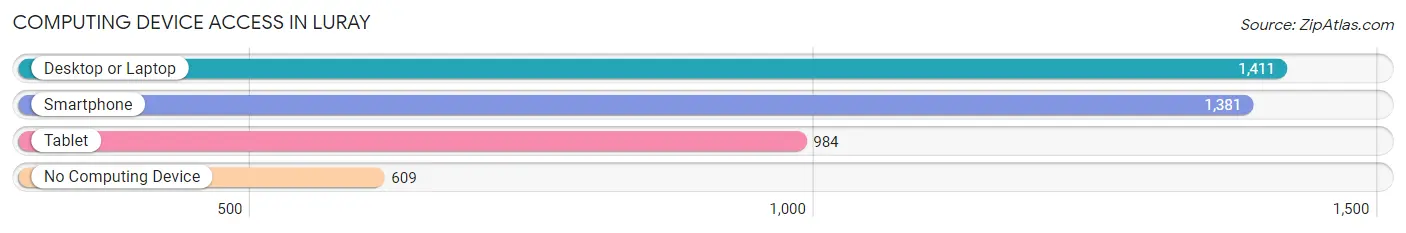
| Device Type | # Households | % Households |
| Desktop or Laptop | 1,411 | 60.5% |
| Smartphone | 1,381 | 59.2% |
| Tablet | 984 | 42.2% |
| No Computing Device | 609 | 26.1% |
| Total | 2,333 | 100.0% |
Internet Access in Luray
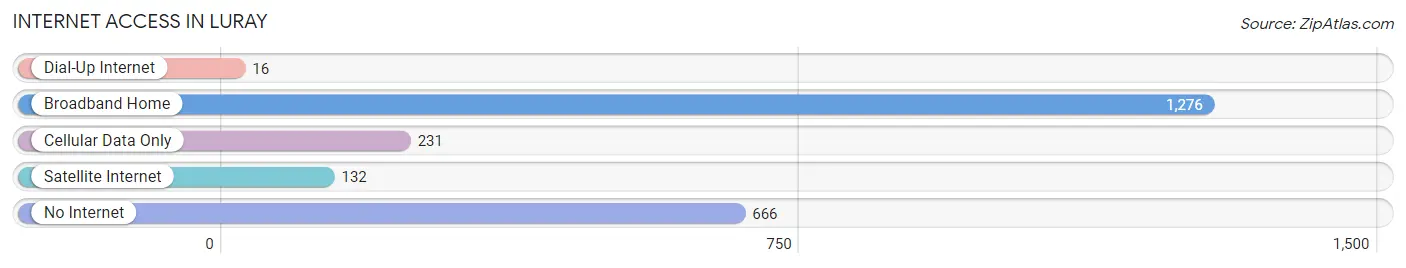
| Internet Type | # Households | % Households |
| Dial-Up Internet | 16 | 0.7% |
| Broadband Home | 1,276 | 54.7% |
| Cellular Data Only | 231 | 9.9% |
| Satellite Internet | 132 | 5.7% |
| No Internet | 666 | 28.5% |
| Total | 2,333 | 100.0% |
Luray Summary
Luray, Virginia is a small town located in the Shenandoah Valley of the Blue Ridge Mountains in Page County. It is the county seat and the largest town in the county. The town was founded in 1812 and incorporated in 1845. It is located about 75 miles west of Washington, D.C. and is a popular tourist destination due to its proximity to the Shenandoah National Park and the Luray Caverns.
History
The area that is now Luray was first settled by Europeans in the early 1700s. The town was originally known as Middletown, but was renamed Luray in 1812 after the Luray Valley in the Blue Ridge Mountains. The town was officially incorporated in 1845.
During the Civil War, Luray was a strategic location for both the Union and Confederate armies. The town was occupied by Union forces in 1862 and 1863, and Confederate forces in 1864. The Battle of Luray was fought in the town in 1864, resulting in a Confederate victory.
In the late 19th century, Luray became a popular tourist destination due to its proximity to the Shenandoah National Park and the Luray Caverns. The town was also home to several resorts and hotels, which attracted visitors from all over the country.
Geography
Luray is located in the Shenandoah Valley of the Blue Ridge Mountains in Page County. The town is situated at the confluence of the Shenandoah River and the Hawksbill Creek. The town is surrounded by the George Washington National Forest and the Shenandoah National Park.
The climate in Luray is temperate, with hot summers and cold winters. The average annual temperature is 54°F (12°C). The average annual precipitation is 40 inches (101 cm).
Economy
The economy of Luray is largely based on tourism. The town is a popular destination for visitors to the Shenandoah National Park and the Luray Caverns. The town is also home to several resorts and hotels, which attract visitors from all over the country.
In addition to tourism, Luray is home to several manufacturing companies, including a furniture factory, a printing company, and a plastics factory. The town is also home to several wineries and vineyards, which produce a variety of wines.
Demographics
As of the 2010 census, the population of Luray was 5,769. The racial makeup of the town was 94.3% White, 2.3% African American, 0.4% Native American, 0.7% Asian, 0.1% Pacific Islander, 0.7% from other races, and 1.5% from two or more races. Hispanic or Latino of any race were 2.2% of the population.
The median household income in Luray was $37,917, and the median family income was $45,938. The per capita income was $20,945. About 11.3% of families and 14.2% of the population were below the poverty line, including 19.2% of those under age 18 and 8.2% of those age 65 or over.
Common Questions
What is Per Capita Income in Luray?
Per Capita income in Luray is $31,547.
What is the Median Family Income in Luray?
Median Family Income in Luray is $70,893.
What is the Median Household income in Luray?
Median Household Income in Luray is $50,327.
What is Income or Wage Gap in Luray?
Income or Wage Gap in Luray is 31.8%.
Women in Luray earn 68.2 cents for every dollar earned by a man.
What is Inequality or Gini Index in Luray?
Inequality or Gini Index in Luray is 0.39.
What is the Total Population of Luray?
Total Population of Luray is 4,838.
What is the Total Male Population of Luray?
Total Male Population of Luray is 2,370.
What is the Total Female Population of Luray?
Total Female Population of Luray is 2,468.
What is the Ratio of Males per 100 Females in Luray?
There are 96.03 Males per 100 Females in Luray.
What is the Ratio of Females per 100 Males in Luray?
There are 104.14 Females per 100 Males in Luray.
What is the Median Population Age in Luray?
Median Population Age in Luray is 51.4 Years.
What is the Average Family Size in Luray
Average Family Size in Luray is 2.8 People.
What is the Average Household Size in Luray
Average Household Size in Luray is 2.0 People.
How Large is the Labor Force in Luray?
There are 2,401 People in the Labor Forcein in Luray.
What is the Percentage of People in the Labor Force in Luray?
56.5% of People are in the Labor Force in Luray.
What is the Unemployment Rate in Luray?
Unemployment Rate in Luray is 5.8%.