Louisa, VA Map & Demographics
Louisa Map
Louisa Overview
$34,315
PER CAPITA INCOME
$71,667
AVG FAMILY INCOME
$51,989
AVG HOUSEHOLD INCOME
6.2%
WAGE / INCOME GAP [ % ]
93.8¢/ $1
WAGE / INCOME GAP [ $ ]
$6,106
FAMILY INCOME DEFICIT
0.53
INEQUALITY / GINI INDEX
2,173
TOTAL POPULATION
937
MALE POPULATION
1,236
FEMALE POPULATION
75.81
MALES / 100 FEMALES
131.91
FEMALES / 100 MALES
41.0
MEDIAN AGE
3.2
AVG FAMILY SIZE
2.3
AVG HOUSEHOLD SIZE
930
LABOR FORCE [ PEOPLE ]
54.6%
PERCENT IN LABOR FORCE
4.8%
UNEMPLOYMENT RATE
Louisa Zip Codes
Louisa Area Codes
Income in Louisa
Income Overview in Louisa
Per Capita Income in Louisa is $34,315, while median incomes of families and households are $71,667 and $51,989 respectively.
| Characteristic | Number | Measure |
| Per Capita Income | 2,173 | $34,315 |
| Median Family Income | 460 | $71,667 |
| Mean Family Income | 460 | $103,673 |
| Median Household Income | 907 | $51,989 |
| Mean Household Income | 907 | $76,068 |
| Income Deficit | 460 | $6,106 |
| Wage / Income Gap (%) | 2,173 | 6.23% |
| Wage / Income Gap ($) | 2,173 | 93.77¢ per $1 |
| Gini / Inequality Index | 2,173 | 0.53 |
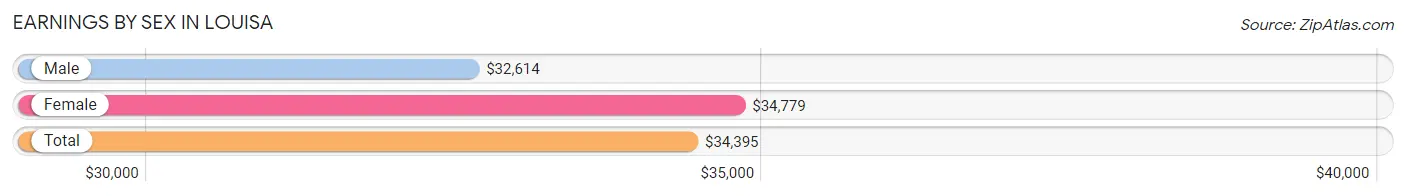
Earnings by Sex in Louisa
Average Earnings in Louisa are $34,395, $32,614 for men and $34,779 for women, a difference of 6.2%.
| Sex | Number | Average Earnings |
| Male | 471 (48.3%) | $32,614 |
| Female | 505 (51.7%) | $34,779 |
| Total | 976 (100.0%) | $34,395 |
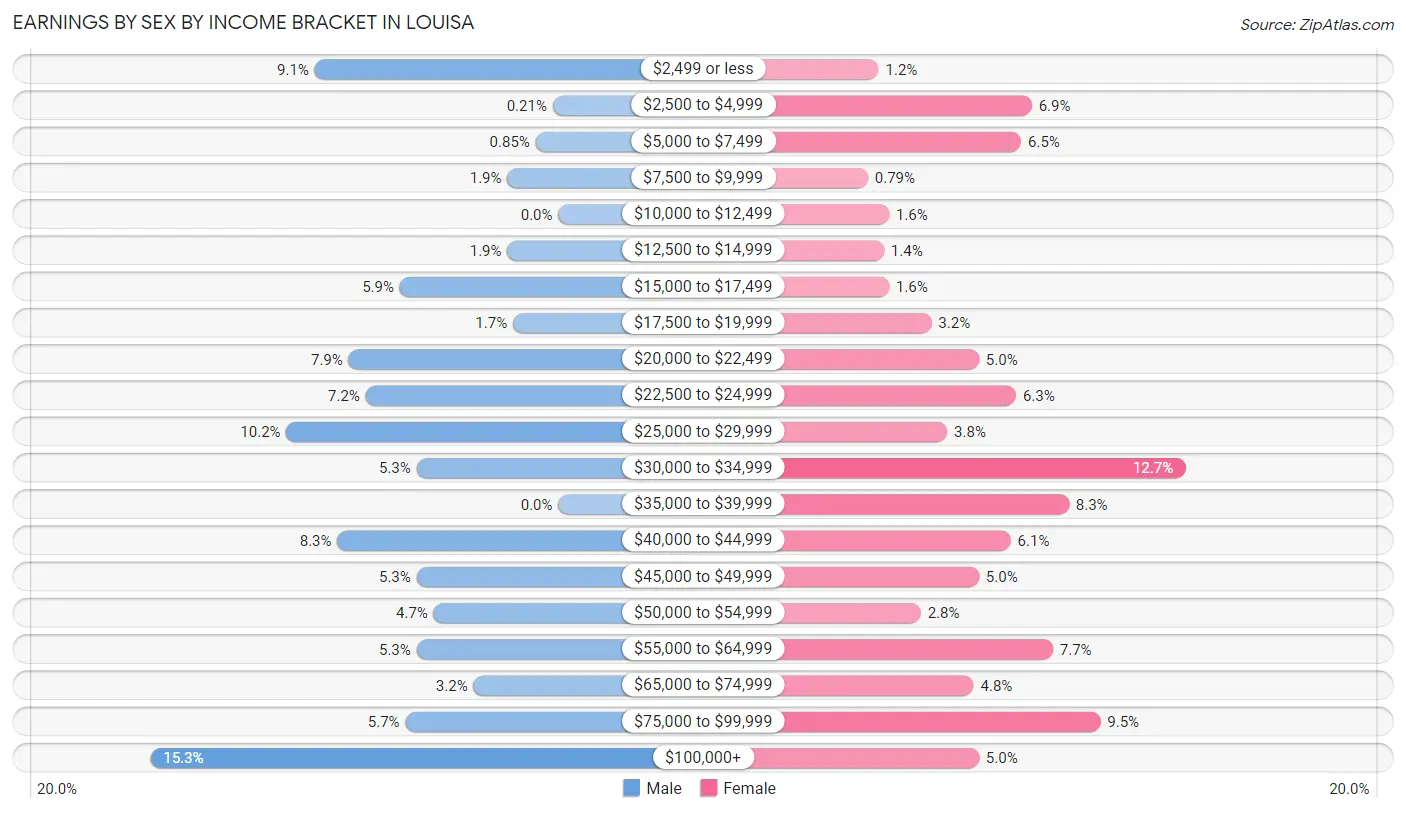
Earnings by Sex by Income Bracket in Louisa
The most common earnings brackets in Louisa are $100,000+ for men (72 | 15.3%) and $30,000 to $34,999 for women (64 | 12.7%).
| Income | Male | Female |
| $2,499 or less | 43 (9.1%) | 6 (1.2%) |
| $2,500 to $4,999 | 1 (0.2%) | 35 (6.9%) |
| $5,000 to $7,499 | 4 (0.9%) | 33 (6.5%) |
| $7,500 to $9,999 | 9 (1.9%) | 4 (0.8%) |
| $10,000 to $12,499 | 0 (0.0%) | 8 (1.6%) |
| $12,500 to $14,999 | 9 (1.9%) | 7 (1.4%) |
| $15,000 to $17,499 | 28 (5.9%) | 8 (1.6%) |
| $17,500 to $19,999 | 8 (1.7%) | 16 (3.2%) |
| $20,000 to $22,499 | 37 (7.9%) | 25 (5.0%) |
| $22,500 to $24,999 | 34 (7.2%) | 32 (6.3%) |
| $25,000 to $29,999 | 48 (10.2%) | 19 (3.8%) |
| $30,000 to $34,999 | 25 (5.3%) | 64 (12.7%) |
| $35,000 to $39,999 | 0 (0.0%) | 42 (8.3%) |
| $40,000 to $44,999 | 39 (8.3%) | 31 (6.1%) |
| $45,000 to $49,999 | 25 (5.3%) | 25 (5.0%) |
| $50,000 to $54,999 | 22 (4.7%) | 14 (2.8%) |
| $55,000 to $64,999 | 25 (5.3%) | 39 (7.7%) |
| $65,000 to $74,999 | 15 (3.2%) | 24 (4.8%) |
| $75,000 to $99,999 | 27 (5.7%) | 48 (9.5%) |
| $100,000+ | 72 (15.3%) | 25 (5.0%) |
| Total | 471 (100.0%) | 505 (100.0%) |
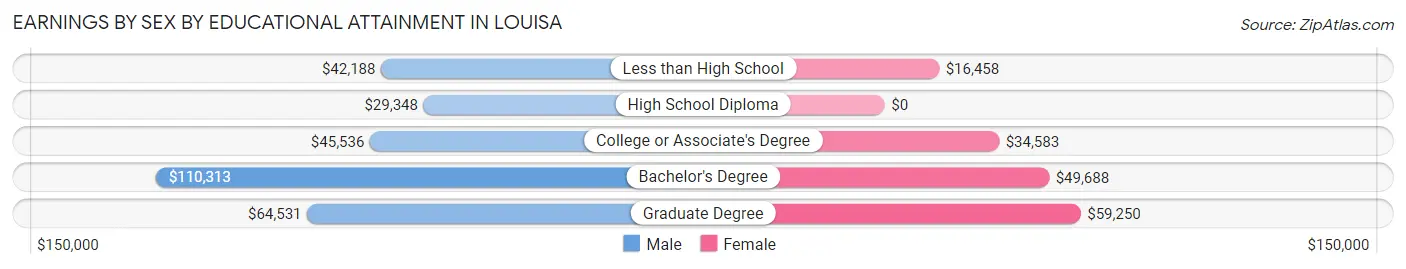
Earnings by Sex by Educational Attainment in Louisa
Average earnings in Louisa are $42,200 for men and $37,850 for women, a difference of 10.3%. Men with an educational attainment of bachelor's degree enjoy the highest average annual earnings of $110,313, while those with high school diploma education earn the least with $29,348. Women with an educational attainment of graduate degree earn the most with the average annual earnings of $59,250, while those with less than high school education have the smallest earnings of $16,458.
| Educational Attainment | Male Income | Female Income |
| Less than High School | $42,188 | $16,458 |
| High School Diploma | $29,348 | $0 |
| College or Associate's Degree | $45,536 | $34,583 |
| Bachelor's Degree | $110,313 | $49,688 |
| Graduate Degree | $64,531 | $59,250 |
| Total | $42,200 | $37,850 |
Family Income in Louisa
Family Income Brackets in Louisa
According to the Louisa family income data, there are 101 families falling into the $100,000 to $149,999 income range, which is the most common income bracket and makes up 22.0% of all families. Conversely, the $10,000 to $14,999 income bracket is the least frequent group with only 4 families (0.9%) belonging to this category.
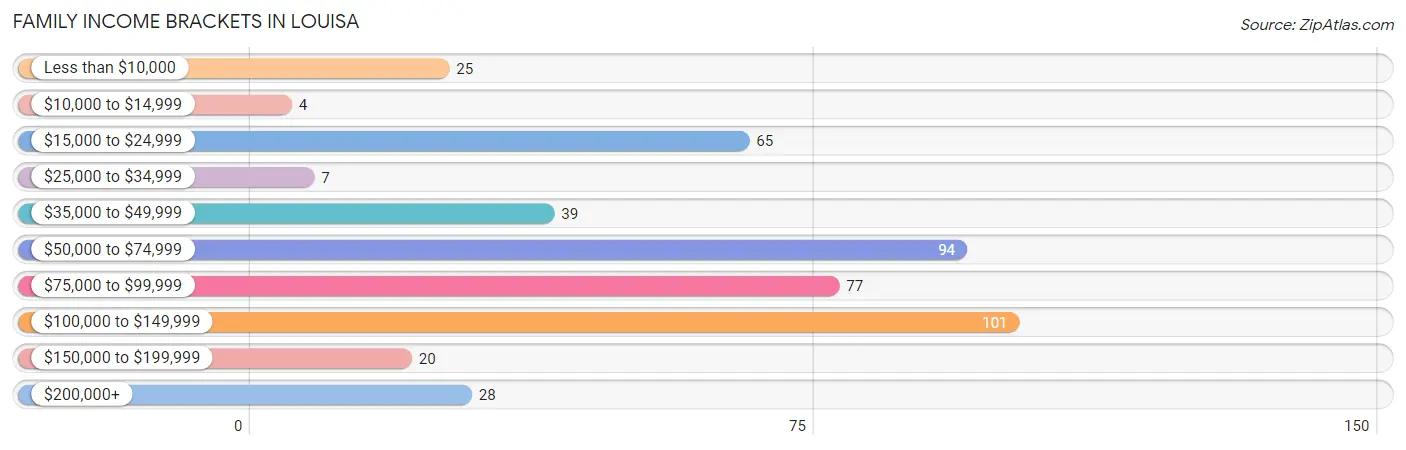
| Income Bracket | # Families | % Families |
| Less than $10,000 | 25 | 5.4% |
| $10,000 to $14,999 | 4 | 0.9% |
| $15,000 to $24,999 | 65 | 14.1% |
| $25,000 to $34,999 | 7 | 1.5% |
| $35,000 to $49,999 | 39 | 8.5% |
| $50,000 to $74,999 | 94 | 20.4% |
| $75,000 to $99,999 | 77 | 16.7% |
| $100,000 to $149,999 | 101 | 22.0% |
| $150,000 to $199,999 | 20 | 4.3% |
| $200,000+ | 28 | 6.1% |
Family Income by Famaliy Size in Louisa
5-person families (51 | 11.1%) account for the highest median family income in Louisa with $116,488 per family, while 5-person families (51 | 11.1%) have the highest median income of $23,298 per family member.
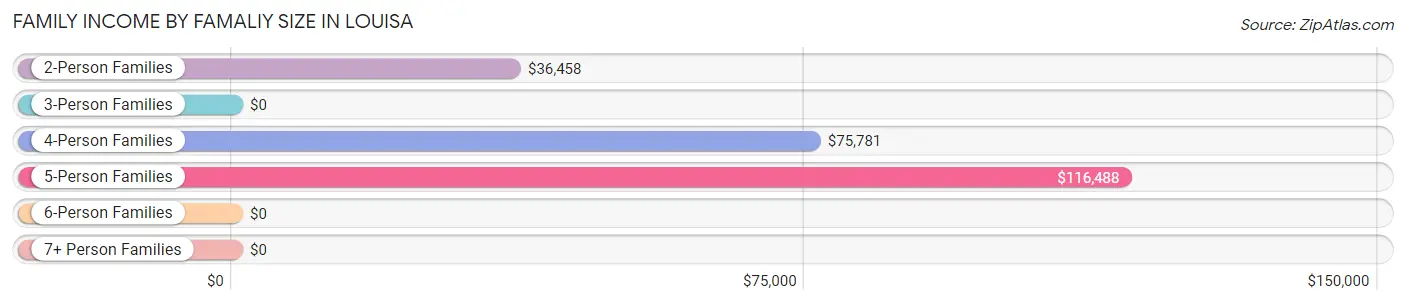
| Income Bracket | # Families | Median Income |
| 2-Person Families | 215 (46.7%) | $36,458 |
| 3-Person Families | 45 (9.8%) | $0 |
| 4-Person Families | 142 (30.9%) | $75,781 |
| 5-Person Families | 51 (11.1%) | $116,488 |
| 6-Person Families | 0 (0.0%) | $0 |
| 7+ Person Families | 7 (1.5%) | $0 |
| Total | 460 (100.0%) | $71,667 |
Family Income by Number of Earners in Louisa
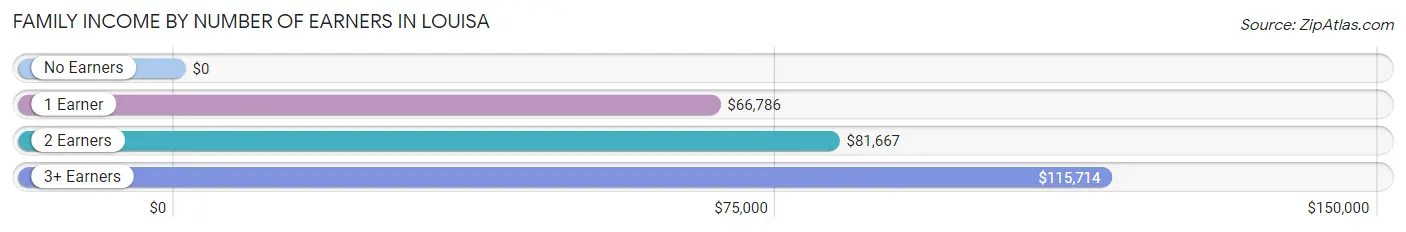
| Number of Earners | # Families | Median Income |
| No Earners | 56 (12.2%) | $0 |
| 1 Earner | 210 (45.7%) | $66,786 |
| 2 Earners | 138 (30.0%) | $81,667 |
| 3+ Earners | 56 (12.2%) | $115,714 |
| Total | 460 (100.0%) | $71,667 |
Household Income in Louisa
Household Income Brackets in Louisa
With 178 households falling in the category, the $50,000 to $74,999 income range is the most frequent in Louisa, accounting for 19.6% of all households. In contrast, only 28 households (3.1%) fall into the $200,000+ income bracket, making it the least populous group.
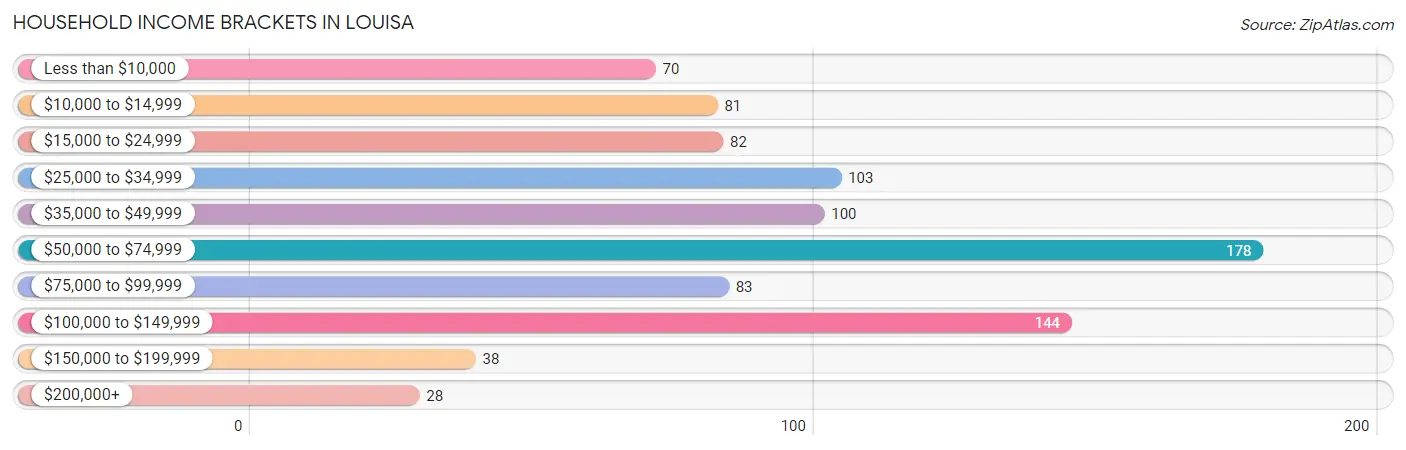
| Income Bracket | # Households | % Households |
| Less than $10,000 | 70 | 7.7% |
| $10,000 to $14,999 | 81 | 8.9% |
| $15,000 to $24,999 | 82 | 9.0% |
| $25,000 to $34,999 | 103 | 11.4% |
| $35,000 to $49,999 | 100 | 11.0% |
| $50,000 to $74,999 | 178 | 19.6% |
| $75,000 to $99,999 | 83 | 9.2% |
| $100,000 to $149,999 | 144 | 15.9% |
| $150,000 to $199,999 | 38 | 4.2% |
| $200,000+ | 28 | 3.1% |
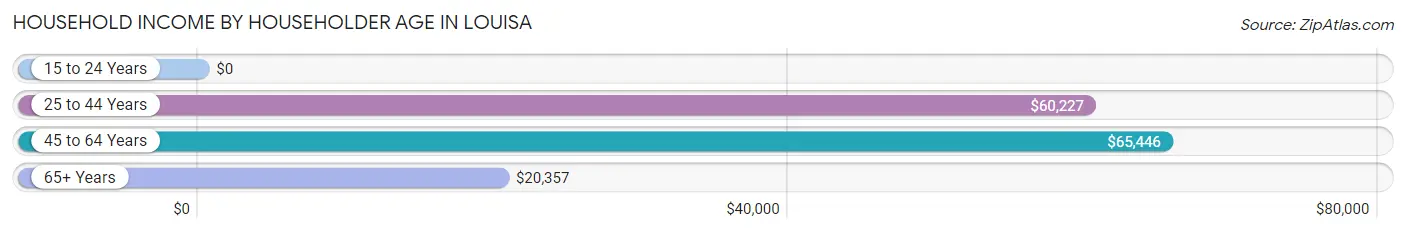
Household Income by Householder Age in Louisa
The median household income in Louisa is $51,989, with the highest median household income of $65,446 found in the 45 to 64 years age bracket for the primary householder. A total of 239 households (26.4%) fall into this category. Meanwhile, the 15 to 24 years age bracket for the primary householder has the lowest median household income of $0, with 20 households (2.2%) in this group.
| Income Bracket | # Households | Median Income |
| 15 to 24 Years | 20 (2.2%) | $0 |
| 25 to 44 Years | 332 (36.6%) | $60,227 |
| 45 to 64 Years | 239 (26.4%) | $65,446 |
| 65+ Years | 316 (34.8%) | $20,357 |
| Total | 907 (100.0%) | $51,989 |
Poverty in Louisa
Income Below Poverty by Sex and Age in Louisa
With 11.1% poverty level for males and 18.3% for females among the residents of Louisa, 75 year old and over males and 25 to 34 year old females are the most vulnerable to poverty, with 43 males (62.3%) and 68 females (41.7%) in their respective age groups living below the poverty level.
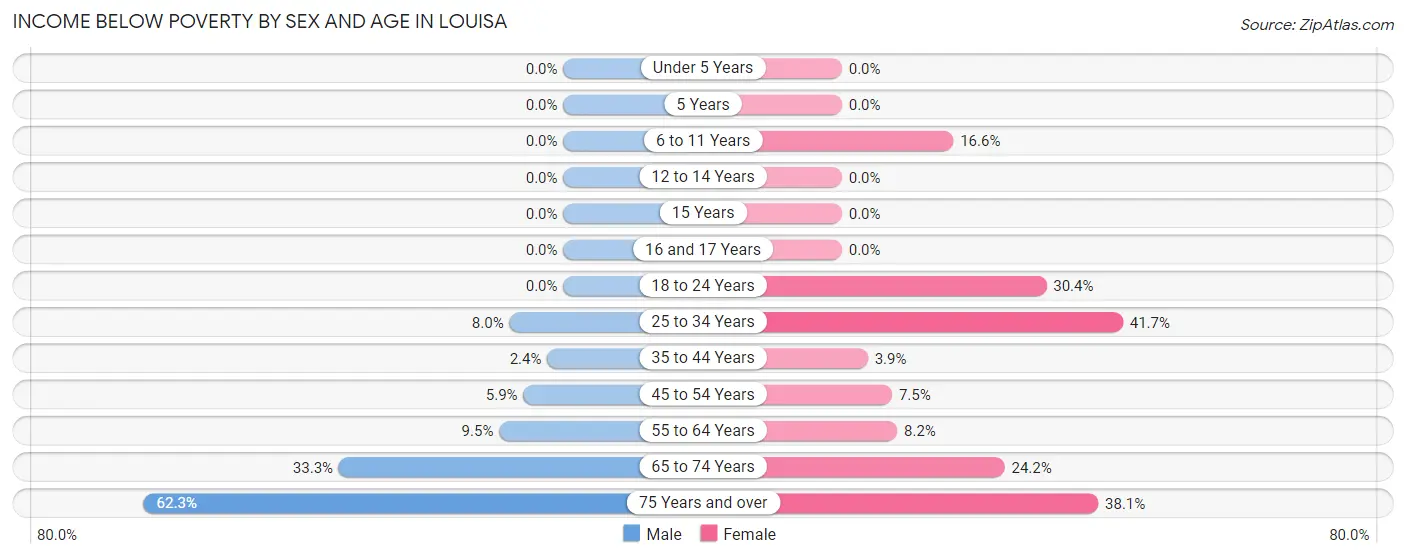
| Age Bracket | Male | Female |
| Under 5 Years | 0 (0.0%) | 0 (0.0%) |
| 5 Years | 0 (0.0%) | 0 (0.0%) |
| 6 to 11 Years | 0 (0.0%) | 23 (16.6%) |
| 12 to 14 Years | 0 (0.0%) | 0 (0.0%) |
| 15 Years | 0 (0.0%) | 0 (0.0%) |
| 16 and 17 Years | 0 (0.0%) | 0 (0.0%) |
| 18 to 24 Years | 0 (0.0%) | 17 (30.4%) |
| 25 to 34 Years | 8 (8.0%) | 68 (41.7%) |
| 35 to 44 Years | 4 (2.4%) | 7 (3.8%) |
| 45 to 54 Years | 7 (5.9%) | 7 (7.4%) |
| 55 to 64 Years | 6 (9.5%) | 11 (8.2%) |
| 65 to 74 Years | 33 (33.3%) | 29 (24.2%) |
| 75 Years and over | 43 (62.3%) | 51 (38.1%) |
| Total | 101 (11.1%) | 213 (18.3%) |
Income Above Poverty by Sex and Age in Louisa
According to the poverty statistics in Louisa, males aged under 5 years and females aged under 5 years are the age groups that are most secure financially, with 100.0% of males and 100.0% of females in these age groups living above the poverty line.
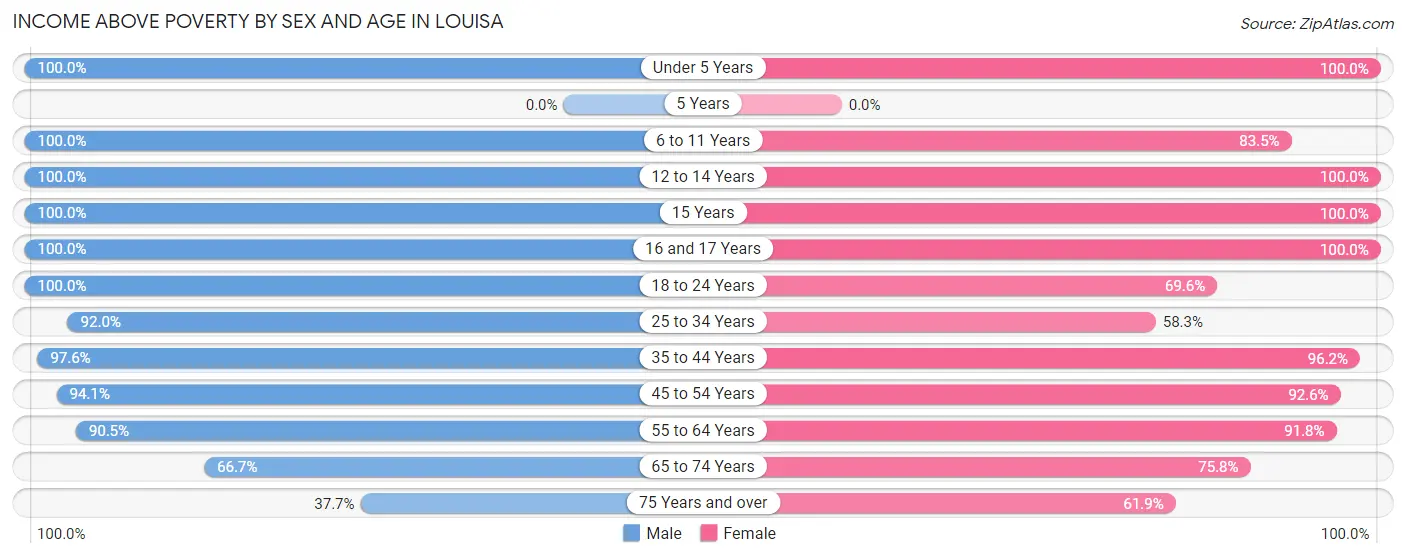
| Age Bracket | Male | Female |
| Under 5 Years | 27 (100.0%) | 85 (100.0%) |
| 5 Years | 0 (0.0%) | 0 (0.0%) |
| 6 to 11 Years | 56 (100.0%) | 116 (83.5%) |
| 12 to 14 Years | 57 (100.0%) | 48 (100.0%) |
| 15 Years | 49 (100.0%) | 9 (100.0%) |
| 16 and 17 Years | 49 (100.0%) | 2 (100.0%) |
| 18 to 24 Years | 53 (100.0%) | 39 (69.6%) |
| 25 to 34 Years | 92 (92.0%) | 95 (58.3%) |
| 35 to 44 Years | 164 (97.6%) | 175 (96.2%) |
| 45 to 54 Years | 111 (94.1%) | 87 (92.5%) |
| 55 to 64 Years | 57 (90.5%) | 123 (91.8%) |
| 65 to 74 Years | 66 (66.7%) | 91 (75.8%) |
| 75 Years and over | 26 (37.7%) | 83 (61.9%) |
| Total | 807 (88.9%) | 953 (81.7%) |
Income Below Poverty Among Married-Couple Families in Louisa
The poverty statistics for married-couple families in Louisa show that 12.1% or 37 of the total 306 families live below the poverty line. Families with no children have the highest poverty rate of 23.3%, comprising of 37 families. On the other hand, families with 1 or 2 children have the lowest poverty rate of 0.0%, which includes 0 families.
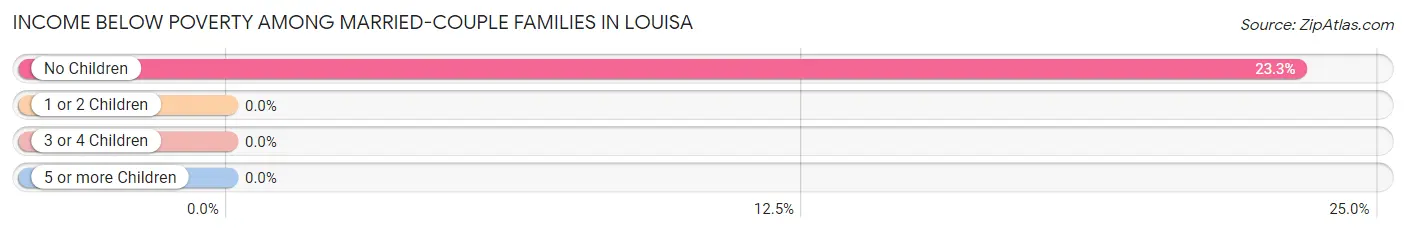
| Children | Above Poverty | Below Poverty |
| No Children | 122 (76.7%) | 37 (23.3%) |
| 1 or 2 Children | 125 (100.0%) | 0 (0.0%) |
| 3 or 4 Children | 15 (100.0%) | 0 (0.0%) |
| 5 or more Children | 7 (100.0%) | 0 (0.0%) |
| Total | 269 (87.9%) | 37 (12.1%) |
Income Below Poverty Among Single-Parent Households in Louisa
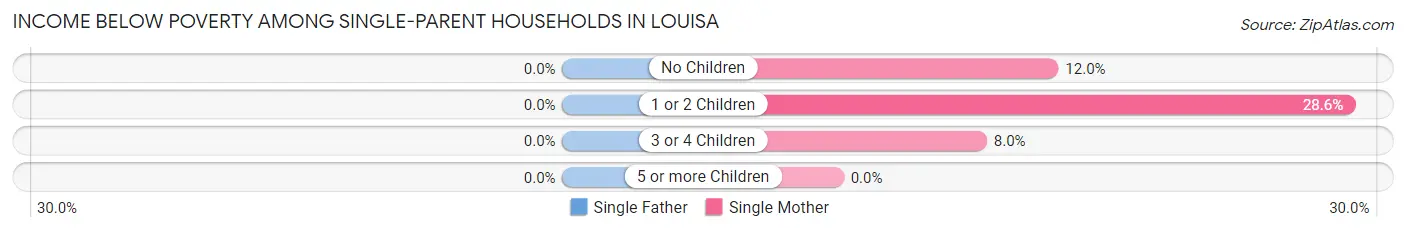
| Children | Single Father | Single Mother |
| No Children | 0 (0.0%) | 3 (12.0%) |
| 1 or 2 Children | 0 (0.0%) | 22 (28.6%) |
| 3 or 4 Children | 0 (0.0%) | 4 (8.0%) |
| 5 or more Children | 0 (0.0%) | 0 (0.0%) |
| Total | 0 (0.0%) | 29 (19.1%) |
Income Below Poverty Among Married-Couple vs Single-Parent Households in Louisa
The poverty data for Louisa shows that 37 of the married-couple family households (12.1%) and 29 of the single-parent households (18.8%) are living below the poverty level. Within the married-couple family households, those with no children have the highest poverty rate, with 37 households (23.3%) falling below the poverty line. Among the single-parent households, those with 1 or 2 children have the highest poverty rate, with 22 household (28.6%) living below poverty.
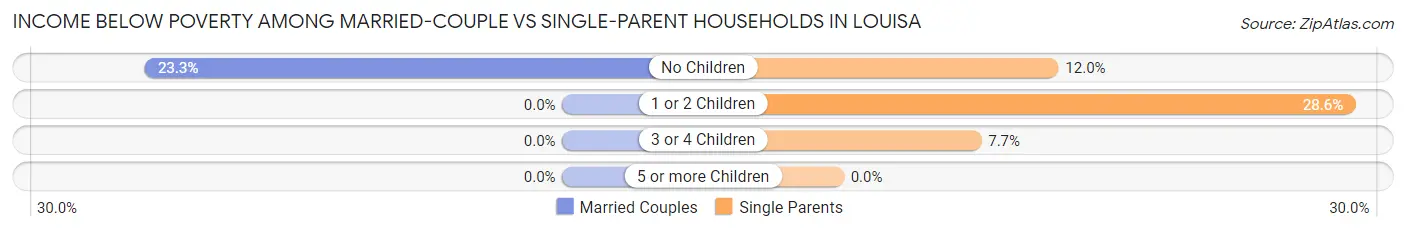
| Children | Married-Couple Families | Single-Parent Households |
| No Children | 37 (23.3%) | 3 (12.0%) |
| 1 or 2 Children | 0 (0.0%) | 22 (28.6%) |
| 3 or 4 Children | 0 (0.0%) | 4 (7.7%) |
| 5 or more Children | 0 (0.0%) | 0 (0.0%) |
| Total | 37 (12.1%) | 29 (18.8%) |
Race in Louisa
The most populous races in Louisa are White / Caucasian (1,440 | 66.3%), Black / African American (540 | 24.8%), and Two or more Races (172 | 7.9%).
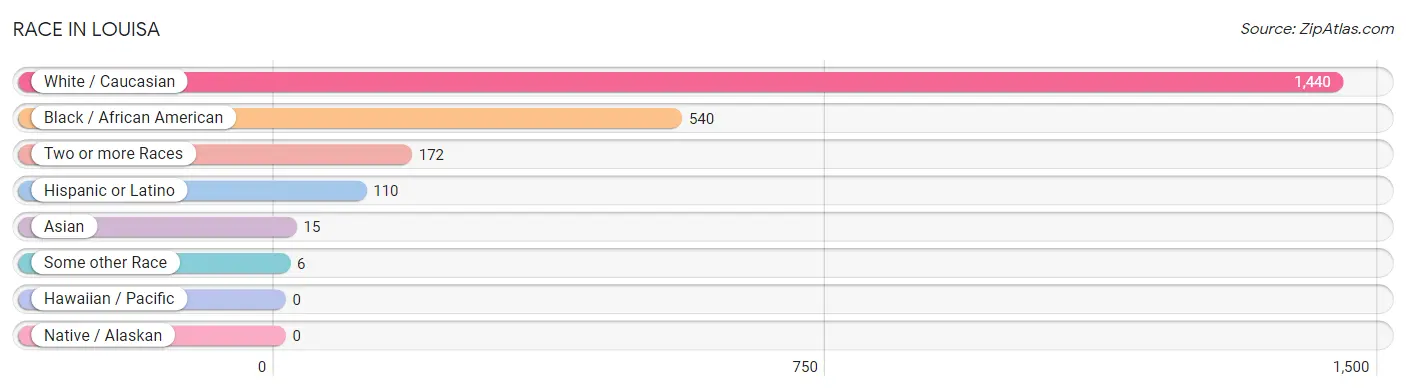
| Race | # Population | % Population |
| Asian | 15 | 0.7% |
| Black / African American | 540 | 24.8% |
| Hawaiian / Pacific | 0 | 0.0% |
| Hispanic or Latino | 110 | 5.1% |
| Native / Alaskan | 0 | 0.0% |
| White / Caucasian | 1,440 | 66.3% |
| Two or more Races | 172 | 7.9% |
| Some other Race | 6 | 0.3% |
| Total | 2,173 | 100.0% |
Ancestry in Louisa
The most populous ancestries reported in Louisa are English (360 | 16.6%), Irish (225 | 10.3%), German (182 | 8.4%), American (103 | 4.7%), and Mexican (93 | 4.3%), together accounting for 44.3% of all Louisa residents.
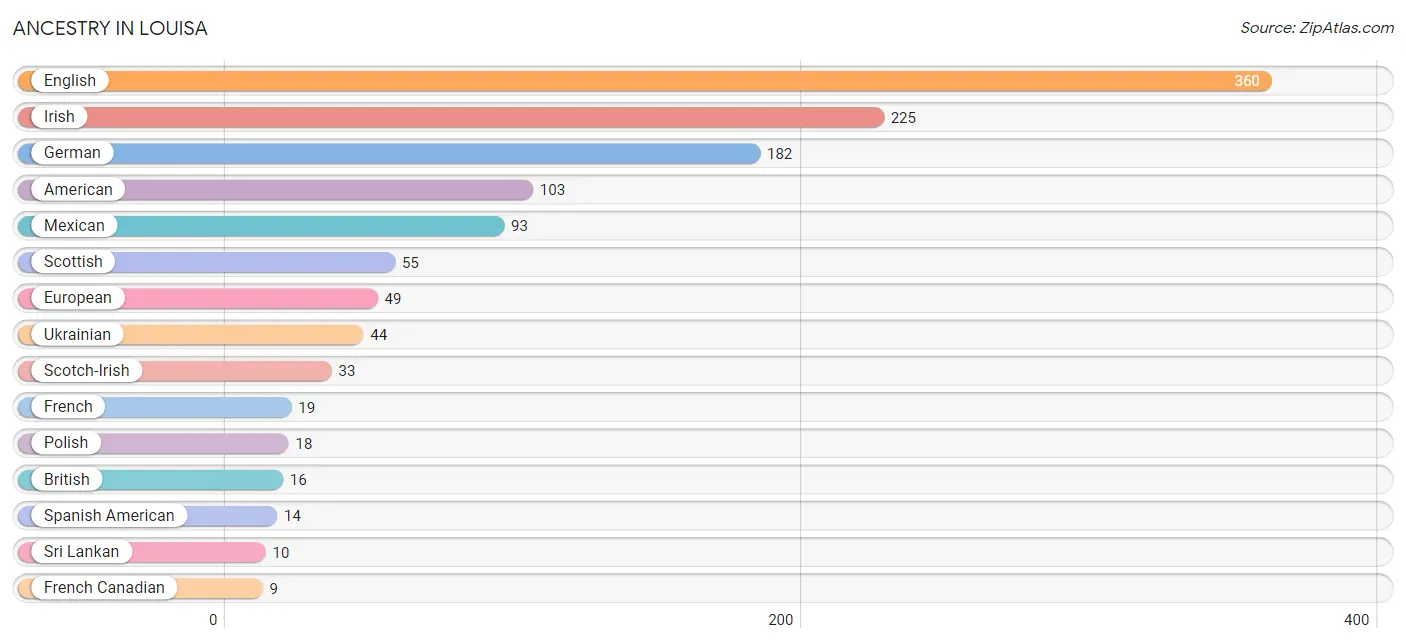
| Ancestry | # Population | % Population |
| American | 103 | 4.7% |
| Austrian | 3 | 0.1% |
| British | 16 | 0.7% |
| Dutch | 8 | 0.4% |
| Ecuadorian | 3 | 0.1% |
| English | 360 | 16.6% |
| European | 49 | 2.2% |
| French | 19 | 0.9% |
| French Canadian | 9 | 0.4% |
| German | 182 | 8.4% |
| Indian (Asian) | 5 | 0.2% |
| Irish | 225 | 10.3% |
| Italian | 8 | 0.4% |
| Mexican | 93 | 4.3% |
| Polish | 18 | 0.8% |
| Scotch-Irish | 33 | 1.5% |
| Scottish | 55 | 2.5% |
| South American | 3 | 0.1% |
| Spanish American | 14 | 0.6% |
| Sri Lankan | 10 | 0.5% |
| Ukrainian | 44 | 2.0% |
| Welsh | 3 | 0.1% | View All 22 Rows |
Immigrants in Louisa
The most numerous immigrant groups reported in Louisa came from Central America (71 | 3.3%), Latin America (71 | 3.3%), Mexico (71 | 3.3%), Asia (15 | 0.7%), and South Eastern Asia (10 | 0.5%), together accounting for 11.0% of all Louisa residents.
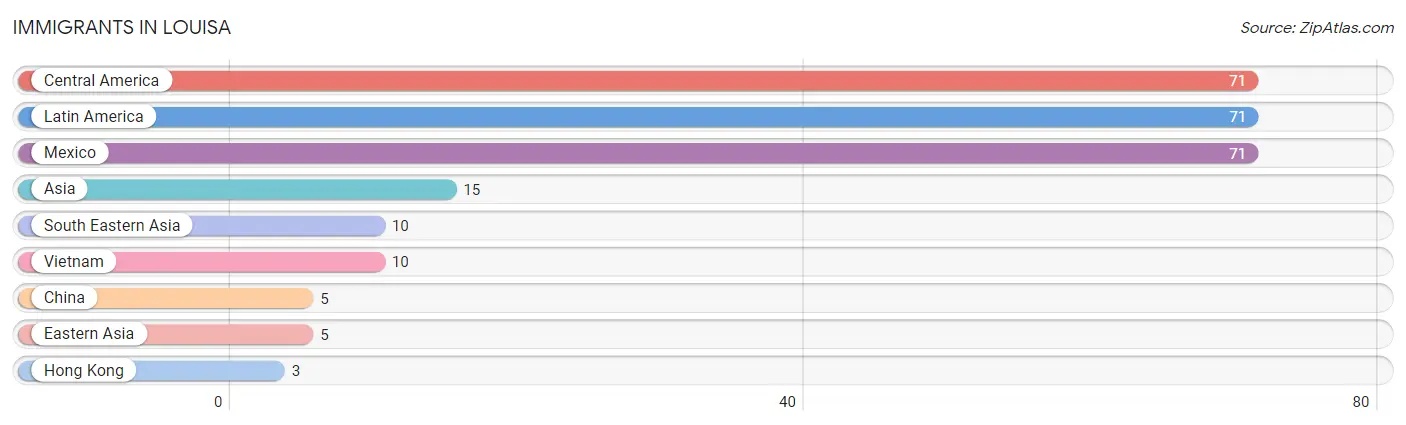
| Immigration Origin | # Population | % Population |
| Asia | 15 | 0.7% |
| Central America | 71 | 3.3% |
| China | 5 | 0.2% |
| Eastern Asia | 5 | 0.2% |
| Hong Kong | 3 | 0.1% |
| Latin America | 71 | 3.3% |
| Mexico | 71 | 3.3% |
| South Eastern Asia | 10 | 0.5% |
| Vietnam | 10 | 0.5% | View All 9 Rows |
Sex and Age in Louisa
Sex and Age in Louisa
The most populous age groups in Louisa are 15 to 19 Years (122 | 13.0%) for men and 35 to 39 Years (121 | 9.8%) for women.
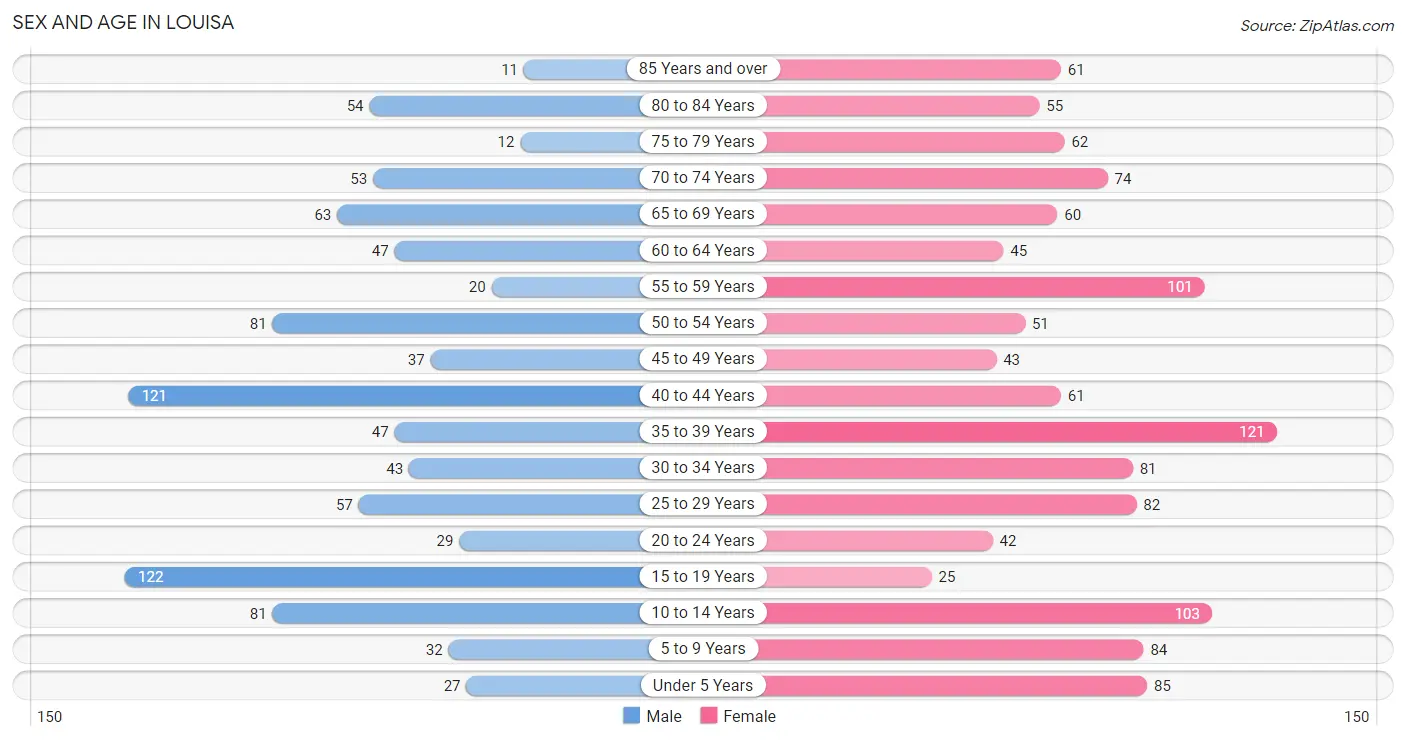
| Age Bracket | Male | Female |
| Under 5 Years | 27 (2.9%) | 85 (6.9%) |
| 5 to 9 Years | 32 (3.4%) | 84 (6.8%) |
| 10 to 14 Years | 81 (8.6%) | 103 (8.3%) |
| 15 to 19 Years | 122 (13.0%) | 25 (2.0%) |
| 20 to 24 Years | 29 (3.1%) | 42 (3.4%) |
| 25 to 29 Years | 57 (6.1%) | 82 (6.6%) |
| 30 to 34 Years | 43 (4.6%) | 81 (6.6%) |
| 35 to 39 Years | 47 (5.0%) | 121 (9.8%) |
| 40 to 44 Years | 121 (12.9%) | 61 (4.9%) |
| 45 to 49 Years | 37 (4.0%) | 43 (3.5%) |
| 50 to 54 Years | 81 (8.6%) | 51 (4.1%) |
| 55 to 59 Years | 20 (2.1%) | 101 (8.2%) |
| 60 to 64 Years | 47 (5.0%) | 45 (3.6%) |
| 65 to 69 Years | 63 (6.7%) | 60 (4.9%) |
| 70 to 74 Years | 53 (5.7%) | 74 (6.0%) |
| 75 to 79 Years | 12 (1.3%) | 62 (5.0%) |
| 80 to 84 Years | 54 (5.8%) | 55 (4.4%) |
| 85 Years and over | 11 (1.2%) | 61 (4.9%) |
| Total | 937 (100.0%) | 1,236 (100.0%) |
Families and Households in Louisa
Median Family Size in Louisa
The median family size in Louisa is 3.19 persons per family, with single male/father families (2 | 0.4%) accounting for the largest median family size of 9.5 persons per family. On the other hand, single female/mother families (152 | 33.0%) represent the smallest median family size with 2.69 persons per family.
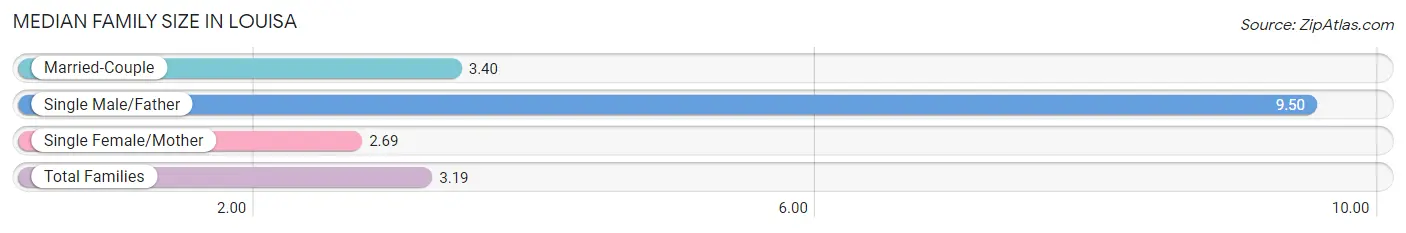
| Family Type | # Families | Family Size |
| Married-Couple | 306 (66.5%) | 3.40 |
| Single Male/Father | 2 (0.4%) | 9.50 |
| Single Female/Mother | 152 (33.0%) | 2.69 |
| Total Families | 460 (100.0%) | 3.19 |
Median Household Size in Louisa
The median household size in Louisa is 2.27 persons per household, with single male/father households (2 | 0.2%) accounting for the largest median household size of 9.5 persons per household. non-family households (447 | 49.3%) represent the smallest median household size with 1.15 persons per household.
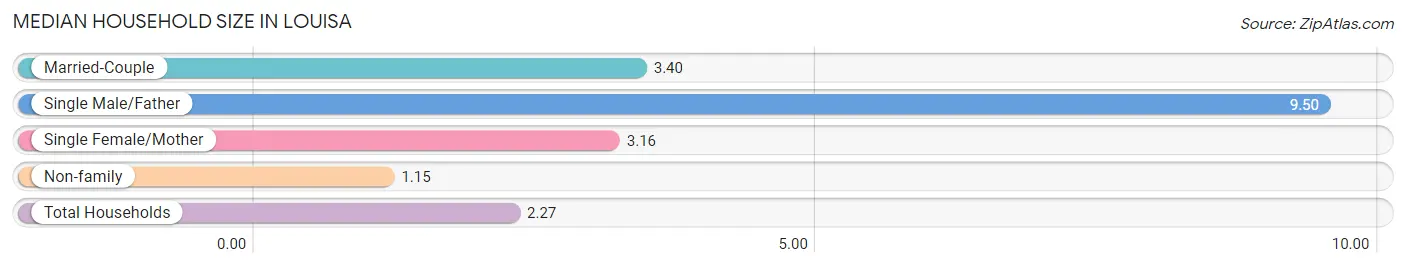
| Household Type | # Households | Household Size |
| Married-Couple | 306 (33.7%) | 3.40 |
| Single Male/Father | 2 (0.2%) | 9.50 |
| Single Female/Mother | 152 (16.8%) | 3.16 |
| Non-family | 447 (49.3%) | 1.15 |
| Total Households | 907 (100.0%) | 2.27 |
Household Size by Marriage Status in Louisa
Out of a total of 907 households in Louisa, 460 (50.7%) are family households, while 447 (49.3%) are nonfamily households. The most numerous type of family households are 2-person households, comprising 178, and the most common type of nonfamily households are 1-person households, comprising 373.
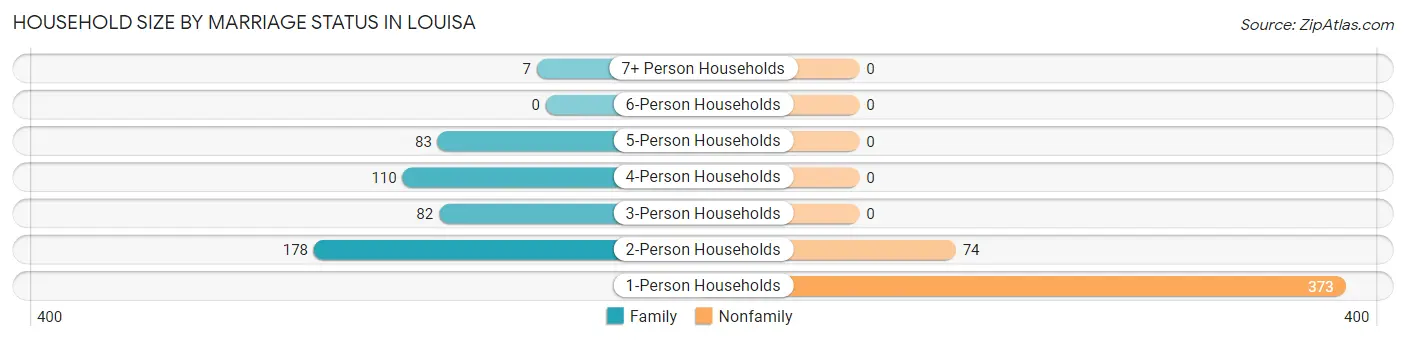
| Household Size | Family Households | Nonfamily Households |
| 1-Person Households | - | 373 (41.1%) |
| 2-Person Households | 178 (19.6%) | 74 (8.2%) |
| 3-Person Households | 82 (9.0%) | 0 (0.0%) |
| 4-Person Households | 110 (12.1%) | 0 (0.0%) |
| 5-Person Households | 83 (9.1%) | 0 (0.0%) |
| 6-Person Households | 0 (0.0%) | 0 (0.0%) |
| 7+ Person Households | 7 (0.8%) | 0 (0.0%) |
| Total | 460 (50.7%) | 447 (49.3%) |
Female Fertility in Louisa
Fertility by Age in Louisa
Average fertility rate in Louisa is 18.0 births per 1,000 women. Women in the age bracket of 15 to 19 years have the highest fertility rate with 120.0 births per 1,000 women. Women in the age bracket of 35 to 50 years acount for 66.7% of all women with births.
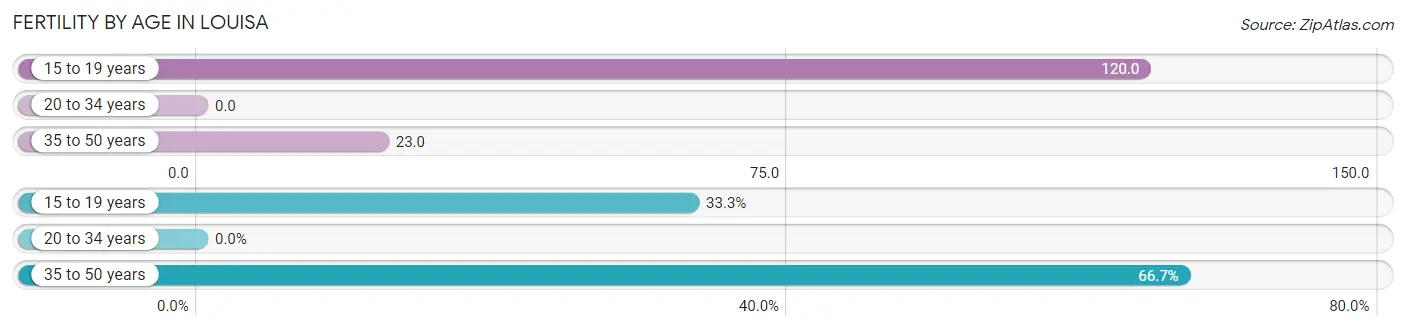
| Age Bracket | Women with Births | Births / 1,000 Women |
| 15 to 19 years | 3 (33.3%) | 120.0 |
| 20 to 34 years | 0 (0.0%) | 0.0 |
| 35 to 50 years | 6 (66.7%) | 23.0 |
| Total | 9 (100.0%) | 18.0 |
Fertility by Age by Marriage Status in Louisa
66.7% of women with births (9) in Louisa are married. The highest percentage of unmarried women with births falls into 15 to 19 years age bracket with 100.0% of them unmarried at the time of birth, while the lowest percentage of unmarried women with births belong to 35 to 50 years age bracket with 0.0% of them unmarried.
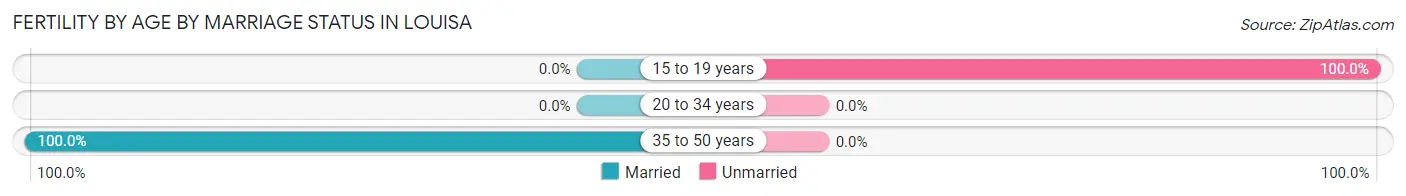
| Age Bracket | Married | Unmarried |
| 15 to 19 years | 0 (0.0%) | 3 (100.0%) |
| 20 to 34 years | 0 (0.0%) | 0 (0.0%) |
| 35 to 50 years | 6 (100.0%) | 0 (0.0%) |
| Total | 6 (66.7%) | 3 (33.3%) |
Fertility by Education in Louisa
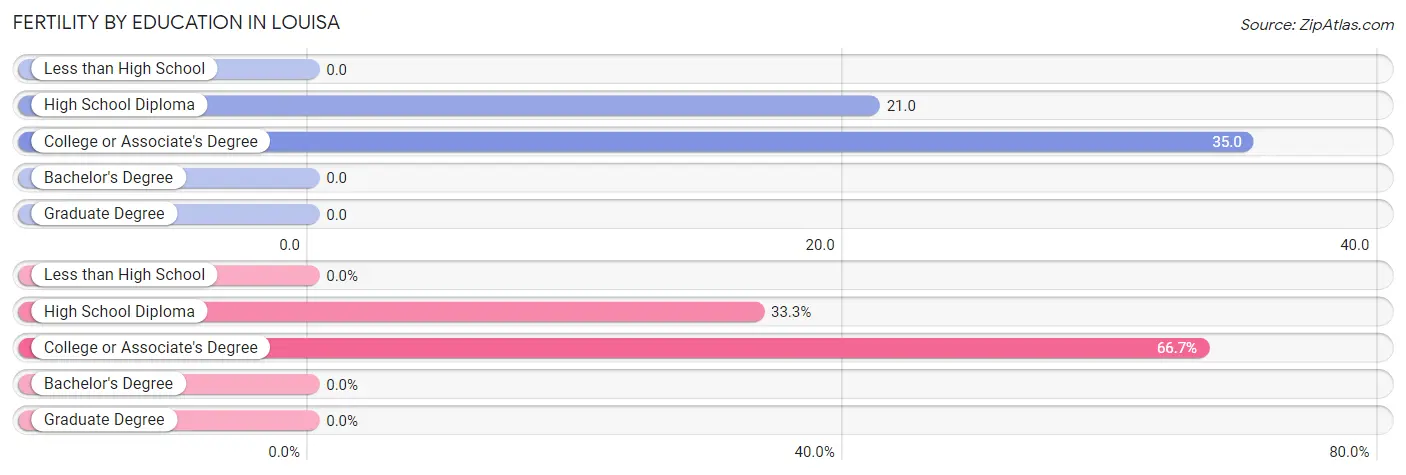
| Educational Attainment | Women with Births | Births / 1,000 Women |
| Less than High School | 0 (0.0%) | 0.0 |
| High School Diploma | 3 (33.3%) | 21.0 |
| College or Associate's Degree | 6 (66.7%) | 35.0 |
| Bachelor's Degree | 0 (0.0%) | 0.0 |
| Graduate Degree | 0 (0.0%) | 0.0 |
| Total | 9 (100.0%) | 18.0 |
Fertility by Education by Marriage Status in Louisa
33.3% of women with births in Louisa are unmarried. Women with the educational attainment of college or associate's degree are most likely to be married with 100.0% of them married at childbirth, while women with the educational attainment of high school diploma are least likely to be married with 100.0% of them unmarried at childbirth.
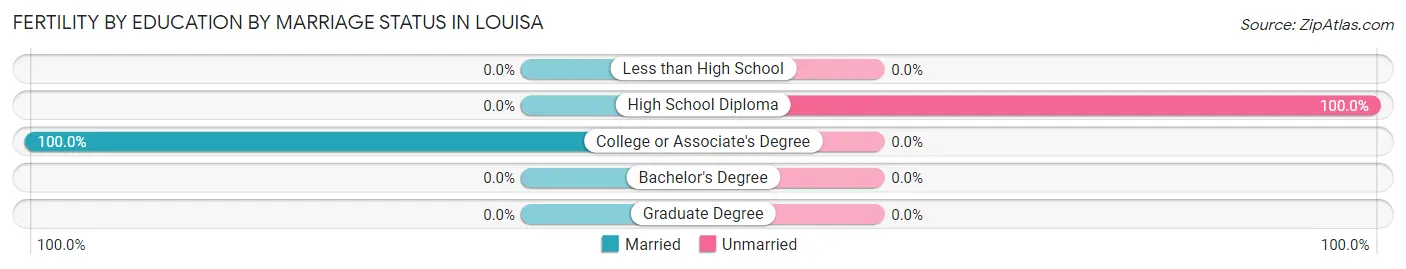
| Educational Attainment | Married | Unmarried |
| Less than High School | 0 (0.0%) | 0 (0.0%) |
| High School Diploma | 0 (0.0%) | 3 (100.0%) |
| College or Associate's Degree | 6 (100.0%) | 0 (0.0%) |
| Bachelor's Degree | 0 (0.0%) | 0 (0.0%) |
| Graduate Degree | 0 (0.0%) | 0 (0.0%) |
| Total | 6 (66.7%) | 3 (33.3%) |
Employment Characteristics in Louisa
Employment by Class of Employer in Louisa
Among the 884 employed individuals in Louisa, private company employees (550 | 62.2%), self-employed (incorporated) (97 | 11.0%), and local government employees (63 | 7.1%) make up the most common classes of employment.
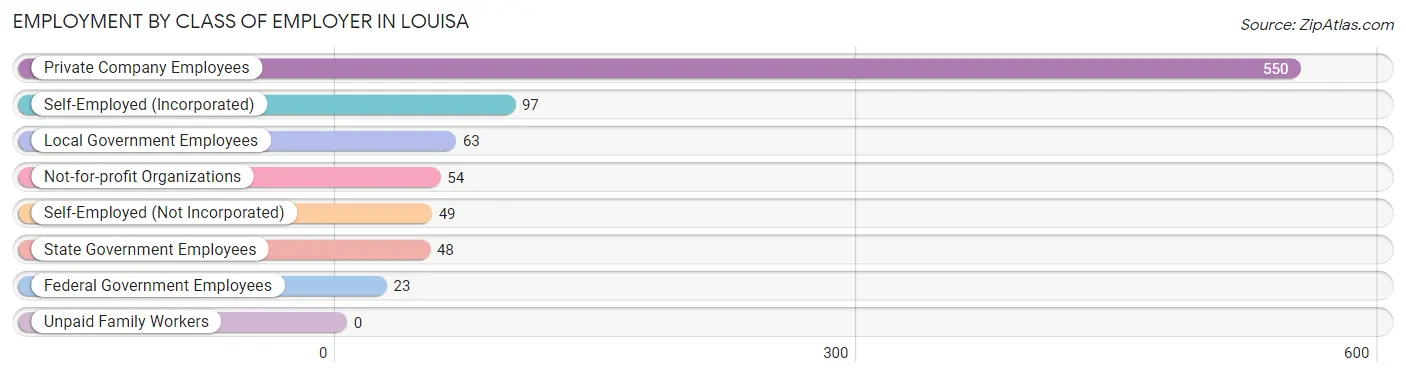
| Employer Class | # Employees | % Employees |
| Private Company Employees | 550 | 62.2% |
| Self-Employed (Incorporated) | 97 | 11.0% |
| Self-Employed (Not Incorporated) | 49 | 5.5% |
| Not-for-profit Organizations | 54 | 6.1% |
| Local Government Employees | 63 | 7.1% |
| State Government Employees | 48 | 5.4% |
| Federal Government Employees | 23 | 2.6% |
| Unpaid Family Workers | 0 | 0.0% |
| Total | 884 | 100.0% |
Employment Status by Age in Louisa
According to the labor force statistics for Louisa, out of the total population over 16 years of age (1,703), 54.6% or 930 individuals are in the labor force, with 4.8% or 45 of them unemployed. The age group with the highest labor force participation rate is 30 to 34 years, with 100.0% or 124 individuals in the labor force. Within the labor force, the 25 to 29 years age range has the highest percentage of unemployed individuals, with 19.5% or 16 of them being unemployed.
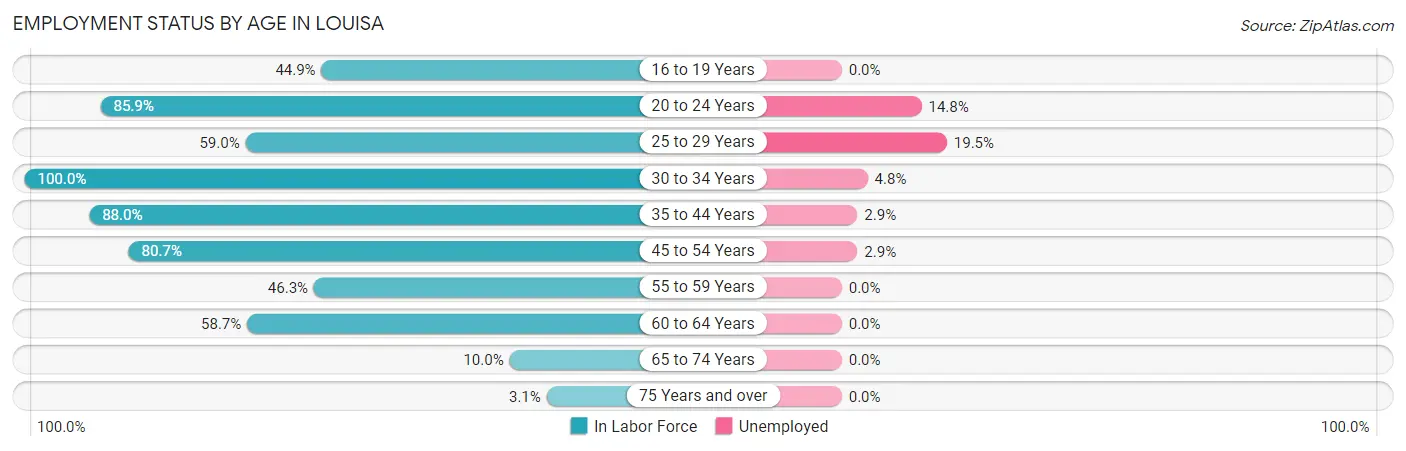
| Age Bracket | In Labor Force | Unemployed |
| 16 to 19 Years | 40 (44.9%) | 0 (0.0%) |
| 20 to 24 Years | 61 (85.9%) | 9 (14.8%) |
| 25 to 29 Years | 82 (59.0%) | 16 (19.5%) |
| 30 to 34 Years | 124 (100.0%) | 6 (4.8%) |
| 35 to 44 Years | 308 (88.0%) | 9 (2.9%) |
| 45 to 54 Years | 171 (80.7%) | 5 (2.9%) |
| 55 to 59 Years | 56 (46.3%) | 0 (0.0%) |
| 60 to 64 Years | 54 (58.7%) | 0 (0.0%) |
| 65 to 74 Years | 25 (10.0%) | 0 (0.0%) |
| 75 Years and over | 8 (3.1%) | 0 (0.0%) |
| Total | 930 (54.6%) | 45 (4.8%) |
Employment Status by Educational Attainment in Louisa
According to labor force statistics for Louisa, 76.6% of individuals (795) out of the total population between 25 and 64 years of age (1,038) are in the labor force, with 4.5% or 36 of them being unemployed. The group with the highest labor force participation rate are those with the educational attainment of college / associate degree, with 81.9% or 289 individuals in the labor force. Within the labor force, individuals with less than high school education have the highest percentage of unemployment, with 29.2% or 14 of them being unemployed.
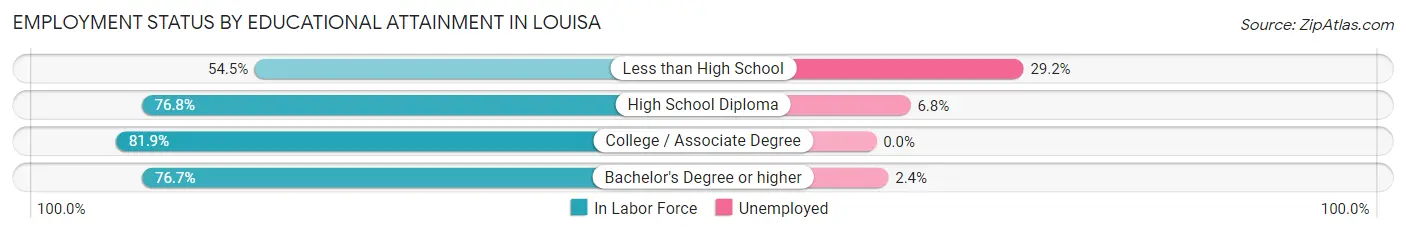
| Educational Attainment | In Labor Force | Unemployed |
| Less than High School | 48 (54.5%) | 26 (29.2%) |
| High School Diploma | 251 (76.8%) | 22 (6.8%) |
| College / Associate Degree | 289 (81.9%) | 0 (0.0%) |
| Bachelor's Degree or higher | 207 (76.7%) | 6 (2.4%) |
| Total | 795 (76.6%) | 47 (4.5%) |
Employment Occupations by Sex in Louisa
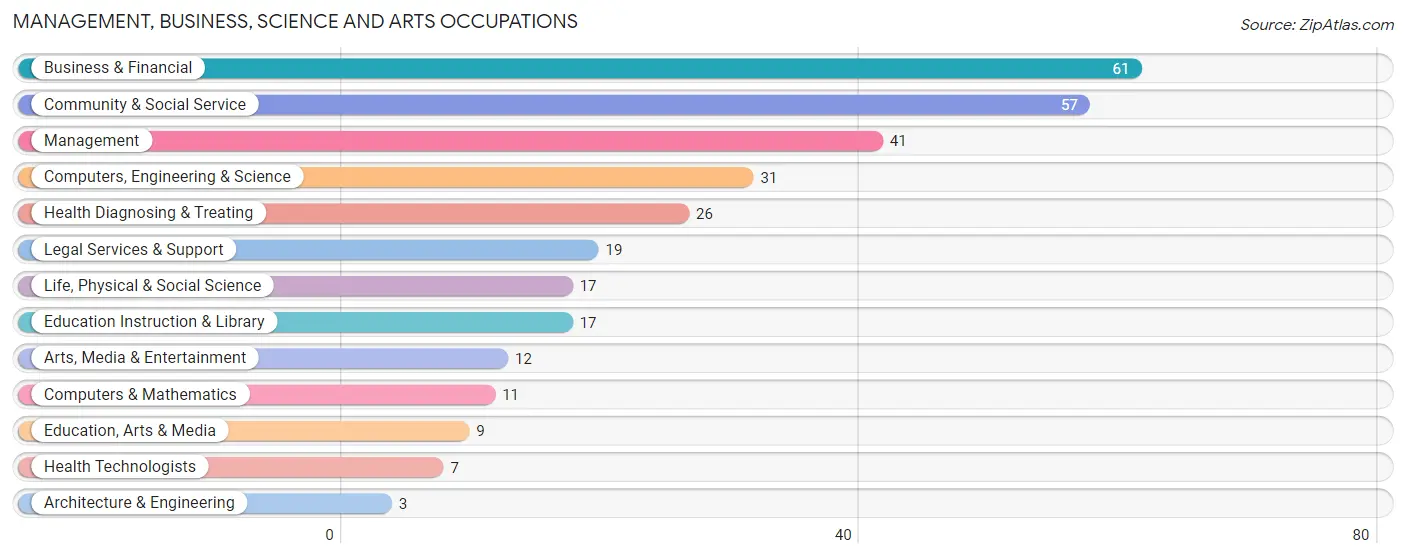
Management, Business, Science and Arts Occupations
The most common Management, Business, Science and Arts occupations in Louisa are Business & Financial (61 | 6.9%), Community & Social Service (57 | 6.5%), Management (41 | 4.6%), Computers, Engineering & Science (31 | 3.5%), and Health Diagnosing & Treating (26 | 2.9%).
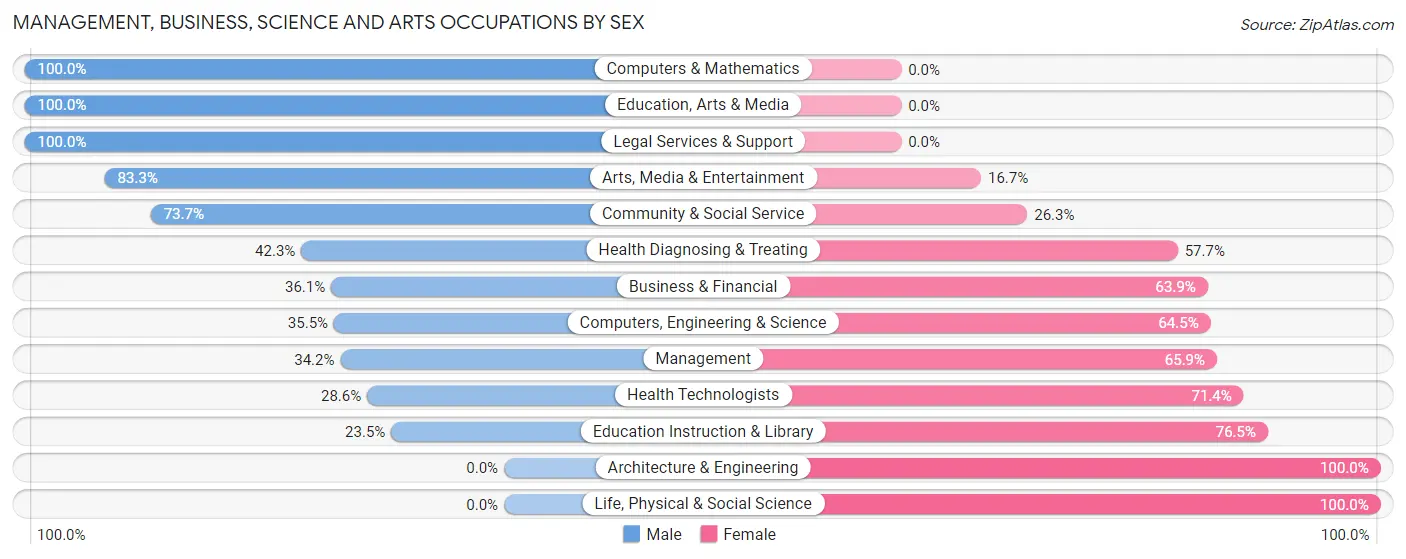
Management, Business, Science and Arts Occupations by Sex
Within the Management, Business, Science and Arts occupations in Louisa, the most male-oriented occupations are Computers & Mathematics (100.0%), Education, Arts & Media (100.0%), and Legal Services & Support (100.0%), while the most female-oriented occupations are Architecture & Engineering (100.0%), Life, Physical & Social Science (100.0%), and Education Instruction & Library (76.5%).
| Occupation | Male | Female |
| Management | 14 (34.2%) | 27 (65.8%) |
| Business & Financial | 22 (36.1%) | 39 (63.9%) |
| Computers, Engineering & Science | 11 (35.5%) | 20 (64.5%) |
| Computers & Mathematics | 11 (100.0%) | 0 (0.0%) |
| Architecture & Engineering | 0 (0.0%) | 3 (100.0%) |
| Life, Physical & Social Science | 0 (0.0%) | 17 (100.0%) |
| Community & Social Service | 42 (73.7%) | 15 (26.3%) |
| Education, Arts & Media | 9 (100.0%) | 0 (0.0%) |
| Legal Services & Support | 19 (100.0%) | 0 (0.0%) |
| Education Instruction & Library | 4 (23.5%) | 13 (76.5%) |
| Arts, Media & Entertainment | 10 (83.3%) | 2 (16.7%) |
| Health Diagnosing & Treating | 11 (42.3%) | 15 (57.7%) |
| Health Technologists | 2 (28.6%) | 5 (71.4%) |
| Total (Category) | 100 (46.3%) | 116 (53.7%) |
| Total (Overall) | 419 (47.4%) | 465 (52.6%) |
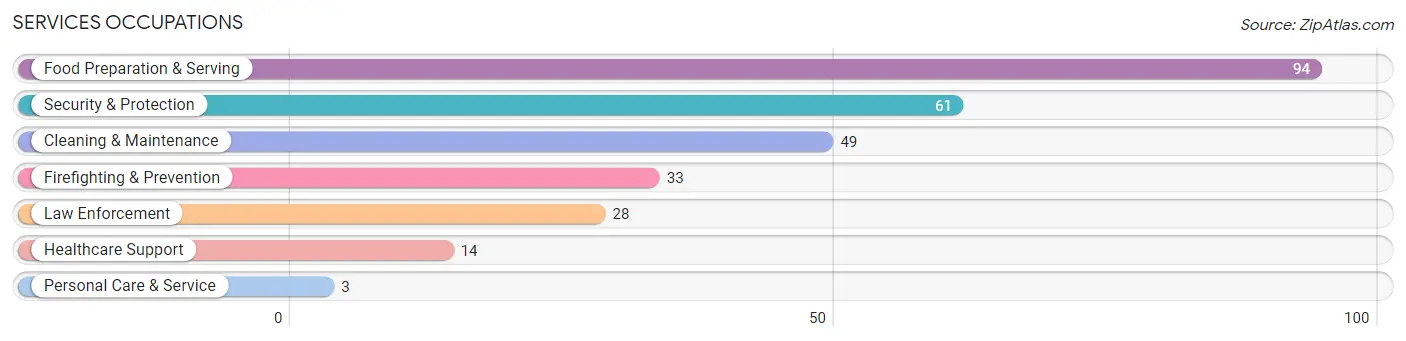
Services Occupations
The most common Services occupations in Louisa are Food Preparation & Serving (94 | 10.6%), Security & Protection (61 | 6.9%), Cleaning & Maintenance (49 | 5.5%), Firefighting & Prevention (33 | 3.7%), and Law Enforcement (28 | 3.2%).
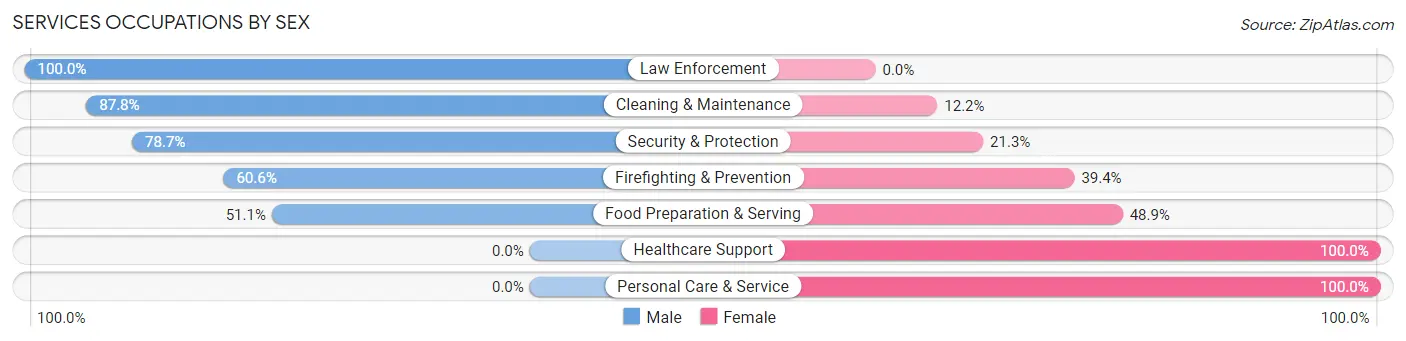
Services Occupations by Sex
Within the Services occupations in Louisa, the most male-oriented occupations are Law Enforcement (100.0%), Cleaning & Maintenance (87.8%), and Security & Protection (78.7%), while the most female-oriented occupations are Healthcare Support (100.0%), Personal Care & Service (100.0%), and Food Preparation & Serving (48.9%).
| Occupation | Male | Female |
| Healthcare Support | 0 (0.0%) | 14 (100.0%) |
| Security & Protection | 48 (78.7%) | 13 (21.3%) |
| Firefighting & Prevention | 20 (60.6%) | 13 (39.4%) |
| Law Enforcement | 28 (100.0%) | 0 (0.0%) |
| Food Preparation & Serving | 48 (51.1%) | 46 (48.9%) |
| Cleaning & Maintenance | 43 (87.8%) | 6 (12.2%) |
| Personal Care & Service | 0 (0.0%) | 3 (100.0%) |
| Total (Category) | 139 (62.9%) | 82 (37.1%) |
| Total (Overall) | 419 (47.4%) | 465 (52.6%) |
Sales and Office Occupations
The most common Sales and Office occupations in Louisa are Office & Administration (150 | 17.0%), and Sales & Related (139 | 15.7%).

Sales and Office Occupations by Sex

| Occupation | Male | Female |
| Sales & Related | 41 (29.5%) | 98 (70.5%) |
| Office & Administration | 9 (6.0%) | 141 (94.0%) |
| Total (Category) | 50 (17.3%) | 239 (82.7%) |
| Total (Overall) | 419 (47.4%) | 465 (52.6%) |
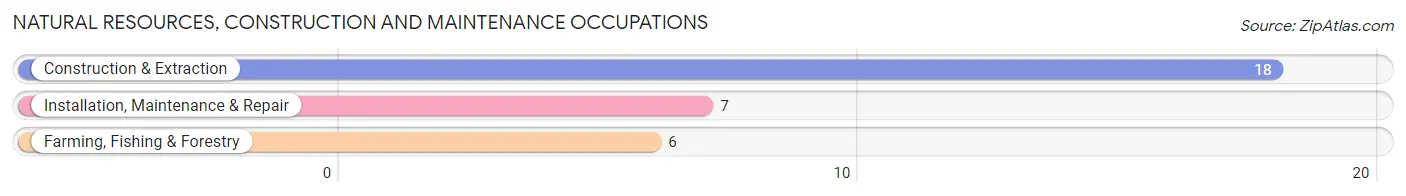
Natural Resources, Construction and Maintenance Occupations
The most common Natural Resources, Construction and Maintenance occupations in Louisa are Construction & Extraction (18 | 2.0%), Installation, Maintenance & Repair (7 | 0.8%), and Farming, Fishing & Forestry (6 | 0.7%).
Natural Resources, Construction and Maintenance Occupations by Sex
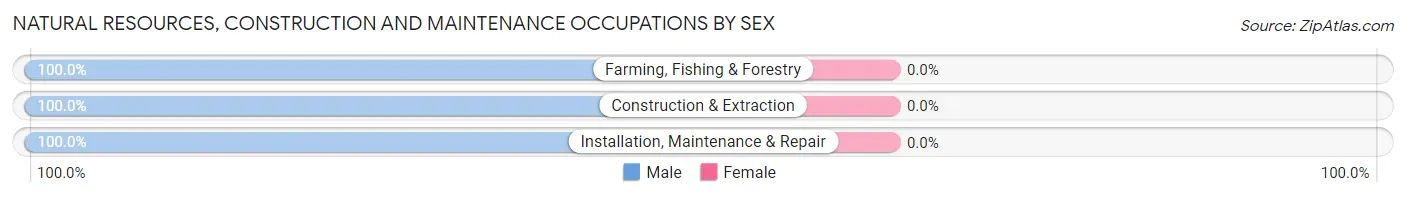
| Occupation | Male | Female |
| Farming, Fishing & Forestry | 6 (100.0%) | 0 (0.0%) |
| Construction & Extraction | 18 (100.0%) | 0 (0.0%) |
| Installation, Maintenance & Repair | 7 (100.0%) | 0 (0.0%) |
| Total (Category) | 31 (100.0%) | 0 (0.0%) |
| Total (Overall) | 419 (47.4%) | 465 (52.6%) |
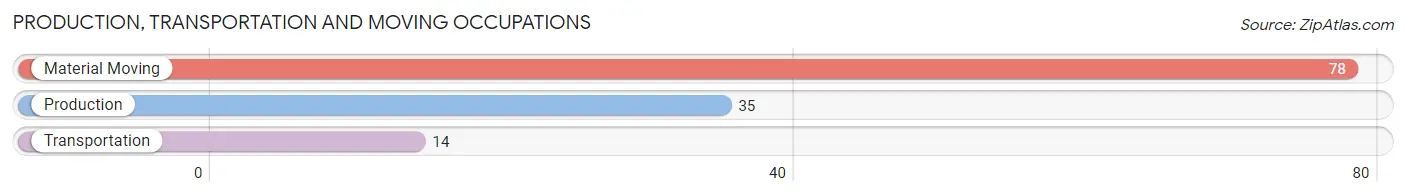
Production, Transportation and Moving Occupations
The most common Production, Transportation and Moving occupations in Louisa are Material Moving (78 | 8.8%), Production (35 | 4.0%), and Transportation (14 | 1.6%).
Production, Transportation and Moving Occupations by Sex
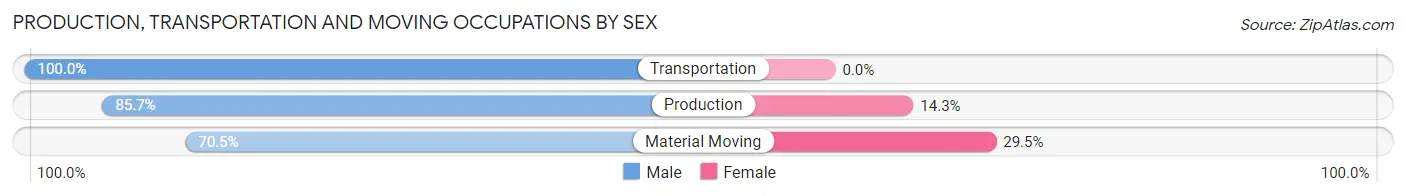
| Occupation | Male | Female |
| Production | 30 (85.7%) | 5 (14.3%) |
| Transportation | 14 (100.0%) | 0 (0.0%) |
| Material Moving | 55 (70.5%) | 23 (29.5%) |
| Total (Category) | 99 (77.9%) | 28 (22.1%) |
| Total (Overall) | 419 (47.4%) | 465 (52.6%) |
Employment Industries by Sex in Louisa
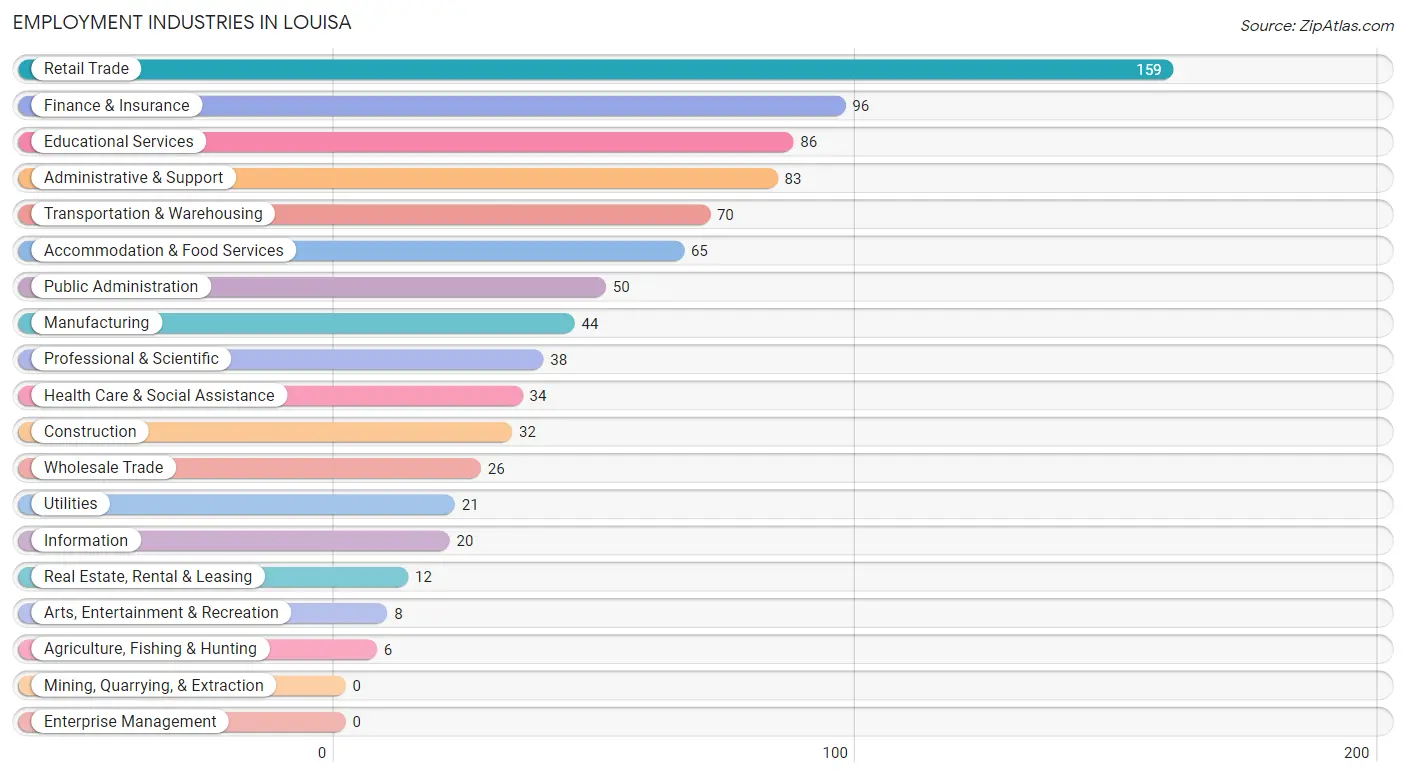
Employment Industries in Louisa
The major employment industries in Louisa include Retail Trade (159 | 18.0%), Finance & Insurance (96 | 10.9%), Educational Services (86 | 9.7%), Administrative & Support (83 | 9.4%), and Transportation & Warehousing (70 | 7.9%).
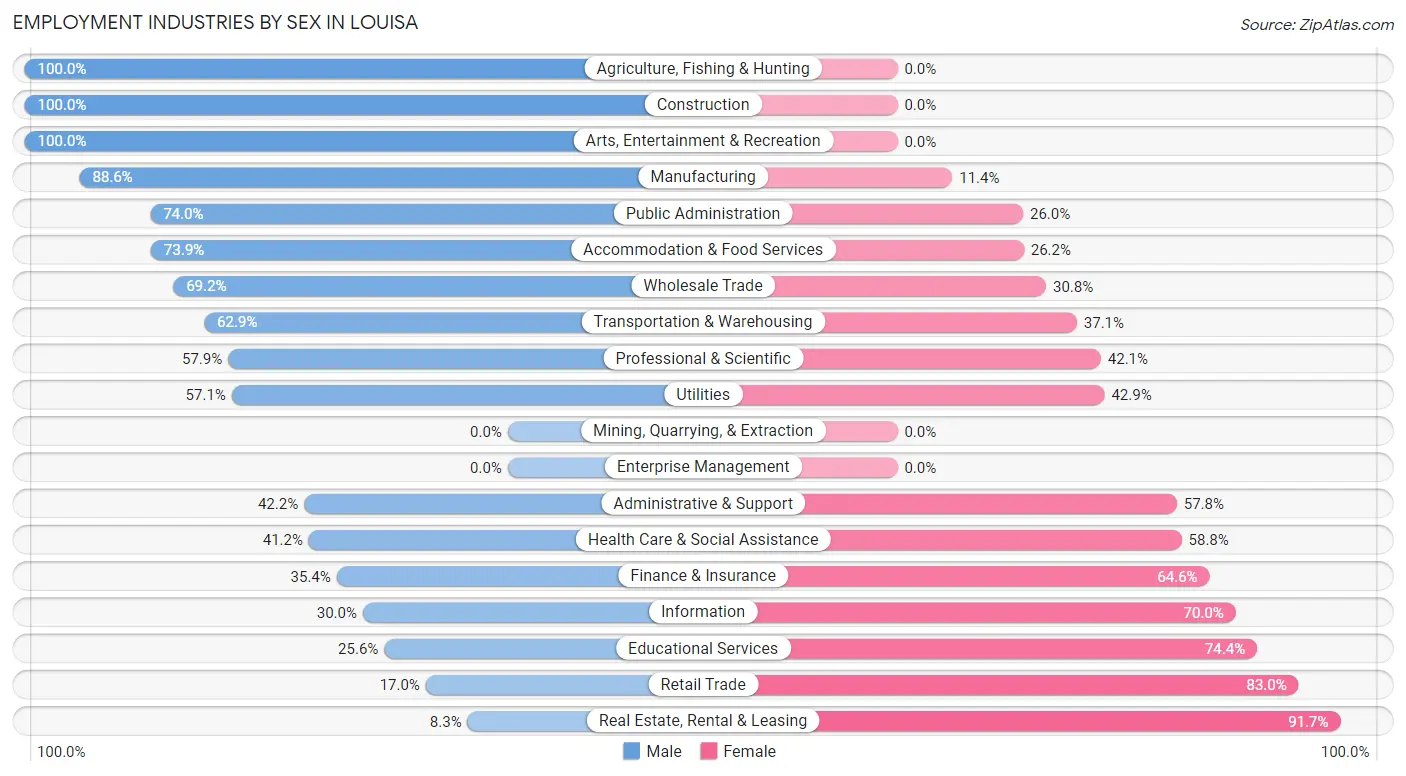
Employment Industries by Sex in Louisa
The Louisa industries that see more men than women are Agriculture, Fishing & Hunting (100.0%), Construction (100.0%), and Arts, Entertainment & Recreation (100.0%), whereas the industries that tend to have a higher number of women are Real Estate, Rental & Leasing (91.7%), Retail Trade (83.0%), and Educational Services (74.4%).
| Industry | Male | Female |
| Agriculture, Fishing & Hunting | 6 (100.0%) | 0 (0.0%) |
| Mining, Quarrying, & Extraction | 0 (0.0%) | 0 (0.0%) |
| Construction | 32 (100.0%) | 0 (0.0%) |
| Manufacturing | 39 (88.6%) | 5 (11.4%) |
| Wholesale Trade | 18 (69.2%) | 8 (30.8%) |
| Retail Trade | 27 (17.0%) | 132 (83.0%) |
| Transportation & Warehousing | 44 (62.9%) | 26 (37.1%) |
| Utilities | 12 (57.1%) | 9 (42.9%) |
| Information | 6 (30.0%) | 14 (70.0%) |
| Finance & Insurance | 34 (35.4%) | 62 (64.6%) |
| Real Estate, Rental & Leasing | 1 (8.3%) | 11 (91.7%) |
| Professional & Scientific | 22 (57.9%) | 16 (42.1%) |
| Enterprise Management | 0 (0.0%) | 0 (0.0%) |
| Administrative & Support | 35 (42.2%) | 48 (57.8%) |
| Educational Services | 22 (25.6%) | 64 (74.4%) |
| Health Care & Social Assistance | 14 (41.2%) | 20 (58.8%) |
| Arts, Entertainment & Recreation | 8 (100.0%) | 0 (0.0%) |
| Accommodation & Food Services | 48 (73.9%) | 17 (26.2%) |
| Public Administration | 37 (74.0%) | 13 (26.0%) |
| Total | 419 (47.4%) | 465 (52.6%) |
Education in Louisa
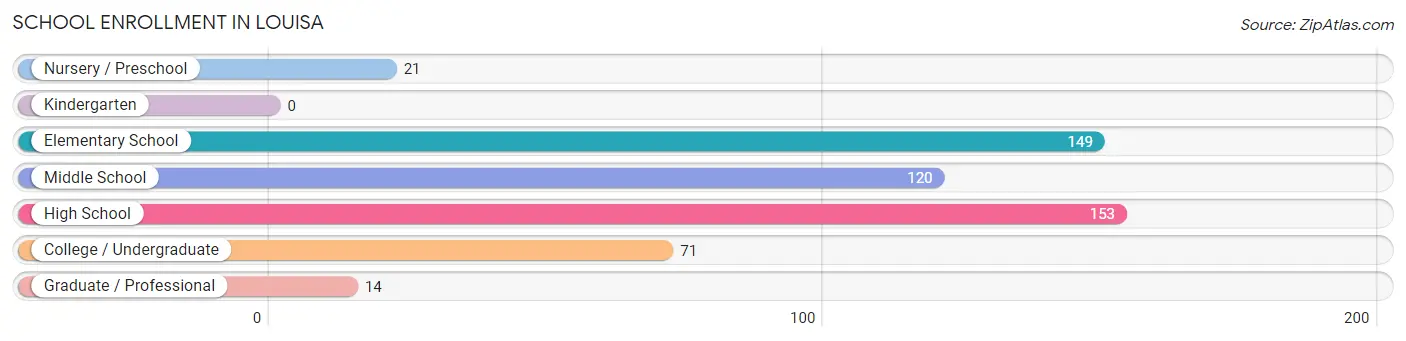
School Enrollment in Louisa
The most common levels of schooling among the 528 students in Louisa are high school (153 | 29.0%), elementary school (149 | 28.2%), and middle school (120 | 22.7%).
| School Level | # Students | % Students |
| Nursery / Preschool | 21 | 4.0% |
| Kindergarten | 0 | 0.0% |
| Elementary School | 149 | 28.2% |
| Middle School | 120 | 22.7% |
| High School | 153 | 29.0% |
| College / Undergraduate | 71 | 13.5% |
| Graduate / Professional | 14 | 2.6% |
| Total | 528 | 100.0% |
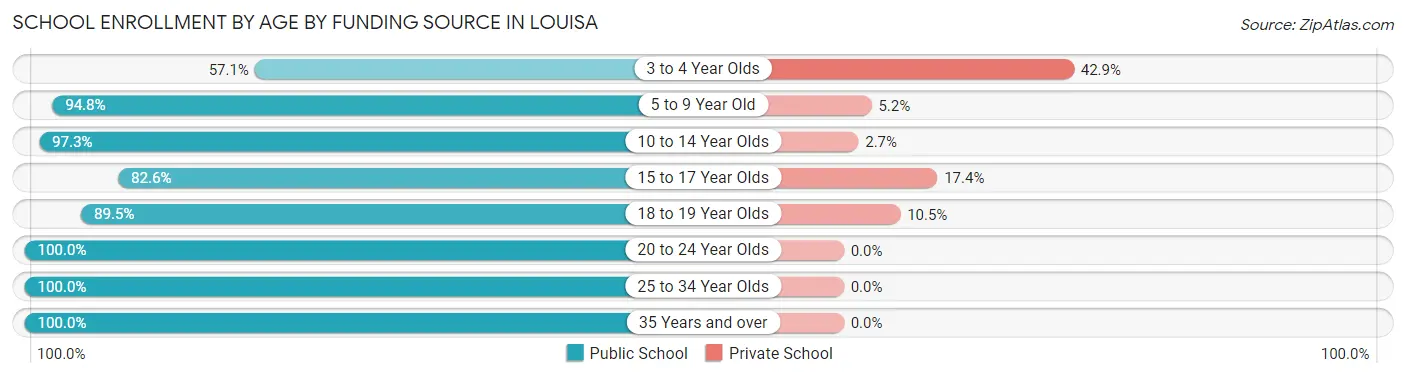
School Enrollment by Age by Funding Source in Louisa
Out of a total of 528 students who are enrolled in schools in Louisa, 41 (7.8%) attend a private institution, while the remaining 487 (92.2%) are enrolled in public schools. The age group of 3 to 4 year olds has the highest likelihood of being enrolled in private schools, with 9 (42.9% in the age bracket) enrolled. Conversely, the age group of 20 to 24 year olds has the lowest likelihood of being enrolled in a private school, with 10 (100.0% in the age bracket) attending a public institution.
| Age Bracket | Public School | Private School |
| 3 to 4 Year Olds | 12 (57.1%) | 9 (42.9%) |
| 5 to 9 Year Old | 110 (94.8%) | 6 (5.2%) |
| 10 to 14 Year Olds | 179 (97.3%) | 5 (2.7%) |
| 15 to 17 Year Olds | 90 (82.6%) | 19 (17.4%) |
| 18 to 19 Year Olds | 17 (89.5%) | 2 (10.5%) |
| 20 to 24 Year Olds | 10 (100.0%) | 0 (0.0%) |
| 25 to 34 Year Olds | 19 (100.0%) | 0 (0.0%) |
| 35 Years and over | 50 (100.0%) | 0 (0.0%) |
| Total | 487 (92.2%) | 41 (7.8%) |
Educational Attainment by Field of Study in Louisa
Liberal arts & history (67 | 15.6%), social sciences (50 | 11.7%), business (50 | 11.7%), visual & performing arts (40 | 9.3%), and psychology (39 | 9.1%) are the most common fields of study among 429 individuals in Louisa who have obtained a bachelor's degree or higher.
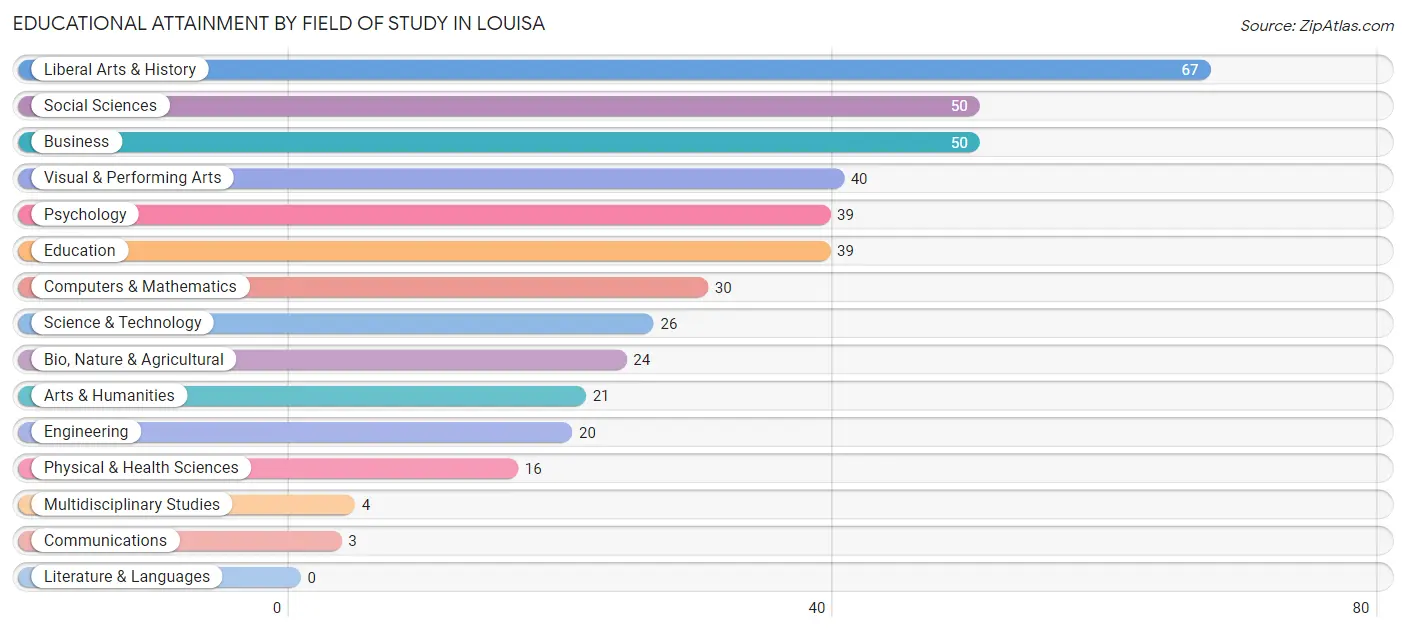
| Field of Study | # Graduates | % Graduates |
| Computers & Mathematics | 30 | 7.0% |
| Bio, Nature & Agricultural | 24 | 5.6% |
| Physical & Health Sciences | 16 | 3.7% |
| Psychology | 39 | 9.1% |
| Social Sciences | 50 | 11.7% |
| Engineering | 20 | 4.7% |
| Multidisciplinary Studies | 4 | 0.9% |
| Science & Technology | 26 | 6.1% |
| Business | 50 | 11.7% |
| Education | 39 | 9.1% |
| Literature & Languages | 0 | 0.0% |
| Liberal Arts & History | 67 | 15.6% |
| Visual & Performing Arts | 40 | 9.3% |
| Communications | 3 | 0.7% |
| Arts & Humanities | 21 | 4.9% |
| Total | 429 | 100.0% |
Transportation & Commute in Louisa
Vehicle Availability by Sex in Louisa
The most prevalent vehicle ownership categories in Louisa are males with 2 vehicles (157, accounting for 38.7%) and females with 2 vehicles (174, making up 33.8%).
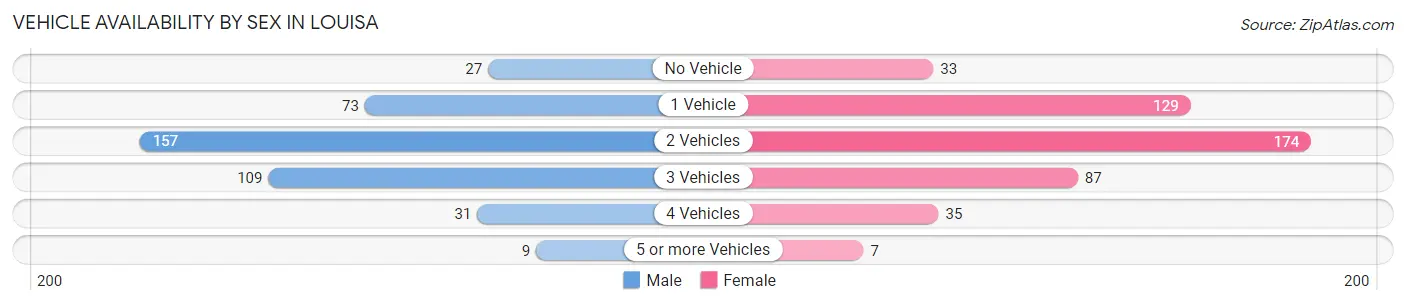
| Vehicles Available | Male | Female |
| No Vehicle | 27 (6.7%) | 33 (7.1%) |
| 1 Vehicle | 73 (18.0%) | 129 (27.7%) |
| 2 Vehicles | 157 (38.7%) | 174 (37.4%) |
| 3 Vehicles | 109 (26.9%) | 87 (18.7%) |
| 4 Vehicles | 31 (7.6%) | 35 (7.5%) |
| 5 or more Vehicles | 9 (2.2%) | 7 (1.5%) |
| Total | 406 (100.0%) | 465 (100.0%) |
Commute Time in Louisa
The most frequently occuring commute durations in Louisa are 5 to 9 minutes (152 commuters, 18.9%), 45 to 59 minutes (109 commuters, 13.6%), and 40 to 44 minutes (80 commuters, 10.0%).
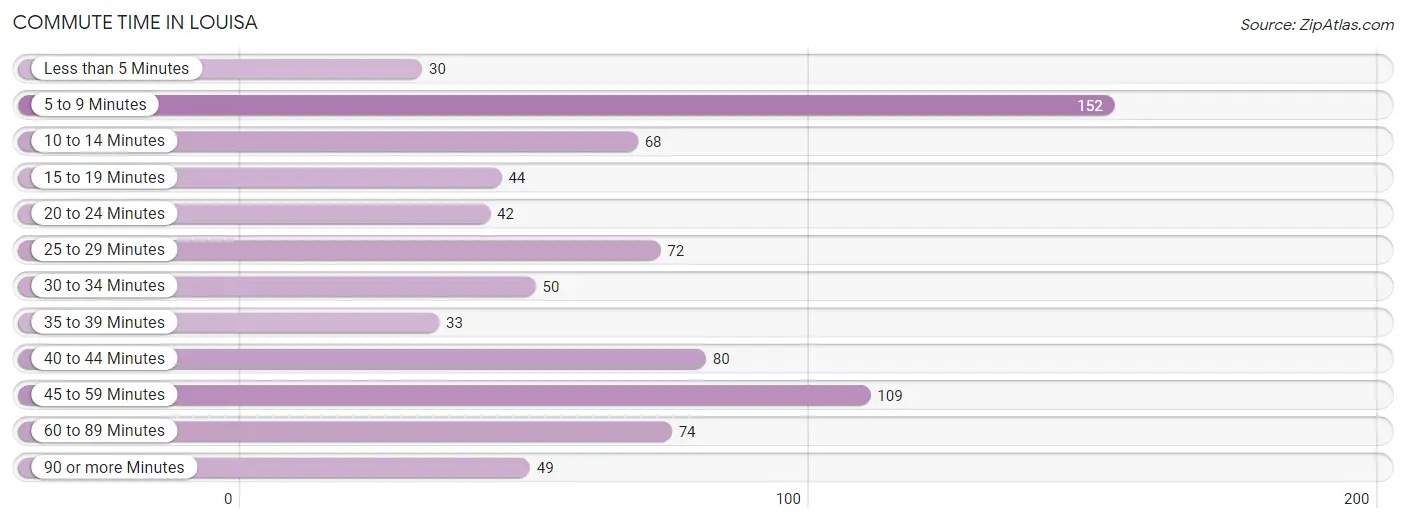
| Commute Time | # Commuters | % Commuters |
| Less than 5 Minutes | 30 | 3.7% |
| 5 to 9 Minutes | 152 | 18.9% |
| 10 to 14 Minutes | 68 | 8.5% |
| 15 to 19 Minutes | 44 | 5.5% |
| 20 to 24 Minutes | 42 | 5.2% |
| 25 to 29 Minutes | 72 | 9.0% |
| 30 to 34 Minutes | 50 | 6.2% |
| 35 to 39 Minutes | 33 | 4.1% |
| 40 to 44 Minutes | 80 | 10.0% |
| 45 to 59 Minutes | 109 | 13.6% |
| 60 to 89 Minutes | 74 | 9.2% |
| 90 or more Minutes | 49 | 6.1% |
Commute Time by Sex in Louisa
The most common commute times in Louisa are 5 to 9 minutes (85 commuters, 22.0%) for males and 5 to 9 minutes (67 commuters, 16.1%) for females.
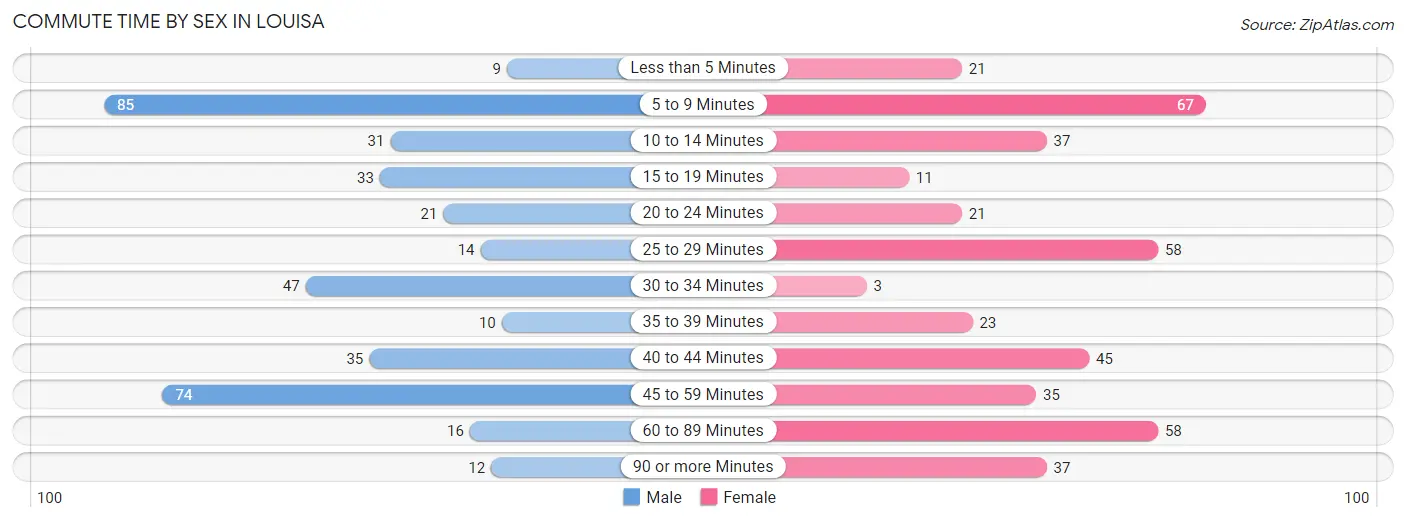
| Commute Time | Male | Female |
| Less than 5 Minutes | 9 (2.3%) | 21 (5.1%) |
| 5 to 9 Minutes | 85 (22.0%) | 67 (16.1%) |
| 10 to 14 Minutes | 31 (8.0%) | 37 (8.9%) |
| 15 to 19 Minutes | 33 (8.5%) | 11 (2.6%) |
| 20 to 24 Minutes | 21 (5.4%) | 21 (5.1%) |
| 25 to 29 Minutes | 14 (3.6%) | 58 (13.9%) |
| 30 to 34 Minutes | 47 (12.1%) | 3 (0.7%) |
| 35 to 39 Minutes | 10 (2.6%) | 23 (5.5%) |
| 40 to 44 Minutes | 35 (9.0%) | 45 (10.8%) |
| 45 to 59 Minutes | 74 (19.1%) | 35 (8.4%) |
| 60 to 89 Minutes | 16 (4.1%) | 58 (13.9%) |
| 90 or more Minutes | 12 (3.1%) | 37 (8.9%) |
Time of Departure to Work by Sex in Louisa
The most frequent times of departure to work in Louisa are 9:00 AM to 9:59 AM (51, 13.2%) for males and 8:00 AM to 8:29 AM (72, 17.3%) for females.
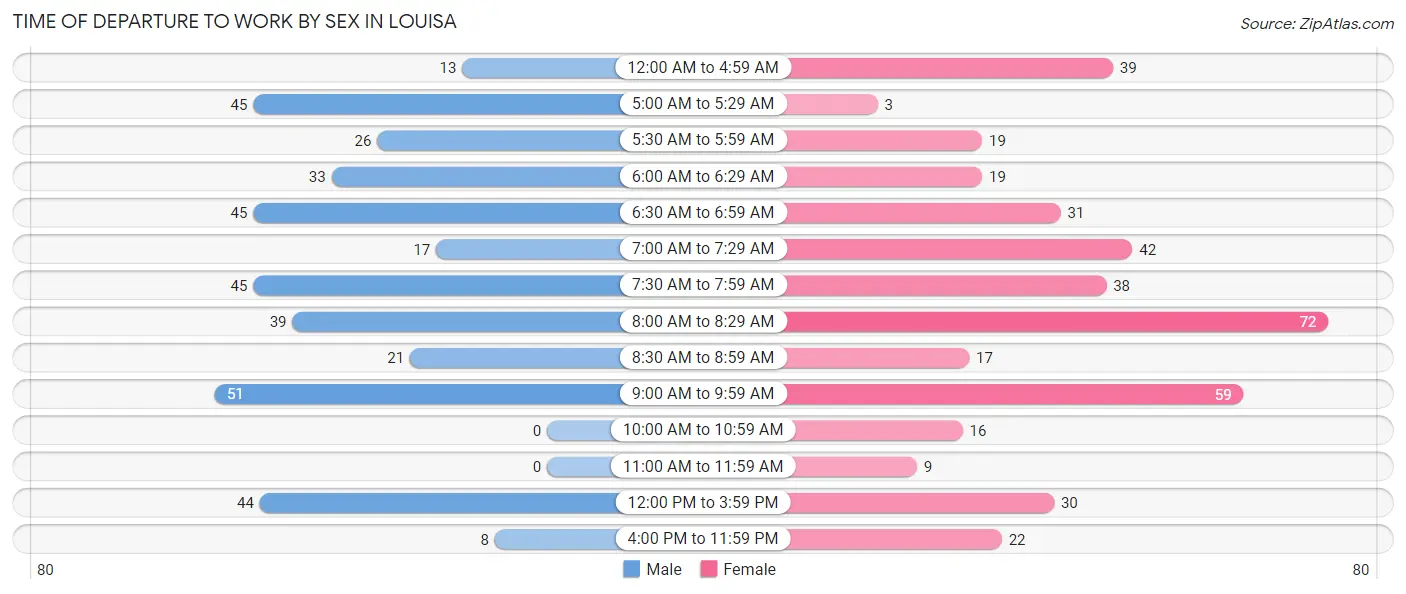
| Time of Departure | Male | Female |
| 12:00 AM to 4:59 AM | 13 (3.4%) | 39 (9.4%) |
| 5:00 AM to 5:29 AM | 45 (11.6%) | 3 (0.7%) |
| 5:30 AM to 5:59 AM | 26 (6.7%) | 19 (4.6%) |
| 6:00 AM to 6:29 AM | 33 (8.5%) | 19 (4.6%) |
| 6:30 AM to 6:59 AM | 45 (11.6%) | 31 (7.4%) |
| 7:00 AM to 7:29 AM | 17 (4.4%) | 42 (10.1%) |
| 7:30 AM to 7:59 AM | 45 (11.6%) | 38 (9.1%) |
| 8:00 AM to 8:29 AM | 39 (10.1%) | 72 (17.3%) |
| 8:30 AM to 8:59 AM | 21 (5.4%) | 17 (4.1%) |
| 9:00 AM to 9:59 AM | 51 (13.2%) | 59 (14.2%) |
| 10:00 AM to 10:59 AM | 0 (0.0%) | 16 (3.8%) |
| 11:00 AM to 11:59 AM | 0 (0.0%) | 9 (2.2%) |
| 12:00 PM to 3:59 PM | 44 (11.4%) | 30 (7.2%) |
| 4:00 PM to 11:59 PM | 8 (2.1%) | 22 (5.3%) |
| Total | 387 (100.0%) | 416 (100.0%) |
Housing Occupancy in Louisa
Occupancy by Ownership in Louisa
Of the total 907 dwellings in Louisa, owner-occupied units account for 332 (36.6%), while renter-occupied units make up 575 (63.4%).
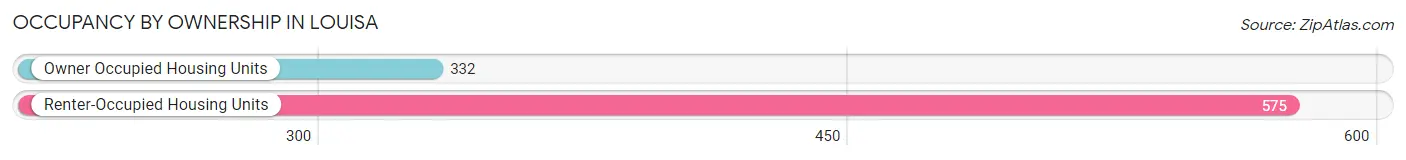
| Occupancy | # Housing Units | % Housing Units |
| Owner Occupied Housing Units | 332 | 36.6% |
| Renter-Occupied Housing Units | 575 | 63.4% |
| Total Occupied Housing Units | 907 | 100.0% |
Occupancy by Household Size in Louisa
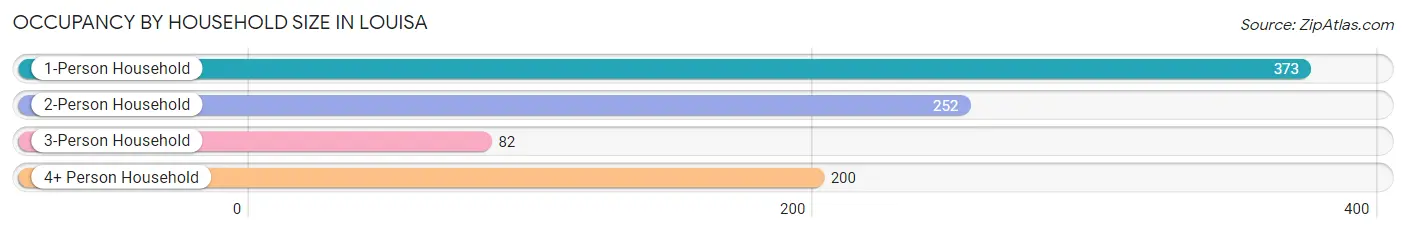
| Household Size | # Housing Units | % Housing Units |
| 1-Person Household | 373 | 41.1% |
| 2-Person Household | 252 | 27.8% |
| 3-Person Household | 82 | 9.0% |
| 4+ Person Household | 200 | 22.1% |
| Total Housing Units | 907 | 100.0% |
Occupancy by Ownership by Household Size in Louisa
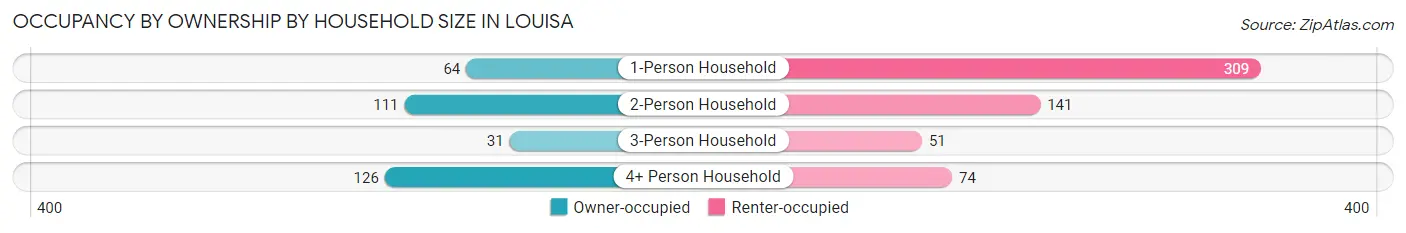
| Household Size | Owner-occupied | Renter-occupied |
| 1-Person Household | 64 (17.2%) | 309 (82.8%) |
| 2-Person Household | 111 (44.1%) | 141 (55.9%) |
| 3-Person Household | 31 (37.8%) | 51 (62.2%) |
| 4+ Person Household | 126 (63.0%) | 74 (37.0%) |
| Total Housing Units | 332 (36.6%) | 575 (63.4%) |
Occupancy by Educational Attainment in Louisa
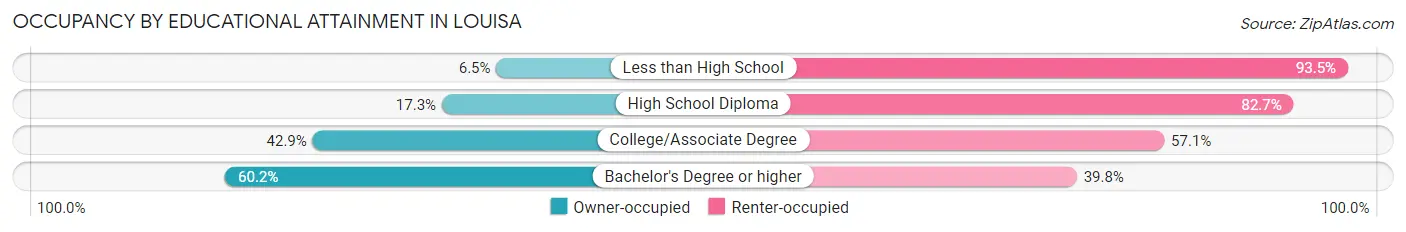
| Household Size | Owner-occupied | Renter-occupied |
| Less than High School | 9 (6.5%) | 130 (93.5%) |
| High School Diploma | 34 (17.3%) | 163 (82.7%) |
| College/Associate Degree | 136 (42.9%) | 181 (57.1%) |
| Bachelor's Degree or higher | 153 (60.2%) | 101 (39.8%) |
Occupancy by Age of Householder in Louisa
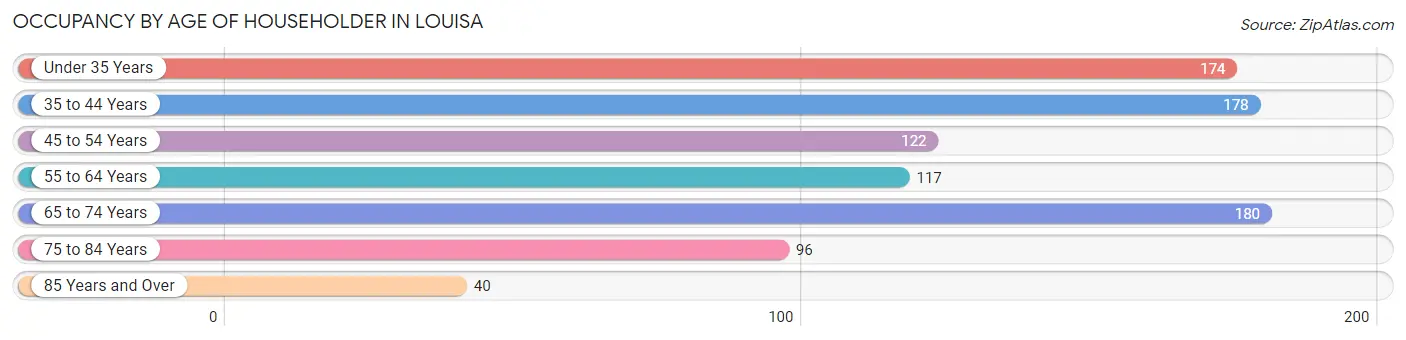
| Age Bracket | # Households | % Households |
| Under 35 Years | 174 | 19.2% |
| 35 to 44 Years | 178 | 19.6% |
| 45 to 54 Years | 122 | 13.5% |
| 55 to 64 Years | 117 | 12.9% |
| 65 to 74 Years | 180 | 19.9% |
| 75 to 84 Years | 96 | 10.6% |
| 85 Years and Over | 40 | 4.4% |
| Total | 907 | 100.0% |
Housing Finances in Louisa
Median Income by Occupancy in Louisa
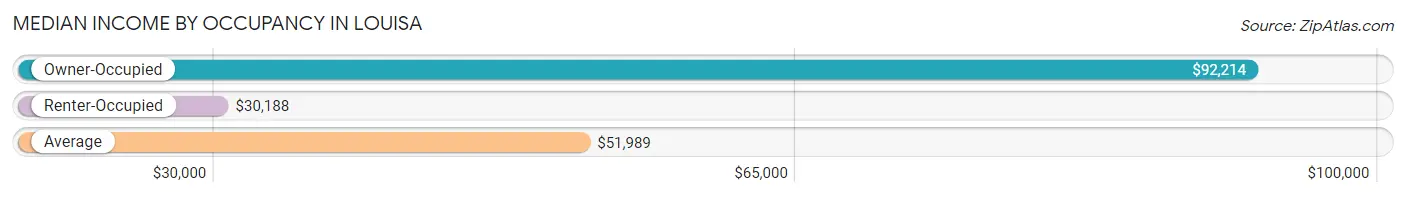
| Occupancy Type | # Households | Median Income |
| Owner-Occupied | 332 (36.6%) | $92,214 |
| Renter-Occupied | 575 (63.4%) | $30,188 |
| Average | 907 (100.0%) | $51,989 |
Occupancy by Householder Income Bracket in Louisa
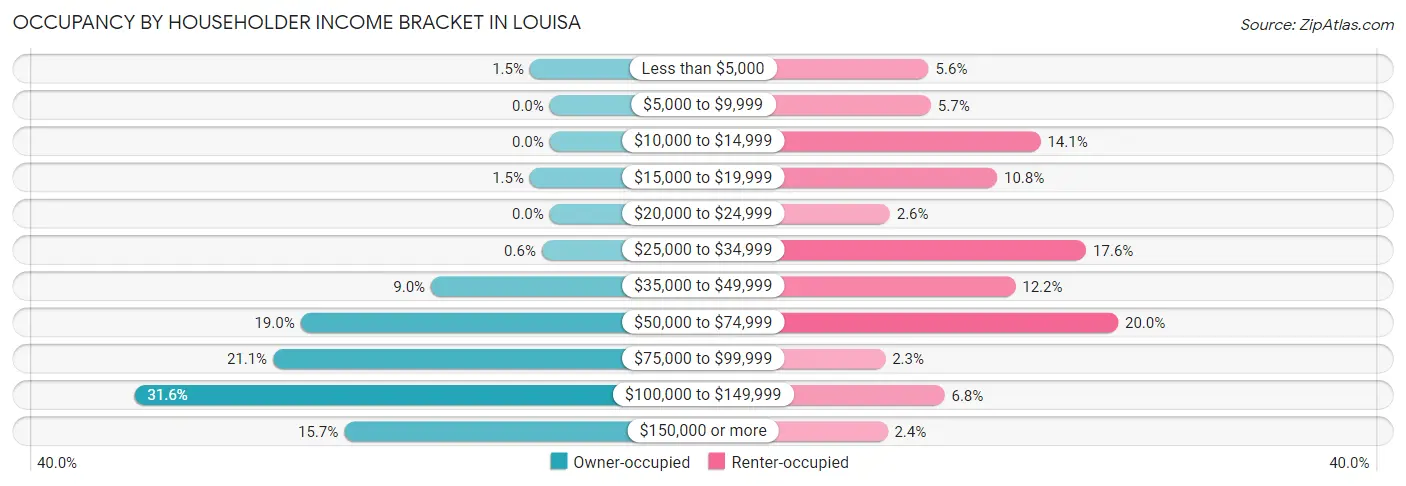
| Income Bracket | Owner-occupied | Renter-occupied |
| Less than $5,000 | 5 (1.5%) | 32 (5.6%) |
| $5,000 to $9,999 | 0 (0.0%) | 33 (5.7%) |
| $10,000 to $14,999 | 0 (0.0%) | 81 (14.1%) |
| $15,000 to $19,999 | 5 (1.5%) | 62 (10.8%) |
| $20,000 to $24,999 | 0 (0.0%) | 15 (2.6%) |
| $25,000 to $34,999 | 2 (0.6%) | 101 (17.6%) |
| $35,000 to $49,999 | 30 (9.0%) | 70 (12.2%) |
| $50,000 to $74,999 | 63 (19.0%) | 115 (20.0%) |
| $75,000 to $99,999 | 70 (21.1%) | 13 (2.3%) |
| $100,000 to $149,999 | 105 (31.6%) | 39 (6.8%) |
| $150,000 or more | 52 (15.7%) | 14 (2.4%) |
| Total | 332 (100.0%) | 575 (100.0%) |
Monthly Housing Cost Tiers in Louisa
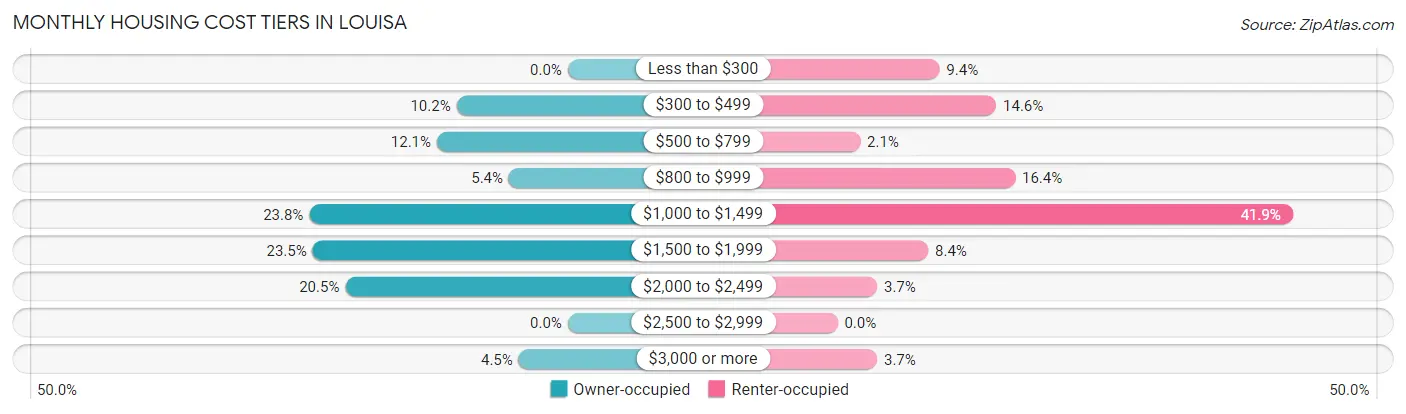
| Monthly Cost | Owner-occupied | Renter-occupied |
| Less than $300 | 0 (0.0%) | 54 (9.4%) |
| $300 to $499 | 34 (10.2%) | 84 (14.6%) |
| $500 to $799 | 40 (12.0%) | 12 (2.1%) |
| $800 to $999 | 18 (5.4%) | 94 (16.4%) |
| $1,000 to $1,499 | 79 (23.8%) | 241 (41.9%) |
| $1,500 to $1,999 | 78 (23.5%) | 48 (8.4%) |
| $2,000 to $2,499 | 68 (20.5%) | 21 (3.6%) |
| $2,500 to $2,999 | 0 (0.0%) | 0 (0.0%) |
| $3,000 or more | 15 (4.5%) | 21 (3.6%) |
| Total | 332 (100.0%) | 575 (100.0%) |
Physical Housing Characteristics in Louisa
Housing Structures in Louisa
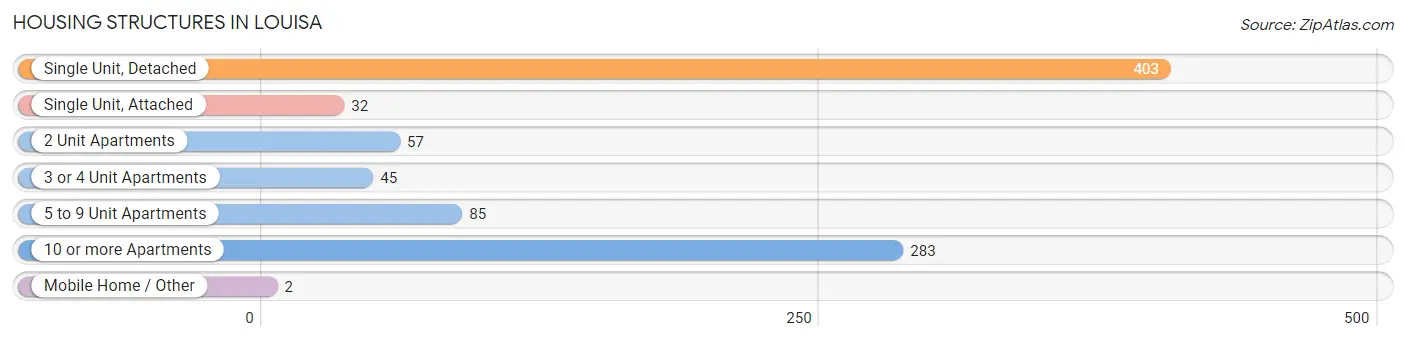
| Structure Type | # Housing Units | % Housing Units |
| Single Unit, Detached | 403 | 44.4% |
| Single Unit, Attached | 32 | 3.5% |
| 2 Unit Apartments | 57 | 6.3% |
| 3 or 4 Unit Apartments | 45 | 5.0% |
| 5 to 9 Unit Apartments | 85 | 9.4% |
| 10 or more Apartments | 283 | 31.2% |
| Mobile Home / Other | 2 | 0.2% |
| Total | 907 | 100.0% |
Housing Structures by Occupancy in Louisa
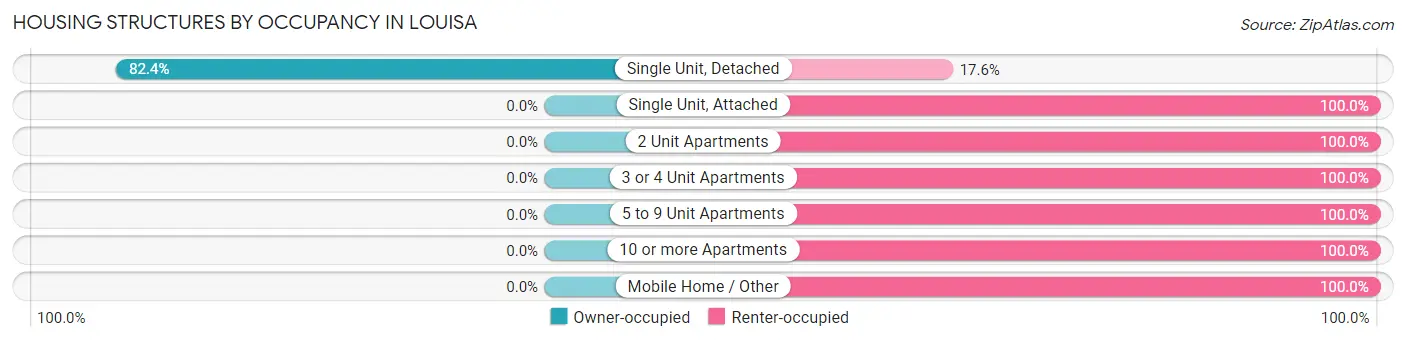
| Structure Type | Owner-occupied | Renter-occupied |
| Single Unit, Detached | 332 (82.4%) | 71 (17.6%) |
| Single Unit, Attached | 0 (0.0%) | 32 (100.0%) |
| 2 Unit Apartments | 0 (0.0%) | 57 (100.0%) |
| 3 or 4 Unit Apartments | 0 (0.0%) | 45 (100.0%) |
| 5 to 9 Unit Apartments | 0 (0.0%) | 85 (100.0%) |
| 10 or more Apartments | 0 (0.0%) | 283 (100.0%) |
| Mobile Home / Other | 0 (0.0%) | 2 (100.0%) |
| Total | 332 (36.6%) | 575 (63.4%) |
Housing Structures by Number of Rooms in Louisa
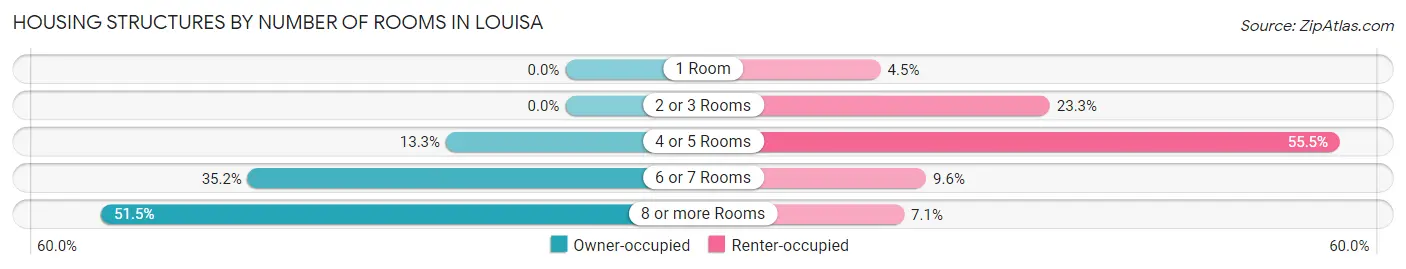
| Number of Rooms | Owner-occupied | Renter-occupied |
| 1 Room | 0 (0.0%) | 26 (4.5%) |
| 2 or 3 Rooms | 0 (0.0%) | 134 (23.3%) |
| 4 or 5 Rooms | 44 (13.3%) | 319 (55.5%) |
| 6 or 7 Rooms | 117 (35.2%) | 55 (9.6%) |
| 8 or more Rooms | 171 (51.5%) | 41 (7.1%) |
| Total | 332 (100.0%) | 575 (100.0%) |
Housing Structure by Heating Type in Louisa
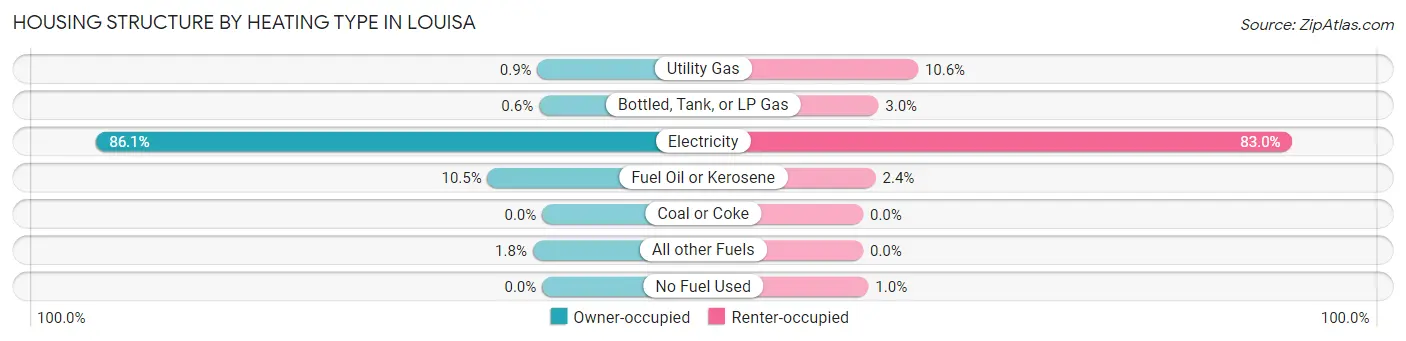
| Heating Type | Owner-occupied | Renter-occupied |
| Utility Gas | 3 (0.9%) | 61 (10.6%) |
| Bottled, Tank, or LP Gas | 2 (0.6%) | 17 (3.0%) |
| Electricity | 286 (86.1%) | 477 (83.0%) |
| Fuel Oil or Kerosene | 35 (10.5%) | 14 (2.4%) |
| Coal or Coke | 0 (0.0%) | 0 (0.0%) |
| All other Fuels | 6 (1.8%) | 0 (0.0%) |
| No Fuel Used | 0 (0.0%) | 6 (1.0%) |
| Total | 332 (100.0%) | 575 (100.0%) |
Household Vehicle Usage in Louisa
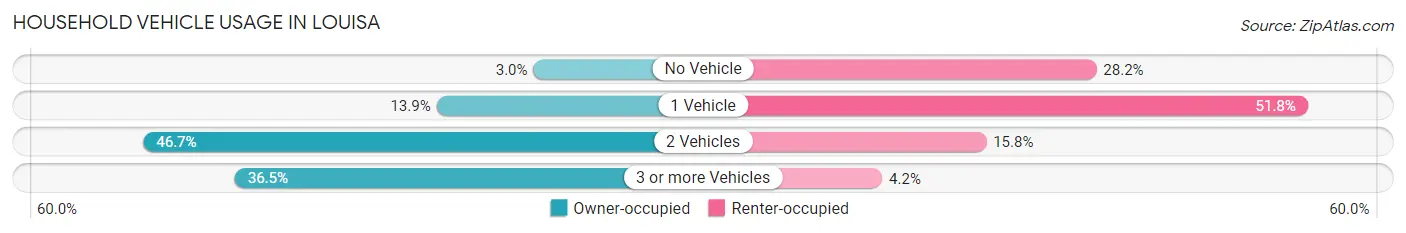
| Vehicles per Household | Owner-occupied | Renter-occupied |
| No Vehicle | 10 (3.0%) | 162 (28.2%) |
| 1 Vehicle | 46 (13.9%) | 298 (51.8%) |
| 2 Vehicles | 155 (46.7%) | 91 (15.8%) |
| 3 or more Vehicles | 121 (36.4%) | 24 (4.2%) |
| Total | 332 (100.0%) | 575 (100.0%) |
Real Estate & Mortgages in Louisa
Real Estate and Mortgage Overview in Louisa
| Characteristic | Without Mortgage | With Mortgage |
| Housing Units | 47 | 285 |
| Median Property Value | $237,500 | $293,800 |
| Median Household Income | $110,938 | $52 |
| Monthly Housing Costs | $594 | $15 |
| Real Estate Taxes | $1,738 | $2 |
Property Value by Mortgage Status in Louisa
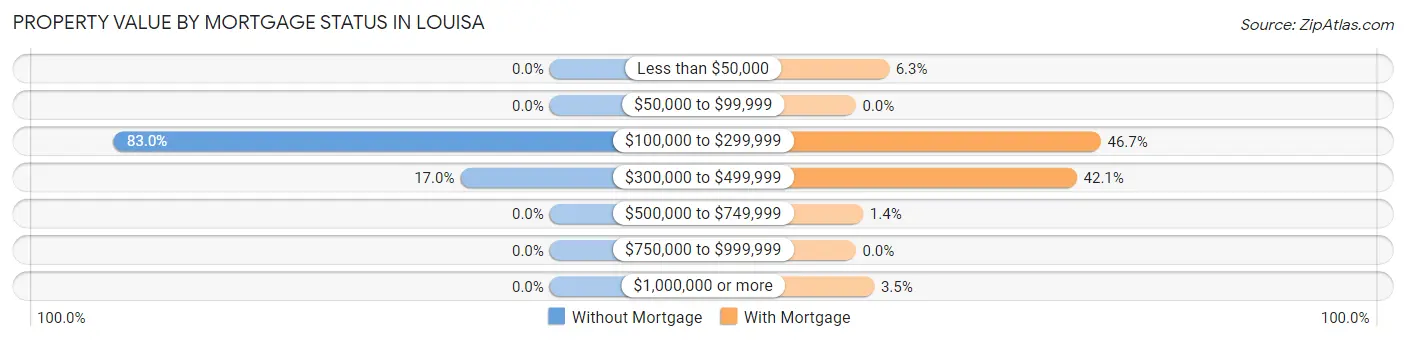
| Property Value | Without Mortgage | With Mortgage |
| Less than $50,000 | 0 (0.0%) | 18 (6.3%) |
| $50,000 to $99,999 | 0 (0.0%) | 0 (0.0%) |
| $100,000 to $299,999 | 39 (83.0%) | 133 (46.7%) |
| $300,000 to $499,999 | 8 (17.0%) | 120 (42.1%) |
| $500,000 to $749,999 | 0 (0.0%) | 4 (1.4%) |
| $750,000 to $999,999 | 0 (0.0%) | 0 (0.0%) |
| $1,000,000 or more | 0 (0.0%) | 10 (3.5%) |
| Total | 47 (100.0%) | 285 (100.0%) |
Household Income by Mortgage Status in Louisa
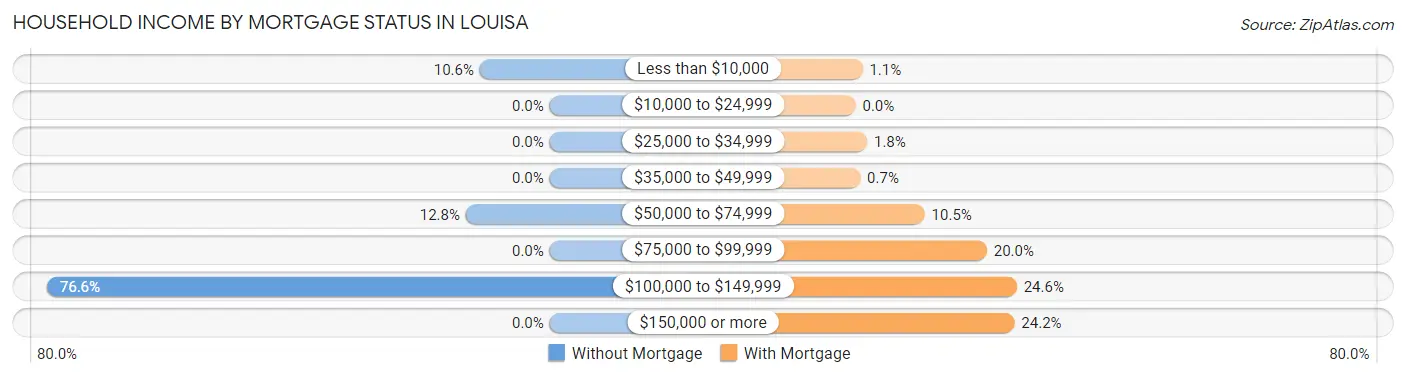
| Household Income | Without Mortgage | With Mortgage |
| Less than $10,000 | 5 (10.6%) | 3 (1.1%) |
| $10,000 to $24,999 | 0 (0.0%) | 0 (0.0%) |
| $25,000 to $34,999 | 0 (0.0%) | 5 (1.8%) |
| $35,000 to $49,999 | 0 (0.0%) | 2 (0.7%) |
| $50,000 to $74,999 | 6 (12.8%) | 30 (10.5%) |
| $75,000 to $99,999 | 0 (0.0%) | 57 (20.0%) |
| $100,000 to $149,999 | 36 (76.6%) | 70 (24.6%) |
| $150,000 or more | 0 (0.0%) | 69 (24.2%) |
| Total | 47 (100.0%) | 285 (100.0%) |
Property Value to Household Income Ratio in Louisa
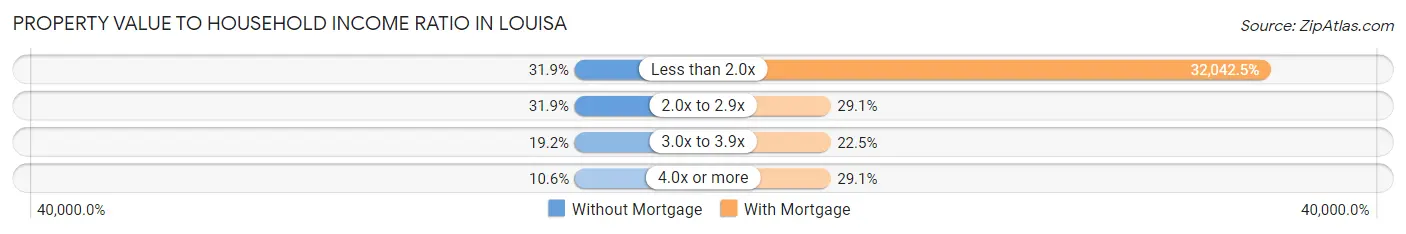
| Value-to-Income Ratio | Without Mortgage | With Mortgage |
| Less than 2.0x | 15 (31.9%) | 91,321 (32,042.5%) |
| 2.0x to 2.9x | 15 (31.9%) | 83 (29.1%) |
| 3.0x to 3.9x | 9 (19.2%) | 64 (22.5%) |
| 4.0x or more | 5 (10.6%) | 83 (29.1%) |
| Total | 47 (100.0%) | 285 (100.0%) |
Real Estate Taxes by Mortgage Status in Louisa
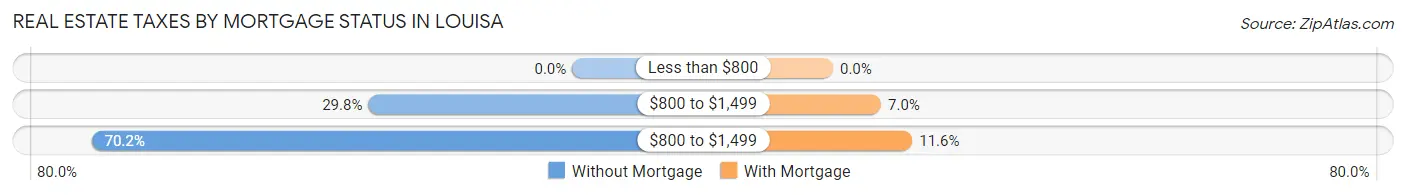
| Property Taxes | Without Mortgage | With Mortgage |
| Less than $800 | 0 (0.0%) | 0 (0.0%) |
| $800 to $1,499 | 14 (29.8%) | 20 (7.0%) |
| $800 to $1,499 | 33 (70.2%) | 33 (11.6%) |
| Total | 47 (100.0%) | 285 (100.0%) |
Health & Disability in Louisa
Health Insurance Coverage by Age in Louisa
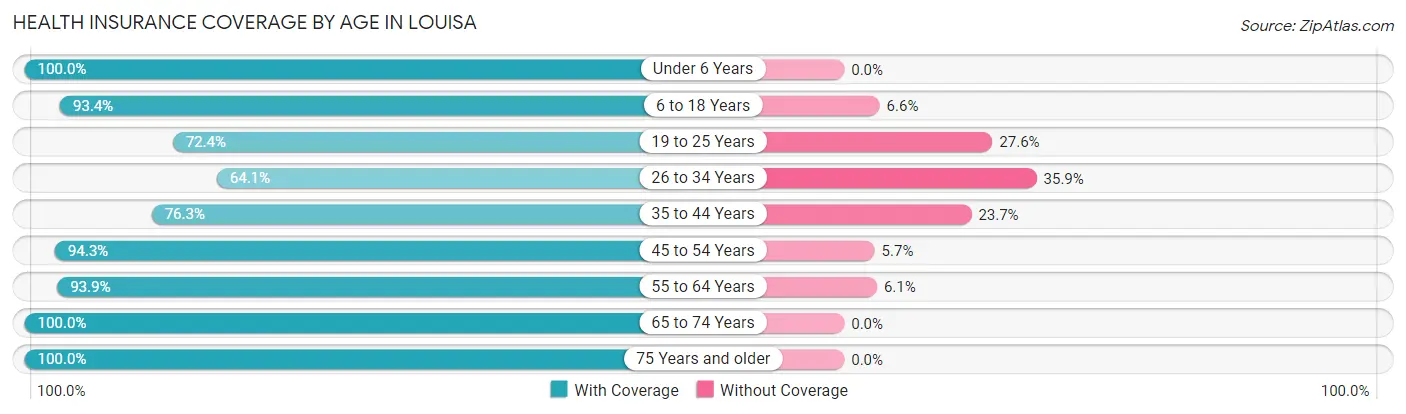
| Age Bracket | With Coverage | Without Coverage |
| Under 6 Years | 112 (100.0%) | 0 (0.0%) |
| 6 to 18 Years | 397 (93.4%) | 28 (6.6%) |
| 19 to 25 Years | 76 (72.4%) | 29 (27.6%) |
| 26 to 34 Years | 161 (64.1%) | 90 (35.9%) |
| 35 to 44 Years | 267 (76.3%) | 83 (23.7%) |
| 45 to 54 Years | 200 (94.3%) | 12 (5.7%) |
| 55 to 64 Years | 185 (93.9%) | 12 (6.1%) |
| 65 to 74 Years | 219 (100.0%) | 0 (0.0%) |
| 75 Years and older | 203 (100.0%) | 0 (0.0%) |
| Total | 1,820 (87.7%) | 254 (12.2%) |
Health Insurance Coverage by Citizenship Status in Louisa
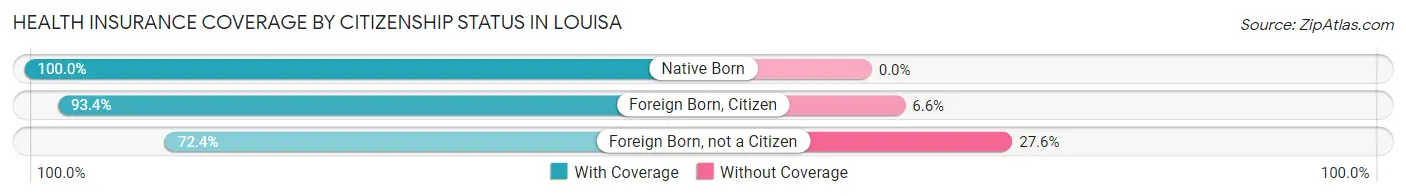
| Citizenship Status | With Coverage | Without Coverage |
| Native Born | 112 (100.0%) | 0 (0.0%) |
| Foreign Born, Citizen | 397 (93.4%) | 28 (6.6%) |
| Foreign Born, not a Citizen | 76 (72.4%) | 29 (27.6%) |
Health Insurance Coverage by Household Income in Louisa
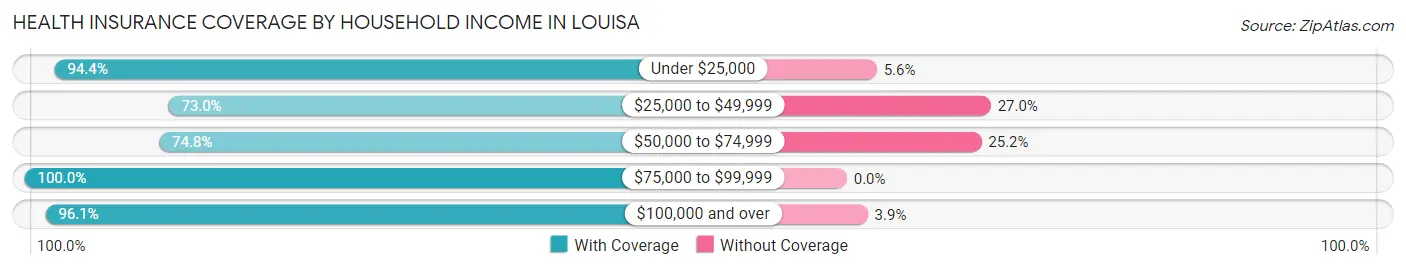
| Household Income | With Coverage | Without Coverage |
| Under $25,000 | 286 (94.4%) | 17 (5.6%) |
| $25,000 to $49,999 | 233 (73.0%) | 86 (27.0%) |
| $50,000 to $74,999 | 353 (74.8%) | 119 (25.2%) |
| $75,000 to $99,999 | 297 (100.0%) | 0 (0.0%) |
| $100,000 and over | 639 (96.1%) | 26 (3.9%) |
Public vs Private Health Insurance Coverage by Age in Louisa
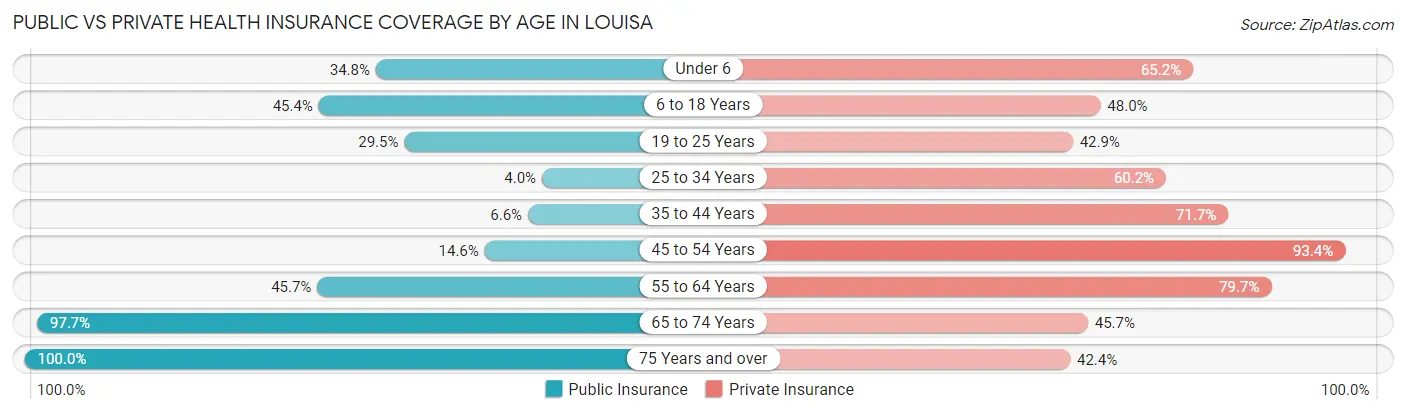
| Age Bracket | Public Insurance | Private Insurance |
| Under 6 | 39 (34.8%) | 73 (65.2%) |
| 6 to 18 Years | 193 (45.4%) | 204 (48.0%) |
| 19 to 25 Years | 31 (29.5%) | 45 (42.9%) |
| 25 to 34 Years | 10 (4.0%) | 151 (60.2%) |
| 35 to 44 Years | 23 (6.6%) | 251 (71.7%) |
| 45 to 54 Years | 31 (14.6%) | 198 (93.4%) |
| 55 to 64 Years | 90 (45.7%) | 157 (79.7%) |
| 65 to 74 Years | 214 (97.7%) | 100 (45.7%) |
| 75 Years and over | 203 (100.0%) | 86 (42.4%) |
| Total | 834 (40.2%) | 1,265 (61.0%) |
Disability Status by Sex by Age in Louisa
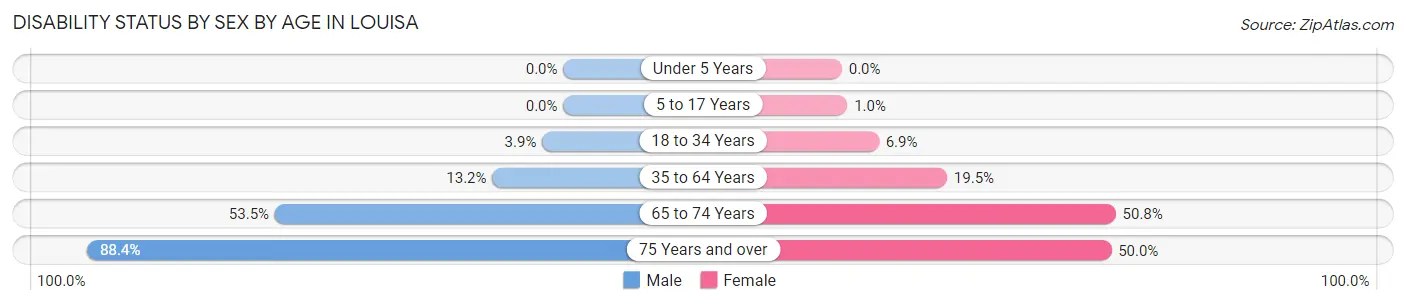
| Age Bracket | Male | Female |
| Under 5 Years | 0 (0.0%) | 0 (0.0%) |
| 5 to 17 Years | 0 (0.0%) | 2 (1.0%) |
| 18 to 34 Years | 6 (3.9%) | 15 (6.9%) |
| 35 to 64 Years | 46 (13.2%) | 80 (19.5%) |
| 65 to 74 Years | 53 (53.5%) | 61 (50.8%) |
| 75 Years and over | 61 (88.4%) | 67 (50.0%) |
Disability Class by Sex by Age in Louisa
Disability Class: Hearing Difficulty
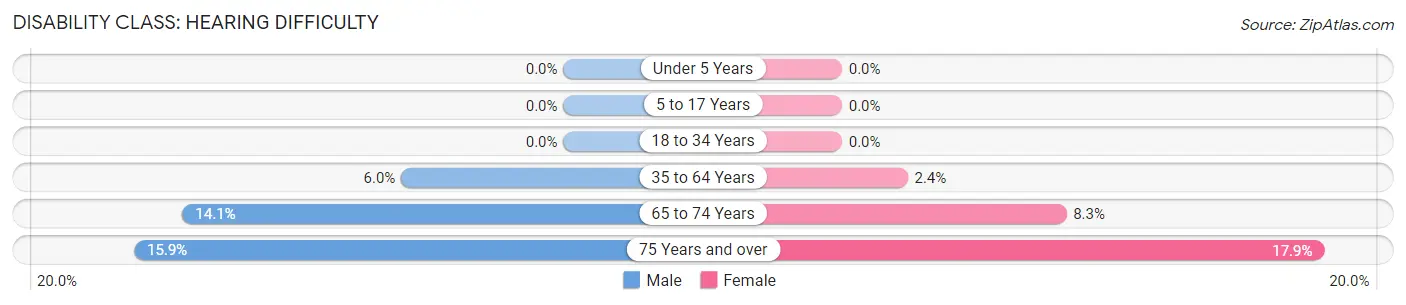
| Age Bracket | Male | Female |
| Under 5 Years | 0 (0.0%) | 0 (0.0%) |
| 5 to 17 Years | 0 (0.0%) | 0 (0.0%) |
| 18 to 34 Years | 0 (0.0%) | 0 (0.0%) |
| 35 to 64 Years | 21 (6.0%) | 10 (2.4%) |
| 65 to 74 Years | 14 (14.1%) | 10 (8.3%) |
| 75 Years and over | 11 (15.9%) | 24 (17.9%) |
Disability Class: Vision Difficulty
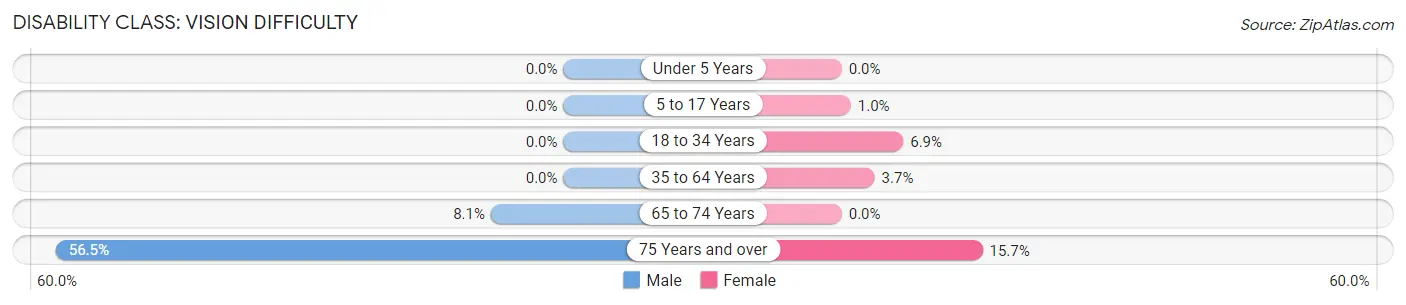
| Age Bracket | Male | Female |
| Under 5 Years | 0 (0.0%) | 0 (0.0%) |
| 5 to 17 Years | 0 (0.0%) | 2 (1.0%) |
| 18 to 34 Years | 0 (0.0%) | 15 (6.9%) |
| 35 to 64 Years | 0 (0.0%) | 15 (3.7%) |
| 65 to 74 Years | 8 (8.1%) | 0 (0.0%) |
| 75 Years and over | 39 (56.5%) | 21 (15.7%) |
Disability Class: Cognitive Difficulty
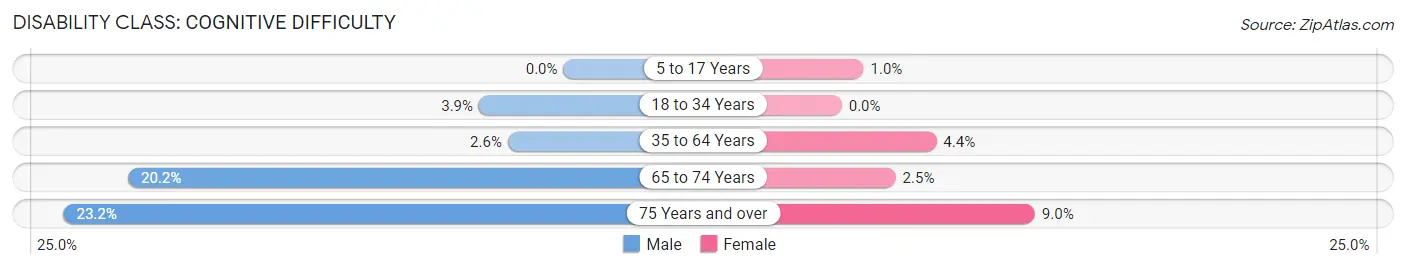
| Age Bracket | Male | Female |
| 5 to 17 Years | 0 (0.0%) | 2 (1.0%) |
| 18 to 34 Years | 6 (3.9%) | 0 (0.0%) |
| 35 to 64 Years | 9 (2.6%) | 18 (4.4%) |
| 65 to 74 Years | 20 (20.2%) | 3 (2.5%) |
| 75 Years and over | 16 (23.2%) | 12 (9.0%) |
Disability Class: Ambulatory Difficulty
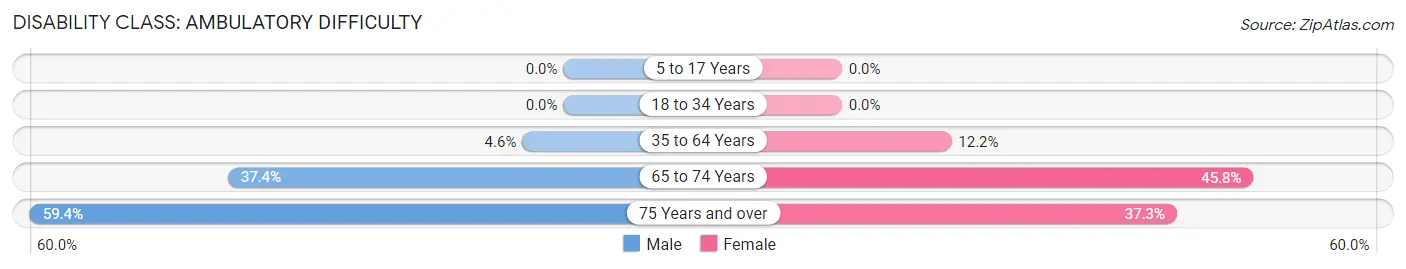
| Age Bracket | Male | Female |
| 5 to 17 Years | 0 (0.0%) | 0 (0.0%) |
| 18 to 34 Years | 0 (0.0%) | 0 (0.0%) |
| 35 to 64 Years | 16 (4.6%) | 50 (12.2%) |
| 65 to 74 Years | 37 (37.4%) | 55 (45.8%) |
| 75 Years and over | 41 (59.4%) | 50 (37.3%) |
Disability Class: Self-Care Difficulty
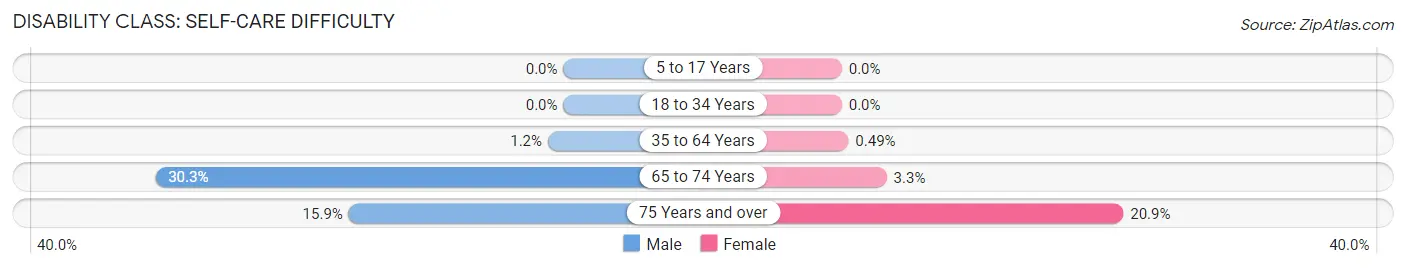
| Age Bracket | Male | Female |
| 5 to 17 Years | 0 (0.0%) | 0 (0.0%) |
| 18 to 34 Years | 0 (0.0%) | 0 (0.0%) |
| 35 to 64 Years | 4 (1.1%) | 2 (0.5%) |
| 65 to 74 Years | 30 (30.3%) | 4 (3.3%) |
| 75 Years and over | 11 (15.9%) | 28 (20.9%) |
Technology Access in Louisa
Computing Device Access in Louisa
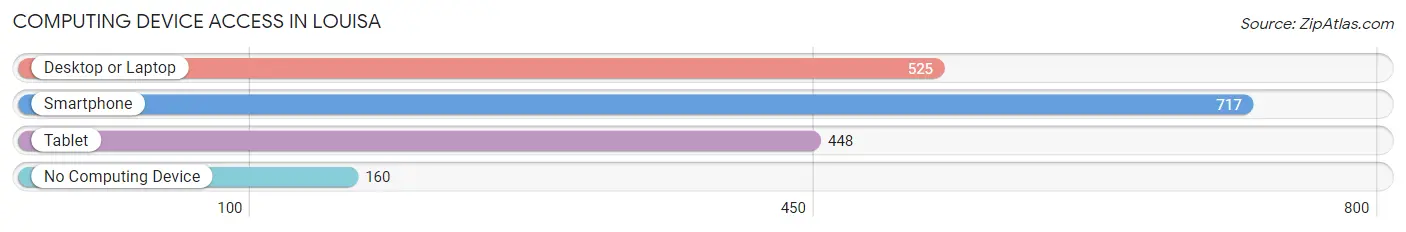
| Device Type | # Households | % Households |
| Desktop or Laptop | 525 | 57.9% |
| Smartphone | 717 | 79.0% |
| Tablet | 448 | 49.4% |
| No Computing Device | 160 | 17.6% |
| Total | 907 | 100.0% |
Internet Access in Louisa
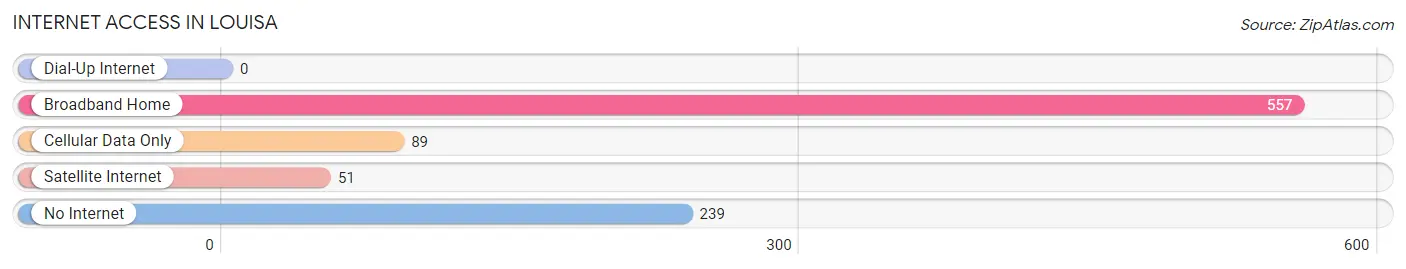
| Internet Type | # Households | % Households |
| Dial-Up Internet | 0 | 0.0% |
| Broadband Home | 557 | 61.4% |
| Cellular Data Only | 89 | 9.8% |
| Satellite Internet | 51 | 5.6% |
| No Internet | 239 | 26.4% |
| Total | 907 | 100.0% |
Louisa Summary
Louisa, Virginia is a small town located in the central part of the state, about 40 miles northwest of Richmond. It is the county seat of Louisa County and is part of the Charlottesville Metropolitan Statistical Area. The town has a population of about 2,000 people and is known for its historic buildings, quaint downtown, and rural charm.
Geography
Louisa is located in the Piedmont region of Virginia, in the foothills of the Blue Ridge Mountains. The town is situated on the north bank of the North Anna River, which flows through the center of town. The town is surrounded by rolling hills and farmland, and is located about 40 miles northwest of Richmond.
The climate in Louisa is humid subtropical, with hot, humid summers and mild winters. The average annual temperature is around 60 degrees Fahrenheit, and the average annual precipitation is around 40 inches.
Economy
The economy of Louisa is largely based on agriculture and tourism. The town is home to several farms, which produce a variety of crops, including corn, soybeans, wheat, and hay. The town is also home to several wineries, which produce a variety of wines.
Tourism is also an important part of the local economy. The town is home to several historic sites, including the Louisa County Courthouse, the Louisa County Jail, and the Louisa County Museum. The town also hosts several annual festivals, including the Louisa County Fair and the Louisa County Apple Festival.
Demographics
As of the 2010 census, the population of Louisa was 2,058. The racial makeup of the town was 79.3% White, 17.2% African American, 0.7% Native American, 0.4% Asian, 0.1% Pacific Islander, and 2.3% from other races. The median household income was $37,917, and the median family income was $45,938.
The town is served by the Louisa County Public Schools system, which includes three elementary schools, one middle school, and one high school. The town is also home to several private schools, including the Louisa Christian Academy and the Louisa Montessori School.
Conclusion
Louisa, Virginia is a small town with a rich history and a unique rural charm. The town is home to several farms and wineries, and is a popular tourist destination. The town has a diverse population and a strong economy, and is served by the Louisa County Public Schools system. Louisa is a great place to live, work, and visit.
Common Questions
What is Per Capita Income in Louisa?
Per Capita income in Louisa is $34,315.
What is the Median Family Income in Louisa?
Median Family Income in Louisa is $71,667.
What is the Median Household income in Louisa?
Median Household Income in Louisa is $51,989.
What is Income or Wage Gap in Louisa?
Income or Wage Gap in Louisa is 6.2%.
Women in Louisa earn 93.8 cents for every dollar earned by a man.
What is Family Income Deficit in Louisa?
Family Income Deficit in Louisa is $6,106.
Families that are below poverty line in Louisa earn $6,106 less on average than the poverty threshold level.
What is Inequality or Gini Index in Louisa?
Inequality or Gini Index in Louisa is 0.53.
What is the Total Population of Louisa?
Total Population of Louisa is 2,173.
What is the Total Male Population of Louisa?
Total Male Population of Louisa is 937.
What is the Total Female Population of Louisa?
Total Female Population of Louisa is 1,236.
What is the Ratio of Males per 100 Females in Louisa?
There are 75.81 Males per 100 Females in Louisa.
What is the Ratio of Females per 100 Males in Louisa?
There are 131.91 Females per 100 Males in Louisa.
What is the Median Population Age in Louisa?
Median Population Age in Louisa is 41.0 Years.
What is the Average Family Size in Louisa
Average Family Size in Louisa is 3.2 People.
What is the Average Household Size in Louisa
Average Household Size in Louisa is 2.3 People.
How Large is the Labor Force in Louisa?
There are 930 People in the Labor Forcein in Louisa.
What is the Percentage of People in the Labor Force in Louisa?
54.6% of People are in the Labor Force in Louisa.
What is the Unemployment Rate in Louisa?
Unemployment Rate in Louisa is 4.8%.