Lake Holiday, VA Map & Demographics
Lake Holiday Map
Lake Holiday Overview
$48,724
PER CAPITA INCOME
$121,607
AVG FAMILY INCOME
$103,313
AVG HOUSEHOLD INCOME
2.6%
WAGE / INCOME GAP [ % ]
97.4¢/ $1
WAGE / INCOME GAP [ $ ]
0.35
INEQUALITY / GINI INDEX
2,233
TOTAL POPULATION
1,006
MALE POPULATION
1,227
FEMALE POPULATION
81.99
MALES / 100 FEMALES
121.97
FEMALES / 100 MALES
51.6
MEDIAN AGE
2.9
AVG FAMILY SIZE
2.7
AVG HOUSEHOLD SIZE
1,053
LABOR FORCE [ PEOPLE ]
56.4%
PERCENT IN LABOR FORCE
1.8%
UNEMPLOYMENT RATE
Income in Lake Holiday
Income Overview in Lake Holiday
Per Capita Income in Lake Holiday is $48,724, while median incomes of families and households are $121,607 and $103,313 respectively.
| Characteristic | Number | Measure |
| Per Capita Income | 2,233 | $48,724 |
| Median Family Income | 708 | $121,607 |
| Mean Family Income | 708 | $135,511 |
| Median Household Income | 835 | $103,313 |
| Mean Household Income | 835 | $128,383 |
| Income Deficit | 708 | $0 |
| Wage / Income Gap (%) | 2,233 | 2.59% |
| Wage / Income Gap ($) | 2,233 | 97.41¢ per $1 |
| Gini / Inequality Index | 2,233 | 0.35 |
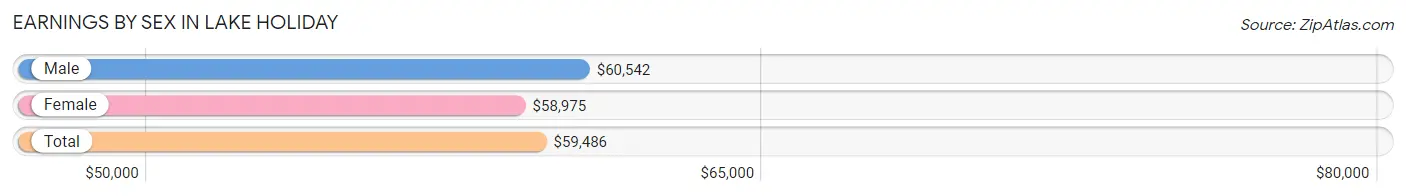
Earnings by Sex in Lake Holiday
Average Earnings in Lake Holiday are $59,486, $60,542 for men and $58,975 for women, a difference of 2.6%.
| Sex | Number | Average Earnings |
| Male | 637 (59.7%) | $60,542 |
| Female | 430 (40.3%) | $58,975 |
| Total | 1,067 (100.0%) | $59,486 |
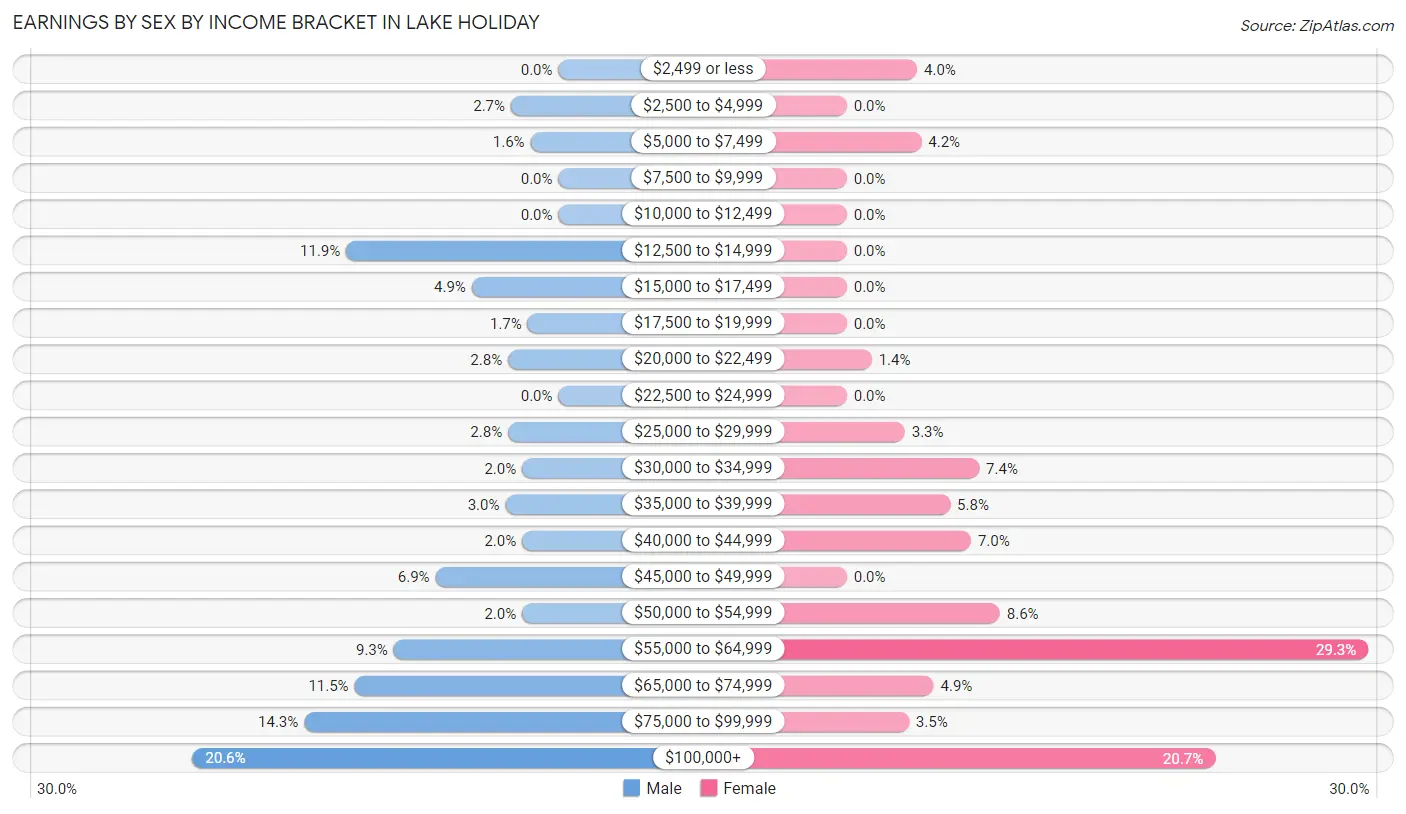
Earnings by Sex by Income Bracket in Lake Holiday
The most common earnings brackets in Lake Holiday are $100,000+ for men (131 | 20.6%) and $55,000 to $64,999 for women (126 | 29.3%).
| Income | Male | Female |
| $2,499 or less | 0 (0.0%) | 17 (4.0%) |
| $2,500 to $4,999 | 17 (2.7%) | 0 (0.0%) |
| $5,000 to $7,499 | 10 (1.6%) | 18 (4.2%) |
| $7,500 to $9,999 | 0 (0.0%) | 0 (0.0%) |
| $10,000 to $12,499 | 0 (0.0%) | 0 (0.0%) |
| $12,500 to $14,999 | 76 (11.9%) | 0 (0.0%) |
| $15,000 to $17,499 | 31 (4.9%) | 0 (0.0%) |
| $17,500 to $19,999 | 11 (1.7%) | 0 (0.0%) |
| $20,000 to $22,499 | 18 (2.8%) | 6 (1.4%) |
| $22,500 to $24,999 | 0 (0.0%) | 0 (0.0%) |
| $25,000 to $29,999 | 18 (2.8%) | 14 (3.3%) |
| $30,000 to $34,999 | 13 (2.0%) | 32 (7.4%) |
| $35,000 to $39,999 | 19 (3.0%) | 25 (5.8%) |
| $40,000 to $44,999 | 13 (2.0%) | 30 (7.0%) |
| $45,000 to $49,999 | 44 (6.9%) | 0 (0.0%) |
| $50,000 to $54,999 | 13 (2.0%) | 37 (8.6%) |
| $55,000 to $64,999 | 59 (9.3%) | 126 (29.3%) |
| $65,000 to $74,999 | 73 (11.5%) | 21 (4.9%) |
| $75,000 to $99,999 | 91 (14.3%) | 15 (3.5%) |
| $100,000+ | 131 (20.6%) | 89 (20.7%) |
| Total | 637 (100.0%) | 430 (100.0%) |
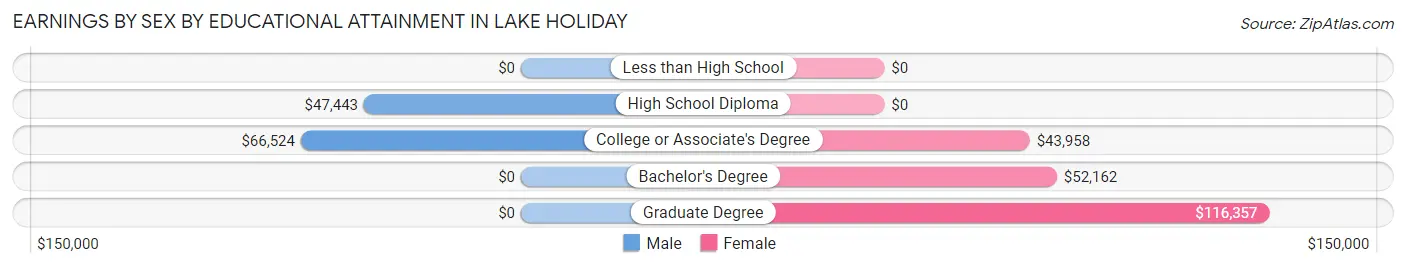
Earnings by Sex by Educational Attainment in Lake Holiday
Average earnings in Lake Holiday are $67,012 for men and $60,801 for women, a difference of 9.3%. Men with an educational attainment of college or associate's degree enjoy the highest average annual earnings of $66,524, while those with high school diploma education earn the least with $47,443. Women with an educational attainment of graduate degree earn the most with the average annual earnings of $116,357, while those with college or associate's degree education have the smallest earnings of $43,958.
| Educational Attainment | Male Income | Female Income |
| Less than High School | - | - |
| High School Diploma | $47,443 | $0 |
| College or Associate's Degree | $66,524 | $43,958 |
| Bachelor's Degree | - | - |
| Graduate Degree | - | - |
| Total | $67,012 | $60,801 |
Family Income in Lake Holiday
Family Income Brackets in Lake Holiday
According to the Lake Holiday family income data, there are 187 families falling into the $150,000 to $199,999 income range, which is the most common income bracket and makes up 26.4% of all families.
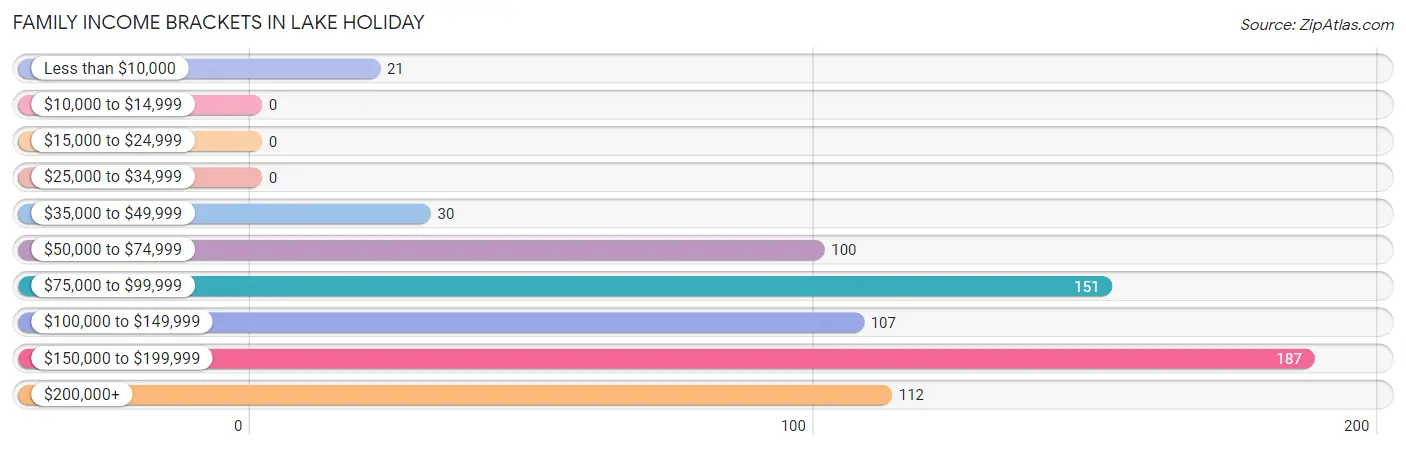
| Income Bracket | # Families | % Families |
| Less than $10,000 | 21 | 3.0% |
| $10,000 to $14,999 | 0 | 0.0% |
| $15,000 to $24,999 | 0 | 0.0% |
| $25,000 to $34,999 | 0 | 0.0% |
| $35,000 to $49,999 | 30 | 4.2% |
| $50,000 to $74,999 | 100 | 14.1% |
| $75,000 to $99,999 | 151 | 21.3% |
| $100,000 to $149,999 | 107 | 15.1% |
| $150,000 to $199,999 | 187 | 26.4% |
| $200,000+ | 112 | 15.8% |
Family Income by Famaliy Size in Lake Holiday
2-person families (391 | 55.2%) account for the highest median family income in Lake Holiday with $131,250 per family, while 2-person families (391 | 55.2%) have the highest median income of $65,625 per family member.
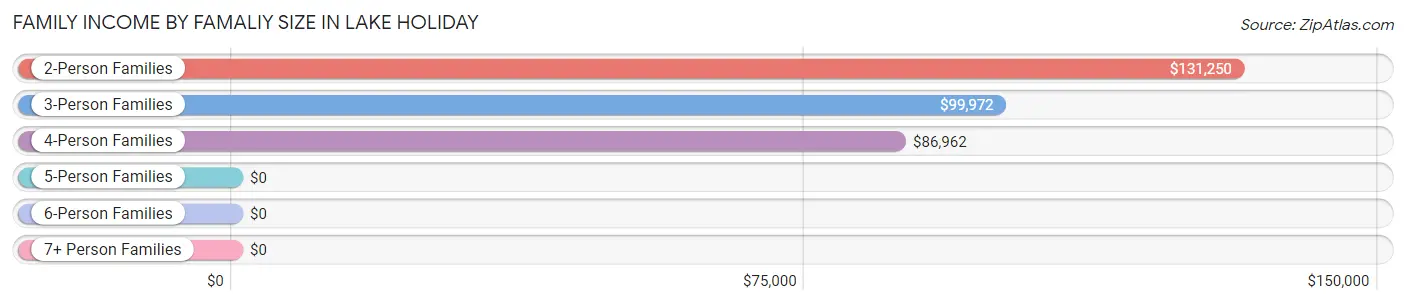
| Income Bracket | # Families | Median Income |
| 2-Person Families | 391 (55.2%) | $131,250 |
| 3-Person Families | 125 (17.7%) | $99,972 |
| 4-Person Families | 113 (16.0%) | $86,962 |
| 5-Person Families | 70 (9.9%) | $0 |
| 6-Person Families | 0 (0.0%) | $0 |
| 7+ Person Families | 9 (1.3%) | $0 |
| Total | 708 (100.0%) | $121,607 |
Family Income by Number of Earners in Lake Holiday
The median family income in Lake Holiday is $121,607, with families comprising 2 earners (241) having the highest median family income of $183,384, while families with no earners (236) have the lowest median family income of $86,667, accounting for 34.0% and 33.3% of families, respectively.
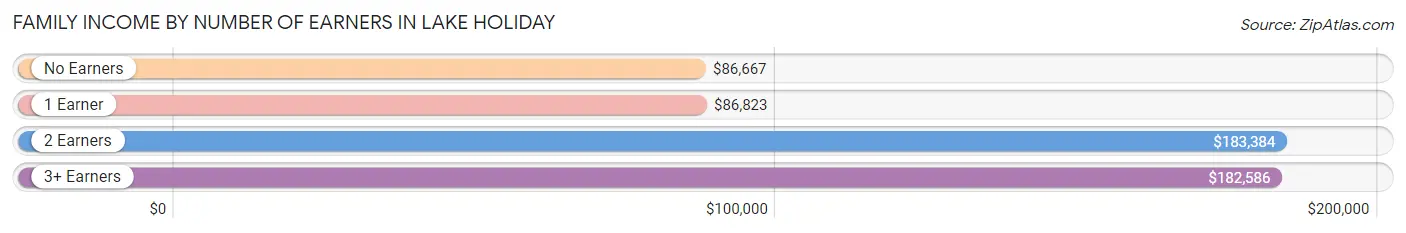
| Number of Earners | # Families | Median Income |
| No Earners | 236 (33.3%) | $86,667 |
| 1 Earner | 139 (19.6%) | $86,823 |
| 2 Earners | 241 (34.0%) | $183,384 |
| 3+ Earners | 92 (13.0%) | $182,586 |
| Total | 708 (100.0%) | $121,607 |
Household Income in Lake Holiday
Household Income Brackets in Lake Holiday
With 200 households falling in the category, the $150,000 to $199,999 income range is the most frequent in Lake Holiday, accounting for 23.9% of all households.
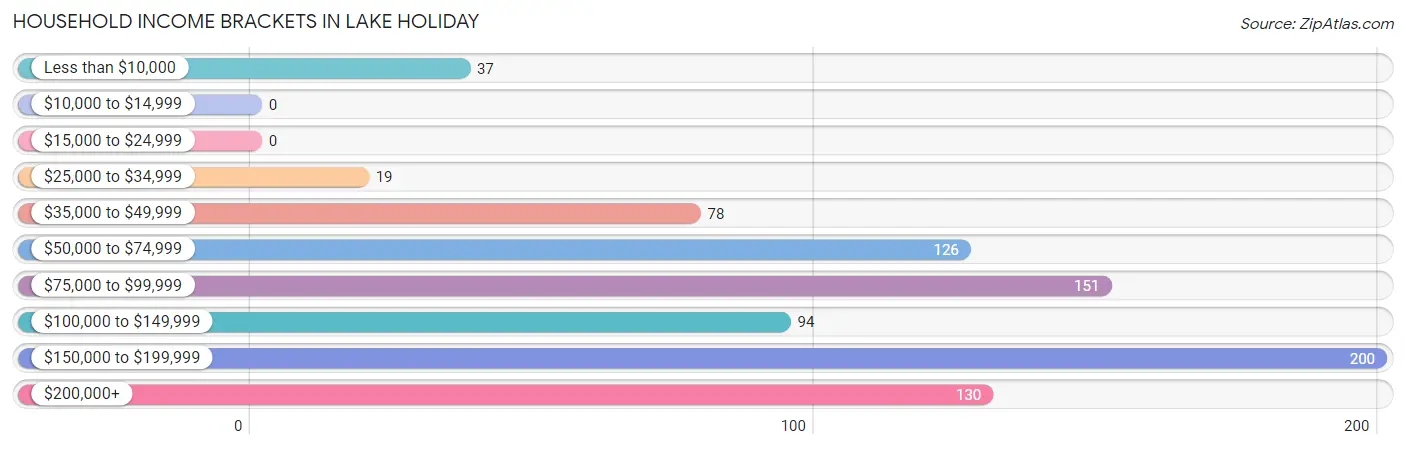
| Income Bracket | # Households | % Households |
| Less than $10,000 | 37 | 4.4% |
| $10,000 to $14,999 | 0 | 0.0% |
| $15,000 to $24,999 | 0 | 0.0% |
| $25,000 to $34,999 | 19 | 2.3% |
| $35,000 to $49,999 | 78 | 9.3% |
| $50,000 to $74,999 | 126 | 15.1% |
| $75,000 to $99,999 | 151 | 18.1% |
| $100,000 to $149,999 | 94 | 11.3% |
| $150,000 to $199,999 | 200 | 24.0% |
| $200,000+ | 130 | 15.6% |
Household Income by Householder Age in Lake Holiday
The median household income in Lake Holiday is $103,313, with the highest median household income of $177,308 found in the 25 to 44 years age bracket for the primary householder. A total of 34 households (4.1%) fall into this category.
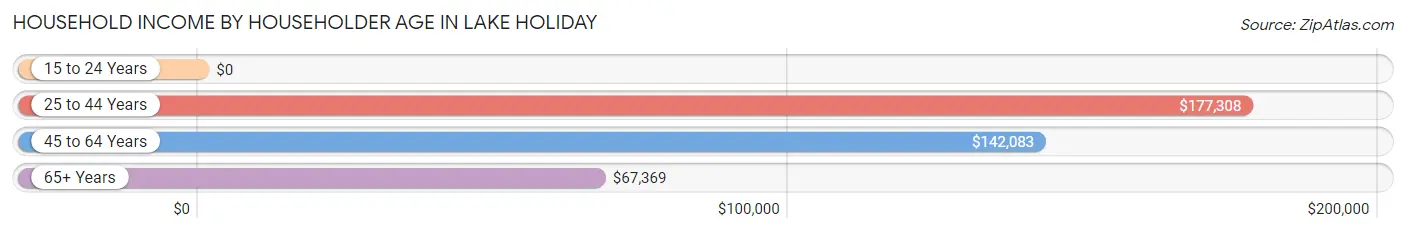
| Income Bracket | # Households | Median Income |
| 15 to 24 Years | 0 (0.0%) | $0 |
| 25 to 44 Years | 34 (4.1%) | $177,308 |
| 45 to 64 Years | 430 (51.5%) | $142,083 |
| 65+ Years | 371 (44.4%) | $67,369 |
| Total | 835 (100.0%) | $103,313 |
Poverty in Lake Holiday
Income Below Poverty by Sex and Age in Lake Holiday
With 3.4% poverty level for males and 1.7% for females among the residents of Lake Holiday, 65 to 74 year old males and 65 to 74 year old females are the most vulnerable to poverty, with 34 males (14.6%) and 21 females (10.1%) in their respective age groups living below the poverty level.
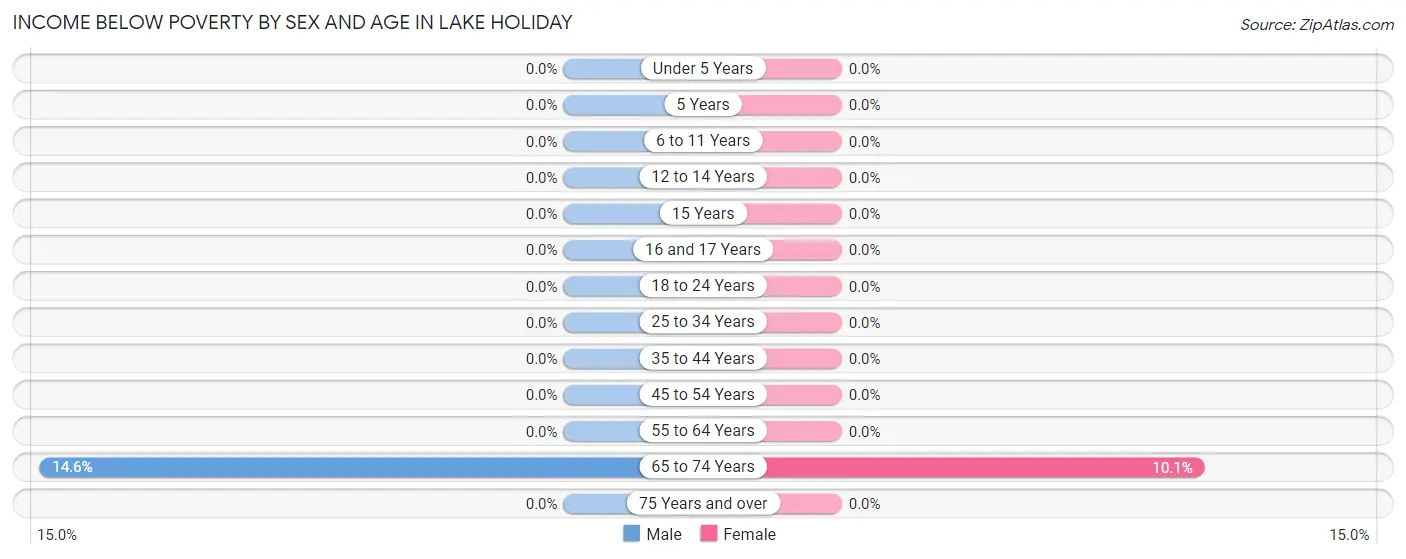
| Age Bracket | Male | Female |
| Under 5 Years | 0 (0.0%) | 0 (0.0%) |
| 5 Years | 0 (0.0%) | 0 (0.0%) |
| 6 to 11 Years | 0 (0.0%) | 0 (0.0%) |
| 12 to 14 Years | 0 (0.0%) | 0 (0.0%) |
| 15 Years | 0 (0.0%) | 0 (0.0%) |
| 16 and 17 Years | 0 (0.0%) | 0 (0.0%) |
| 18 to 24 Years | 0 (0.0%) | 0 (0.0%) |
| 25 to 34 Years | 0 (0.0%) | 0 (0.0%) |
| 35 to 44 Years | 0 (0.0%) | 0 (0.0%) |
| 45 to 54 Years | 0 (0.0%) | 0 (0.0%) |
| 55 to 64 Years | 0 (0.0%) | 0 (0.0%) |
| 65 to 74 Years | 34 (14.6%) | 21 (10.1%) |
| 75 Years and over | 0 (0.0%) | 0 (0.0%) |
| Total | 34 (3.4%) | 21 (1.7%) |
Income Above Poverty by Sex and Age in Lake Holiday
According to the poverty statistics in Lake Holiday, males aged under 5 years and females aged under 5 years are the age groups that are most secure financially, with 100.0% of males and 100.0% of females in these age groups living above the poverty line.
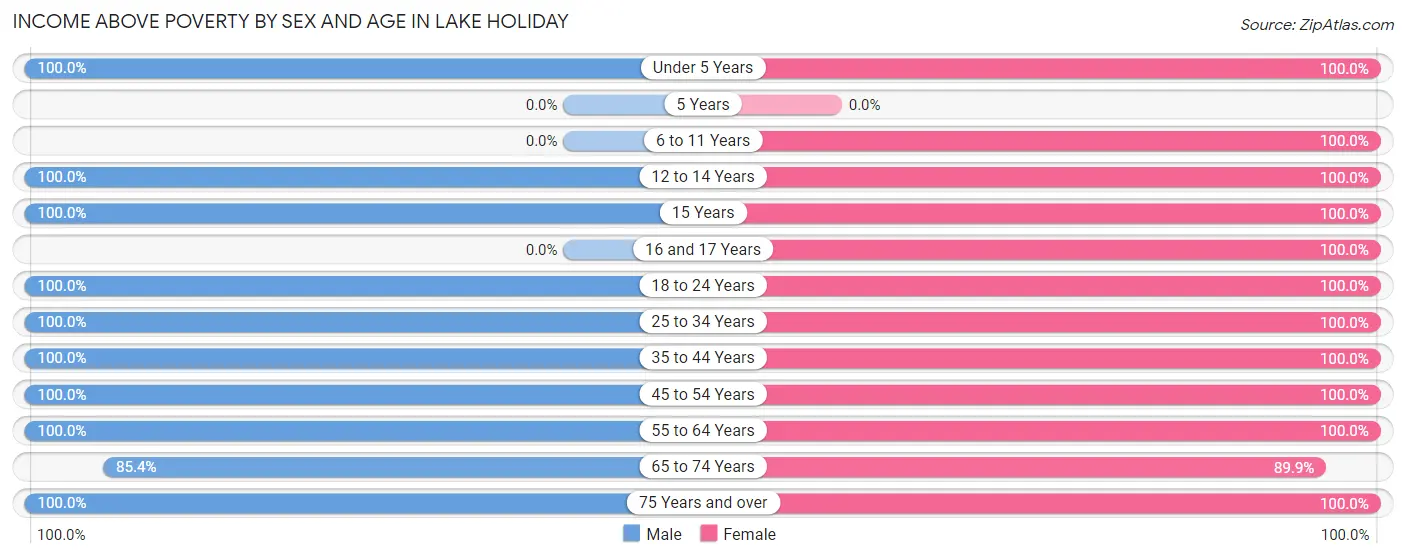
| Age Bracket | Male | Female |
| Under 5 Years | 21 (100.0%) | 21 (100.0%) |
| 5 Years | 0 (0.0%) | 0 (0.0%) |
| 6 to 11 Years | 0 (0.0%) | 8 (100.0%) |
| 12 to 14 Years | 55 (100.0%) | 178 (100.0%) |
| 15 Years | 9 (100.0%) | 74 (100.0%) |
| 16 and 17 Years | 0 (0.0%) | 78 (100.0%) |
| 18 to 24 Years | 113 (100.0%) | 74 (100.0%) |
| 25 to 34 Years | 22 (100.0%) | 54 (100.0%) |
| 35 to 44 Years | 49 (100.0%) | 91 (100.0%) |
| 45 to 54 Years | 323 (100.0%) | 179 (100.0%) |
| 55 to 64 Years | 103 (100.0%) | 162 (100.0%) |
| 65 to 74 Years | 199 (85.4%) | 187 (89.9%) |
| 75 Years and over | 78 (100.0%) | 100 (100.0%) |
| Total | 972 (96.6%) | 1,206 (98.3%) |
Income Below Poverty Among Married-Couple Families in Lake Holiday
The poverty statistics for married-couple families in Lake Holiday show that 3.1% or 21 of the total 671 families live below the poverty line. Families with no children have the highest poverty rate of 4.6%, comprising of 21 families. On the other hand, families with 1 or 2 children have the lowest poverty rate of 0.0%, which includes 0 families.
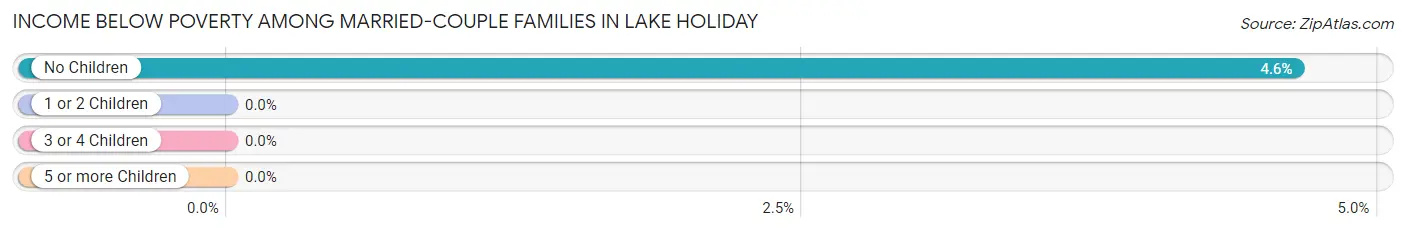
| Children | Above Poverty | Below Poverty |
| No Children | 432 (95.4%) | 21 (4.6%) |
| 1 or 2 Children | 177 (100.0%) | 0 (0.0%) |
| 3 or 4 Children | 41 (100.0%) | 0 (0.0%) |
| 5 or more Children | 0 (0.0%) | 0 (0.0%) |
| Total | 650 (96.9%) | 21 (3.1%) |
Income Below Poverty Among Single-Parent Households in Lake Holiday
| Children | Single Father | Single Mother |
| No Children | 0 (0.0%) | 0 (0.0%) |
| 1 or 2 Children | 0 (0.0%) | 0 (0.0%) |
| 3 or 4 Children | 0 (0.0%) | 0 (0.0%) |
| 5 or more Children | 0 (0.0%) | 0 (0.0%) |
| Total | 0 (0.0%) | 0 (0.0%) |
Income Below Poverty Among Married-Couple vs Single-Parent Households in Lake Holiday
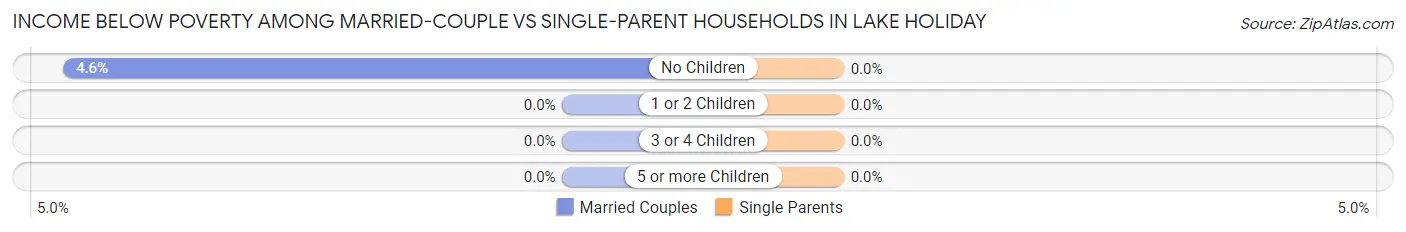
| Children | Married-Couple Families | Single-Parent Households |
| No Children | 21 (4.6%) | 0 (0.0%) |
| 1 or 2 Children | 0 (0.0%) | 0 (0.0%) |
| 3 or 4 Children | 0 (0.0%) | 0 (0.0%) |
| 5 or more Children | 0 (0.0%) | 0 (0.0%) |
| Total | 21 (3.1%) | 0 (0.0%) |
Race in Lake Holiday
The most populous races in Lake Holiday are White / Caucasian (2,123 | 95.1%), Black / African American (66 | 3.0%), and Two or more Races (44 | 2.0%).
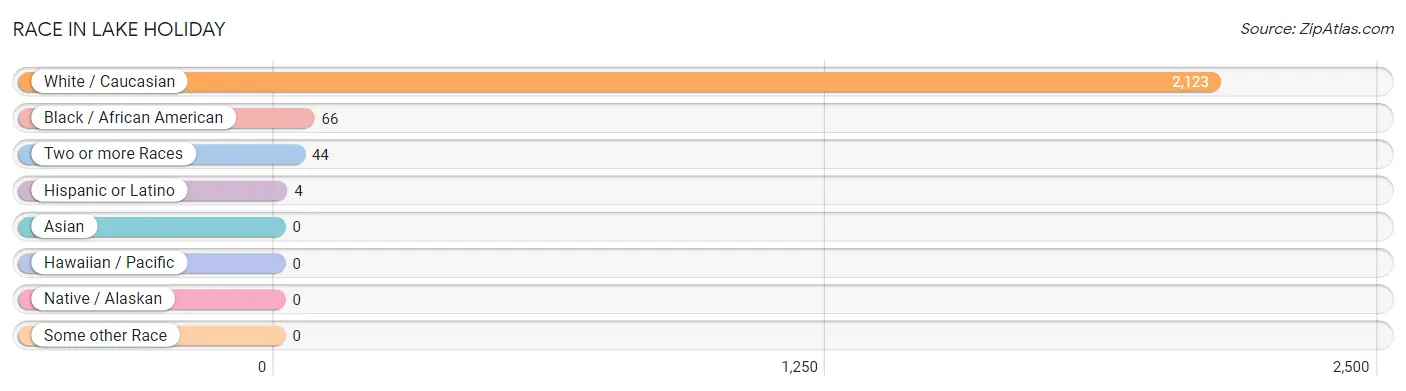
| Race | # Population | % Population |
| Asian | 0 | 0.0% |
| Black / African American | 66 | 3.0% |
| Hawaiian / Pacific | 0 | 0.0% |
| Hispanic or Latino | 4 | 0.2% |
| Native / Alaskan | 0 | 0.0% |
| White / Caucasian | 2,123 | 95.1% |
| Two or more Races | 44 | 2.0% |
| Some other Race | 0 | 0.0% |
| Total | 2,233 | 100.0% |
Ancestry in Lake Holiday
The most populous ancestries reported in Lake Holiday are German (385 | 17.2%), Irish (355 | 15.9%), American (335 | 15.0%), English (176 | 7.9%), and Norwegian (112 | 5.0%), together accounting for 61.0% of all Lake Holiday residents.
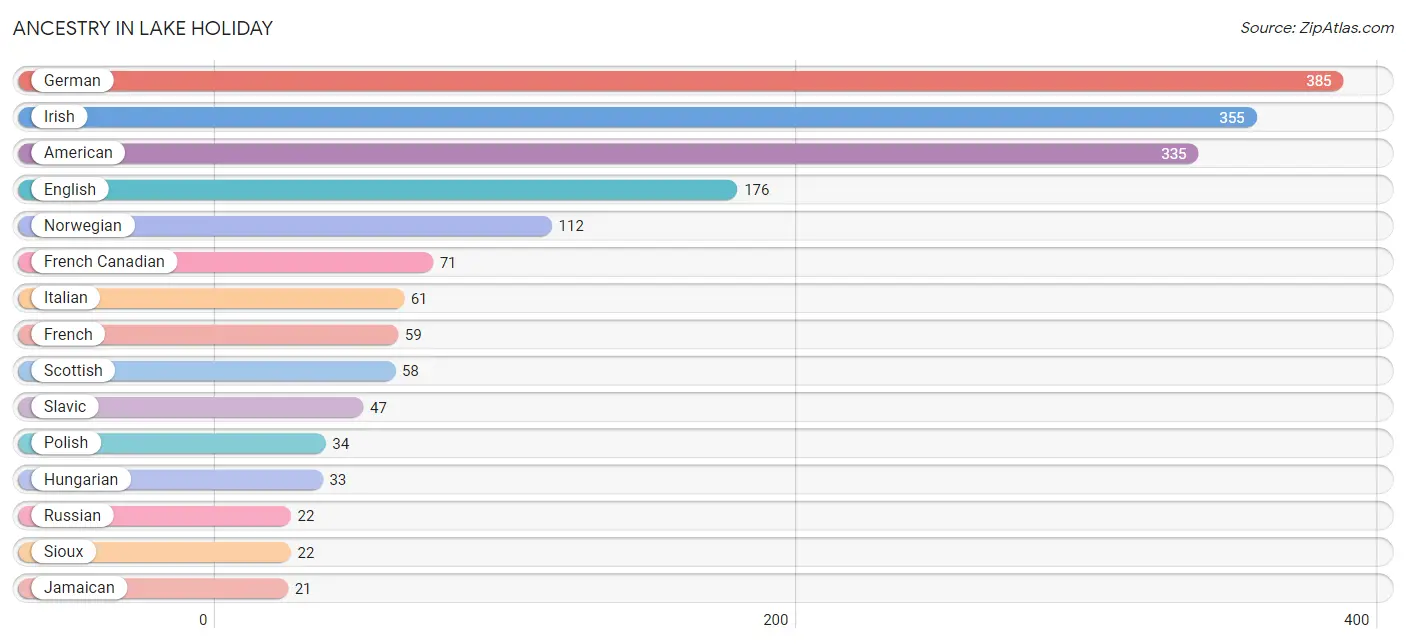
| Ancestry | # Population | % Population |
| American | 335 | 15.0% |
| Belgian | 10 | 0.4% |
| Blackfeet | 1 | 0.0% |
| British | 17 | 0.8% |
| Cherokee | 1 | 0.0% |
| Croatian | 16 | 0.7% |
| Czech | 18 | 0.8% |
| Ecuadorian | 4 | 0.2% |
| English | 176 | 7.9% |
| French | 59 | 2.6% |
| French Canadian | 71 | 3.2% |
| German | 385 | 17.2% |
| Hungarian | 33 | 1.5% |
| Irish | 355 | 15.9% |
| Italian | 61 | 2.7% |
| Jamaican | 21 | 0.9% |
| Norwegian | 112 | 5.0% |
| Polish | 34 | 1.5% |
| Russian | 22 | 1.0% |
| Scandinavian | 17 | 0.8% |
| Scottish | 58 | 2.6% |
| Sioux | 22 | 1.0% |
| Slavic | 47 | 2.1% |
| South American | 4 | 0.2% |
| Swedish | 19 | 0.9% | View All 25 Rows |
Immigrants in Lake Holiday
The most numerous immigrant groups reported in Lake Holiday came from Belgium (10 | 0.4%), Europe (10 | 0.4%), Western Europe (10 | 0.4%), Ecuador (4 | 0.2%), and Latin America (4 | 0.2%), together accounting for 1.7% of all Lake Holiday residents.
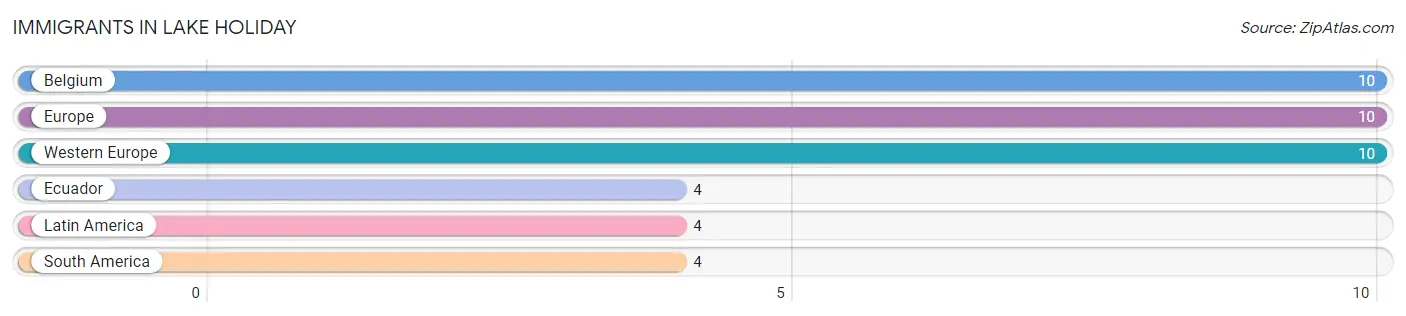
| Immigration Origin | # Population | % Population |
| Belgium | 10 | 0.4% |
| Ecuador | 4 | 0.2% |
| Europe | 10 | 0.4% |
| Latin America | 4 | 0.2% |
| South America | 4 | 0.2% |
| Western Europe | 10 | 0.4% | View All 6 Rows |
Sex and Age in Lake Holiday
Sex and Age in Lake Holiday
The most populous age groups in Lake Holiday are 50 to 54 Years (240 | 23.9%) for men and 10 to 14 Years (186 | 15.2%) for women.
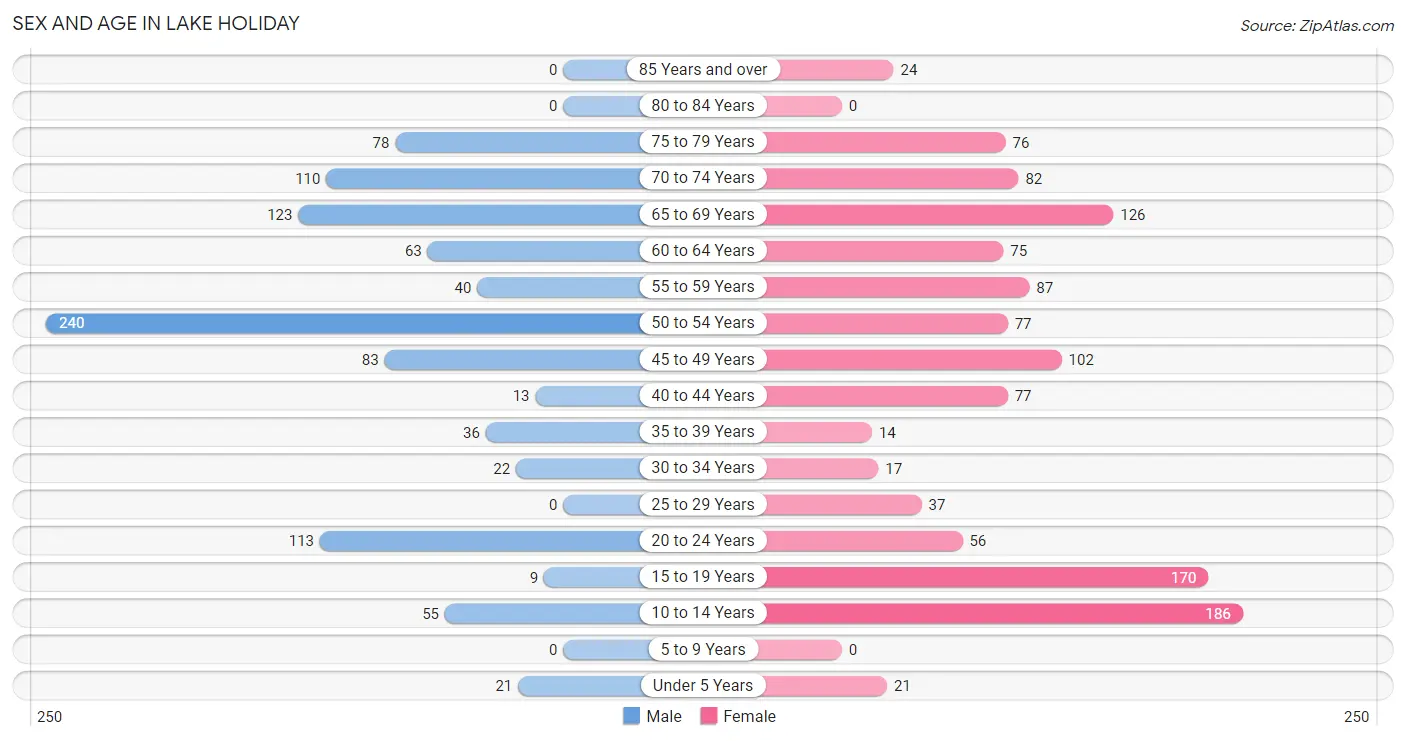
| Age Bracket | Male | Female |
| Under 5 Years | 21 (2.1%) | 21 (1.7%) |
| 5 to 9 Years | 0 (0.0%) | 0 (0.0%) |
| 10 to 14 Years | 55 (5.5%) | 186 (15.2%) |
| 15 to 19 Years | 9 (0.9%) | 170 (13.9%) |
| 20 to 24 Years | 113 (11.2%) | 56 (4.6%) |
| 25 to 29 Years | 0 (0.0%) | 37 (3.0%) |
| 30 to 34 Years | 22 (2.2%) | 17 (1.4%) |
| 35 to 39 Years | 36 (3.6%) | 14 (1.1%) |
| 40 to 44 Years | 13 (1.3%) | 77 (6.3%) |
| 45 to 49 Years | 83 (8.3%) | 102 (8.3%) |
| 50 to 54 Years | 240 (23.9%) | 77 (6.3%) |
| 55 to 59 Years | 40 (4.0%) | 87 (7.1%) |
| 60 to 64 Years | 63 (6.3%) | 75 (6.1%) |
| 65 to 69 Years | 123 (12.2%) | 126 (10.3%) |
| 70 to 74 Years | 110 (10.9%) | 82 (6.7%) |
| 75 to 79 Years | 78 (7.7%) | 76 (6.2%) |
| 80 to 84 Years | 0 (0.0%) | 0 (0.0%) |
| 85 Years and over | 0 (0.0%) | 24 (2.0%) |
| Total | 1,006 (100.0%) | 1,227 (100.0%) |
Families and Households in Lake Holiday
Median Family Size in Lake Holiday
The median family size in Lake Holiday is 2.90 persons per family, with single female/mother families (24 | 3.4%) accounting for the largest median family size of 3.42 persons per family. On the other hand, single male/father families (13 | 1.8%) represent the smallest median family size with 2.08 persons per family.
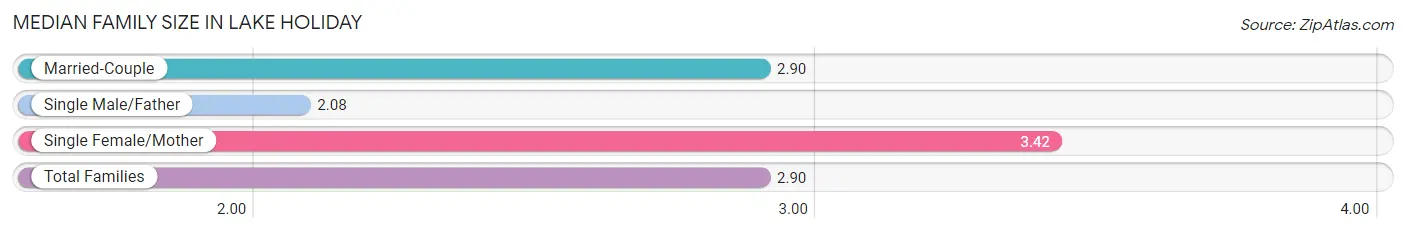
| Family Type | # Families | Family Size |
| Married-Couple | 671 (94.8%) | 2.90 |
| Single Male/Father | 13 (1.8%) | 2.08 |
| Single Female/Mother | 24 (3.4%) | 3.42 |
| Total Families | 708 (100.0%) | 2.90 |
Median Household Size in Lake Holiday
The median household size in Lake Holiday is 2.67 persons per household, with single female/mother households (24 | 2.9%) accounting for the largest median household size of 3.42 persons per household. non-family households (127 | 15.2%) represent the smallest median household size with 1.30 persons per household.
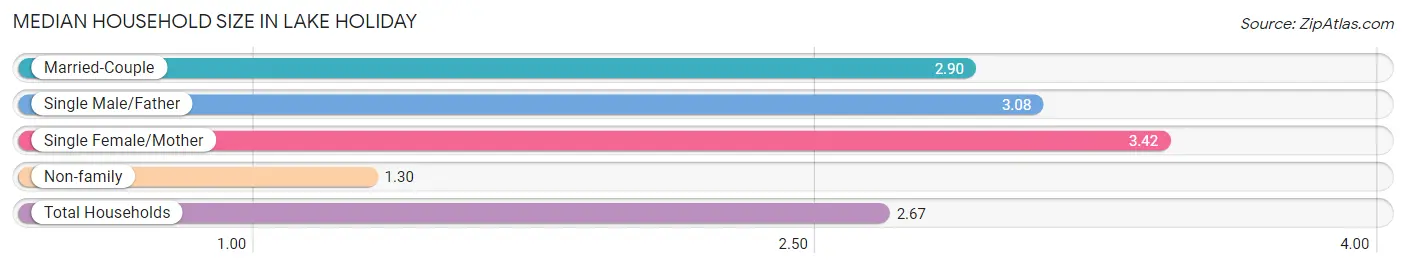
| Household Type | # Households | Household Size |
| Married-Couple | 671 (80.4%) | 2.90 |
| Single Male/Father | 13 (1.6%) | 3.08 |
| Single Female/Mother | 24 (2.9%) | 3.42 |
| Non-family | 127 (15.2%) | 1.30 |
| Total Households | 835 (100.0%) | 2.67 |
Household Size by Marriage Status in Lake Holiday
Out of a total of 835 households in Lake Holiday, 708 (84.8%) are family households, while 127 (15.2%) are nonfamily households. The most numerous type of family households are 2-person households, comprising 378, and the most common type of nonfamily households are 1-person households, comprising 109.
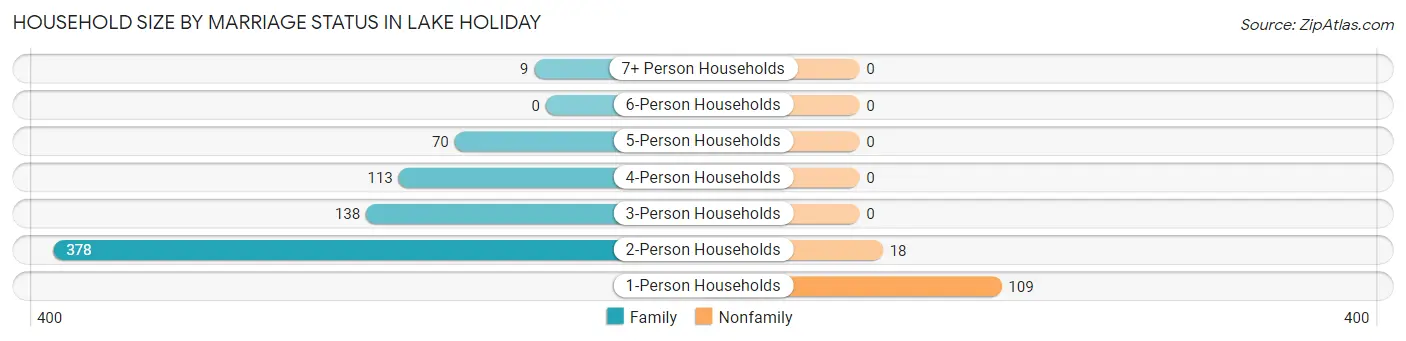
| Household Size | Family Households | Nonfamily Households |
| 1-Person Households | - | 109 (13.1%) |
| 2-Person Households | 378 (45.3%) | 18 (2.2%) |
| 3-Person Households | 138 (16.5%) | 0 (0.0%) |
| 4-Person Households | 113 (13.5%) | 0 (0.0%) |
| 5-Person Households | 70 (8.4%) | 0 (0.0%) |
| 6-Person Households | 0 (0.0%) | 0 (0.0%) |
| 7+ Person Households | 9 (1.1%) | 0 (0.0%) |
| Total | 708 (84.8%) | 127 (15.2%) |
Female Fertility in Lake Holiday
Fertility by Age in Lake Holiday
Average fertility rate in Lake Holiday is 104.0 births per 1,000 women. Women in the age bracket of 20 to 34 years have the highest fertility rate with 445.0 births per 1,000 women. Women in the age bracket of 20 to 34 years acount for 100.0% of all women with births.
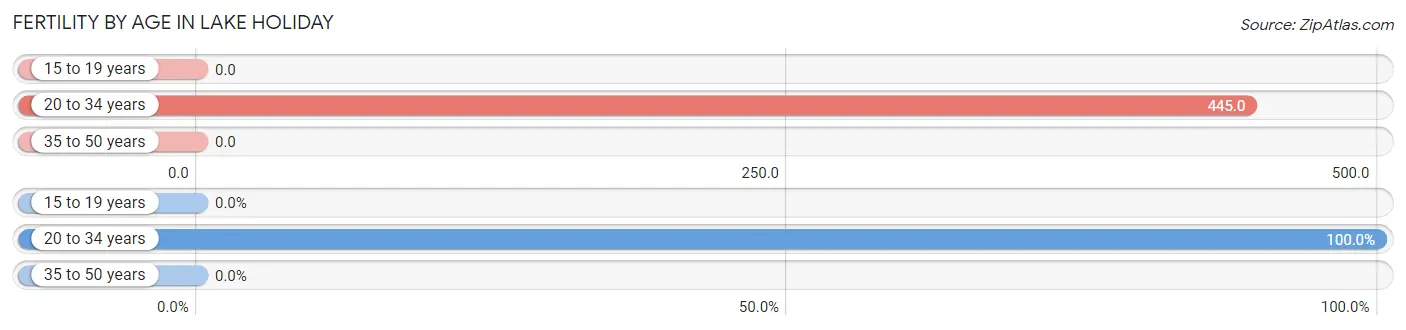
| Age Bracket | Women with Births | Births / 1,000 Women |
| 15 to 19 years | 0 (0.0%) | 0.0 |
| 20 to 34 years | 49 (100.0%) | 445.0 |
| 35 to 50 years | 0 (0.0%) | 0.0 |
| Total | 49 (100.0%) | 104.0 |
Fertility by Age by Marriage Status in Lake Holiday
24.5% of women with births (49) in Lake Holiday are married. The highest percentage of unmarried women with births falls into 20 to 34 years age bracket with 75.5% of them unmarried at the time of birth, while the lowest percentage of unmarried women with births belong to 20 to 34 years age bracket with 75.5% of them unmarried.
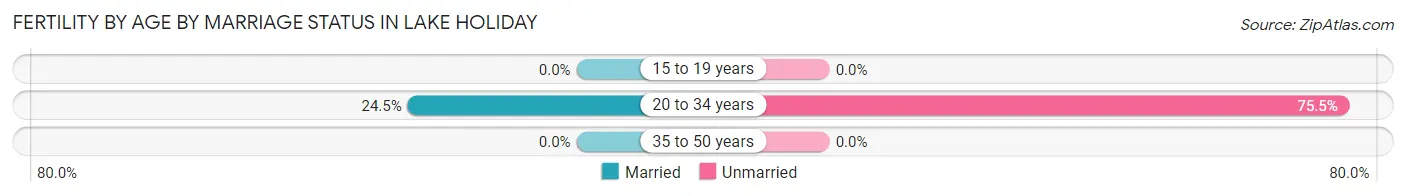
| Age Bracket | Married | Unmarried |
| 15 to 19 years | 0 (0.0%) | 0 (0.0%) |
| 20 to 34 years | 12 (24.5%) | 37 (75.5%) |
| 35 to 50 years | 0 (0.0%) | 0 (0.0%) |
| Total | 12 (24.5%) | 37 (75.5%) |
Fertility by Education in Lake Holiday
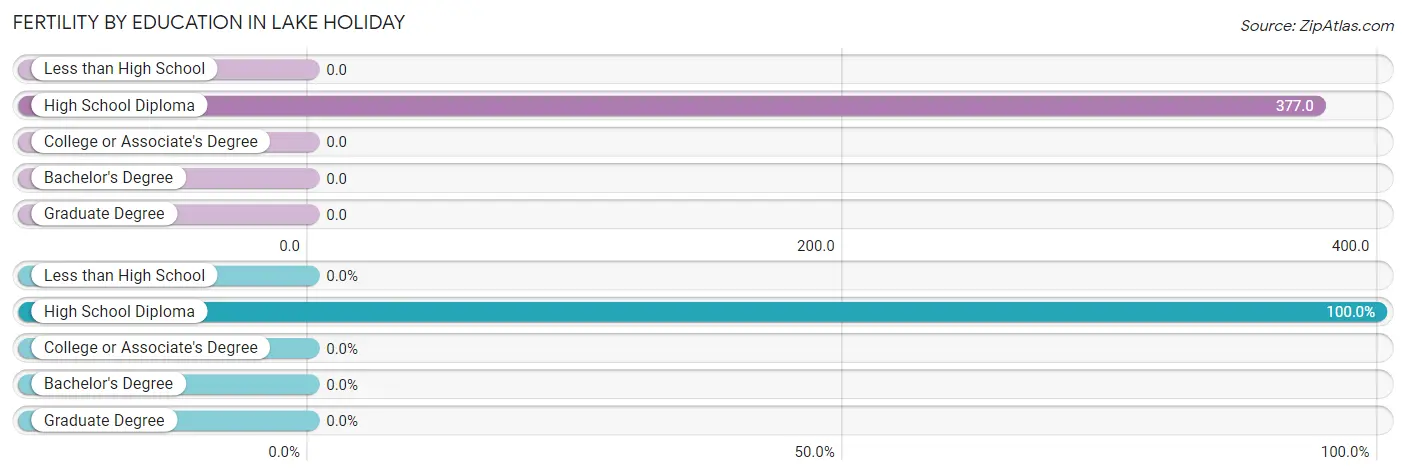
| Educational Attainment | Women with Births | Births / 1,000 Women |
| Less than High School | 0 (0.0%) | 0.0 |
| High School Diploma | 49 (100.0%) | 377.0 |
| College or Associate's Degree | 0 (0.0%) | 0.0 |
| Bachelor's Degree | 0 (0.0%) | 0.0 |
| Graduate Degree | 0 (0.0%) | 0.0 |
| Total | 49 (100.0%) | 104.0 |
Fertility by Education by Marriage Status in Lake Holiday
75.5% of women with births in Lake Holiday are unmarried. Women with the educational attainment of high school diploma are most likely to be married with 24.5% of them married at childbirth, while women with the educational attainment of high school diploma are least likely to be married with 75.5% of them unmarried at childbirth.
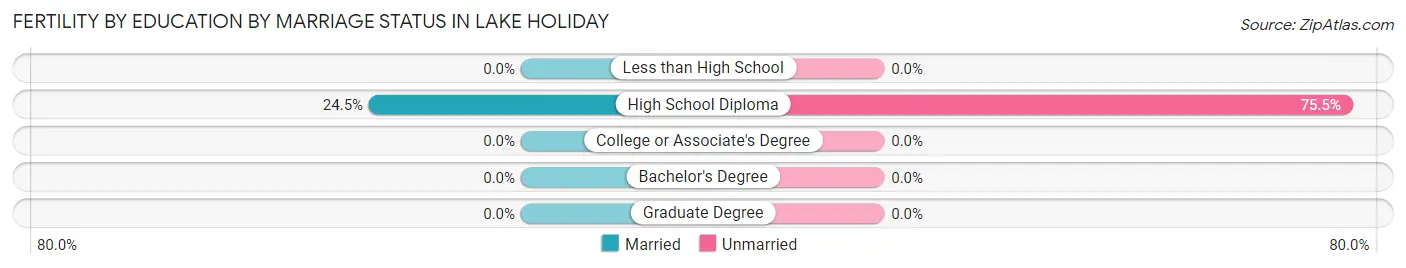
| Educational Attainment | Married | Unmarried |
| Less than High School | 0 (0.0%) | 0 (0.0%) |
| High School Diploma | 12 (24.5%) | 37 (75.5%) |
| College or Associate's Degree | 0 (0.0%) | 0 (0.0%) |
| Bachelor's Degree | 0 (0.0%) | 0 (0.0%) |
| Graduate Degree | 0 (0.0%) | 0 (0.0%) |
| Total | 12 (24.5%) | 37 (75.5%) |
Employment Characteristics in Lake Holiday
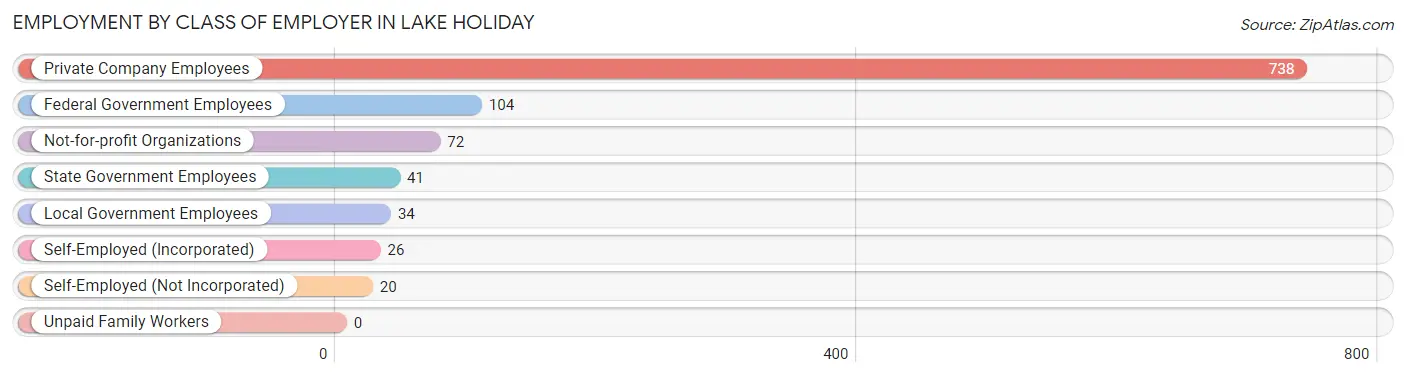
Employment by Class of Employer in Lake Holiday
Among the 1,035 employed individuals in Lake Holiday, private company employees (738 | 71.3%), federal government employees (104 | 10.1%), and not-for-profit organizations (72 | 7.0%) make up the most common classes of employment.
| Employer Class | # Employees | % Employees |
| Private Company Employees | 738 | 71.3% |
| Self-Employed (Incorporated) | 26 | 2.5% |
| Self-Employed (Not Incorporated) | 20 | 1.9% |
| Not-for-profit Organizations | 72 | 7.0% |
| Local Government Employees | 34 | 3.3% |
| State Government Employees | 41 | 4.0% |
| Federal Government Employees | 104 | 10.1% |
| Unpaid Family Workers | 0 | 0.0% |
| Total | 1,035 | 100.0% |
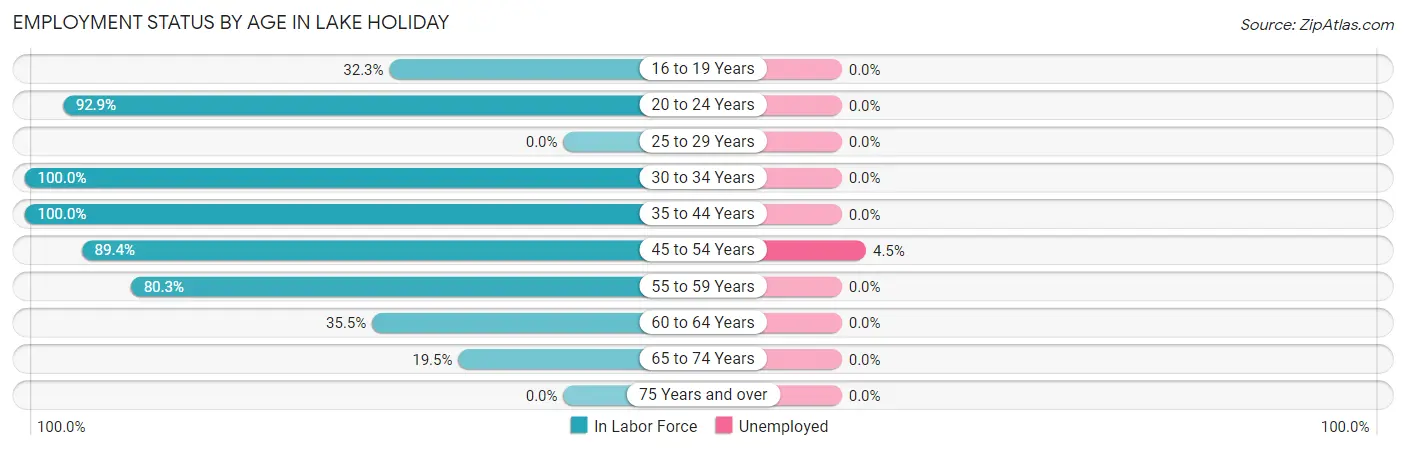
Employment Status by Age in Lake Holiday
According to the labor force statistics for Lake Holiday, out of the total population over 16 years of age (1,867), 56.4% or 1,053 individuals are in the labor force, with 1.8% or 19 of them unemployed. The age group with the highest labor force participation rate is 30 to 34 years, with 100.0% or 39 individuals in the labor force. Within the labor force, the 45 to 54 years age range has the highest percentage of unemployed individuals, with 4.5% or 20 of them being unemployed.
| Age Bracket | In Labor Force | Unemployed |
| 16 to 19 Years | 31 (32.3%) | 0 (0.0%) |
| 20 to 24 Years | 157 (92.9%) | 0 (0.0%) |
| 25 to 29 Years | 0 (0.0%) | 0 (0.0%) |
| 30 to 34 Years | 39 (100.0%) | 0 (0.0%) |
| 35 to 44 Years | 140 (100.0%) | 0 (0.0%) |
| 45 to 54 Years | 449 (89.4%) | 20 (4.5%) |
| 55 to 59 Years | 102 (80.3%) | 0 (0.0%) |
| 60 to 64 Years | 49 (35.5%) | 0 (0.0%) |
| 65 to 74 Years | 86 (19.5%) | 0 (0.0%) |
| 75 Years and over | 0 (0.0%) | 0 (0.0%) |
| Total | 1,053 (56.4%) | 19 (1.8%) |
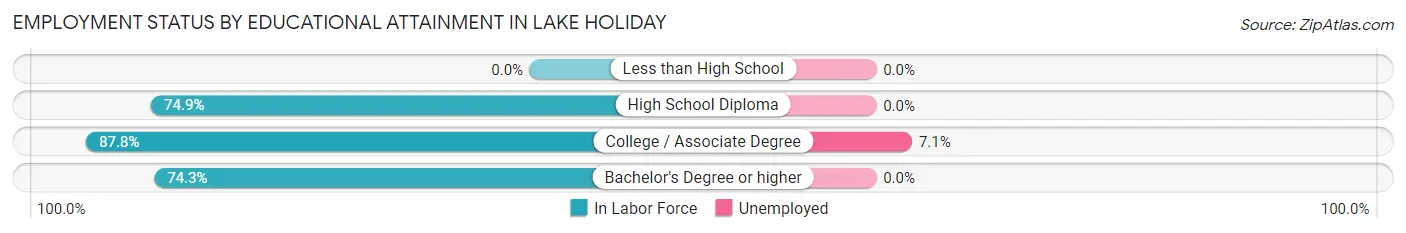
Employment Status by Educational Attainment in Lake Holiday
According to labor force statistics for Lake Holiday, 79.2% of individuals (779) out of the total population between 25 and 64 years of age (983) are in the labor force, with 2.5% or 19 of them being unemployed. The group with the highest labor force participation rate are those with the educational attainment of college / associate degree, with 87.8% or 302 individuals in the labor force. Within the labor force, individuals with college / associate degree education have the highest percentage of unemployment, with 7.1% or 21 of them being unemployed.
| Educational Attainment | In Labor Force | Unemployed |
| Less than High School | 0 (0.0%) | 0 (0.0%) |
| High School Diploma | 283 (74.9%) | 0 (0.0%) |
| College / Associate Degree | 302 (87.8%) | 24 (7.1%) |
| Bachelor's Degree or higher | 194 (74.3%) | 0 (0.0%) |
| Total | 779 (79.2%) | 25 (2.5%) |
Employment Occupations by Sex in Lake Holiday
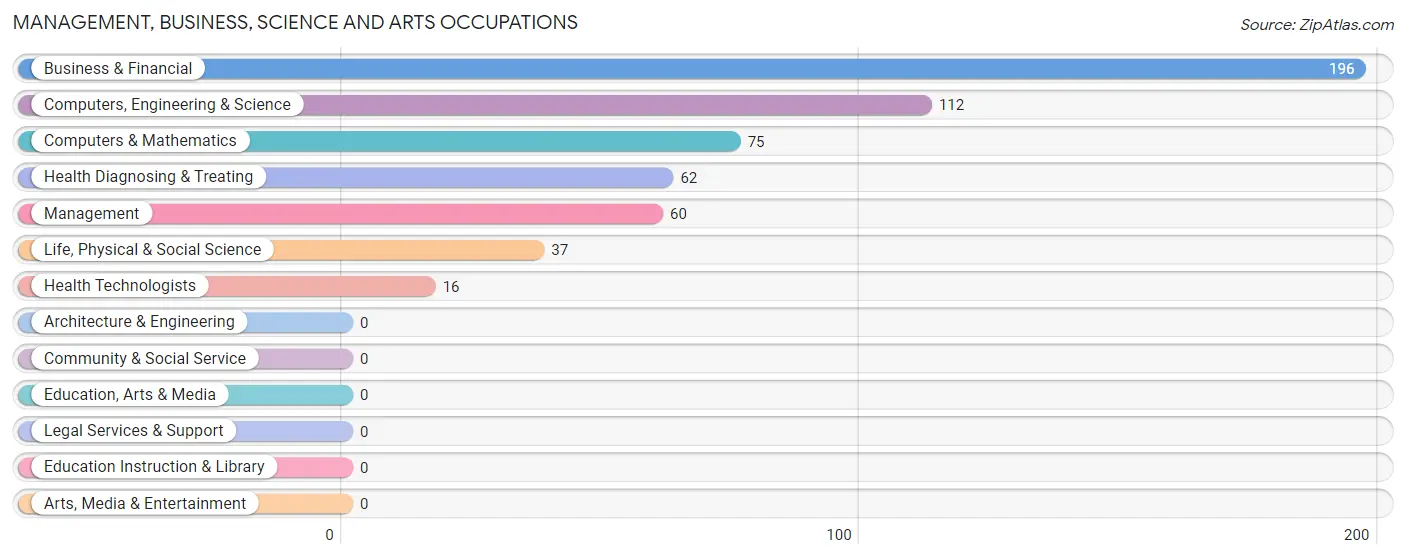
Management, Business, Science and Arts Occupations
The most common Management, Business, Science and Arts occupations in Lake Holiday are Business & Financial (196 | 19.8%), Computers, Engineering & Science (112 | 11.3%), Computers & Mathematics (75 | 7.6%), Health Diagnosing & Treating (62 | 6.3%), and Management (60 | 6.1%).
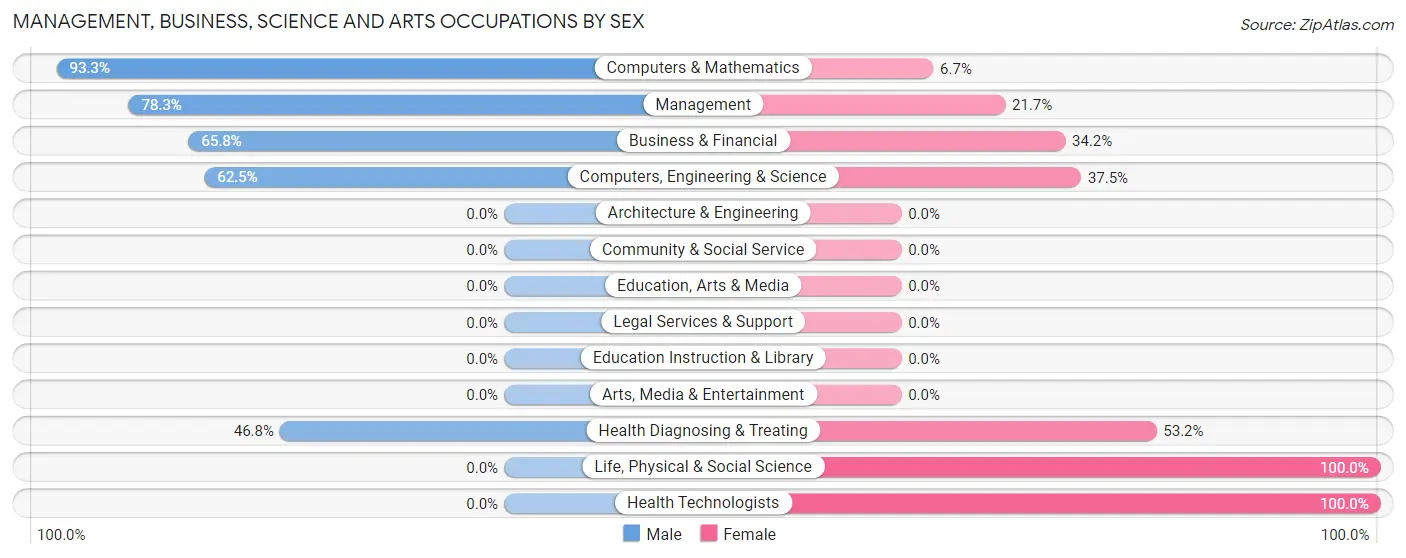
Management, Business, Science and Arts Occupations by Sex
Within the Management, Business, Science and Arts occupations in Lake Holiday, the most male-oriented occupations are Computers & Mathematics (93.3%), Management (78.3%), and Business & Financial (65.8%), while the most female-oriented occupations are Life, Physical & Social Science (100.0%), Health Technologists (100.0%), and Health Diagnosing & Treating (53.2%).
| Occupation | Male | Female |
| Management | 47 (78.3%) | 13 (21.7%) |
| Business & Financial | 129 (65.8%) | 67 (34.2%) |
| Computers, Engineering & Science | 70 (62.5%) | 42 (37.5%) |
| Computers & Mathematics | 70 (93.3%) | 5 (6.7%) |
| Architecture & Engineering | 0 (0.0%) | 0 (0.0%) |
| Life, Physical & Social Science | 0 (0.0%) | 37 (100.0%) |
| Community & Social Service | 0 (0.0%) | 0 (0.0%) |
| Education, Arts & Media | 0 (0.0%) | 0 (0.0%) |
| Legal Services & Support | 0 (0.0%) | 0 (0.0%) |
| Education Instruction & Library | 0 (0.0%) | 0 (0.0%) |
| Arts, Media & Entertainment | 0 (0.0%) | 0 (0.0%) |
| Health Diagnosing & Treating | 29 (46.8%) | 33 (53.2%) |
| Health Technologists | 0 (0.0%) | 16 (100.0%) |
| Total (Category) | 275 (63.9%) | 155 (36.0%) |
| Total (Overall) | 562 (56.9%) | 426 (43.1%) |
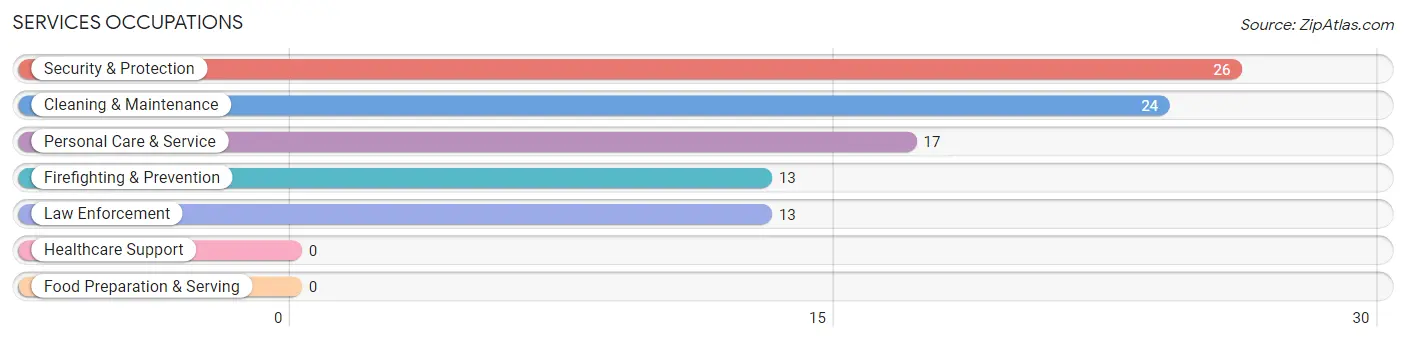
Services Occupations
The most common Services occupations in Lake Holiday are Security & Protection (26 | 2.6%), Cleaning & Maintenance (24 | 2.4%), Personal Care & Service (17 | 1.7%), Firefighting & Prevention (13 | 1.3%), and Law Enforcement (13 | 1.3%).
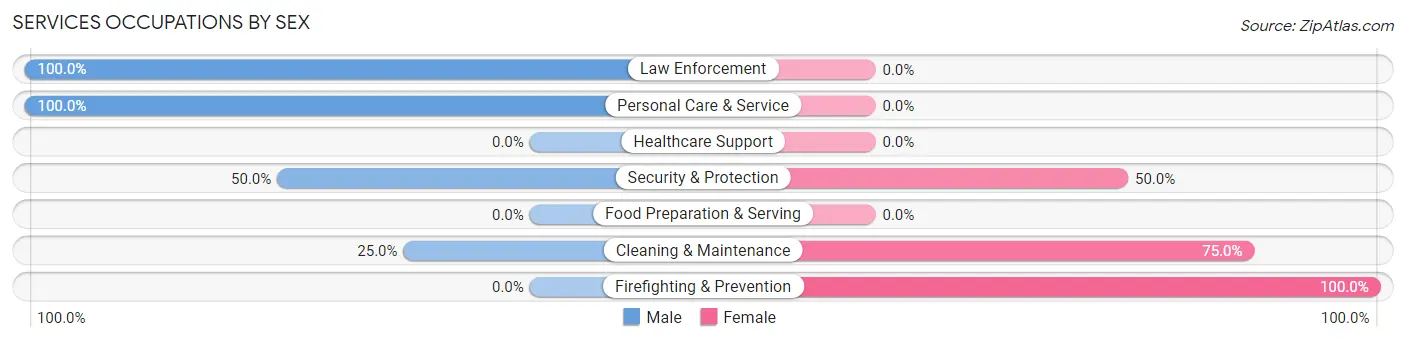
Services Occupations by Sex
Within the Services occupations in Lake Holiday, the most male-oriented occupations are Law Enforcement (100.0%), Personal Care & Service (100.0%), and Security & Protection (50.0%), while the most female-oriented occupations are Firefighting & Prevention (100.0%), Cleaning & Maintenance (75.0%), and Security & Protection (50.0%).
| Occupation | Male | Female |
| Healthcare Support | 0 (0.0%) | 0 (0.0%) |
| Security & Protection | 13 (50.0%) | 13 (50.0%) |
| Firefighting & Prevention | 0 (0.0%) | 13 (100.0%) |
| Law Enforcement | 13 (100.0%) | 0 (0.0%) |
| Food Preparation & Serving | 0 (0.0%) | 0 (0.0%) |
| Cleaning & Maintenance | 6 (25.0%) | 18 (75.0%) |
| Personal Care & Service | 17 (100.0%) | 0 (0.0%) |
| Total (Category) | 36 (53.7%) | 31 (46.3%) |
| Total (Overall) | 562 (56.9%) | 426 (43.1%) |
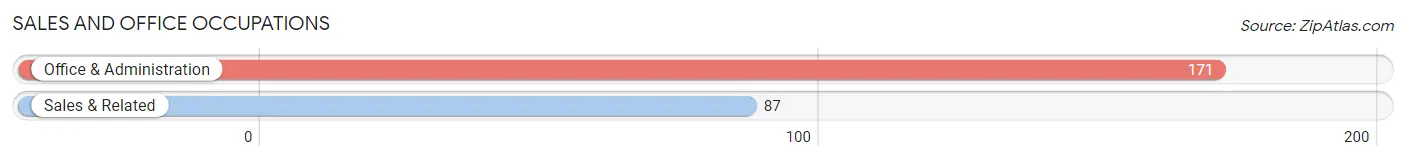
Sales and Office Occupations
The most common Sales and Office occupations in Lake Holiday are Office & Administration (171 | 17.3%), and Sales & Related (87 | 8.8%).
Sales and Office Occupations by Sex
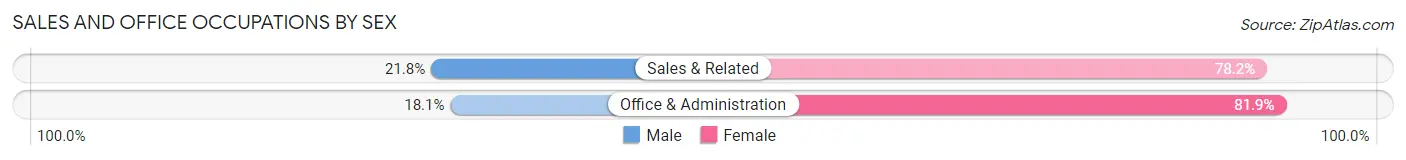
| Occupation | Male | Female |
| Sales & Related | 19 (21.8%) | 68 (78.2%) |
| Office & Administration | 31 (18.1%) | 140 (81.9%) |
| Total (Category) | 50 (19.4%) | 208 (80.6%) |
| Total (Overall) | 562 (56.9%) | 426 (43.1%) |
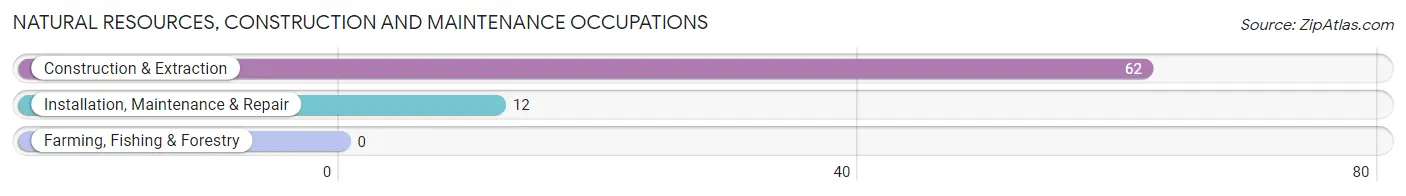
Natural Resources, Construction and Maintenance Occupations
The most common Natural Resources, Construction and Maintenance occupations in Lake Holiday are Construction & Extraction (62 | 6.3%), and Installation, Maintenance & Repair (12 | 1.2%).
Natural Resources, Construction and Maintenance Occupations by Sex
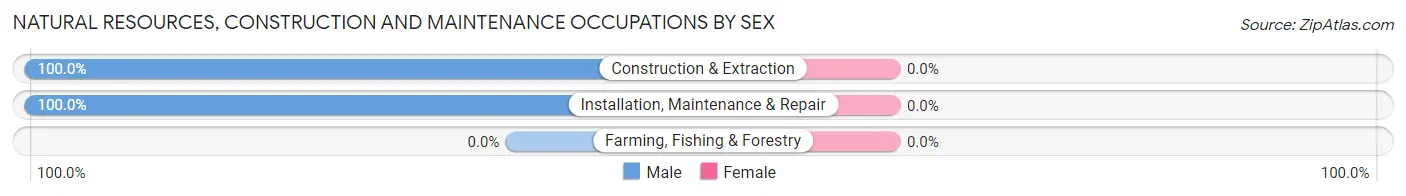
| Occupation | Male | Female |
| Farming, Fishing & Forestry | 0 (0.0%) | 0 (0.0%) |
| Construction & Extraction | 62 (100.0%) | 0 (0.0%) |
| Installation, Maintenance & Repair | 12 (100.0%) | 0 (0.0%) |
| Total (Category) | 74 (100.0%) | 0 (0.0%) |
| Total (Overall) | 562 (56.9%) | 426 (43.1%) |
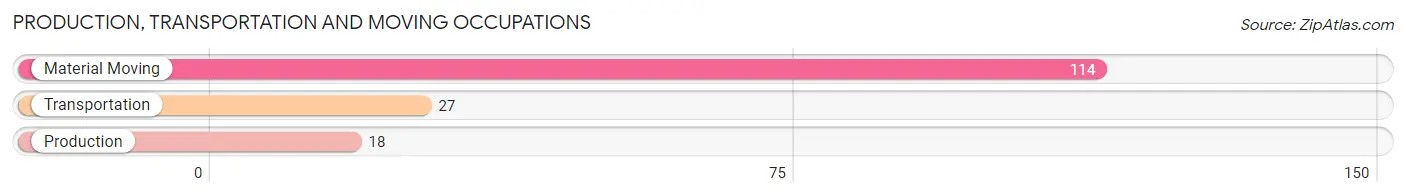
Production, Transportation and Moving Occupations
The most common Production, Transportation and Moving occupations in Lake Holiday are Material Moving (114 | 11.5%), Transportation (27 | 2.7%), and Production (18 | 1.8%).
Production, Transportation and Moving Occupations by Sex
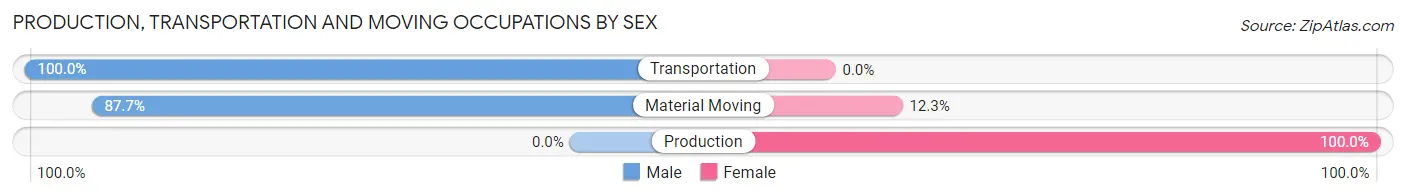
| Occupation | Male | Female |
| Production | 0 (0.0%) | 18 (100.0%) |
| Transportation | 27 (100.0%) | 0 (0.0%) |
| Material Moving | 100 (87.7%) | 14 (12.3%) |
| Total (Category) | 127 (79.9%) | 32 (20.1%) |
| Total (Overall) | 562 (56.9%) | 426 (43.1%) |
Employment Industries by Sex in Lake Holiday
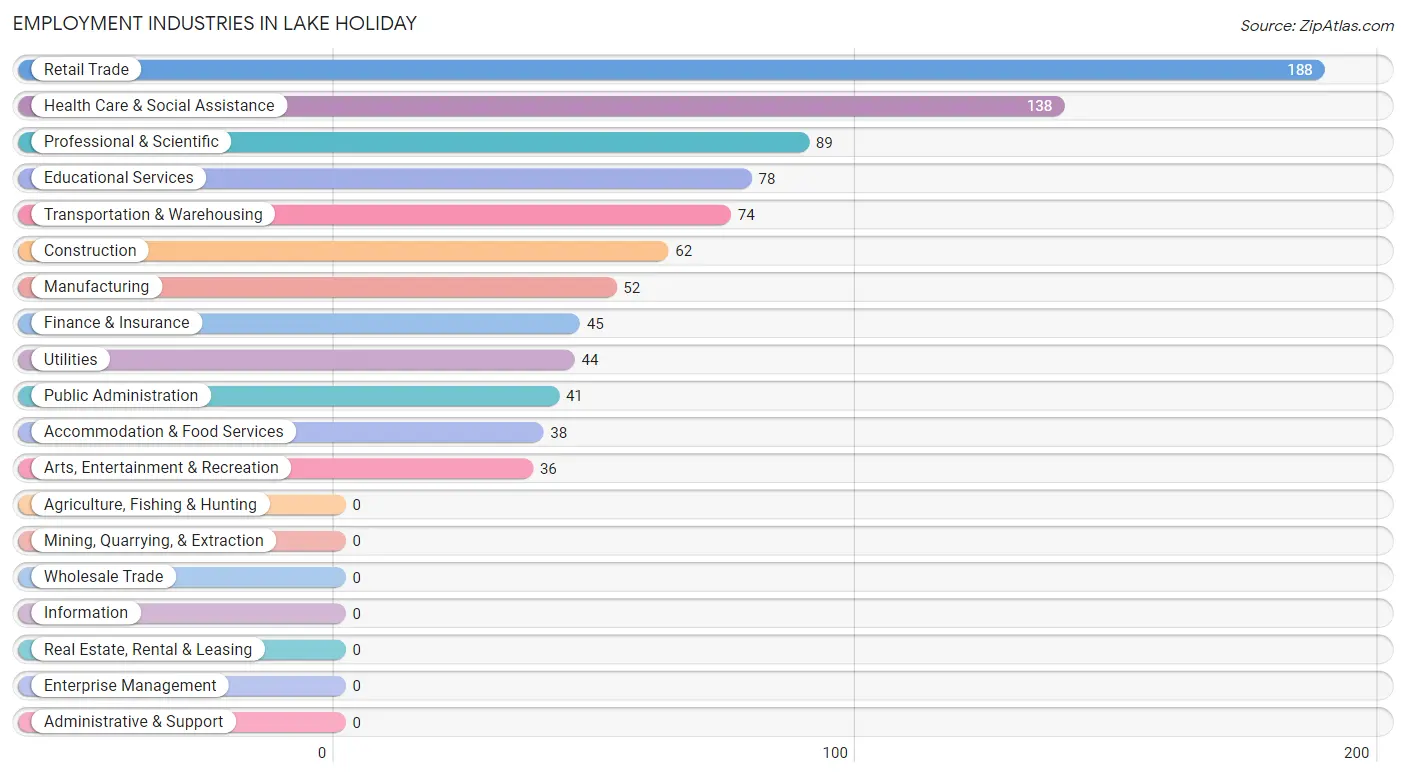
Employment Industries in Lake Holiday
The major employment industries in Lake Holiday include Retail Trade (188 | 19.0%), Health Care & Social Assistance (138 | 14.0%), Professional & Scientific (89 | 9.0%), Educational Services (78 | 7.9%), and Transportation & Warehousing (74 | 7.5%).
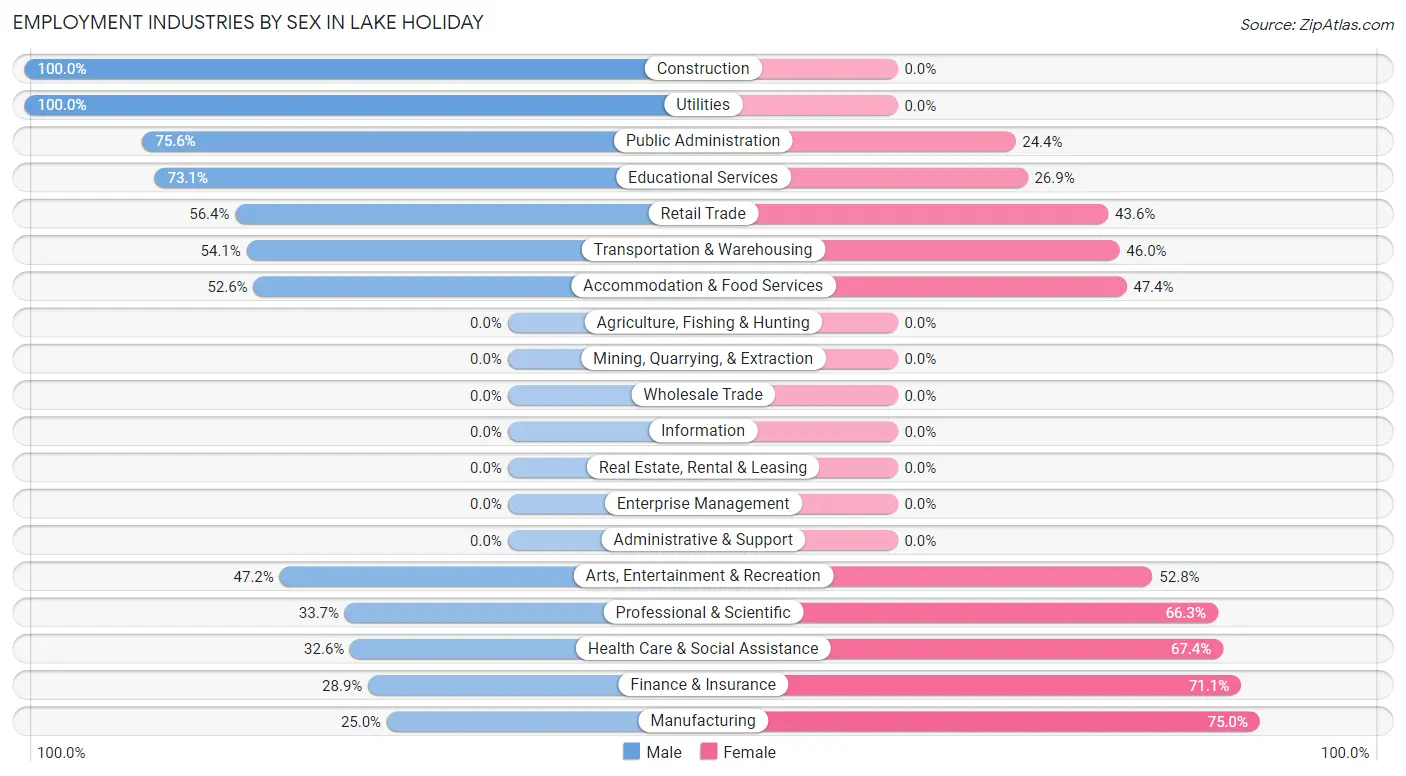
Employment Industries by Sex in Lake Holiday
The Lake Holiday industries that see more men than women are Construction (100.0%), Utilities (100.0%), and Public Administration (75.6%), whereas the industries that tend to have a higher number of women are Manufacturing (75.0%), Finance & Insurance (71.1%), and Health Care & Social Assistance (67.4%).
| Industry | Male | Female |
| Agriculture, Fishing & Hunting | 0 (0.0%) | 0 (0.0%) |
| Mining, Quarrying, & Extraction | 0 (0.0%) | 0 (0.0%) |
| Construction | 62 (100.0%) | 0 (0.0%) |
| Manufacturing | 13 (25.0%) | 39 (75.0%) |
| Wholesale Trade | 0 (0.0%) | 0 (0.0%) |
| Retail Trade | 106 (56.4%) | 82 (43.6%) |
| Transportation & Warehousing | 40 (54.0%) | 34 (46.0%) |
| Utilities | 44 (100.0%) | 0 (0.0%) |
| Information | 0 (0.0%) | 0 (0.0%) |
| Finance & Insurance | 13 (28.9%) | 32 (71.1%) |
| Real Estate, Rental & Leasing | 0 (0.0%) | 0 (0.0%) |
| Professional & Scientific | 30 (33.7%) | 59 (66.3%) |
| Enterprise Management | 0 (0.0%) | 0 (0.0%) |
| Administrative & Support | 0 (0.0%) | 0 (0.0%) |
| Educational Services | 57 (73.1%) | 21 (26.9%) |
| Health Care & Social Assistance | 45 (32.6%) | 93 (67.4%) |
| Arts, Entertainment & Recreation | 17 (47.2%) | 19 (52.8%) |
| Accommodation & Food Services | 20 (52.6%) | 18 (47.4%) |
| Public Administration | 31 (75.6%) | 10 (24.4%) |
| Total | 562 (56.9%) | 426 (43.1%) |
Education in Lake Holiday
School Enrollment in Lake Holiday
The most common levels of schooling among the 460 students in Lake Holiday are middle school (225 | 48.9%), high school (195 | 42.4%), and college / undergraduate (23 | 5.0%).
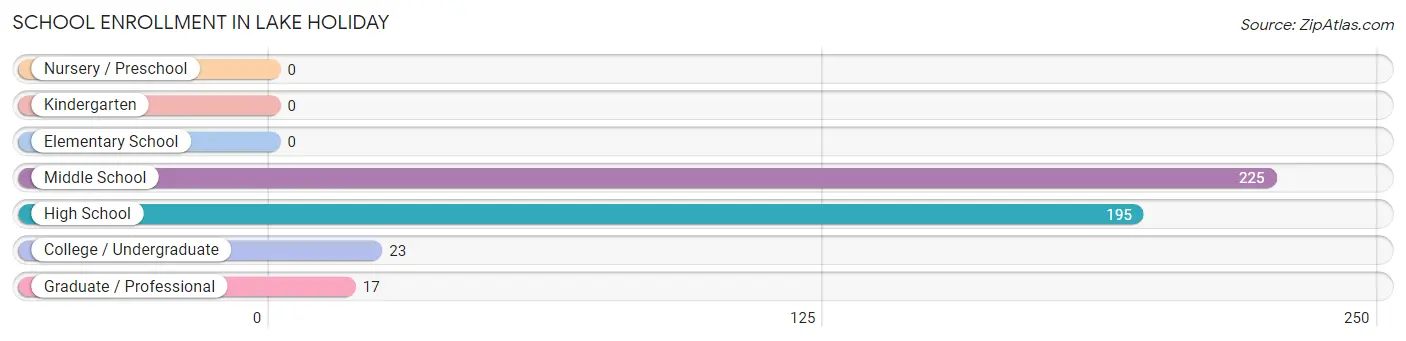
| School Level | # Students | % Students |
| Nursery / Preschool | 0 | 0.0% |
| Kindergarten | 0 | 0.0% |
| Elementary School | 0 | 0.0% |
| Middle School | 225 | 48.9% |
| High School | 195 | 42.4% |
| College / Undergraduate | 23 | 5.0% |
| Graduate / Professional | 17 | 3.7% |
| Total | 460 | 100.0% |
School Enrollment by Age by Funding Source in Lake Holiday
Out of a total of 460 students who are enrolled in schools in Lake Holiday, 193 (42.0%) attend a private institution, while the remaining 267 (58.0%) are enrolled in public schools. The age group of 15 to 17 year olds has the highest likelihood of being enrolled in private schools, with 107 (66.5% in the age bracket) enrolled. Conversely, the age group of 18 to 19 year olds has the lowest likelihood of being enrolled in a private school, with 18 (100.0% in the age bracket) attending a public institution.
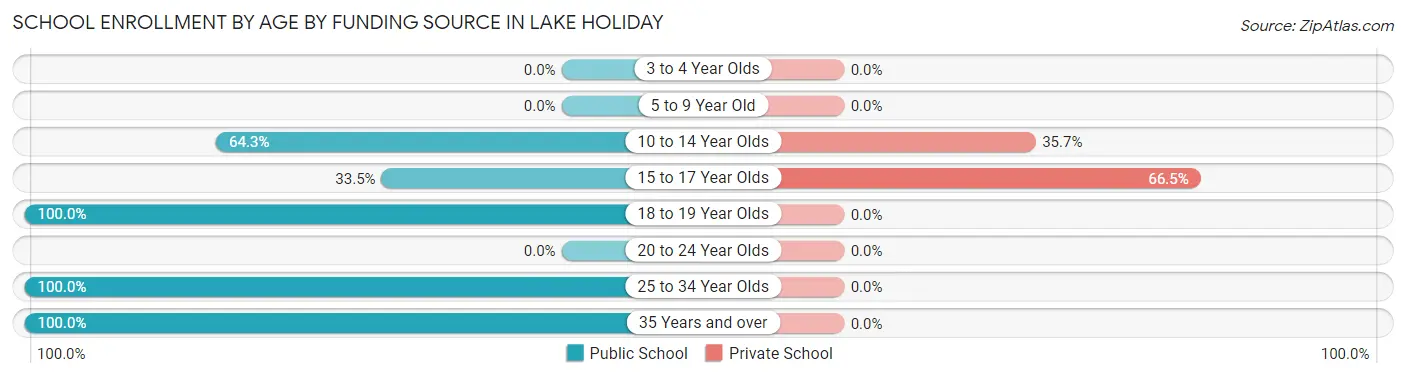
| Age Bracket | Public School | Private School |
| 3 to 4 Year Olds | 0 (0.0%) | 0 (0.0%) |
| 5 to 9 Year Old | 0 (0.0%) | 0 (0.0%) |
| 10 to 14 Year Olds | 155 (64.3%) | 86 (35.7%) |
| 15 to 17 Year Olds | 54 (33.5%) | 107 (66.5%) |
| 18 to 19 Year Olds | 18 (100.0%) | 0 (0.0%) |
| 20 to 24 Year Olds | 0 (0.0%) | 0 (0.0%) |
| 25 to 34 Year Olds | 17 (100.0%) | 0 (0.0%) |
| 35 Years and over | 23 (100.0%) | 0 (0.0%) |
| Total | 267 (58.0%) | 193 (42.0%) |
Educational Attainment by Field of Study in Lake Holiday
Bio, nature & agricultural (69 | 13.0%), education (68 | 12.8%), communications (59 | 11.1%), science & technology (57 | 10.7%), and psychology (55 | 10.4%) are the most common fields of study among 530 individuals in Lake Holiday who have obtained a bachelor's degree or higher.
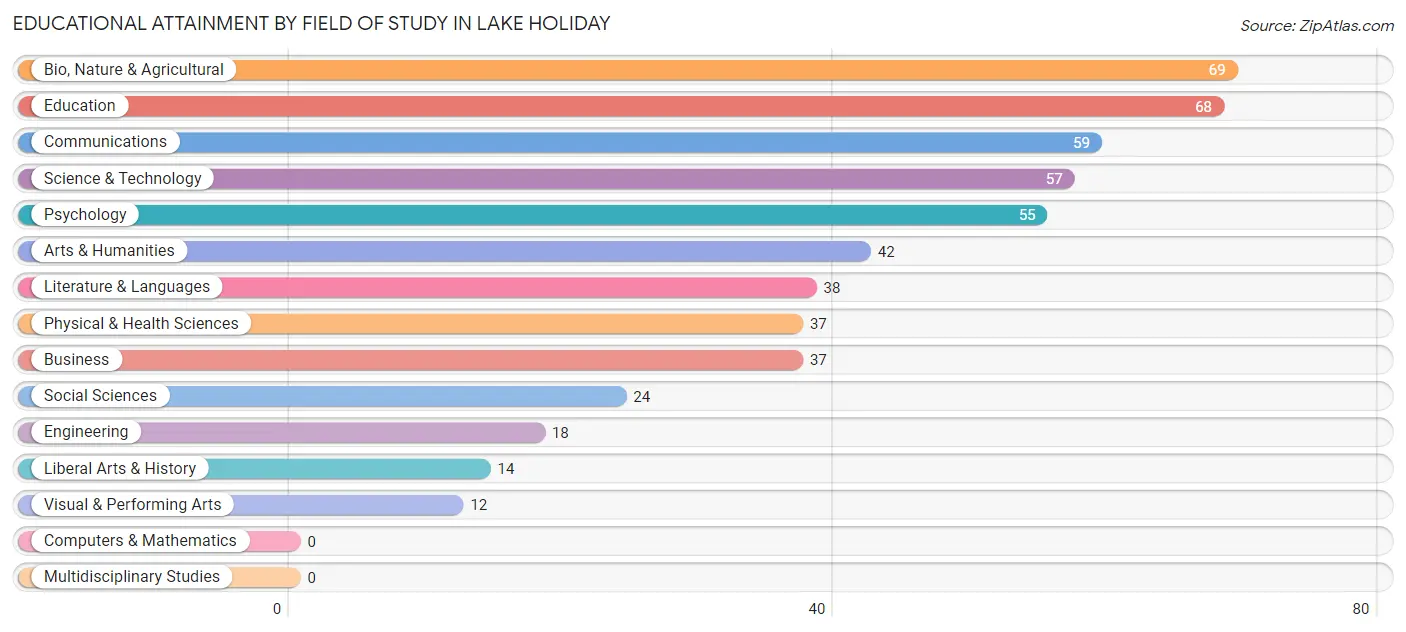
| Field of Study | # Graduates | % Graduates |
| Computers & Mathematics | 0 | 0.0% |
| Bio, Nature & Agricultural | 69 | 13.0% |
| Physical & Health Sciences | 37 | 7.0% |
| Psychology | 55 | 10.4% |
| Social Sciences | 24 | 4.5% |
| Engineering | 18 | 3.4% |
| Multidisciplinary Studies | 0 | 0.0% |
| Science & Technology | 57 | 10.7% |
| Business | 37 | 7.0% |
| Education | 68 | 12.8% |
| Literature & Languages | 38 | 7.2% |
| Liberal Arts & History | 14 | 2.6% |
| Visual & Performing Arts | 12 | 2.3% |
| Communications | 59 | 11.1% |
| Arts & Humanities | 42 | 7.9% |
| Total | 530 | 100.0% |
Transportation & Commute in Lake Holiday
Vehicle Availability by Sex in Lake Holiday
The most prevalent vehicle ownership categories in Lake Holiday are males with 2 vehicles (254, accounting for 41.7%) and females with 2 vehicles (132, making up 59.6%).
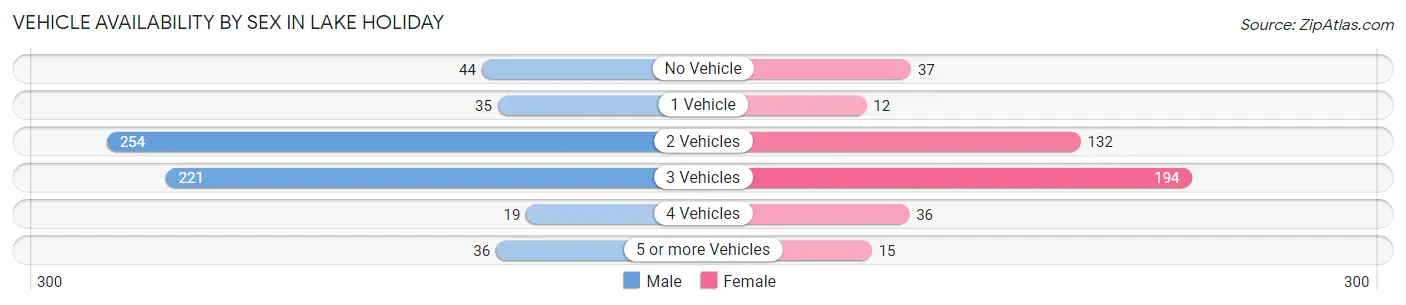
| Vehicles Available | Male | Female |
| No Vehicle | 44 (7.2%) | 37 (8.7%) |
| 1 Vehicle | 35 (5.8%) | 12 (2.8%) |
| 2 Vehicles | 254 (41.7%) | 132 (31.0%) |
| 3 Vehicles | 221 (36.3%) | 194 (45.5%) |
| 4 Vehicles | 19 (3.1%) | 36 (8.5%) |
| 5 or more Vehicles | 36 (5.9%) | 15 (3.5%) |
| Total | 609 (100.0%) | 426 (100.0%) |
Commute Time in Lake Holiday
The most frequently occuring commute durations in Lake Holiday are 20 to 24 minutes (235 commuters, 25.0%), 90 or more minutes (167 commuters, 17.8%), and 30 to 34 minutes (161 commuters, 17.2%).
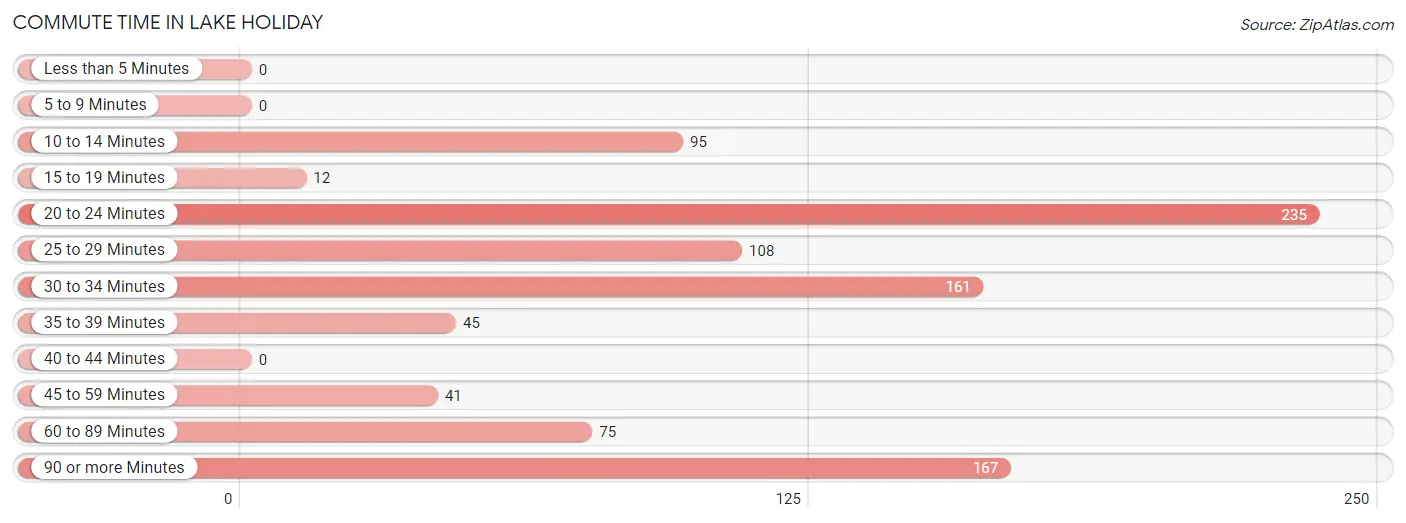
| Commute Time | # Commuters | % Commuters |
| Less than 5 Minutes | 0 | 0.0% |
| 5 to 9 Minutes | 0 | 0.0% |
| 10 to 14 Minutes | 95 | 10.1% |
| 15 to 19 Minutes | 12 | 1.3% |
| 20 to 24 Minutes | 235 | 25.0% |
| 25 to 29 Minutes | 108 | 11.5% |
| 30 to 34 Minutes | 161 | 17.2% |
| 35 to 39 Minutes | 45 | 4.8% |
| 40 to 44 Minutes | 0 | 0.0% |
| 45 to 59 Minutes | 41 | 4.4% |
| 60 to 89 Minutes | 75 | 8.0% |
| 90 or more Minutes | 167 | 17.8% |
Commute Time by Sex in Lake Holiday
The most common commute times in Lake Holiday are 30 to 34 minutes (144 commuters, 25.2%) for males and 20 to 24 minutes (142 commuters, 38.7%) for females.
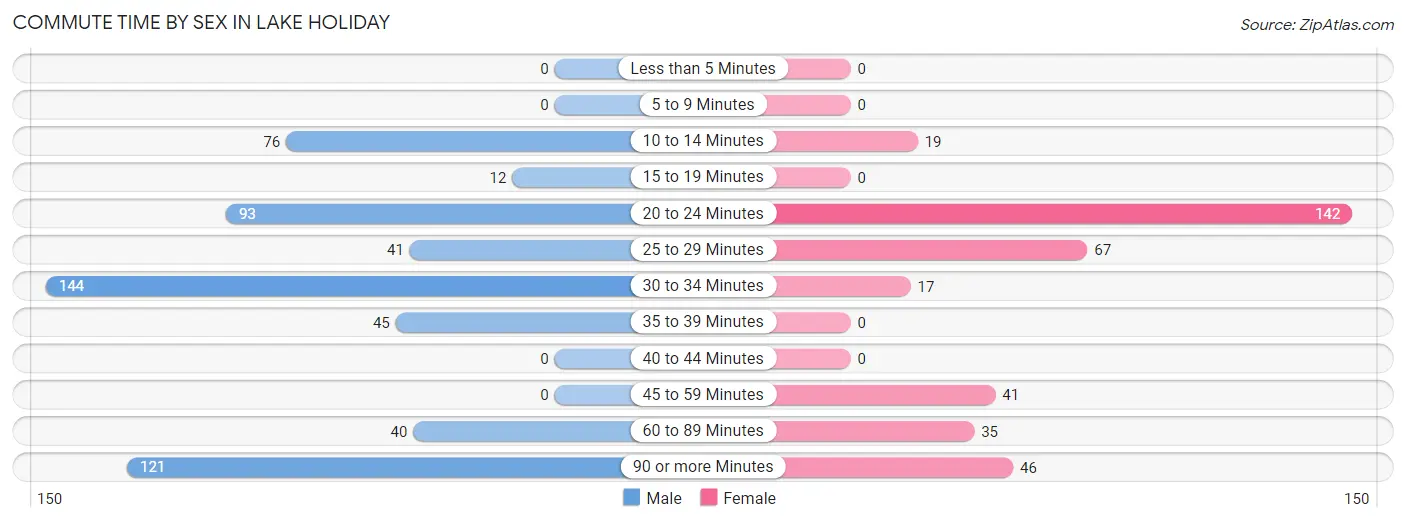
| Commute Time | Male | Female |
| Less than 5 Minutes | 0 (0.0%) | 0 (0.0%) |
| 5 to 9 Minutes | 0 (0.0%) | 0 (0.0%) |
| 10 to 14 Minutes | 76 (13.3%) | 19 (5.2%) |
| 15 to 19 Minutes | 12 (2.1%) | 0 (0.0%) |
| 20 to 24 Minutes | 93 (16.3%) | 142 (38.7%) |
| 25 to 29 Minutes | 41 (7.2%) | 67 (18.3%) |
| 30 to 34 Minutes | 144 (25.2%) | 17 (4.6%) |
| 35 to 39 Minutes | 45 (7.9%) | 0 (0.0%) |
| 40 to 44 Minutes | 0 (0.0%) | 0 (0.0%) |
| 45 to 59 Minutes | 0 (0.0%) | 41 (11.2%) |
| 60 to 89 Minutes | 40 (7.0%) | 35 (9.5%) |
| 90 or more Minutes | 121 (21.1%) | 46 (12.5%) |
Time of Departure to Work by Sex in Lake Holiday
The most frequent times of departure to work in Lake Holiday are 7:30 AM to 7:59 AM (139, 24.3%) for males and 7:30 AM to 7:59 AM (108, 29.4%) for females.
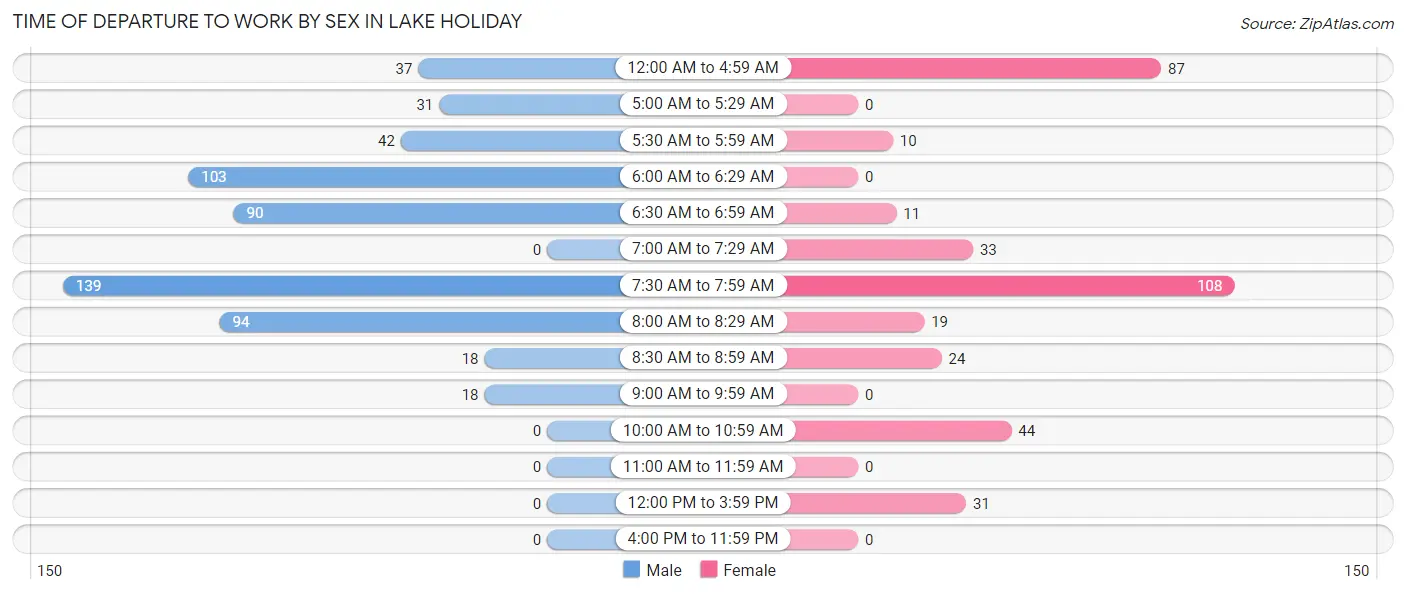
| Time of Departure | Male | Female |
| 12:00 AM to 4:59 AM | 37 (6.5%) | 87 (23.7%) |
| 5:00 AM to 5:29 AM | 31 (5.4%) | 0 (0.0%) |
| 5:30 AM to 5:59 AM | 42 (7.3%) | 10 (2.7%) |
| 6:00 AM to 6:29 AM | 103 (18.0%) | 0 (0.0%) |
| 6:30 AM to 6:59 AM | 90 (15.7%) | 11 (3.0%) |
| 7:00 AM to 7:29 AM | 0 (0.0%) | 33 (9.0%) |
| 7:30 AM to 7:59 AM | 139 (24.3%) | 108 (29.4%) |
| 8:00 AM to 8:29 AM | 94 (16.4%) | 19 (5.2%) |
| 8:30 AM to 8:59 AM | 18 (3.2%) | 24 (6.5%) |
| 9:00 AM to 9:59 AM | 18 (3.2%) | 0 (0.0%) |
| 10:00 AM to 10:59 AM | 0 (0.0%) | 44 (12.0%) |
| 11:00 AM to 11:59 AM | 0 (0.0%) | 0 (0.0%) |
| 12:00 PM to 3:59 PM | 0 (0.0%) | 31 (8.5%) |
| 4:00 PM to 11:59 PM | 0 (0.0%) | 0 (0.0%) |
| Total | 572 (100.0%) | 367 (100.0%) |
Housing Occupancy in Lake Holiday
Occupancy by Ownership in Lake Holiday
Of the total 835 dwellings in Lake Holiday, owner-occupied units account for 773 (92.6%), while renter-occupied units make up 62 (7.4%).
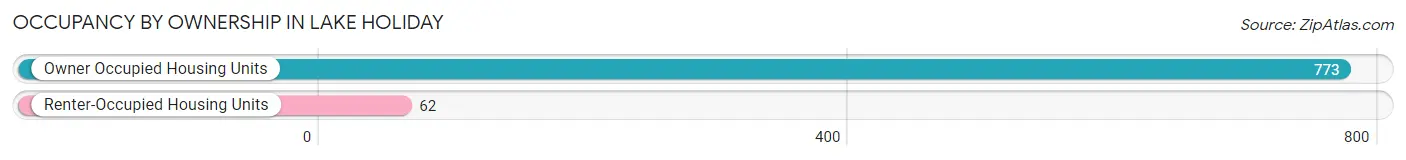
| Occupancy | # Housing Units | % Housing Units |
| Owner Occupied Housing Units | 773 | 92.6% |
| Renter-Occupied Housing Units | 62 | 7.4% |
| Total Occupied Housing Units | 835 | 100.0% |
Occupancy by Household Size in Lake Holiday
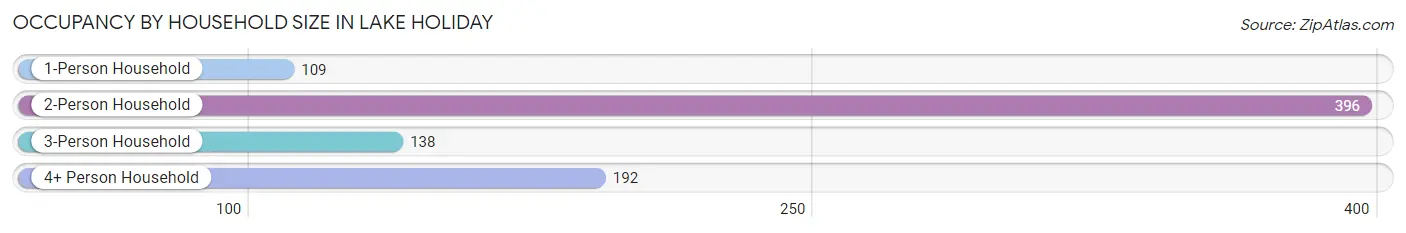
| Household Size | # Housing Units | % Housing Units |
| 1-Person Household | 109 | 13.1% |
| 2-Person Household | 396 | 47.4% |
| 3-Person Household | 138 | 16.5% |
| 4+ Person Household | 192 | 23.0% |
| Total Housing Units | 835 | 100.0% |
Occupancy by Ownership by Household Size in Lake Holiday
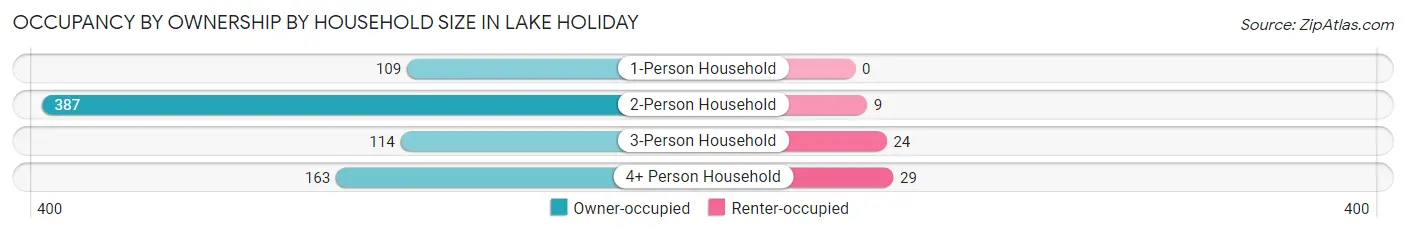
| Household Size | Owner-occupied | Renter-occupied |
| 1-Person Household | 109 (100.0%) | 0 (0.0%) |
| 2-Person Household | 387 (97.7%) | 9 (2.3%) |
| 3-Person Household | 114 (82.6%) | 24 (17.4%) |
| 4+ Person Household | 163 (84.9%) | 29 (15.1%) |
| Total Housing Units | 773 (92.6%) | 62 (7.4%) |
Occupancy by Educational Attainment in Lake Holiday
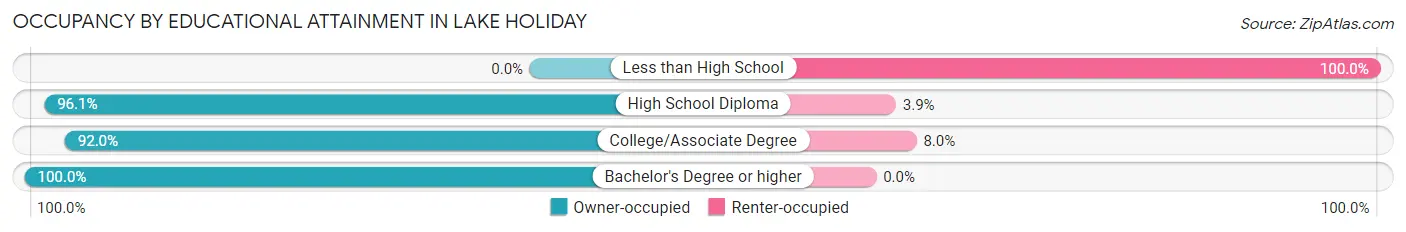
| Household Size | Owner-occupied | Renter-occupied |
| Less than High School | 0 (0.0%) | 24 (100.0%) |
| High School Diploma | 222 (96.1%) | 9 (3.9%) |
| College/Associate Degree | 334 (92.0%) | 29 (8.0%) |
| Bachelor's Degree or higher | 217 (100.0%) | 0 (0.0%) |
Occupancy by Age of Householder in Lake Holiday
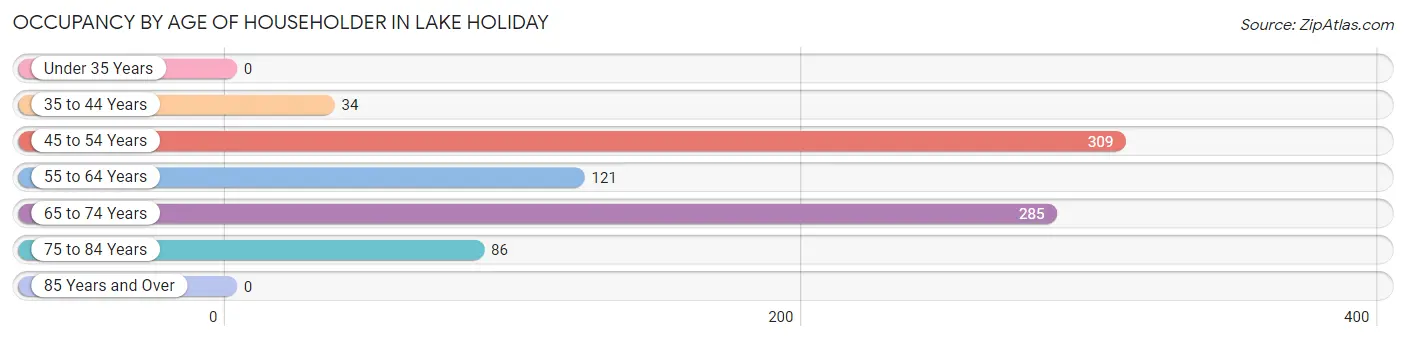
| Age Bracket | # Households | % Households |
| Under 35 Years | 0 | 0.0% |
| 35 to 44 Years | 34 | 4.1% |
| 45 to 54 Years | 309 | 37.0% |
| 55 to 64 Years | 121 | 14.5% |
| 65 to 74 Years | 285 | 34.1% |
| 75 to 84 Years | 86 | 10.3% |
| 85 Years and Over | 0 | 0.0% |
| Total | 835 | 100.0% |
Housing Finances in Lake Holiday
Median Income by Occupancy in Lake Holiday
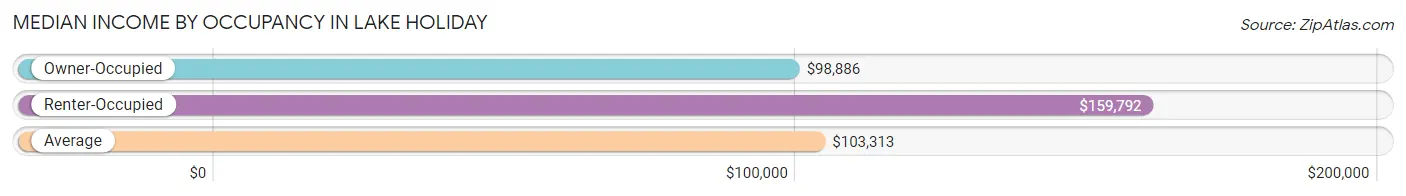
| Occupancy Type | # Households | Median Income |
| Owner-Occupied | 773 (92.6%) | $98,886 |
| Renter-Occupied | 62 (7.4%) | $159,792 |
| Average | 835 (100.0%) | $103,313 |
Occupancy by Householder Income Bracket in Lake Holiday
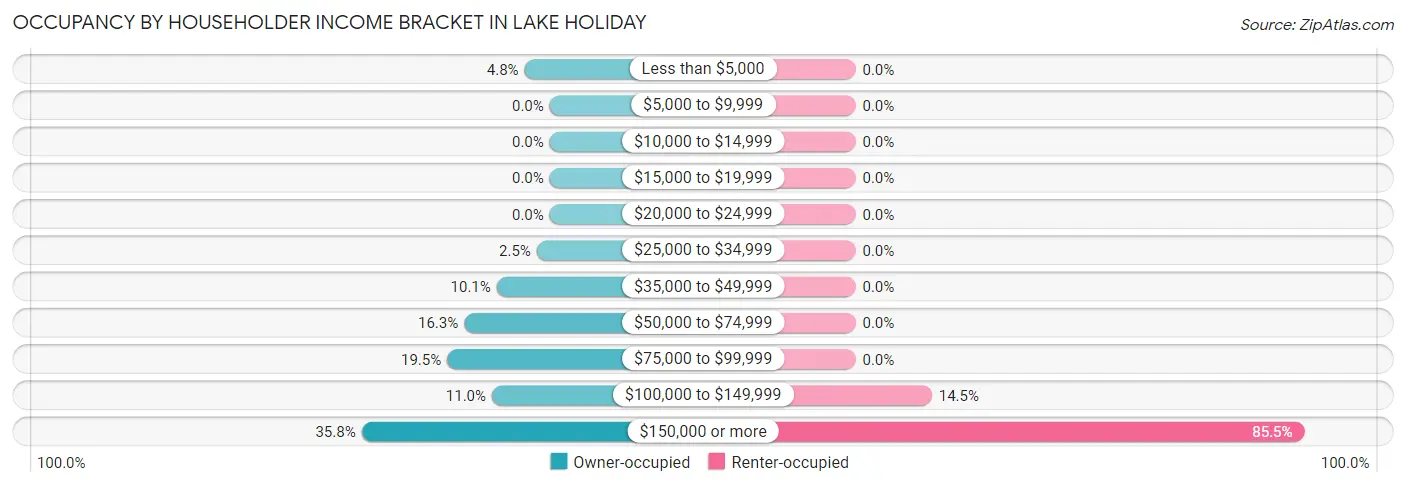
| Income Bracket | Owner-occupied | Renter-occupied |
| Less than $5,000 | 37 (4.8%) | 0 (0.0%) |
| $5,000 to $9,999 | 0 (0.0%) | 0 (0.0%) |
| $10,000 to $14,999 | 0 (0.0%) | 0 (0.0%) |
| $15,000 to $19,999 | 0 (0.0%) | 0 (0.0%) |
| $20,000 to $24,999 | 0 (0.0%) | 0 (0.0%) |
| $25,000 to $34,999 | 19 (2.5%) | 0 (0.0%) |
| $35,000 to $49,999 | 78 (10.1%) | 0 (0.0%) |
| $50,000 to $74,999 | 126 (16.3%) | 0 (0.0%) |
| $75,000 to $99,999 | 151 (19.5%) | 0 (0.0%) |
| $100,000 to $149,999 | 85 (11.0%) | 9 (14.5%) |
| $150,000 or more | 277 (35.8%) | 53 (85.5%) |
| Total | 773 (100.0%) | 62 (100.0%) |
Monthly Housing Cost Tiers in Lake Holiday
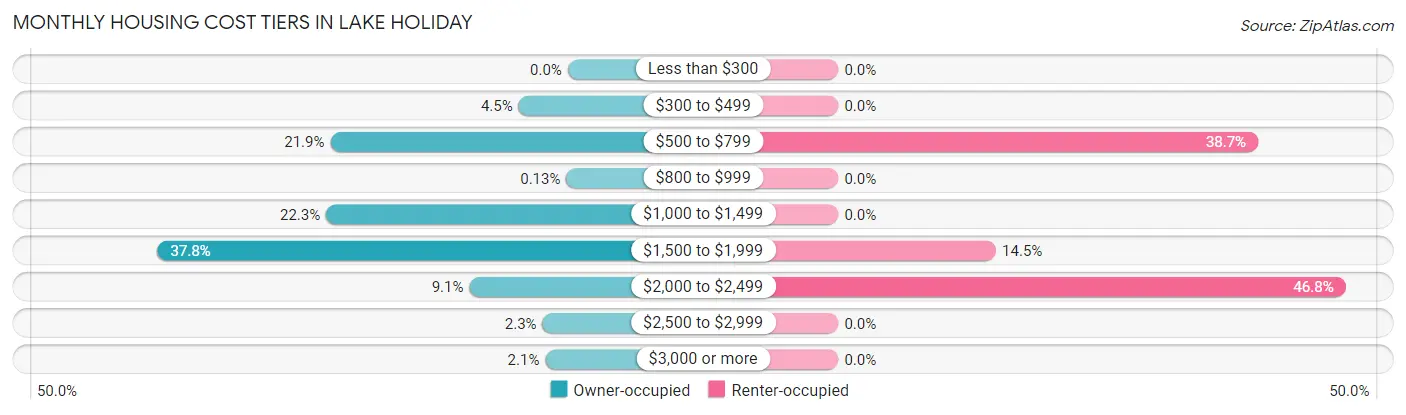
| Monthly Cost | Owner-occupied | Renter-occupied |
| Less than $300 | 0 (0.0%) | 0 (0.0%) |
| $300 to $499 | 35 (4.5%) | 0 (0.0%) |
| $500 to $799 | 169 (21.9%) | 24 (38.7%) |
| $800 to $999 | 1 (0.1%) | 0 (0.0%) |
| $1,000 to $1,499 | 172 (22.3%) | 0 (0.0%) |
| $1,500 to $1,999 | 292 (37.8%) | 9 (14.5%) |
| $2,000 to $2,499 | 70 (9.1%) | 29 (46.8%) |
| $2,500 to $2,999 | 18 (2.3%) | 0 (0.0%) |
| $3,000 or more | 16 (2.1%) | 0 (0.0%) |
| Total | 773 (100.0%) | 62 (100.0%) |
Physical Housing Characteristics in Lake Holiday
Housing Structures in Lake Holiday
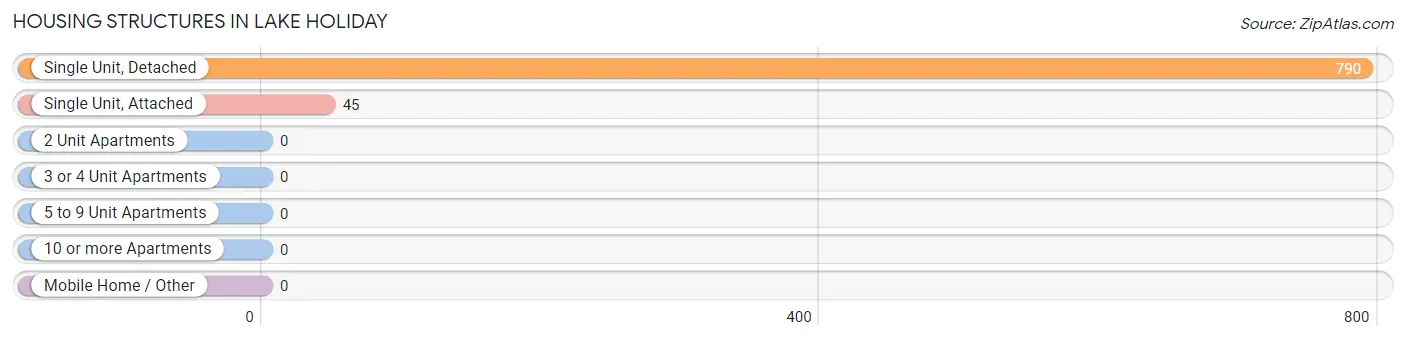
| Structure Type | # Housing Units | % Housing Units |
| Single Unit, Detached | 790 | 94.6% |
| Single Unit, Attached | 45 | 5.4% |
| 2 Unit Apartments | 0 | 0.0% |
| 3 or 4 Unit Apartments | 0 | 0.0% |
| 5 to 9 Unit Apartments | 0 | 0.0% |
| 10 or more Apartments | 0 | 0.0% |
| Mobile Home / Other | 0 | 0.0% |
| Total | 835 | 100.0% |
Housing Structures by Occupancy in Lake Holiday
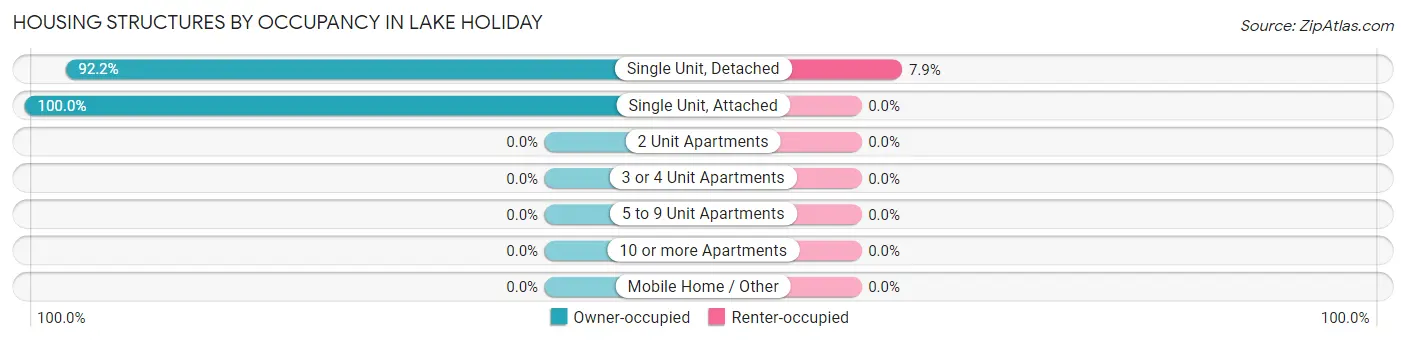
| Structure Type | Owner-occupied | Renter-occupied |
| Single Unit, Detached | 728 (92.1%) | 62 (7.9%) |
| Single Unit, Attached | 45 (100.0%) | 0 (0.0%) |
| 2 Unit Apartments | 0 (0.0%) | 0 (0.0%) |
| 3 or 4 Unit Apartments | 0 (0.0%) | 0 (0.0%) |
| 5 to 9 Unit Apartments | 0 (0.0%) | 0 (0.0%) |
| 10 or more Apartments | 0 (0.0%) | 0 (0.0%) |
| Mobile Home / Other | 0 (0.0%) | 0 (0.0%) |
| Total | 773 (92.6%) | 62 (7.4%) |
Housing Structures by Number of Rooms in Lake Holiday
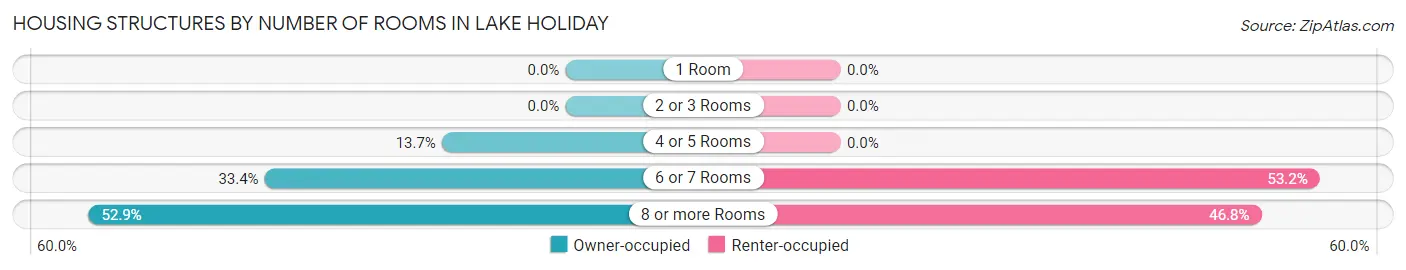
| Number of Rooms | Owner-occupied | Renter-occupied |
| 1 Room | 0 (0.0%) | 0 (0.0%) |
| 2 or 3 Rooms | 0 (0.0%) | 0 (0.0%) |
| 4 or 5 Rooms | 106 (13.7%) | 0 (0.0%) |
| 6 or 7 Rooms | 258 (33.4%) | 33 (53.2%) |
| 8 or more Rooms | 409 (52.9%) | 29 (46.8%) |
| Total | 773 (100.0%) | 62 (100.0%) |
Housing Structure by Heating Type in Lake Holiday
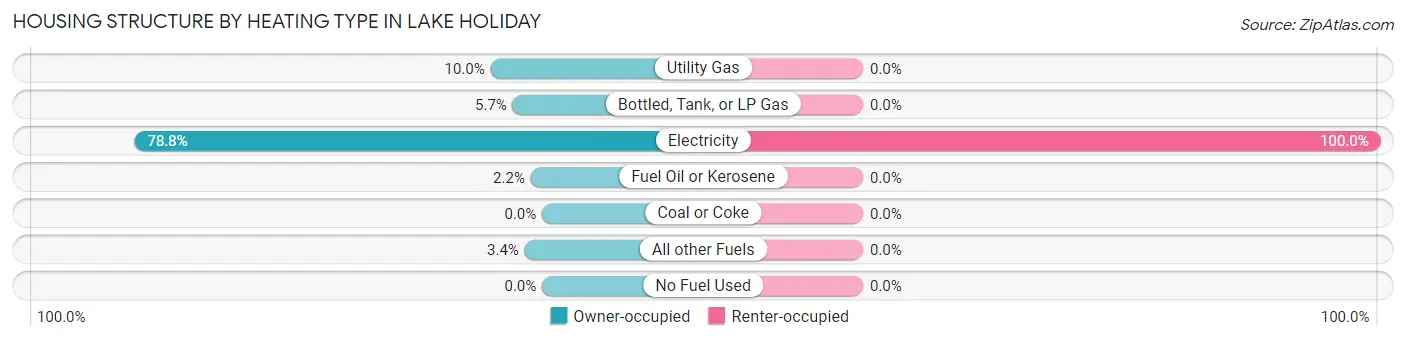
| Heating Type | Owner-occupied | Renter-occupied |
| Utility Gas | 77 (10.0%) | 0 (0.0%) |
| Bottled, Tank, or LP Gas | 44 (5.7%) | 0 (0.0%) |
| Electricity | 609 (78.8%) | 62 (100.0%) |
| Fuel Oil or Kerosene | 17 (2.2%) | 0 (0.0%) |
| Coal or Coke | 0 (0.0%) | 0 (0.0%) |
| All other Fuels | 26 (3.4%) | 0 (0.0%) |
| No Fuel Used | 0 (0.0%) | 0 (0.0%) |
| Total | 773 (100.0%) | 62 (100.0%) |
Household Vehicle Usage in Lake Holiday
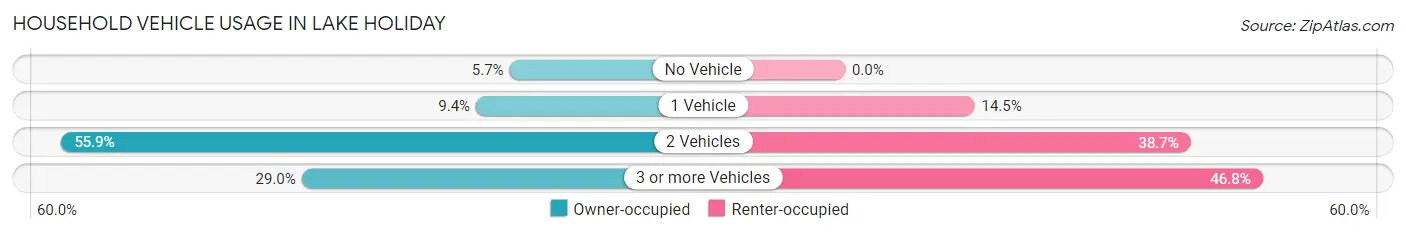
| Vehicles per Household | Owner-occupied | Renter-occupied |
| No Vehicle | 44 (5.7%) | 0 (0.0%) |
| 1 Vehicle | 73 (9.4%) | 9 (14.5%) |
| 2 Vehicles | 432 (55.9%) | 24 (38.7%) |
| 3 or more Vehicles | 224 (29.0%) | 29 (46.8%) |
| Total | 773 (100.0%) | 62 (100.0%) |
Real Estate & Mortgages in Lake Holiday
Real Estate and Mortgage Overview in Lake Holiday
| Characteristic | Without Mortgage | With Mortgage |
| Housing Units | 169 | 604 |
| Median Property Value | $275,600 | $243,200 |
| Median Household Income | - | - |
| Monthly Housing Costs | $709 | $16 |
| Real Estate Taxes | $1,841 | $0 |
Property Value by Mortgage Status in Lake Holiday
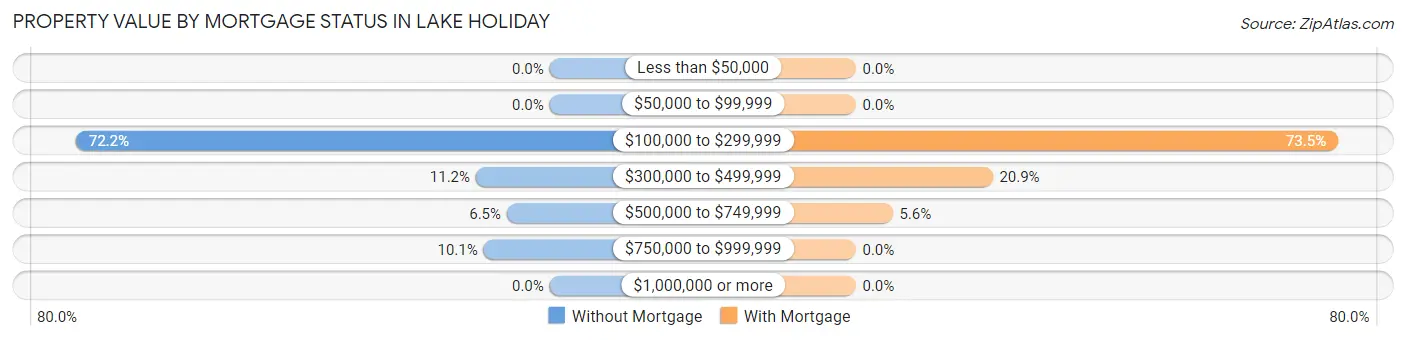
| Property Value | Without Mortgage | With Mortgage |
| Less than $50,000 | 0 (0.0%) | 0 (0.0%) |
| $50,000 to $99,999 | 0 (0.0%) | 0 (0.0%) |
| $100,000 to $299,999 | 122 (72.2%) | 444 (73.5%) |
| $300,000 to $499,999 | 19 (11.2%) | 126 (20.9%) |
| $500,000 to $749,999 | 11 (6.5%) | 34 (5.6%) |
| $750,000 to $999,999 | 17 (10.1%) | 0 (0.0%) |
| $1,000,000 or more | 0 (0.0%) | 0 (0.0%) |
| Total | 169 (100.0%) | 604 (100.0%) |
Household Income by Mortgage Status in Lake Holiday
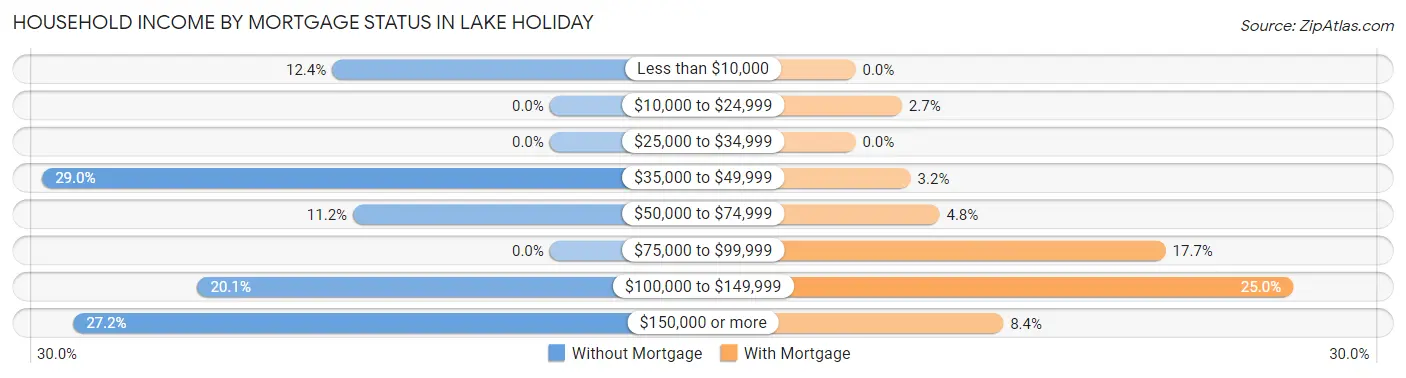
| Household Income | Without Mortgage | With Mortgage |
| Less than $10,000 | 21 (12.4%) | 0 (0.0%) |
| $10,000 to $24,999 | 0 (0.0%) | 16 (2.6%) |
| $25,000 to $34,999 | 0 (0.0%) | 0 (0.0%) |
| $35,000 to $49,999 | 49 (29.0%) | 19 (3.2%) |
| $50,000 to $74,999 | 19 (11.2%) | 29 (4.8%) |
| $75,000 to $99,999 | 0 (0.0%) | 107 (17.7%) |
| $100,000 to $149,999 | 34 (20.1%) | 151 (25.0%) |
| $150,000 or more | 46 (27.2%) | 51 (8.4%) |
| Total | 169 (100.0%) | 604 (100.0%) |
Property Value to Household Income Ratio in Lake Holiday
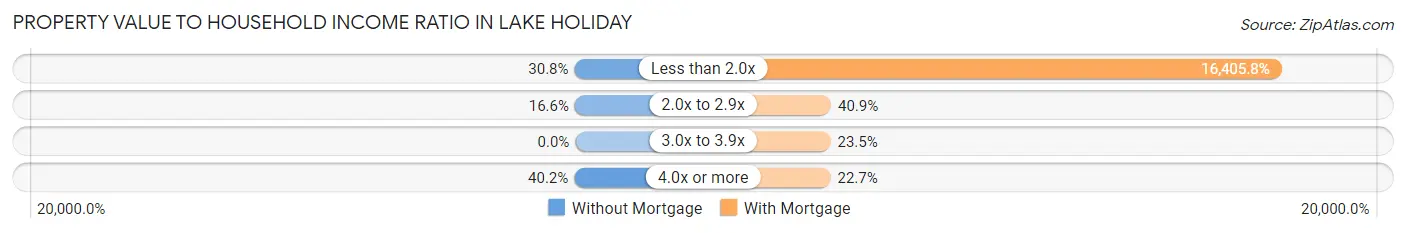
| Value-to-Income Ratio | Without Mortgage | With Mortgage |
| Less than 2.0x | 52 (30.8%) | 99,091 (16,405.8%) |
| 2.0x to 2.9x | 28 (16.6%) | 247 (40.9%) |
| 3.0x to 3.9x | 0 (0.0%) | 142 (23.5%) |
| 4.0x or more | 68 (40.2%) | 137 (22.7%) |
| Total | 169 (100.0%) | 604 (100.0%) |
Real Estate Taxes by Mortgage Status in Lake Holiday
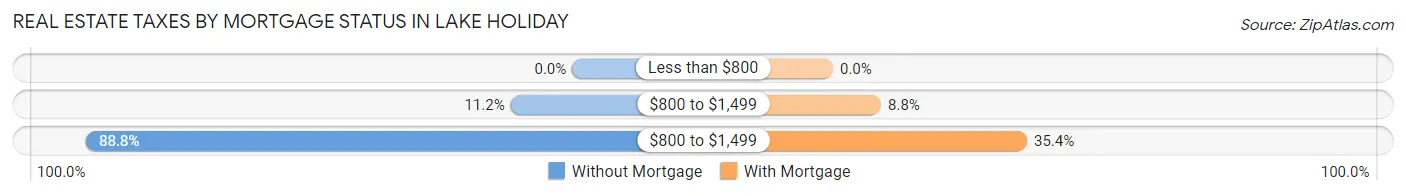
| Property Taxes | Without Mortgage | With Mortgage |
| Less than $800 | 0 (0.0%) | 0 (0.0%) |
| $800 to $1,499 | 19 (11.2%) | 53 (8.8%) |
| $800 to $1,499 | 150 (88.8%) | 214 (35.4%) |
| Total | 169 (100.0%) | 604 (100.0%) |
Health & Disability in Lake Holiday
Health Insurance Coverage by Age in Lake Holiday
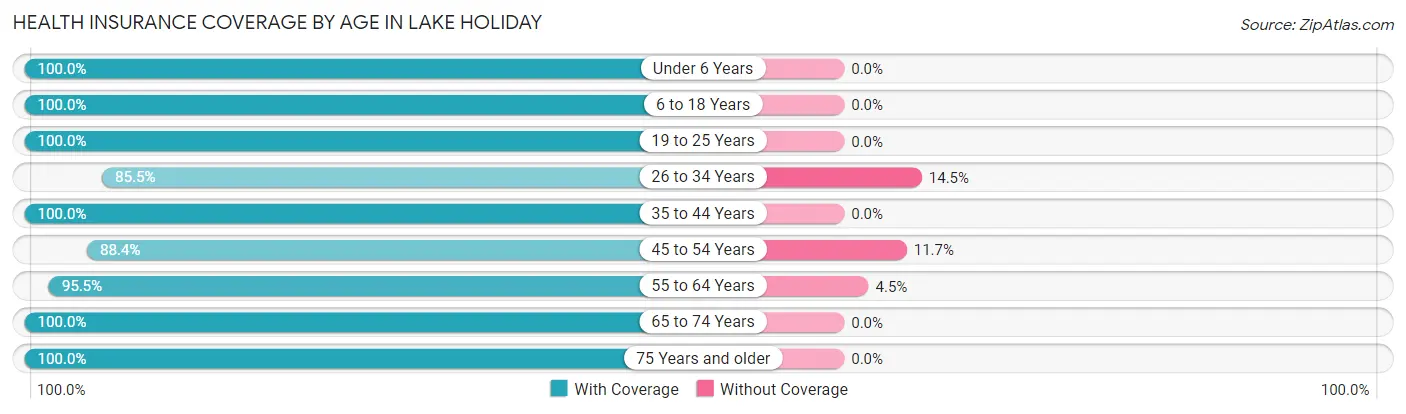
| Age Bracket | With Coverage | Without Coverage |
| Under 6 Years | 42 (100.0%) | 0 (0.0%) |
| 6 to 18 Years | 420 (100.0%) | 0 (0.0%) |
| 19 to 25 Years | 169 (100.0%) | 0 (0.0%) |
| 26 to 34 Years | 65 (85.5%) | 11 (14.5%) |
| 35 to 44 Years | 140 (100.0%) | 0 (0.0%) |
| 45 to 54 Years | 402 (88.3%) | 53 (11.7%) |
| 55 to 64 Years | 253 (95.5%) | 12 (4.5%) |
| 65 to 74 Years | 441 (100.0%) | 0 (0.0%) |
| 75 Years and older | 178 (100.0%) | 0 (0.0%) |
| Total | 2,110 (96.5%) | 76 (3.5%) |
Health Insurance Coverage by Citizenship Status in Lake Holiday
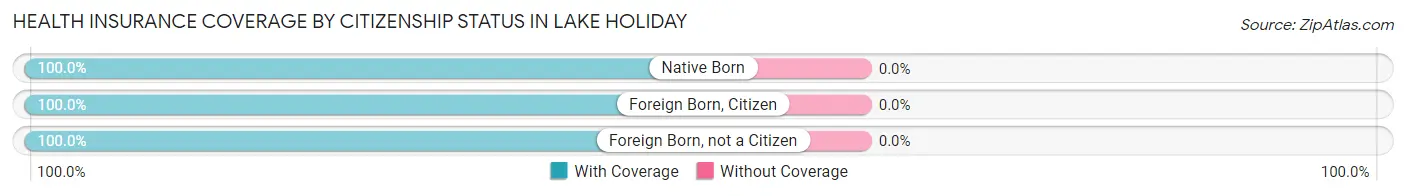
| Citizenship Status | With Coverage | Without Coverage |
| Native Born | 42 (100.0%) | 0 (0.0%) |
| Foreign Born, Citizen | 420 (100.0%) | 0 (0.0%) |
| Foreign Born, not a Citizen | 169 (100.0%) | 0 (0.0%) |
Health Insurance Coverage by Household Income in Lake Holiday
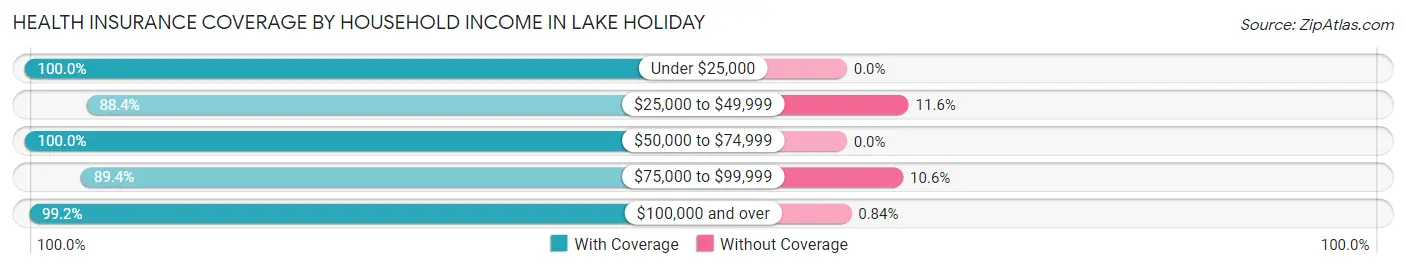
| Household Income | With Coverage | Without Coverage |
| Under $25,000 | 55 (100.0%) | 0 (0.0%) |
| $25,000 to $49,999 | 122 (88.4%) | 16 (11.6%) |
| $50,000 to $74,999 | 220 (100.0%) | 0 (0.0%) |
| $75,000 to $99,999 | 415 (89.4%) | 49 (10.6%) |
| $100,000 and over | 1,298 (99.2%) | 11 (0.8%) |
Public vs Private Health Insurance Coverage by Age in Lake Holiday
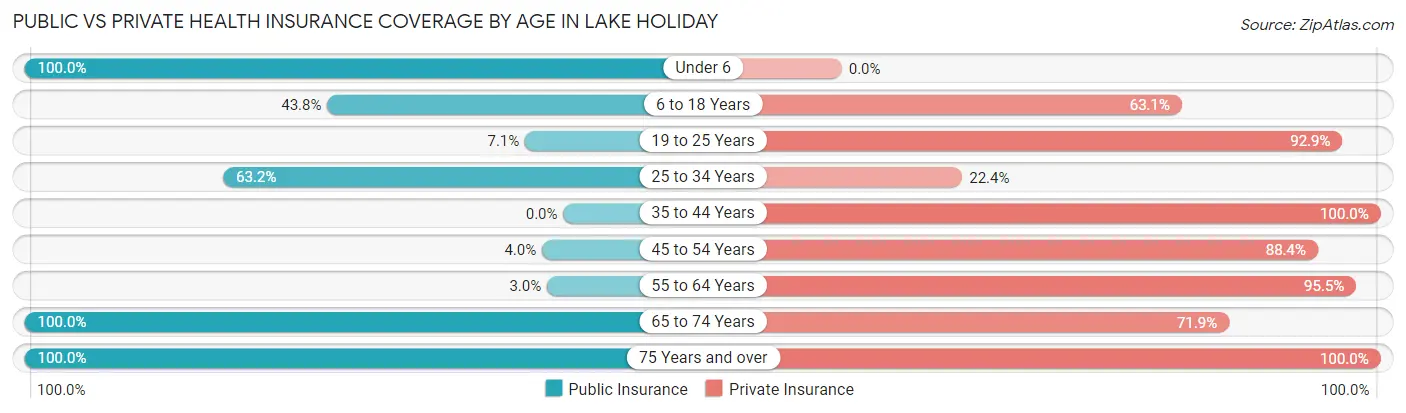
| Age Bracket | Public Insurance | Private Insurance |
| Under 6 | 42 (100.0%) | 0 (0.0%) |
| 6 to 18 Years | 184 (43.8%) | 265 (63.1%) |
| 19 to 25 Years | 12 (7.1%) | 157 (92.9%) |
| 25 to 34 Years | 48 (63.2%) | 17 (22.4%) |
| 35 to 44 Years | 0 (0.0%) | 140 (100.0%) |
| 45 to 54 Years | 18 (4.0%) | 402 (88.3%) |
| 55 to 64 Years | 8 (3.0%) | 253 (95.5%) |
| 65 to 74 Years | 441 (100.0%) | 317 (71.9%) |
| 75 Years and over | 178 (100.0%) | 178 (100.0%) |
| Total | 931 (42.6%) | 1,729 (79.1%) |
Disability Status by Sex by Age in Lake Holiday
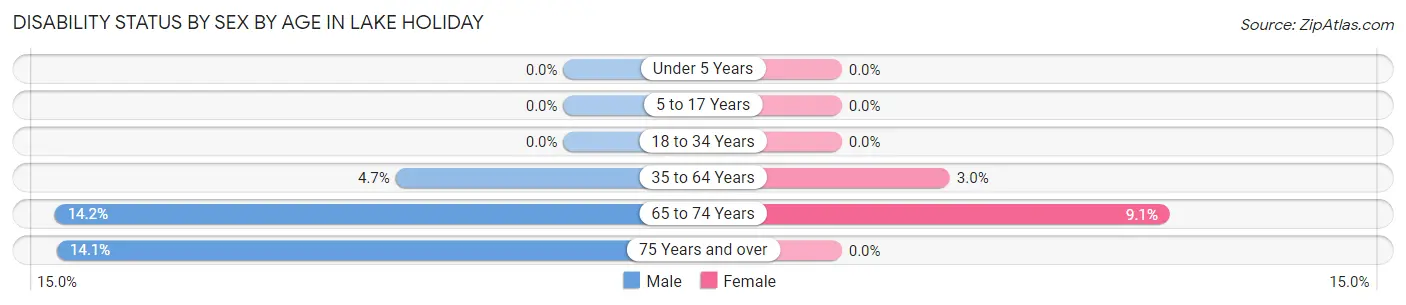
| Age Bracket | Male | Female |
| Under 5 Years | 0 (0.0%) | 0 (0.0%) |
| 5 to 17 Years | 0 (0.0%) | 0 (0.0%) |
| 18 to 34 Years | 0 (0.0%) | 0 (0.0%) |
| 35 to 64 Years | 20 (4.7%) | 13 (3.0%) |
| 65 to 74 Years | 33 (14.2%) | 19 (9.1%) |
| 75 Years and over | 11 (14.1%) | 0 (0.0%) |
Disability Class by Sex by Age in Lake Holiday
Disability Class: Hearing Difficulty
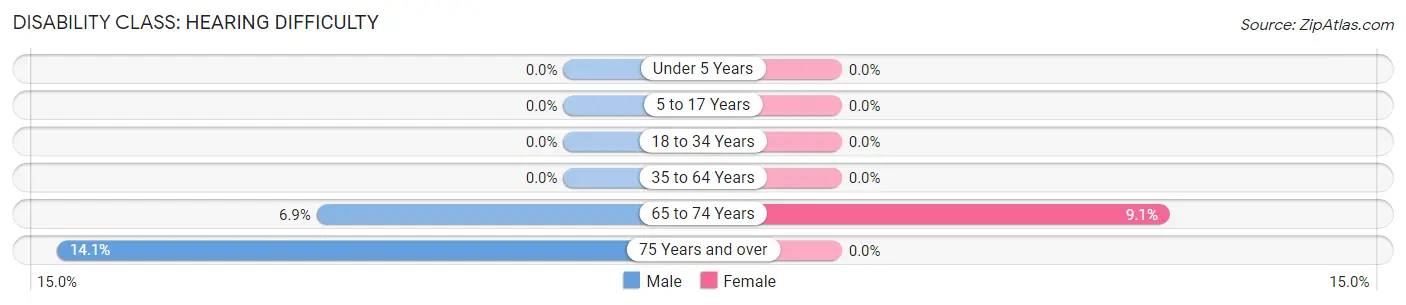
| Age Bracket | Male | Female |
| Under 5 Years | 0 (0.0%) | 0 (0.0%) |
| 5 to 17 Years | 0 (0.0%) | 0 (0.0%) |
| 18 to 34 Years | 0 (0.0%) | 0 (0.0%) |
| 35 to 64 Years | 0 (0.0%) | 0 (0.0%) |
| 65 to 74 Years | 16 (6.9%) | 19 (9.1%) |
| 75 Years and over | 11 (14.1%) | 0 (0.0%) |
Disability Class: Vision Difficulty
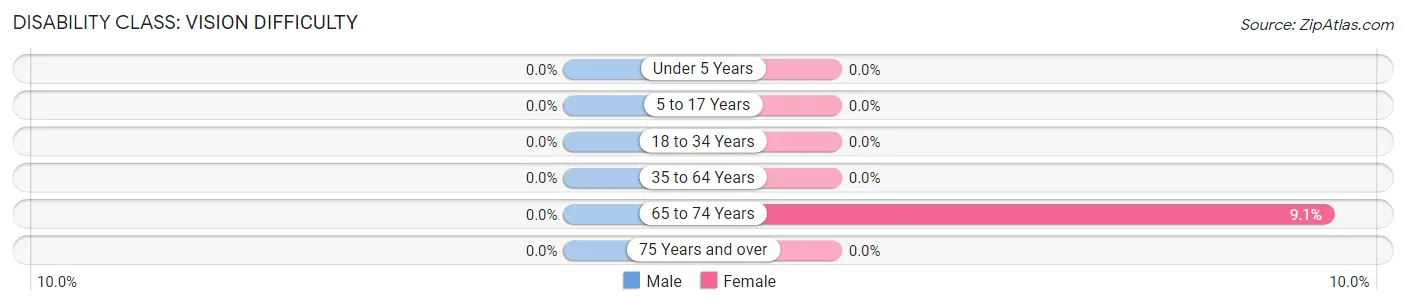
| Age Bracket | Male | Female |
| Under 5 Years | 0 (0.0%) | 0 (0.0%) |
| 5 to 17 Years | 0 (0.0%) | 0 (0.0%) |
| 18 to 34 Years | 0 (0.0%) | 0 (0.0%) |
| 35 to 64 Years | 0 (0.0%) | 0 (0.0%) |
| 65 to 74 Years | 0 (0.0%) | 19 (9.1%) |
| 75 Years and over | 0 (0.0%) | 0 (0.0%) |
Disability Class: Cognitive Difficulty
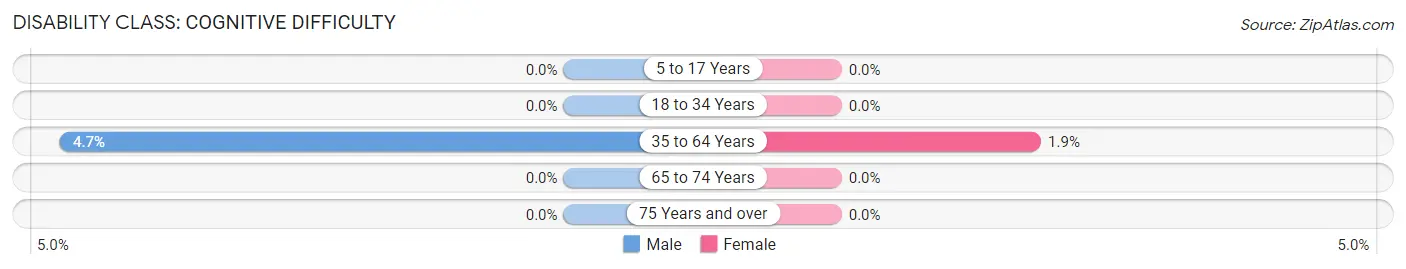
| Age Bracket | Male | Female |
| 5 to 17 Years | 0 (0.0%) | 0 (0.0%) |
| 18 to 34 Years | 0 (0.0%) | 0 (0.0%) |
| 35 to 64 Years | 20 (4.7%) | 8 (1.8%) |
| 65 to 74 Years | 0 (0.0%) | 0 (0.0%) |
| 75 Years and over | 0 (0.0%) | 0 (0.0%) |
Disability Class: Ambulatory Difficulty
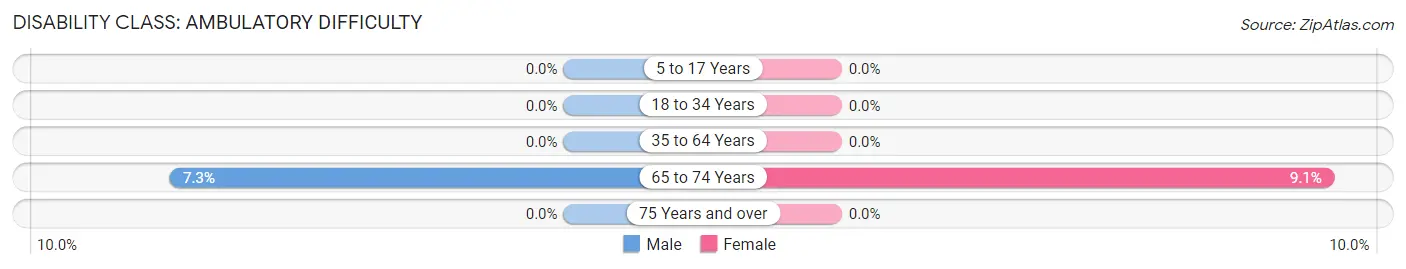
| Age Bracket | Male | Female |
| 5 to 17 Years | 0 (0.0%) | 0 (0.0%) |
| 18 to 34 Years | 0 (0.0%) | 0 (0.0%) |
| 35 to 64 Years | 0 (0.0%) | 0 (0.0%) |
| 65 to 74 Years | 17 (7.3%) | 19 (9.1%) |
| 75 Years and over | 0 (0.0%) | 0 (0.0%) |
Disability Class: Self-Care Difficulty
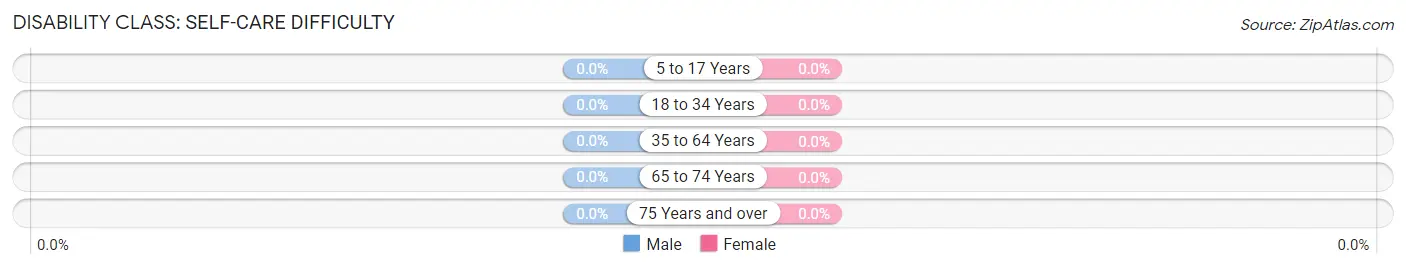
| Age Bracket | Male | Female |
| 5 to 17 Years | 0 (0.0%) | 0 (0.0%) |
| 18 to 34 Years | 0 (0.0%) | 0 (0.0%) |
| 35 to 64 Years | 0 (0.0%) | 0 (0.0%) |
| 65 to 74 Years | 0 (0.0%) | 0 (0.0%) |
| 75 Years and over | 0 (0.0%) | 0 (0.0%) |
Technology Access in Lake Holiday
Computing Device Access in Lake Holiday
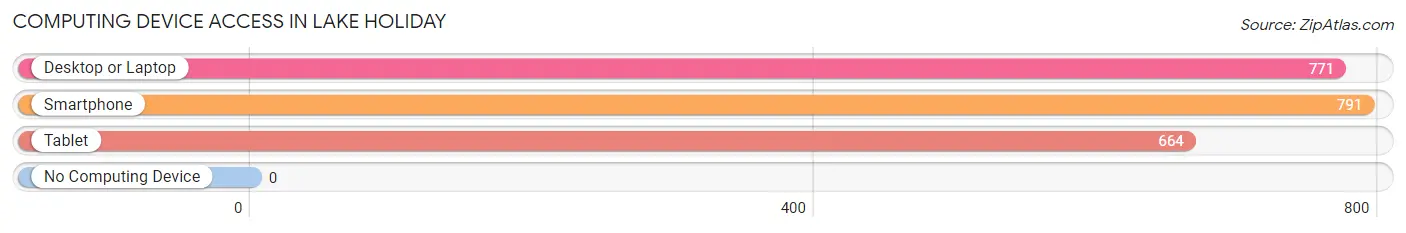
| Device Type | # Households | % Households |
| Desktop or Laptop | 771 | 92.3% |
| Smartphone | 791 | 94.7% |
| Tablet | 664 | 79.5% |
| No Computing Device | 0 | 0.0% |
| Total | 835 | 100.0% |
Internet Access in Lake Holiday
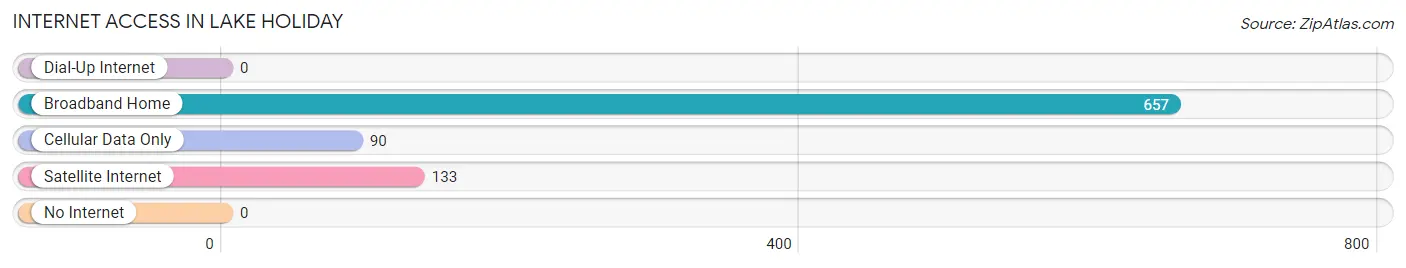
| Internet Type | # Households | % Households |
| Dial-Up Internet | 0 | 0.0% |
| Broadband Home | 657 | 78.7% |
| Cellular Data Only | 90 | 10.8% |
| Satellite Internet | 133 | 15.9% |
| No Internet | 0 | 0.0% |
| Total | 835 | 100.0% |
Lake Holiday Summary
History
Lake Holiday is a private lake community located in the northern part of Virginia, in the county of Loudoun. It is situated in the foothills of the Blue Ridge Mountains, and is surrounded by the towns of Purcellville, Round Hill, and Hamilton. The community was founded in the late 1950s by a group of investors who wanted to create a recreational area for families to enjoy. The lake was created by damming a small stream, and the community was built around it.
The first homes were built in the early 1960s, and the community has grown steadily since then. The lake is now home to over 500 homes, and the community has its own clubhouse, marina, and beach. The community also has a golf course, tennis courts, and a swimming pool.
The community is governed by the Lake Holiday Property Owners Association, which is responsible for maintaining the lake and the surrounding area. The association also enforces the rules and regulations of the community, and is responsible for the safety and security of the residents.
Geography
Lake Holiday is located in the northern part of Virginia, in the county of Loudoun. It is situated in the foothills of the Blue Ridge Mountains, and is surrounded by the towns of Purcellville, Round Hill, and Hamilton. The lake is approximately two miles long and one mile wide, and is fed by a small stream. The lake is surrounded by wooded hills and valleys, and is a popular spot for fishing, swimming, and boating.
The climate in Lake Holiday is typical of the mid-Atlantic region, with hot summers and cold winters. The average temperature in the summer is around 80 degrees Fahrenheit, and the average temperature in the winter is around 40 degrees Fahrenheit.
Economy
The economy of Lake Holiday is largely based on tourism and recreation. The lake is a popular destination for fishing, swimming, and boating, and the community also has a golf course, tennis courts, and a swimming pool. The community also has a marina, which provides boat rentals and other services.
The community also has a number of small businesses, including restaurants, convenience stores, and other retail establishments. The community also has a number of professional services, such as doctors, lawyers, and accountants.
Demographics
As of the 2010 census, the population of Lake Holiday was 1,845. The population is predominantly white (94.3%), with a small percentage of African Americans (2.3%), Asians (1.2%), and other races (2.2%). The median age of the population is 44.7 years, and the median household income is $90,945.
The majority of the population is married (60.2%), and the majority of households have children (60.2%). The majority of the population is employed (76.2%), and the majority of the population has a college degree (44.2%).
Conclusion
Lake Holiday is a private lake community located in the northern part of Virginia, in the county of Loudoun. It is situated in the foothills of the Blue Ridge Mountains, and is surrounded by the towns of Purcellville, Round Hill, and Hamilton. The community was founded in the late 1950s, and has grown steadily since then. The lake is now home to over 500 homes, and the community has its own clubhouse, marina, and beach. The economy of Lake Holiday is largely based on tourism and recreation, and the population is predominantly white.
Common Questions
What is Per Capita Income in Lake Holiday?
Per Capita income in Lake Holiday is $48,724.
What is the Median Family Income in Lake Holiday?
Median Family Income in Lake Holiday is $121,607.
What is the Median Household income in Lake Holiday?
Median Household Income in Lake Holiday is $103,313.
What is Income or Wage Gap in Lake Holiday?
Income or Wage Gap in Lake Holiday is 2.6%.
Women in Lake Holiday earn 97.4 cents for every dollar earned by a man.
What is Inequality or Gini Index in Lake Holiday?
Inequality or Gini Index in Lake Holiday is 0.35.
What is the Total Population of Lake Holiday?
Total Population of Lake Holiday is 2,233.
What is the Total Male Population of Lake Holiday?
Total Male Population of Lake Holiday is 1,006.
What is the Total Female Population of Lake Holiday?
Total Female Population of Lake Holiday is 1,227.
What is the Ratio of Males per 100 Females in Lake Holiday?
There are 81.99 Males per 100 Females in Lake Holiday.
What is the Ratio of Females per 100 Males in Lake Holiday?
There are 121.97 Females per 100 Males in Lake Holiday.
What is the Median Population Age in Lake Holiday?
Median Population Age in Lake Holiday is 51.6 Years.
What is the Average Family Size in Lake Holiday
Average Family Size in Lake Holiday is 2.9 People.
What is the Average Household Size in Lake Holiday
Average Household Size in Lake Holiday is 2.7 People.
How Large is the Labor Force in Lake Holiday?
There are 1,053 People in the Labor Forcein in Lake Holiday.
What is the Percentage of People in the Labor Force in Lake Holiday?
56.4% of People are in the Labor Force in Lake Holiday.
What is the Unemployment Rate in Lake Holiday?
Unemployment Rate in Lake Holiday is 1.8%.