Keller, VA Map & Demographics
Keller Map
Keller Overview
$13,657
PER CAPITA INCOME
$33,125
AVG FAMILY INCOME
$34,844
AVG HOUSEHOLD INCOME
0.29
INEQUALITY / GINI INDEX
286
TOTAL POPULATION
135
MALE POPULATION
151
FEMALE POPULATION
89.40
MALES / 100 FEMALES
111.85
FEMALES / 100 MALES
32.5
MEDIAN AGE
3.2
AVG FAMILY SIZE
2.4
AVG HOUSEHOLD SIZE
72
LABOR FORCE [ PEOPLE ]
44.7%
PERCENT IN LABOR FORCE
Keller Zip Codes
Keller Area Codes
Income in Keller
Income Overview in Keller
Per Capita Income in Keller is $13,657, while median incomes of families and households are $33,125 and $34,844 respectively.
| Characteristic | Number | Measure |
| Per Capita Income | 286 | $13,657 |
| Median Family Income | 72 | $33,125 |
| Mean Family Income | 72 | $31,215 |
| Median Household Income | 114 | $34,844 |
| Mean Household Income | 114 | $32,282 |
| Income Deficit | 72 | $0 |
| Wage / Income Gap (%) | 286 | 0.00% |
| Wage / Income Gap ($) | 286 | 100.00¢ per $1 |
| Gini / Inequality Index | 286 | 0.29 |
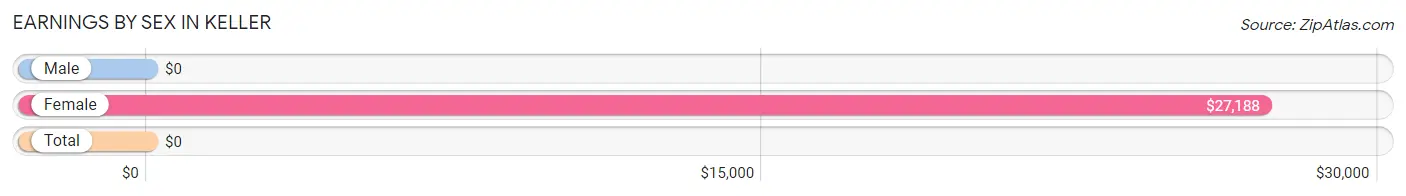
Earnings by Sex in Keller
| Sex | Number | Average Earnings |
| Male | 34 (46.6%) | $0 |
| Female | 39 (53.4%) | $27,188 |
| Total | 73 (100.0%) | $0 |
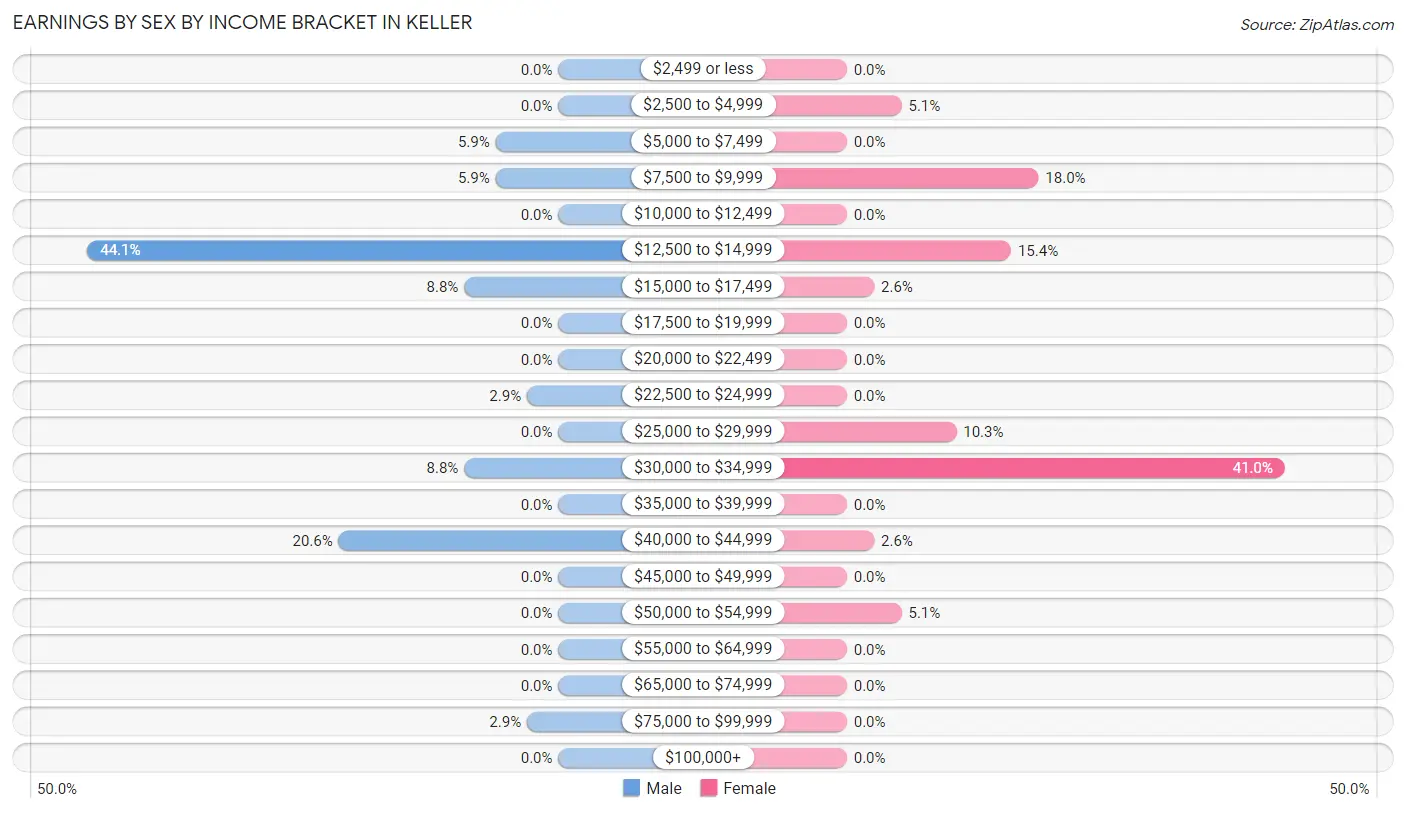
Earnings by Sex by Income Bracket in Keller
The most common earnings brackets in Keller are $12,500 to $14,999 for men (15 | 44.1%) and $30,000 to $34,999 for women (16 | 41.0%).
| Income | Male | Female |
| $2,499 or less | 0 (0.0%) | 0 (0.0%) |
| $2,500 to $4,999 | 0 (0.0%) | 2 (5.1%) |
| $5,000 to $7,499 | 2 (5.9%) | 0 (0.0%) |
| $7,500 to $9,999 | 2 (5.9%) | 7 (17.9%) |
| $10,000 to $12,499 | 0 (0.0%) | 0 (0.0%) |
| $12,500 to $14,999 | 15 (44.1%) | 6 (15.4%) |
| $15,000 to $17,499 | 3 (8.8%) | 1 (2.6%) |
| $17,500 to $19,999 | 0 (0.0%) | 0 (0.0%) |
| $20,000 to $22,499 | 0 (0.0%) | 0 (0.0%) |
| $22,500 to $24,999 | 1 (2.9%) | 0 (0.0%) |
| $25,000 to $29,999 | 0 (0.0%) | 4 (10.3%) |
| $30,000 to $34,999 | 3 (8.8%) | 16 (41.0%) |
| $35,000 to $39,999 | 0 (0.0%) | 0 (0.0%) |
| $40,000 to $44,999 | 7 (20.6%) | 1 (2.6%) |
| $45,000 to $49,999 | 0 (0.0%) | 0 (0.0%) |
| $50,000 to $54,999 | 0 (0.0%) | 2 (5.1%) |
| $55,000 to $64,999 | 0 (0.0%) | 0 (0.0%) |
| $65,000 to $74,999 | 0 (0.0%) | 0 (0.0%) |
| $75,000 to $99,999 | 1 (2.9%) | 0 (0.0%) |
| $100,000+ | 0 (0.0%) | 0 (0.0%) |
| Total | 34 (100.0%) | 39 (100.0%) |
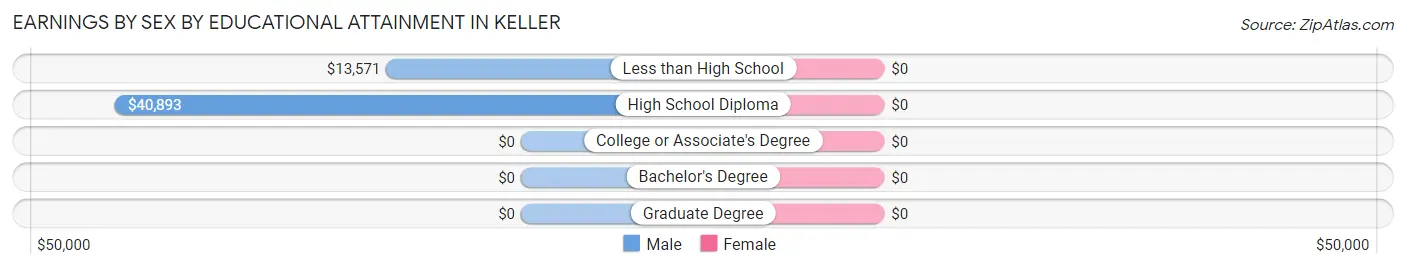
Earnings by Sex by Educational Attainment in Keller
| Educational Attainment | Male Income | Female Income |
| Less than High School | $13,571 | $0 |
| High School Diploma | $40,893 | $0 |
| College or Associate's Degree | - | - |
| Bachelor's Degree | - | - |
| Graduate Degree | - | - |
| Total | - | - |
Family Income in Keller
Family Income Brackets in Keller
According to the Keller family income data, there are 21 families falling into the less than $10,000 income range, which is the most common income bracket and makes up 29.2% of all families.
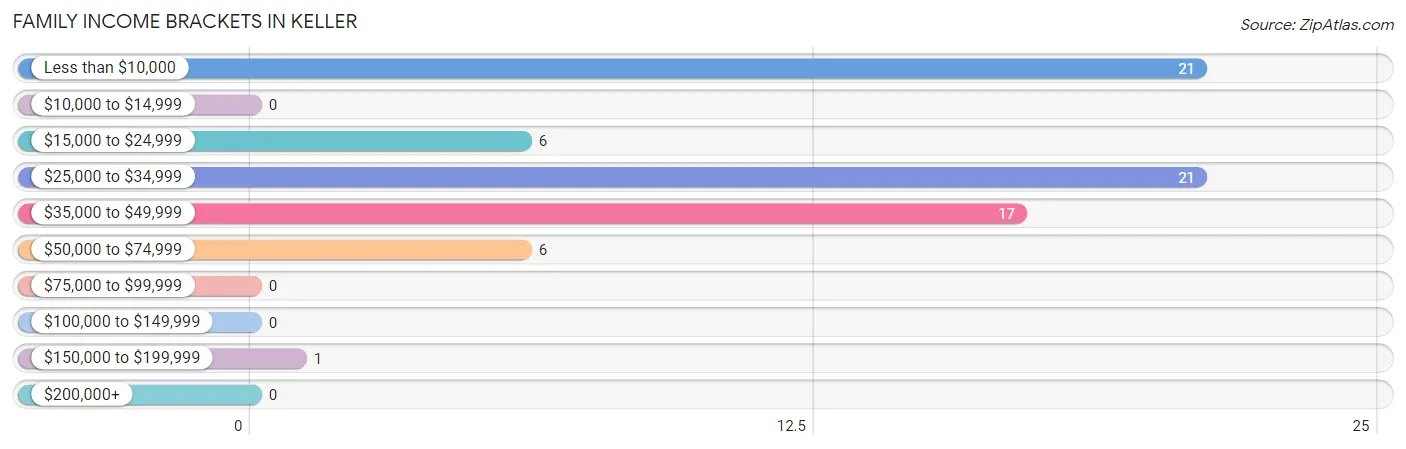
| Income Bracket | # Families | % Families |
| Less than $10,000 | 21 | 29.2% |
| $10,000 to $14,999 | 0 | 0.0% |
| $15,000 to $24,999 | 6 | 8.3% |
| $25,000 to $34,999 | 21 | 29.2% |
| $35,000 to $49,999 | 17 | 23.6% |
| $50,000 to $74,999 | 6 | 8.3% |
| $75,000 to $99,999 | 0 | 0.0% |
| $100,000 to $149,999 | 0 | 0.0% |
| $150,000 to $199,999 | 1 | 1.4% |
| $200,000+ | 0 | 0.0% |
Family Income by Famaliy Size in Keller
3-person families (23 | 31.9%) account for the highest median family income in Keller with $40,625 per family, while 3-person families (23 | 31.9%) have the highest median income of $13,542 per family member.
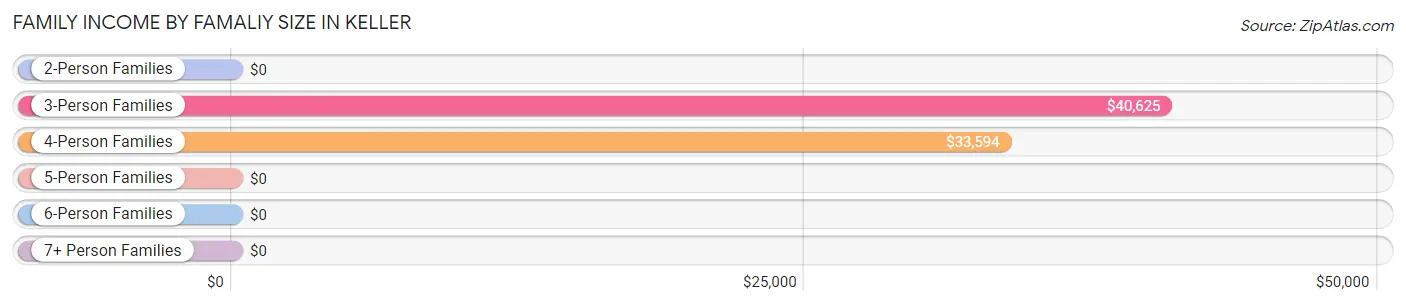
| Income Bracket | # Families | Median Income |
| 2-Person Families | 27 (37.5%) | $0 |
| 3-Person Families | 23 (31.9%) | $40,625 |
| 4-Person Families | 22 (30.6%) | $33,594 |
| 5-Person Families | 0 (0.0%) | $0 |
| 6-Person Families | 0 (0.0%) | $0 |
| 7+ Person Families | 0 (0.0%) | $0 |
| Total | 72 (100.0%) | $33,125 |
Family Income by Number of Earners in Keller
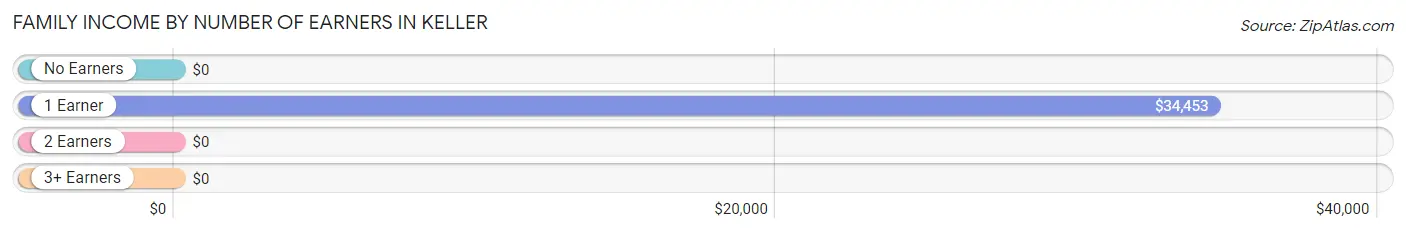
| Number of Earners | # Families | Median Income |
| No Earners | 28 (38.9%) | $0 |
| 1 Earner | 33 (45.8%) | $34,453 |
| 2 Earners | 9 (12.5%) | $0 |
| 3+ Earners | 2 (2.8%) | $0 |
| Total | 72 (100.0%) | $33,125 |
Household Income in Keller
Household Income Brackets in Keller
With 49 households falling in the category, the $35,000 to $49,999 income range is the most frequent in Keller, accounting for 43.0% of all households.
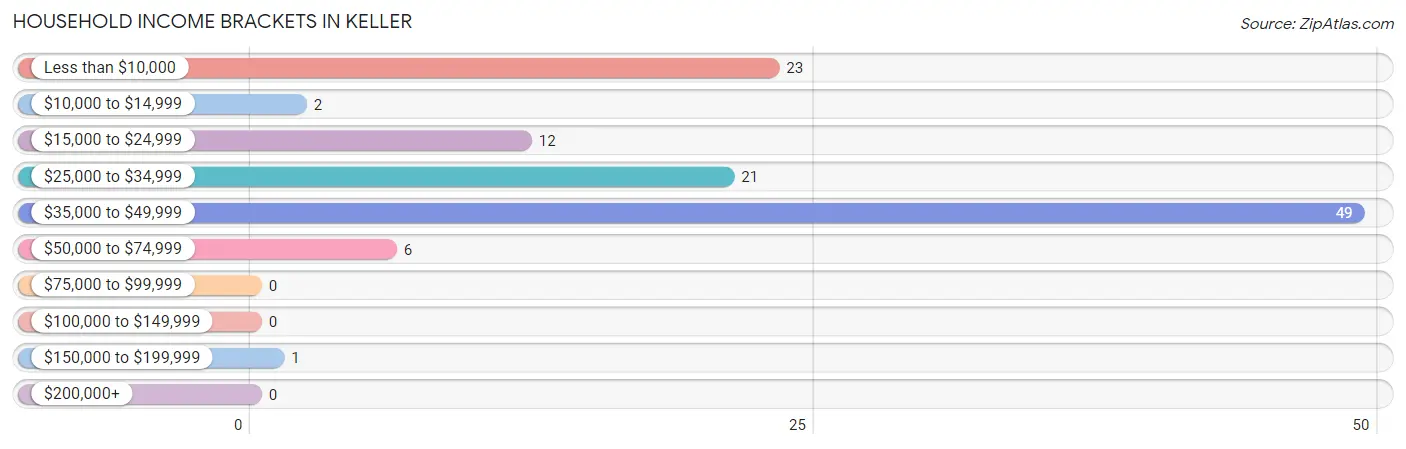
| Income Bracket | # Households | % Households |
| Less than $10,000 | 23 | 20.2% |
| $10,000 to $14,999 | 2 | 1.8% |
| $15,000 to $24,999 | 12 | 10.5% |
| $25,000 to $34,999 | 21 | 18.4% |
| $35,000 to $49,999 | 49 | 43.0% |
| $50,000 to $74,999 | 6 | 5.3% |
| $75,000 to $99,999 | 0 | 0.0% |
| $100,000 to $149,999 | 0 | 0.0% |
| $150,000 to $199,999 | 1 | 0.9% |
| $200,000+ | 0 | 0.0% |
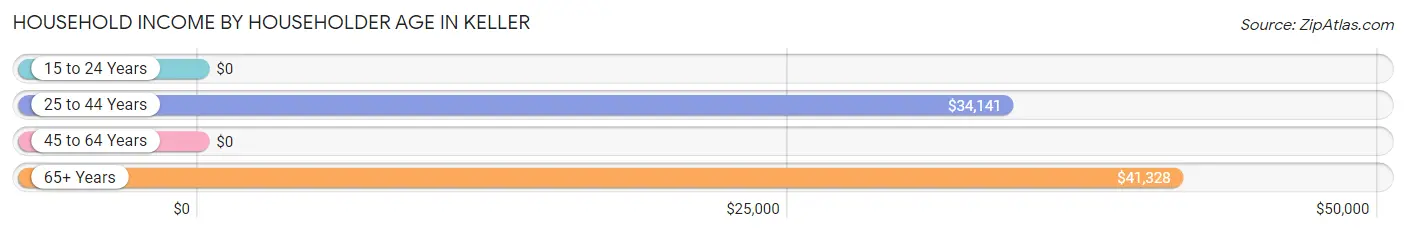
Household Income by Householder Age in Keller
The median household income in Keller is $34,844, with the highest median household income of $41,328 found in the 65+ years age bracket for the primary householder. A total of 44 households (38.6%) fall into this category.
| Income Bracket | # Households | Median Income |
| 15 to 24 Years | 0 (0.0%) | $0 |
| 25 to 44 Years | 27 (23.7%) | $34,141 |
| 45 to 64 Years | 43 (37.7%) | $0 |
| 65+ Years | 44 (38.6%) | $41,328 |
| Total | 114 (100.0%) | $34,844 |
Poverty in Keller
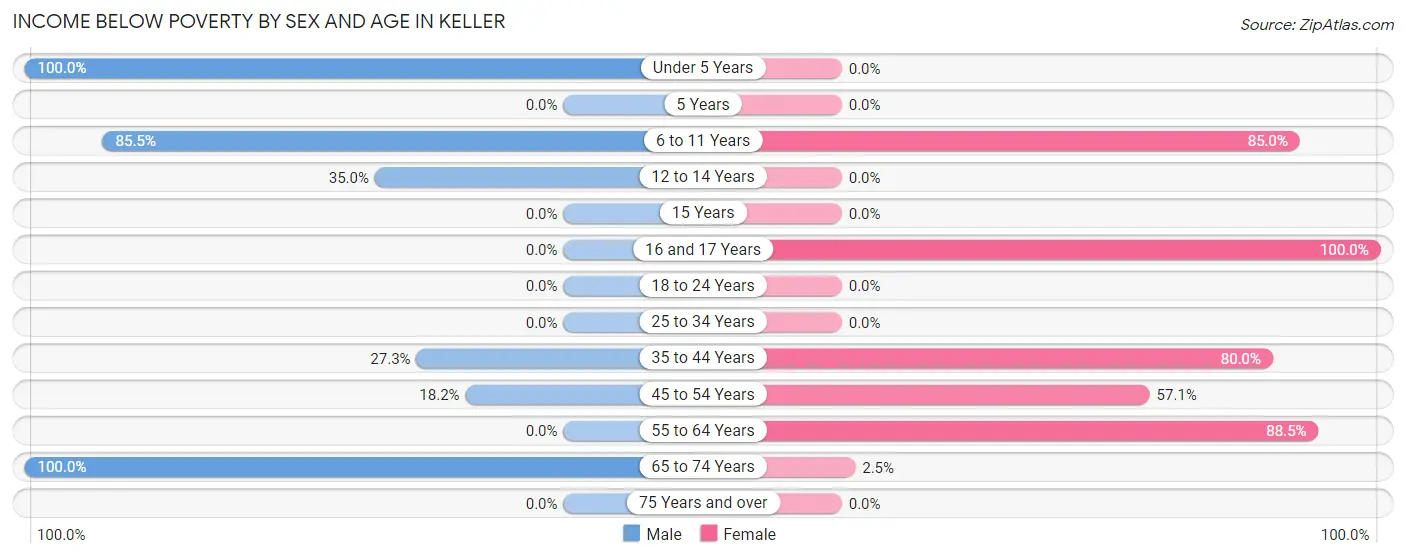
Income Below Poverty by Sex and Age in Keller
With 55.6% poverty level for males and 39.7% for females among the residents of Keller, under 5 year old males and 16 and 17 year old females are the most vulnerable to poverty, with 1 males (100.0%) and 3 females (100.0%) in their respective age groups living below the poverty level.
| Age Bracket | Male | Female |
| Under 5 Years | 1 (100.0%) | 0 (0.0%) |
| 5 Years | 0 (0.0%) | 0 (0.0%) |
| 6 to 11 Years | 59 (85.5%) | 17 (85.0%) |
| 12 to 14 Years | 7 (35.0%) | 0 (0.0%) |
| 15 Years | 0 (0.0%) | 0 (0.0%) |
| 16 and 17 Years | 0 (0.0%) | 3 (100.0%) |
| 18 to 24 Years | 0 (0.0%) | 0 (0.0%) |
| 25 to 34 Years | 0 (0.0%) | 0 (0.0%) |
| 35 to 44 Years | 3 (27.3%) | 4 (80.0%) |
| 45 to 54 Years | 2 (18.2%) | 12 (57.1%) |
| 55 to 64 Years | 0 (0.0%) | 23 (88.5%) |
| 65 to 74 Years | 2 (100.0%) | 1 (2.5%) |
| 75 Years and over | 0 (0.0%) | 0 (0.0%) |
| Total | 74 (55.6%) | 60 (39.7%) |
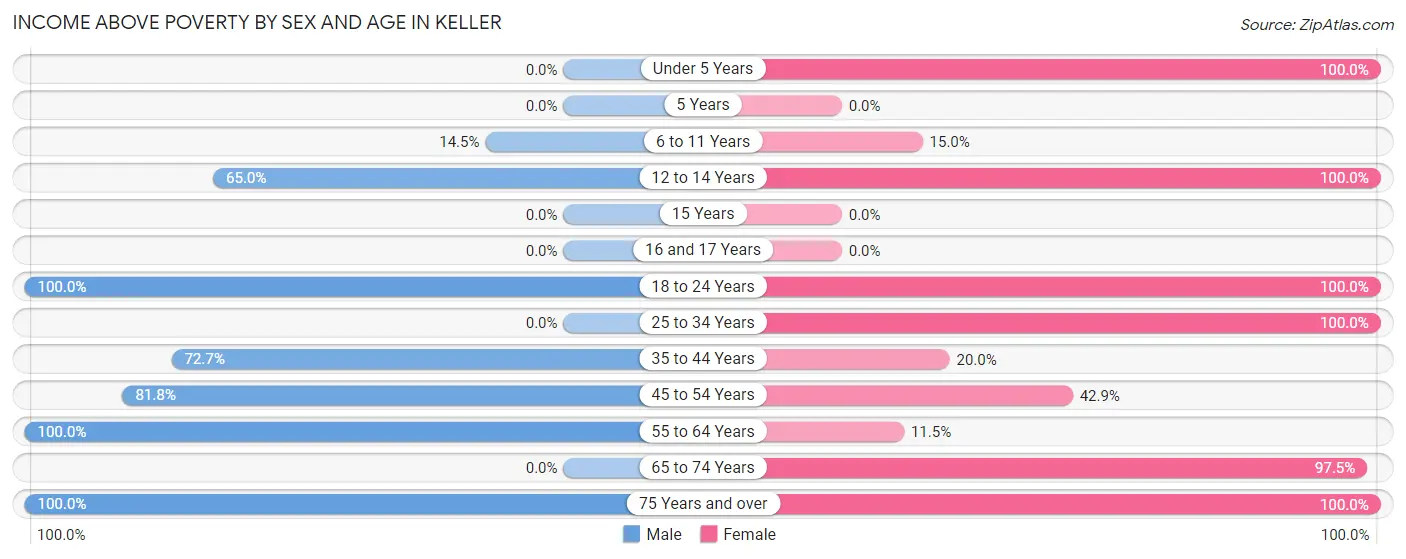
Income Above Poverty by Sex and Age in Keller
According to the poverty statistics in Keller, males aged 18 to 24 years and females aged under 5 years are the age groups that are most secure financially, with 100.0% of males and 100.0% of females in these age groups living above the poverty line.
| Age Bracket | Male | Female |
| Under 5 Years | 0 (0.0%) | 9 (100.0%) |
| 5 Years | 0 (0.0%) | 0 (0.0%) |
| 6 to 11 Years | 10 (14.5%) | 3 (15.0%) |
| 12 to 14 Years | 13 (65.0%) | 4 (100.0%) |
| 15 Years | 0 (0.0%) | 0 (0.0%) |
| 16 and 17 Years | 0 (0.0%) | 0 (0.0%) |
| 18 to 24 Years | 1 (100.0%) | 6 (100.0%) |
| 25 to 34 Years | 0 (0.0%) | 16 (100.0%) |
| 35 to 44 Years | 8 (72.7%) | 1 (20.0%) |
| 45 to 54 Years | 9 (81.8%) | 9 (42.9%) |
| 55 to 64 Years | 4 (100.0%) | 3 (11.5%) |
| 65 to 74 Years | 0 (0.0%) | 39 (97.5%) |
| 75 Years and over | 14 (100.0%) | 1 (100.0%) |
| Total | 59 (44.4%) | 91 (60.3%) |
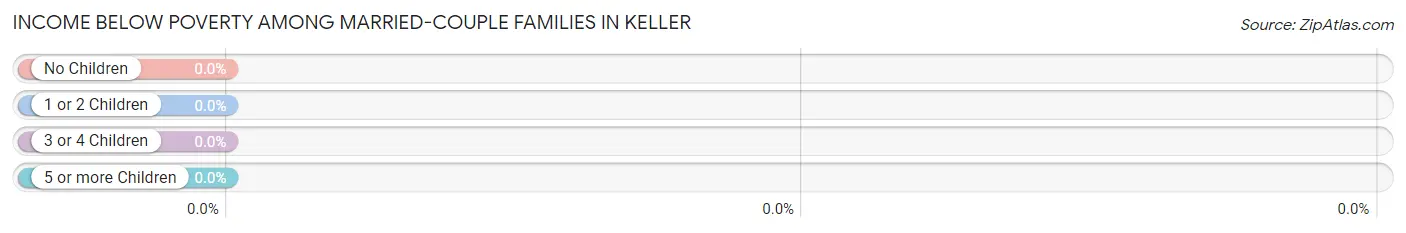
Income Below Poverty Among Married-Couple Families in Keller
| Children | Above Poverty | Below Poverty |
| No Children | 14 (100.0%) | 0 (0.0%) |
| 1 or 2 Children | 6 (100.0%) | 0 (0.0%) |
| 3 or 4 Children | 0 (0.0%) | 0 (0.0%) |
| 5 or more Children | 0 (0.0%) | 0 (0.0%) |
| Total | 20 (100.0%) | 0 (0.0%) |
Income Below Poverty Among Single-Parent Households in Keller
According to the poverty data in Keller, 37.5% or 3 single-father households and 63.6% or 28 single-mother households are living below the poverty line. Among single-father households, those with 1 or 2 children have the highest poverty rate, with 3 households (37.5%) experiencing poverty. Likewise, among single-mother households, those with 1 or 2 children have the highest poverty rate, with 28 households (100.0%) falling below the poverty line.
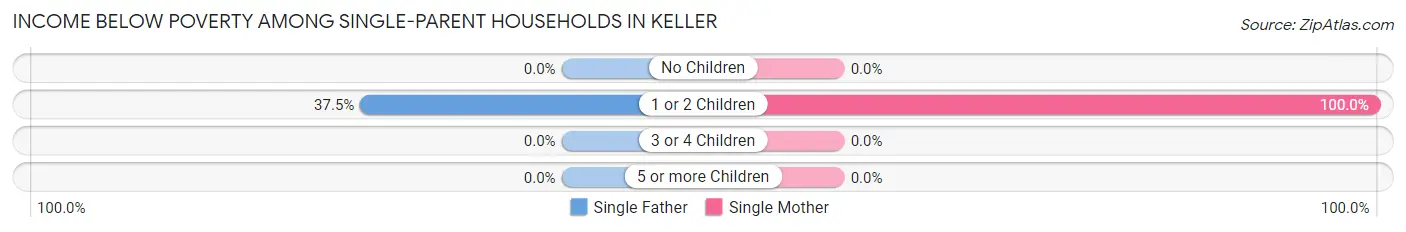
| Children | Single Father | Single Mother |
| No Children | 0 (0.0%) | 0 (0.0%) |
| 1 or 2 Children | 3 (37.5%) | 28 (100.0%) |
| 3 or 4 Children | 0 (0.0%) | 0 (0.0%) |
| 5 or more Children | 0 (0.0%) | 0 (0.0%) |
| Total | 3 (37.5%) | 28 (63.6%) |
Income Below Poverty Among Married-Couple vs Single-Parent Households in Keller
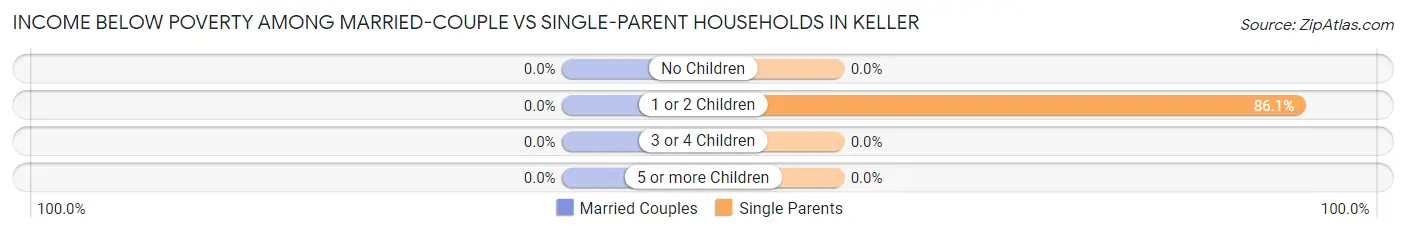
| Children | Married-Couple Families | Single-Parent Households |
| No Children | 0 (0.0%) | 0 (0.0%) |
| 1 or 2 Children | 0 (0.0%) | 31 (86.1%) |
| 3 or 4 Children | 0 (0.0%) | 0 (0.0%) |
| 5 or more Children | 0 (0.0%) | 0 (0.0%) |
| Total | 0 (0.0%) | 31 (59.6%) |
Race in Keller
The most populous races in Keller are White / Caucasian (178 | 62.2%), Black / African American (102 | 35.7%), and Two or more Races (6 | 2.1%).
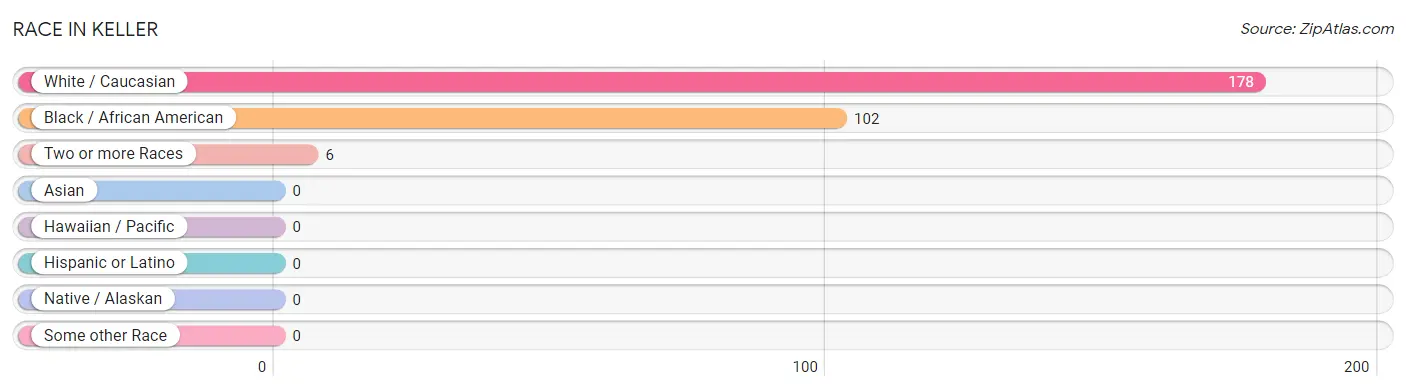
| Race | # Population | % Population |
| Asian | 0 | 0.0% |
| Black / African American | 102 | 35.7% |
| Hawaiian / Pacific | 0 | 0.0% |
| Hispanic or Latino | 0 | 0.0% |
| Native / Alaskan | 0 | 0.0% |
| White / Caucasian | 178 | 62.2% |
| Two or more Races | 6 | 2.1% |
| Some other Race | 0 | 0.0% |
| Total | 286 | 100.0% |
Ancestry in Keller
The most populous ancestries reported in Keller are American (178 | 62.2%), English (38 | 13.3%), German (10 | 3.5%), Scotch-Irish (8 | 2.8%), and Scottish (6 | 2.1%), together accounting for 83.9% of all Keller residents.
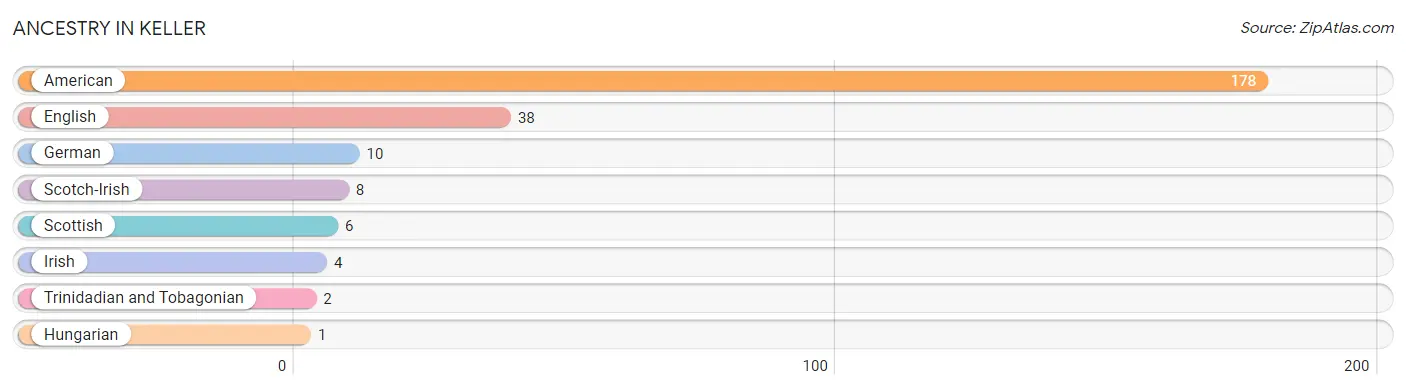
| Ancestry | # Population | % Population |
| American | 178 | 62.2% |
| English | 38 | 13.3% |
| German | 10 | 3.5% |
| Hungarian | 1 | 0.4% |
| Irish | 4 | 1.4% |
| Scotch-Irish | 8 | 2.8% |
| Scottish | 6 | 2.1% |
| Trinidadian and Tobagonian | 2 | 0.7% | View All 8 Rows |
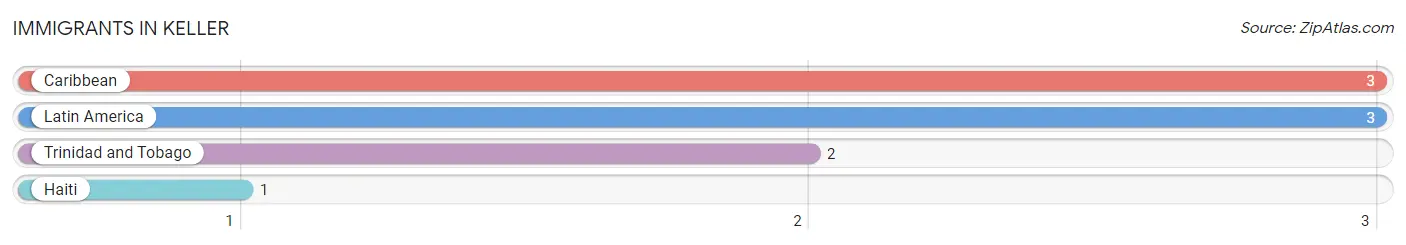
Immigrants in Keller
The most numerous immigrant groups reported in Keller came from Caribbean (3 | 1.1%), Latin America (3 | 1.1%), Trinidad and Tobago (2 | 0.7%), and Haiti (1 | 0.4%), together accounting for 3.2% of all Keller residents.
| Immigration Origin | # Population | % Population |
| Caribbean | 3 | 1.1% |
| Haiti | 1 | 0.4% |
| Latin America | 3 | 1.1% |
| Trinidad and Tobago | 2 | 0.7% | View All 4 Rows |
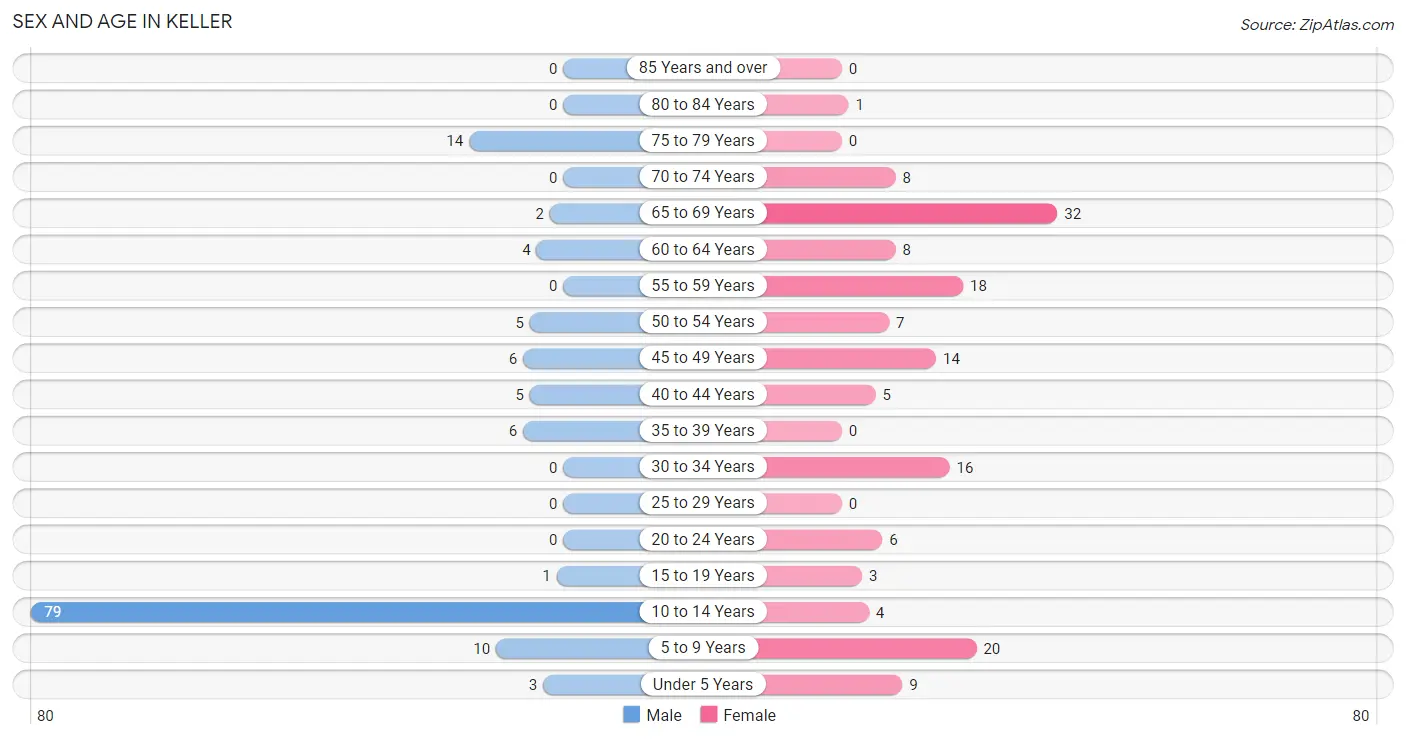
Sex and Age in Keller
Sex and Age in Keller
The most populous age groups in Keller are 10 to 14 Years (79 | 58.5%) for men and 65 to 69 Years (32 | 21.2%) for women.
| Age Bracket | Male | Female |
| Under 5 Years | 3 (2.2%) | 9 (6.0%) |
| 5 to 9 Years | 10 (7.4%) | 20 (13.3%) |
| 10 to 14 Years | 79 (58.5%) | 4 (2.6%) |
| 15 to 19 Years | 1 (0.7%) | 3 (2.0%) |
| 20 to 24 Years | 0 (0.0%) | 6 (4.0%) |
| 25 to 29 Years | 0 (0.0%) | 0 (0.0%) |
| 30 to 34 Years | 0 (0.0%) | 16 (10.6%) |
| 35 to 39 Years | 6 (4.4%) | 0 (0.0%) |
| 40 to 44 Years | 5 (3.7%) | 5 (3.3%) |
| 45 to 49 Years | 6 (4.4%) | 14 (9.3%) |
| 50 to 54 Years | 5 (3.7%) | 7 (4.6%) |
| 55 to 59 Years | 0 (0.0%) | 18 (11.9%) |
| 60 to 64 Years | 4 (3.0%) | 8 (5.3%) |
| 65 to 69 Years | 2 (1.5%) | 32 (21.2%) |
| 70 to 74 Years | 0 (0.0%) | 8 (5.3%) |
| 75 to 79 Years | 14 (10.4%) | 0 (0.0%) |
| 80 to 84 Years | 0 (0.0%) | 1 (0.7%) |
| 85 Years and over | 0 (0.0%) | 0 (0.0%) |
| Total | 135 (100.0%) | 151 (100.0%) |
Families and Households in Keller
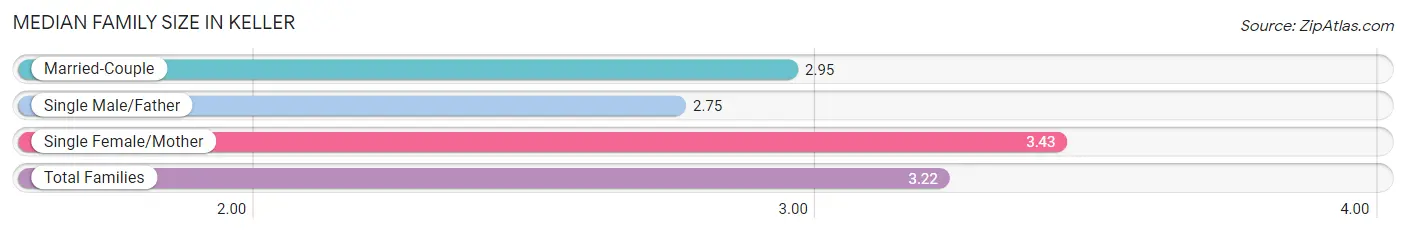
Median Family Size in Keller
The median family size in Keller is 3.22 persons per family, with single female/mother families (44 | 61.1%) accounting for the largest median family size of 3.43 persons per family. On the other hand, single male/father families (8 | 11.1%) represent the smallest median family size with 2.75 persons per family.
| Family Type | # Families | Family Size |
| Married-Couple | 20 (27.8%) | 2.95 |
| Single Male/Father | 8 (11.1%) | 2.75 |
| Single Female/Mother | 44 (61.1%) | 3.43 |
| Total Families | 72 (100.0%) | 3.22 |
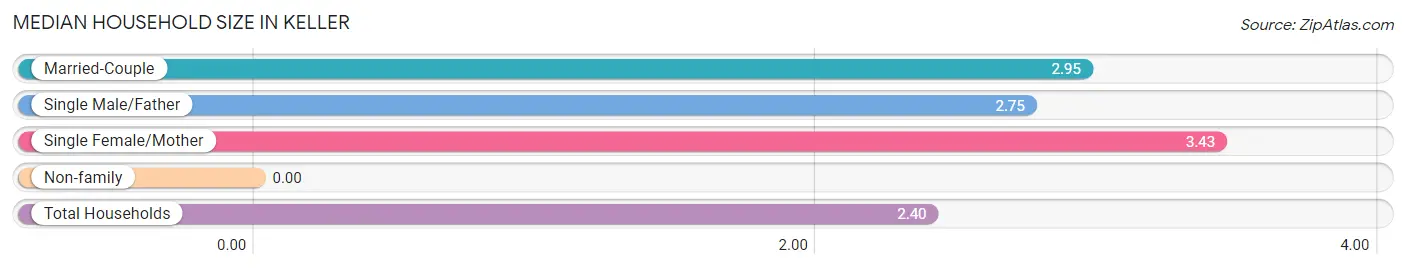
Median Household Size in Keller
| Household Type | # Households | Household Size |
| Married-Couple | 20 (17.5%) | 2.95 |
| Single Male/Father | 8 (7.0%) | 2.75 |
| Single Female/Mother | 44 (38.6%) | 3.43 |
| Non-family | 42 (36.8%) | - |
| Total Households | 114 (100.0%) | 2.40 |
Household Size by Marriage Status in Keller
Out of a total of 114 households in Keller, 72 (63.2%) are family households, while 42 (36.8%) are nonfamily households. The most numerous type of family households are 2-person households, comprising 27, and the most common type of nonfamily households are 1-person households, comprising 42.
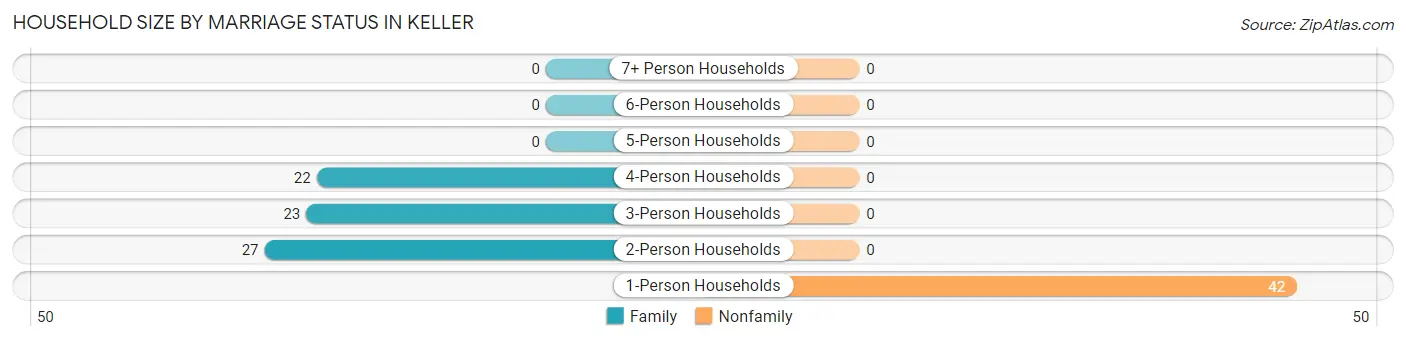
| Household Size | Family Households | Nonfamily Households |
| 1-Person Households | - | 42 (36.8%) |
| 2-Person Households | 27 (23.7%) | 0 (0.0%) |
| 3-Person Households | 23 (20.2%) | 0 (0.0%) |
| 4-Person Households | 22 (19.3%) | 0 (0.0%) |
| 5-Person Households | 0 (0.0%) | 0 (0.0%) |
| 6-Person Households | 0 (0.0%) | 0 (0.0%) |
| 7+ Person Households | 0 (0.0%) | 0 (0.0%) |
| Total | 72 (63.2%) | 42 (36.8%) |
Female Fertility in Keller
Fertility by Age in Keller
Average fertility rate in Keller is 364.0 births per 1,000 women. Women in the age bracket of 20 to 34 years have the highest fertility rate with 727.0 births per 1,000 women. Women in the age bracket of 20 to 34 years acount for 100.0% of all women with births.
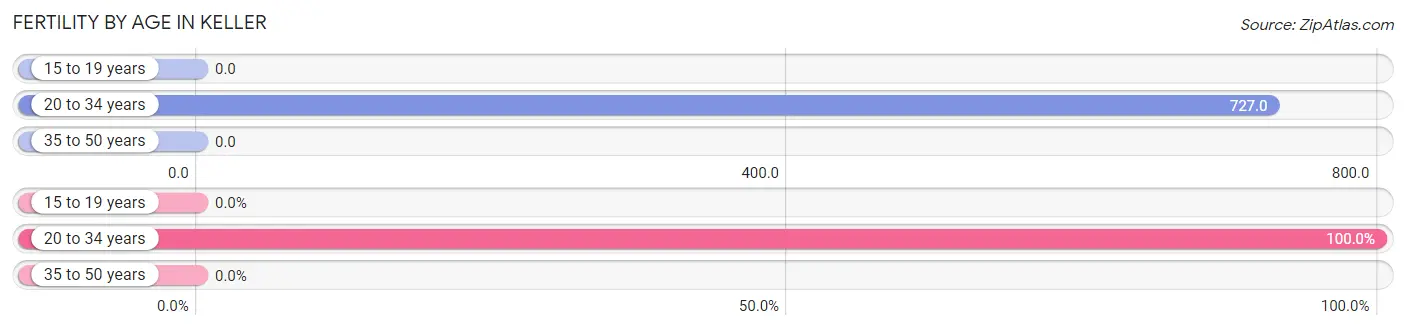
| Age Bracket | Women with Births | Births / 1,000 Women |
| 15 to 19 years | 0 (0.0%) | 0.0 |
| 20 to 34 years | 16 (100.0%) | 727.0 |
| 35 to 50 years | 0 (0.0%) | 0.0 |
| Total | 16 (100.0%) | 364.0 |
Fertility by Age by Marriage Status in Keller
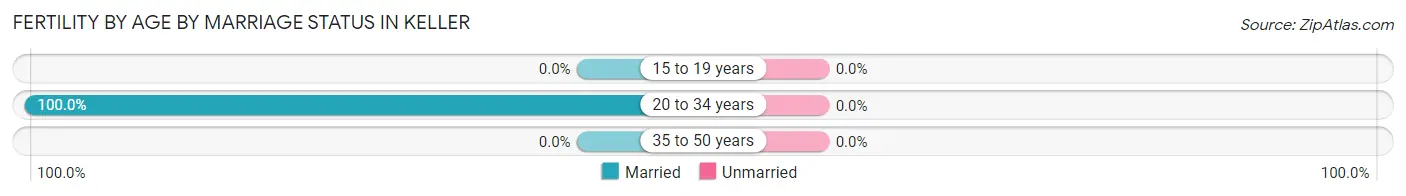
| Age Bracket | Married | Unmarried |
| 15 to 19 years | 0 (0.0%) | 0 (0.0%) |
| 20 to 34 years | 16 (100.0%) | 0 (0.0%) |
| 35 to 50 years | 0 (0.0%) | 0 (0.0%) |
| Total | 16 (100.0%) | 0 (0.0%) |
Fertility by Education in Keller
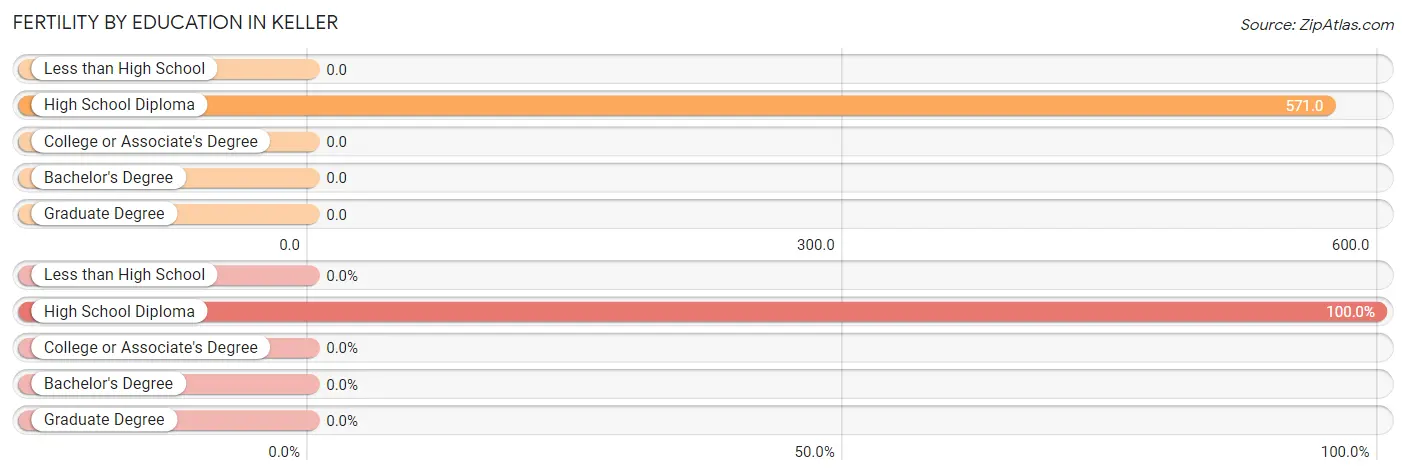
| Educational Attainment | Women with Births | Births / 1,000 Women |
| Less than High School | 0 (0.0%) | 0.0 |
| High School Diploma | 16 (100.0%) | 571.0 |
| College or Associate's Degree | 0 (0.0%) | 0.0 |
| Bachelor's Degree | 0 (0.0%) | 0.0 |
| Graduate Degree | 0 (0.0%) | 0.0 |
| Total | 16 (100.0%) | 364.0 |
Fertility by Education by Marriage Status in Keller
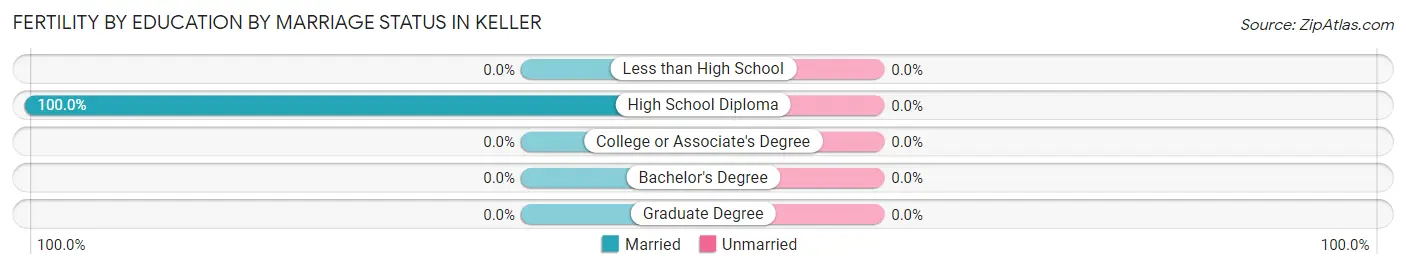
| Educational Attainment | Married | Unmarried |
| Less than High School | 0 (0.0%) | 0 (0.0%) |
| High School Diploma | 16 (100.0%) | 0 (0.0%) |
| College or Associate's Degree | 0 (0.0%) | 0 (0.0%) |
| Bachelor's Degree | 0 (0.0%) | 0 (0.0%) |
| Graduate Degree | 0 (0.0%) | 0 (0.0%) |
| Total | 16 (100.0%) | 0 (0.0%) |
Employment Characteristics in Keller
Employment by Class of Employer in Keller
Among the 71 employed individuals in Keller, private company employees (53 | 74.7%), local government employees (13 | 18.3%), and self-employed (not incorporated) (5 | 7.0%) make up the most common classes of employment.
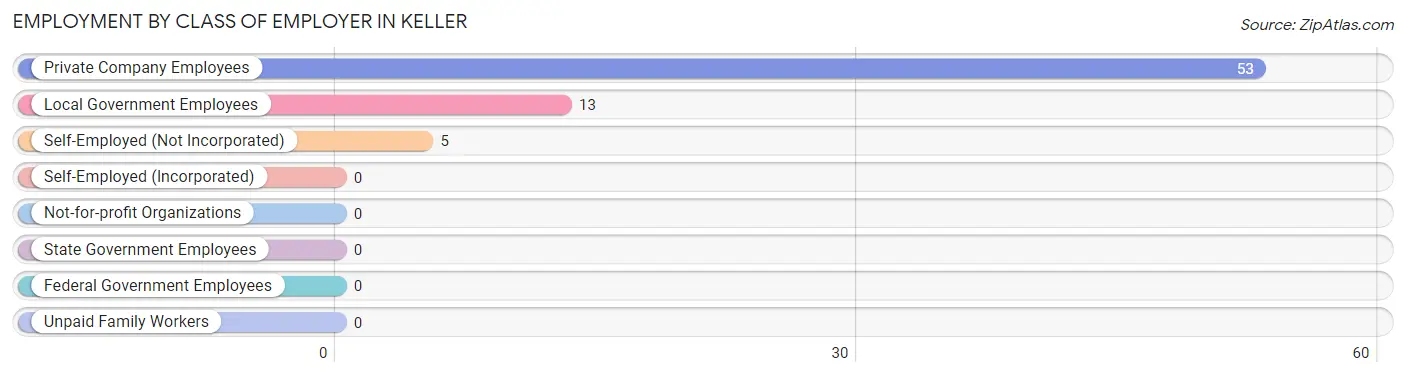
| Employer Class | # Employees | % Employees |
| Private Company Employees | 53 | 74.7% |
| Self-Employed (Incorporated) | 0 | 0.0% |
| Self-Employed (Not Incorporated) | 5 | 7.0% |
| Not-for-profit Organizations | 0 | 0.0% |
| Local Government Employees | 13 | 18.3% |
| State Government Employees | 0 | 0.0% |
| Federal Government Employees | 0 | 0.0% |
| Unpaid Family Workers | 0 | 0.0% |
| Total | 71 | 100.0% |
Employment Status by Age in Keller
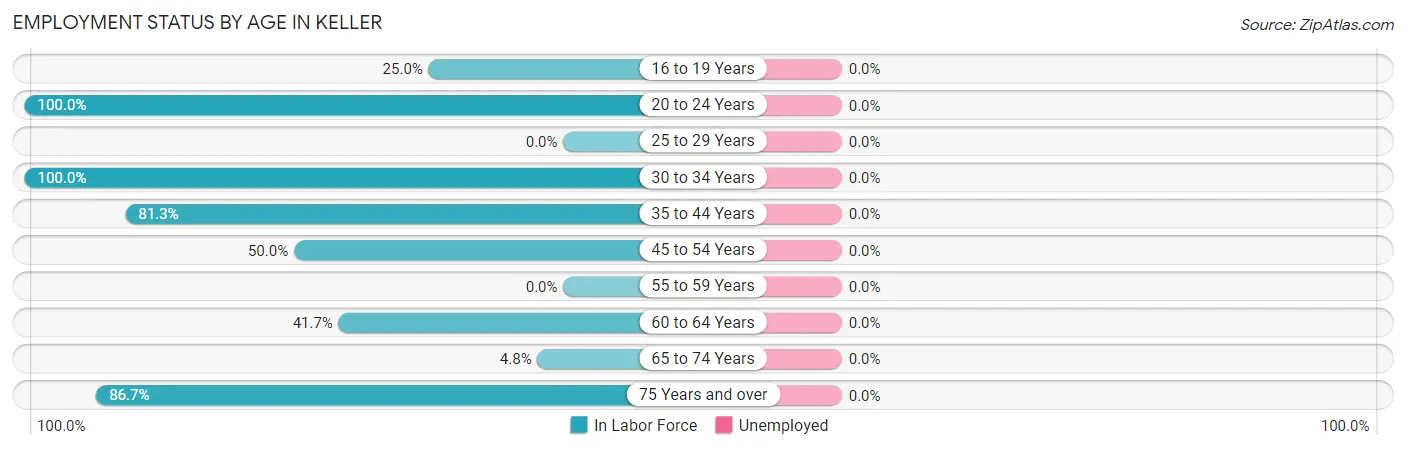
| Age Bracket | In Labor Force | Unemployed |
| 16 to 19 Years | 1 (25.0%) | 0 (0.0%) |
| 20 to 24 Years | 6 (100.0%) | 0 (0.0%) |
| 25 to 29 Years | 0 (0.0%) | 0 (0.0%) |
| 30 to 34 Years | 16 (100.0%) | 0 (0.0%) |
| 35 to 44 Years | 13 (81.3%) | 0 (0.0%) |
| 45 to 54 Years | 16 (50.0%) | 0 (0.0%) |
| 55 to 59 Years | 0 (0.0%) | 0 (0.0%) |
| 60 to 64 Years | 5 (41.7%) | 0 (0.0%) |
| 65 to 74 Years | 2 (4.8%) | 0 (0.0%) |
| 75 Years and over | 13 (86.7%) | 0 (0.0%) |
| Total | 72 (44.7%) | 0 (0.0%) |
Employment Status by Educational Attainment in Keller
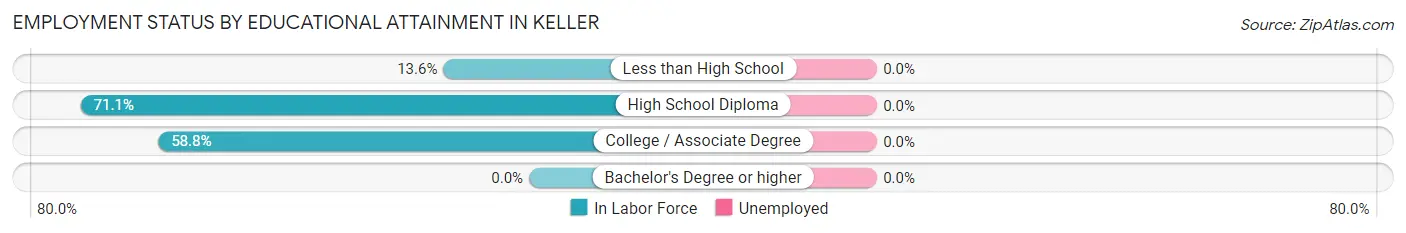
| Educational Attainment | In Labor Force | Unemployed |
| Less than High School | 3 (13.6%) | 0 (0.0%) |
| High School Diploma | 27 (71.1%) | 0 (0.0%) |
| College / Associate Degree | 20 (58.8%) | 0 (0.0%) |
| Bachelor's Degree or higher | 0 (0.0%) | 0 (0.0%) |
| Total | 50 (53.2%) | 0 (0.0%) |
Employment Occupations by Sex in Keller
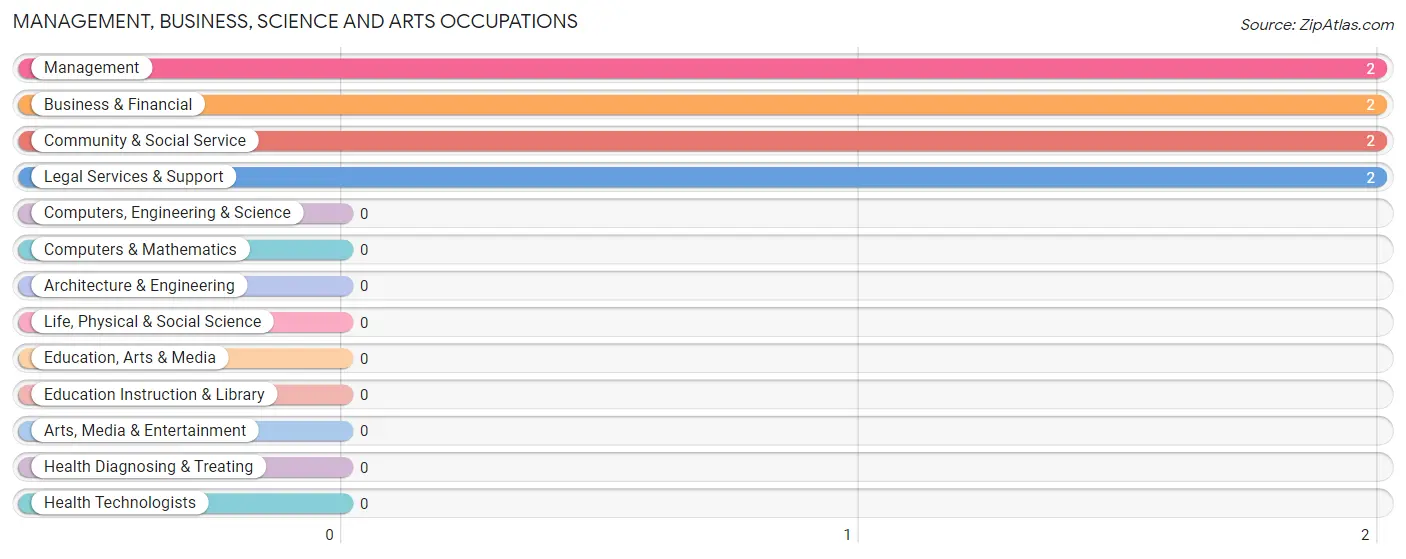
Management, Business, Science and Arts Occupations
The most common Management, Business, Science and Arts occupations in Keller are Management (2 | 2.8%), Business & Financial (2 | 2.8%), Community & Social Service (2 | 2.8%), and Legal Services & Support (2 | 2.8%).
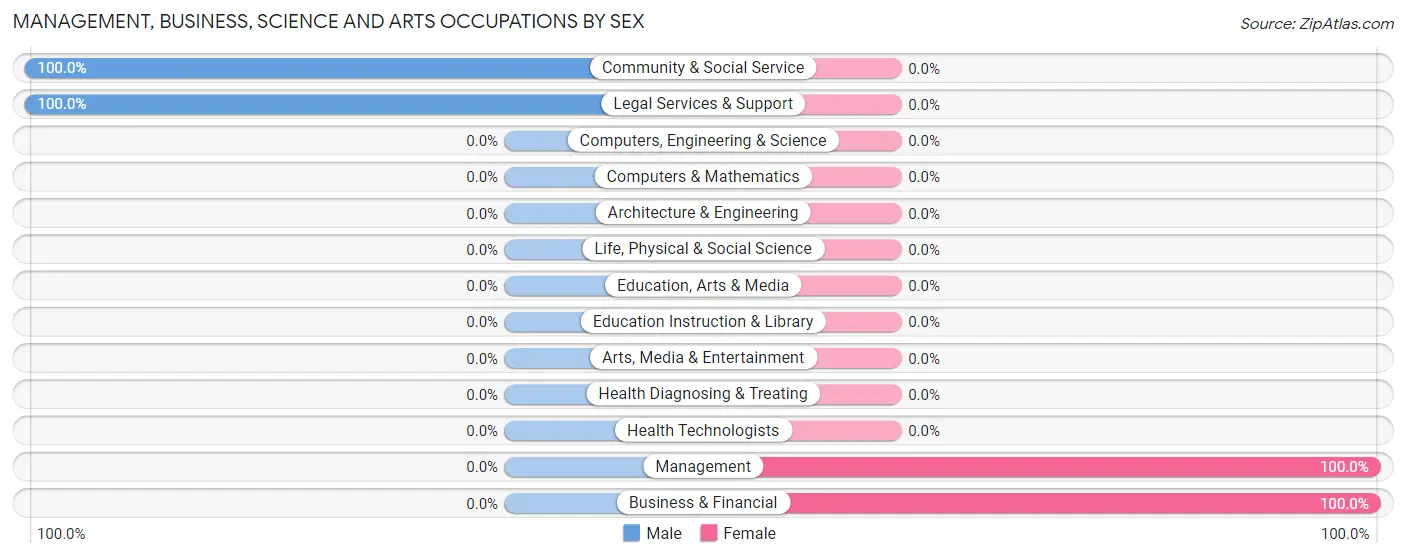
Management, Business, Science and Arts Occupations by Sex
Within the Management, Business, Science and Arts occupations in Keller, the most male-oriented occupations are Community & Social Service (100.0%), and Legal Services & Support (100.0%), while the most female-oriented occupations are Management (100.0%), and Business & Financial (100.0%).
| Occupation | Male | Female |
| Management | 0 (0.0%) | 2 (100.0%) |
| Business & Financial | 0 (0.0%) | 2 (100.0%) |
| Computers, Engineering & Science | 0 (0.0%) | 0 (0.0%) |
| Computers & Mathematics | 0 (0.0%) | 0 (0.0%) |
| Architecture & Engineering | 0 (0.0%) | 0 (0.0%) |
| Life, Physical & Social Science | 0 (0.0%) | 0 (0.0%) |
| Community & Social Service | 2 (100.0%) | 0 (0.0%) |
| Education, Arts & Media | 0 (0.0%) | 0 (0.0%) |
| Legal Services & Support | 2 (100.0%) | 0 (0.0%) |
| Education Instruction & Library | 0 (0.0%) | 0 (0.0%) |
| Arts, Media & Entertainment | 0 (0.0%) | 0 (0.0%) |
| Health Diagnosing & Treating | 0 (0.0%) | 0 (0.0%) |
| Health Technologists | 0 (0.0%) | 0 (0.0%) |
| Total (Category) | 2 (33.3%) | 4 (66.7%) |
| Total (Overall) | 34 (47.2%) | 38 (52.8%) |
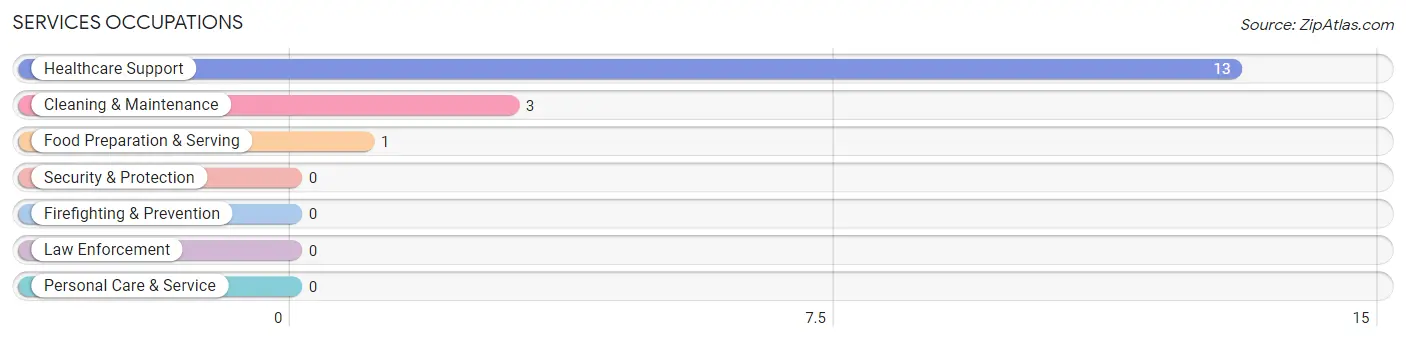
Services Occupations
The most common Services occupations in Keller are Healthcare Support (13 | 18.1%), Cleaning & Maintenance (3 | 4.2%), and Food Preparation & Serving (1 | 1.4%).
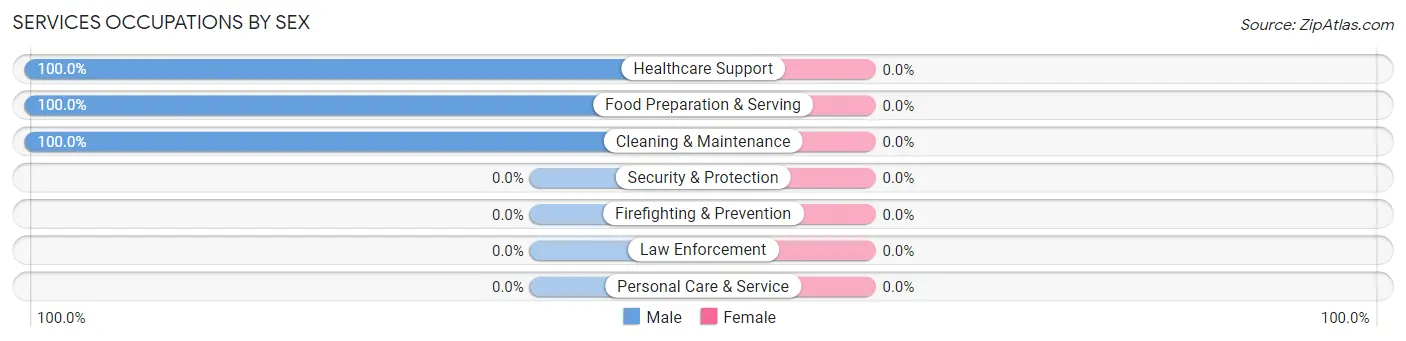
Services Occupations by Sex
| Occupation | Male | Female |
| Healthcare Support | 13 (100.0%) | 0 (0.0%) |
| Security & Protection | 0 (0.0%) | 0 (0.0%) |
| Firefighting & Prevention | 0 (0.0%) | 0 (0.0%) |
| Law Enforcement | 0 (0.0%) | 0 (0.0%) |
| Food Preparation & Serving | 1 (100.0%) | 0 (0.0%) |
| Cleaning & Maintenance | 3 (100.0%) | 0 (0.0%) |
| Personal Care & Service | 0 (0.0%) | 0 (0.0%) |
| Total (Category) | 17 (100.0%) | 0 (0.0%) |
| Total (Overall) | 34 (47.2%) | 38 (52.8%) |
Sales and Office Occupations
The most common Sales and Office occupations in Keller are Sales & Related (34 | 47.2%), and Office & Administration (2 | 2.8%).
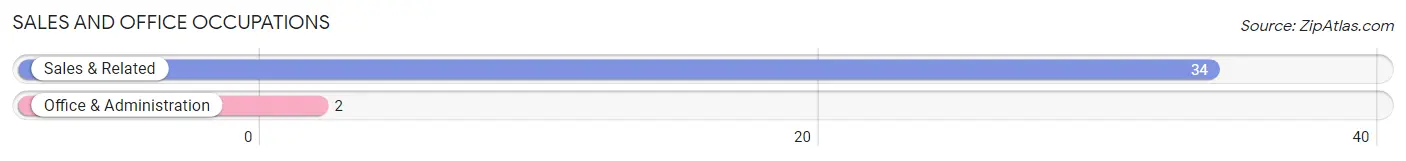
Sales and Office Occupations by Sex

| Occupation | Male | Female |
| Sales & Related | 2 (5.9%) | 32 (94.1%) |
| Office & Administration | 0 (0.0%) | 2 (100.0%) |
| Total (Category) | 2 (5.6%) | 34 (94.4%) |
| Total (Overall) | 34 (47.2%) | 38 (52.8%) |
Natural Resources, Construction and Maintenance Occupations
The most common Natural Resources, Construction and Maintenance occupations in Keller are Construction & Extraction (10 | 13.9%), and Installation, Maintenance & Repair (1 | 1.4%).
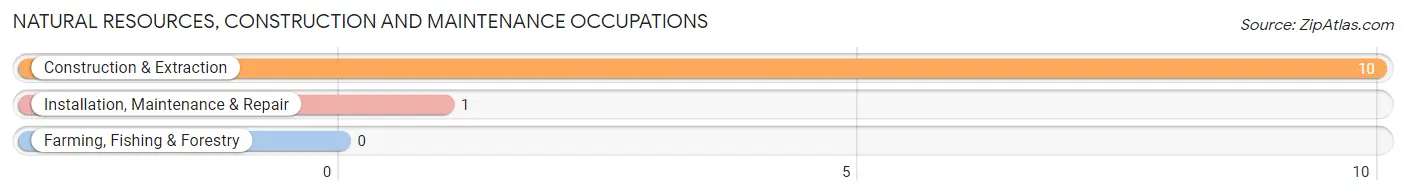
Natural Resources, Construction and Maintenance Occupations by Sex

| Occupation | Male | Female |
| Farming, Fishing & Forestry | 0 (0.0%) | 0 (0.0%) |
| Construction & Extraction | 10 (100.0%) | 0 (0.0%) |
| Installation, Maintenance & Repair | 1 (100.0%) | 0 (0.0%) |
| Total (Category) | 11 (100.0%) | 0 (0.0%) |
| Total (Overall) | 34 (47.2%) | 38 (52.8%) |
Production, Transportation and Moving Occupations
The most common Production, Transportation and Moving occupations in Keller are , and Material Moving (2 | 2.8%).
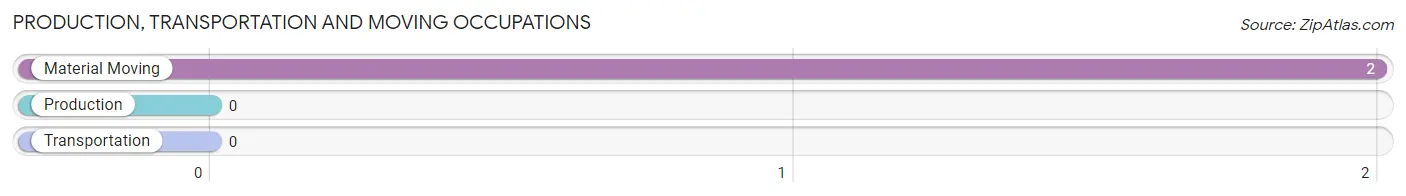
Production, Transportation and Moving Occupations by Sex
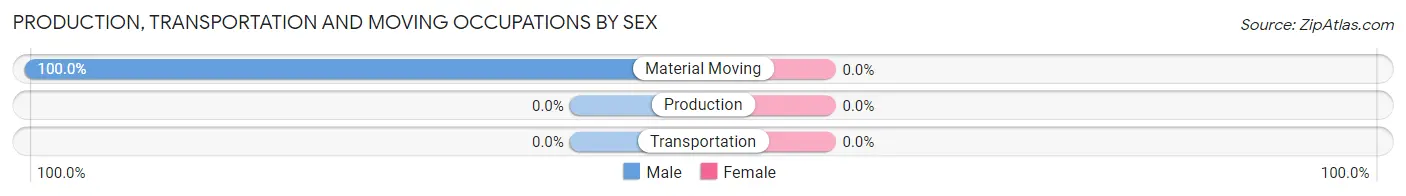
| Occupation | Male | Female |
| Production | 0 (0.0%) | 0 (0.0%) |
| Transportation | 0 (0.0%) | 0 (0.0%) |
| Material Moving | 2 (100.0%) | 0 (0.0%) |
| Total (Category) | 2 (100.0%) | 0 (0.0%) |
| Total (Overall) | 34 (47.2%) | 38 (52.8%) |
Employment Industries by Sex in Keller
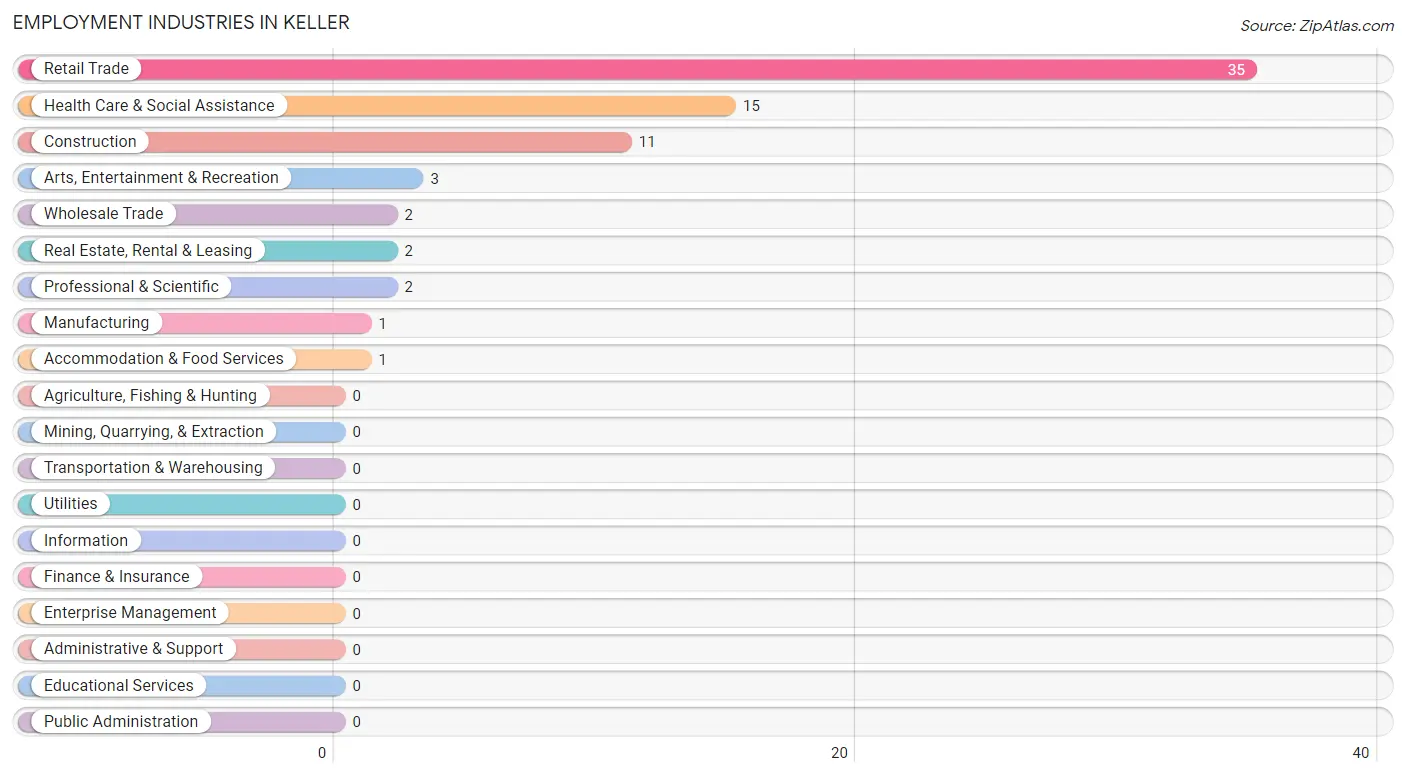
Employment Industries in Keller
The major employment industries in Keller include Retail Trade (35 | 48.6%), Health Care & Social Assistance (15 | 20.8%), Construction (11 | 15.3%), Arts, Entertainment & Recreation (3 | 4.2%), and Wholesale Trade (2 | 2.8%).
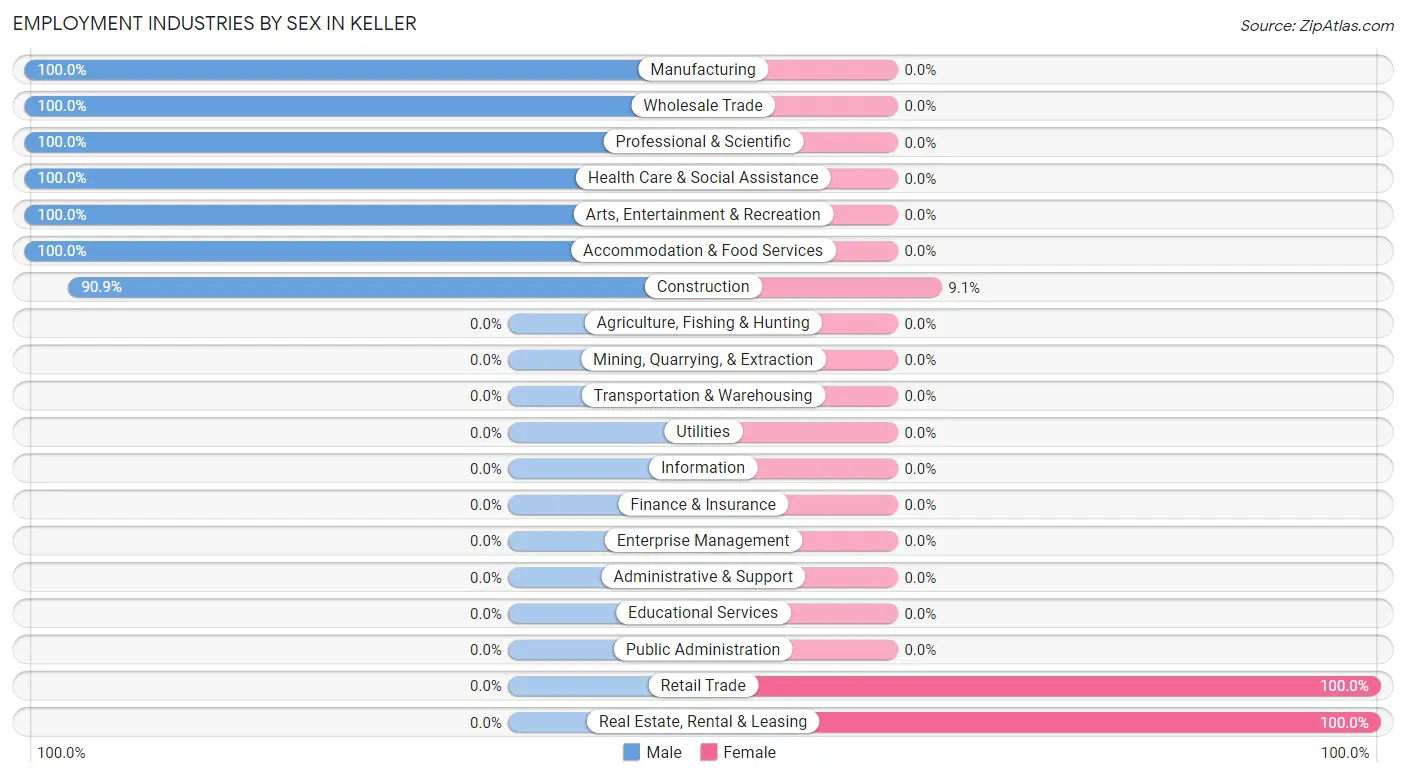
Employment Industries by Sex in Keller
The Keller industries that see more men than women are Manufacturing (100.0%), Wholesale Trade (100.0%), and Professional & Scientific (100.0%), whereas the industries that tend to have a higher number of women are Retail Trade (100.0%), Real Estate, Rental & Leasing (100.0%), and Construction (9.1%).
| Industry | Male | Female |
| Agriculture, Fishing & Hunting | 0 (0.0%) | 0 (0.0%) |
| Mining, Quarrying, & Extraction | 0 (0.0%) | 0 (0.0%) |
| Construction | 10 (90.9%) | 1 (9.1%) |
| Manufacturing | 1 (100.0%) | 0 (0.0%) |
| Wholesale Trade | 2 (100.0%) | 0 (0.0%) |
| Retail Trade | 0 (0.0%) | 35 (100.0%) |
| Transportation & Warehousing | 0 (0.0%) | 0 (0.0%) |
| Utilities | 0 (0.0%) | 0 (0.0%) |
| Information | 0 (0.0%) | 0 (0.0%) |
| Finance & Insurance | 0 (0.0%) | 0 (0.0%) |
| Real Estate, Rental & Leasing | 0 (0.0%) | 2 (100.0%) |
| Professional & Scientific | 2 (100.0%) | 0 (0.0%) |
| Enterprise Management | 0 (0.0%) | 0 (0.0%) |
| Administrative & Support | 0 (0.0%) | 0 (0.0%) |
| Educational Services | 0 (0.0%) | 0 (0.0%) |
| Health Care & Social Assistance | 15 (100.0%) | 0 (0.0%) |
| Arts, Entertainment & Recreation | 3 (100.0%) | 0 (0.0%) |
| Accommodation & Food Services | 1 (100.0%) | 0 (0.0%) |
| Public Administration | 0 (0.0%) | 0 (0.0%) |
| Total | 34 (47.2%) | 38 (52.8%) |
Education in Keller
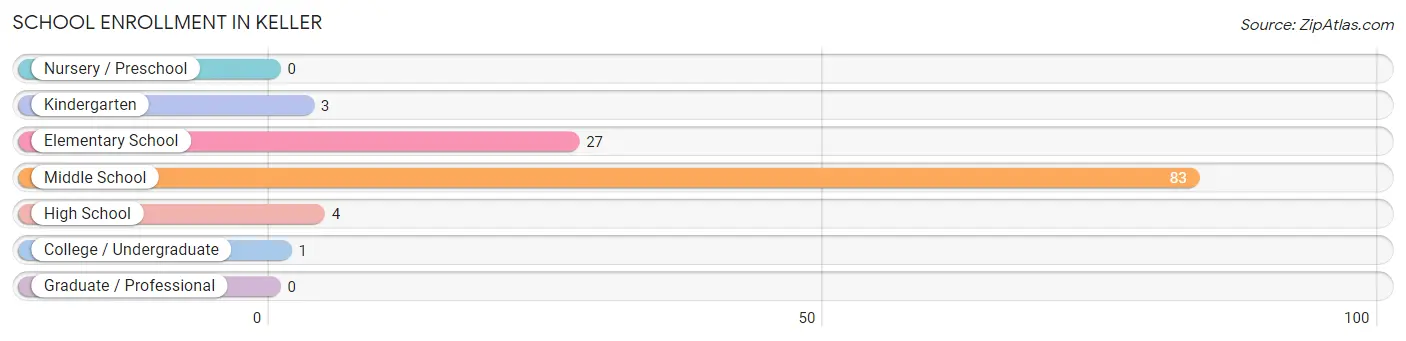
School Enrollment in Keller
The most common levels of schooling among the 118 students in Keller are middle school (83 | 70.3%), elementary school (27 | 22.9%), and high school (4 | 3.4%).
| School Level | # Students | % Students |
| Nursery / Preschool | 0 | 0.0% |
| Kindergarten | 3 | 2.5% |
| Elementary School | 27 | 22.9% |
| Middle School | 83 | 70.3% |
| High School | 4 | 3.4% |
| College / Undergraduate | 1 | 0.9% |
| Graduate / Professional | 0 | 0.0% |
| Total | 118 | 100.0% |
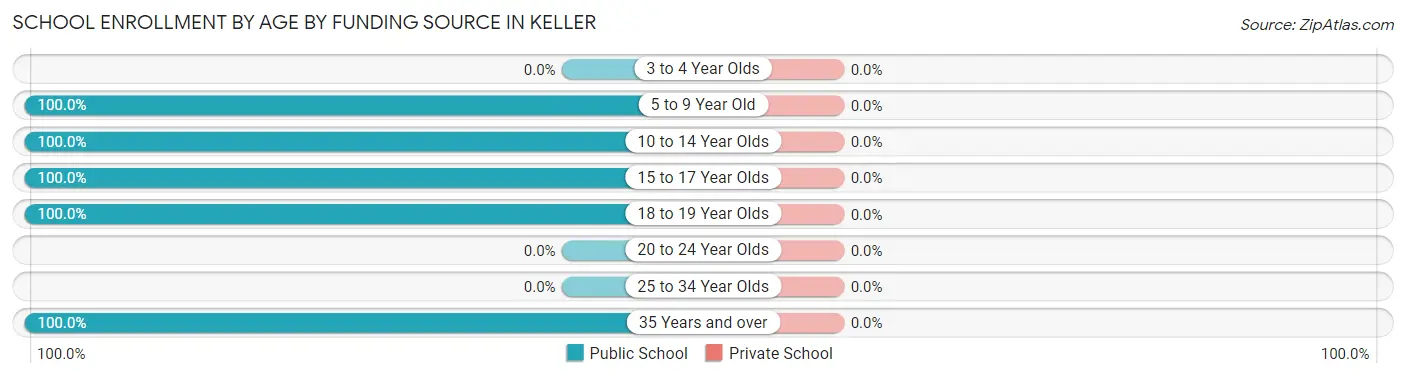
School Enrollment by Age by Funding Source in Keller
| Age Bracket | Public School | Private School |
| 3 to 4 Year Olds | 0 (0.0%) | 0 (0.0%) |
| 5 to 9 Year Old | 30 (100.0%) | 0 (0.0%) |
| 10 to 14 Year Olds | 83 (100.0%) | 0 (0.0%) |
| 15 to 17 Year Olds | 3 (100.0%) | 0 (0.0%) |
| 18 to 19 Year Olds | 1 (100.0%) | 0 (0.0%) |
| 20 to 24 Year Olds | 0 (0.0%) | 0 (0.0%) |
| 25 to 34 Year Olds | 0 (0.0%) | 0 (0.0%) |
| 35 Years and over | 1 (100.0%) | 0 (0.0%) |
| Total | 118 (100.0%) | 0 (0.0%) |
Educational Attainment by Field of Study in Keller
Education (32 | 94.1%), and social sciences (2 | 5.9%) are the most common fields of study among 34 individuals in Keller who have obtained a bachelor's degree or higher.
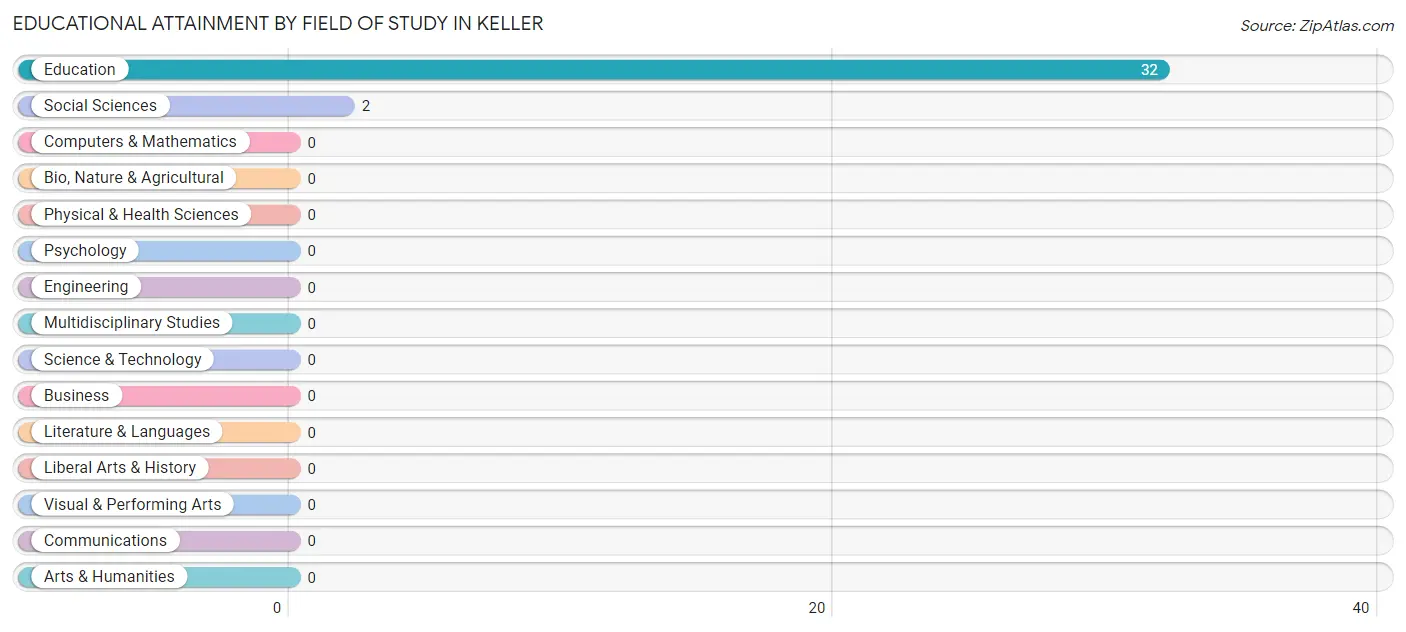
| Field of Study | # Graduates | % Graduates |
| Computers & Mathematics | 0 | 0.0% |
| Bio, Nature & Agricultural | 0 | 0.0% |
| Physical & Health Sciences | 0 | 0.0% |
| Psychology | 0 | 0.0% |
| Social Sciences | 2 | 5.9% |
| Engineering | 0 | 0.0% |
| Multidisciplinary Studies | 0 | 0.0% |
| Science & Technology | 0 | 0.0% |
| Business | 0 | 0.0% |
| Education | 32 | 94.1% |
| Literature & Languages | 0 | 0.0% |
| Liberal Arts & History | 0 | 0.0% |
| Visual & Performing Arts | 0 | 0.0% |
| Communications | 0 | 0.0% |
| Arts & Humanities | 0 | 0.0% |
| Total | 34 | 100.0% |
Transportation & Commute in Keller
Vehicle Availability by Sex in Keller
The most prevalent vehicle ownership categories in Keller are males with 2 vehicles (22, accounting for 73.3%) and females with 2 vehicles (9, making up 71.0%).
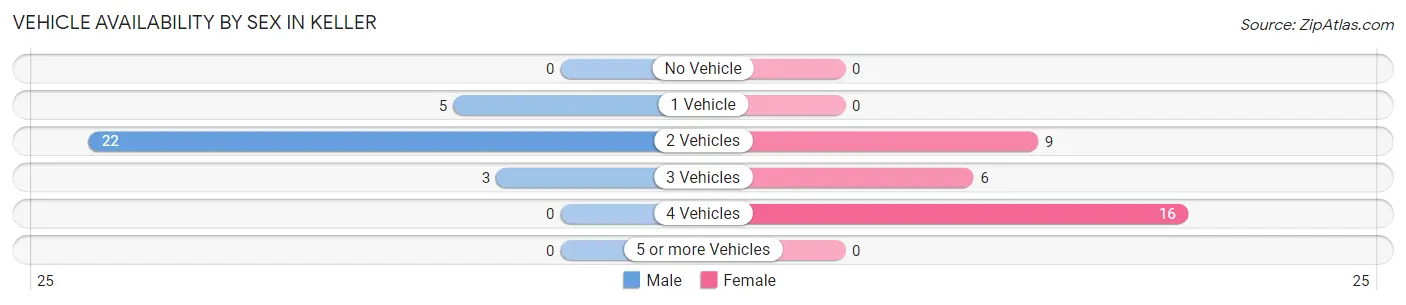
| Vehicles Available | Male | Female |
| No Vehicle | 0 (0.0%) | 0 (0.0%) |
| 1 Vehicle | 5 (16.7%) | 0 (0.0%) |
| 2 Vehicles | 22 (73.3%) | 9 (29.0%) |
| 3 Vehicles | 3 (10.0%) | 6 (19.4%) |
| 4 Vehicles | 0 (0.0%) | 16 (51.6%) |
| 5 or more Vehicles | 0 (0.0%) | 0 (0.0%) |
| Total | 30 (100.0%) | 31 (100.0%) |
Commute Time in Keller
The most frequently occuring commute durations in Keller are 5 to 9 minutes (22 commuters, 31.0%), 60 to 89 minutes (17 commuters, 23.9%), and 30 to 34 minutes (10 commuters, 14.1%).
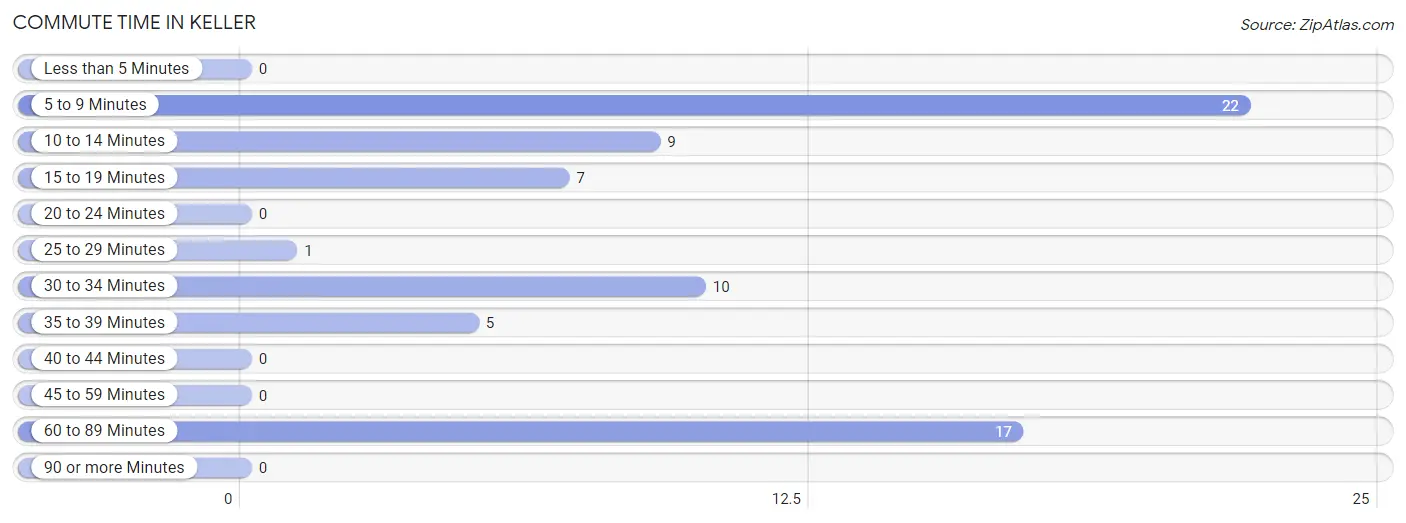
| Commute Time | # Commuters | % Commuters |
| Less than 5 Minutes | 0 | 0.0% |
| 5 to 9 Minutes | 22 | 31.0% |
| 10 to 14 Minutes | 9 | 12.7% |
| 15 to 19 Minutes | 7 | 9.9% |
| 20 to 24 Minutes | 0 | 0.0% |
| 25 to 29 Minutes | 1 | 1.4% |
| 30 to 34 Minutes | 10 | 14.1% |
| 35 to 39 Minutes | 5 | 7.0% |
| 40 to 44 Minutes | 0 | 0.0% |
| 45 to 59 Minutes | 0 | 0.0% |
| 60 to 89 Minutes | 17 | 23.9% |
| 90 or more Minutes | 0 | 0.0% |
Commute Time by Sex in Keller
The most common commute times in Keller are 60 to 89 minutes (17 commuters, 51.5%) for males and 5 to 9 minutes (17 commuters, 44.7%) for females.
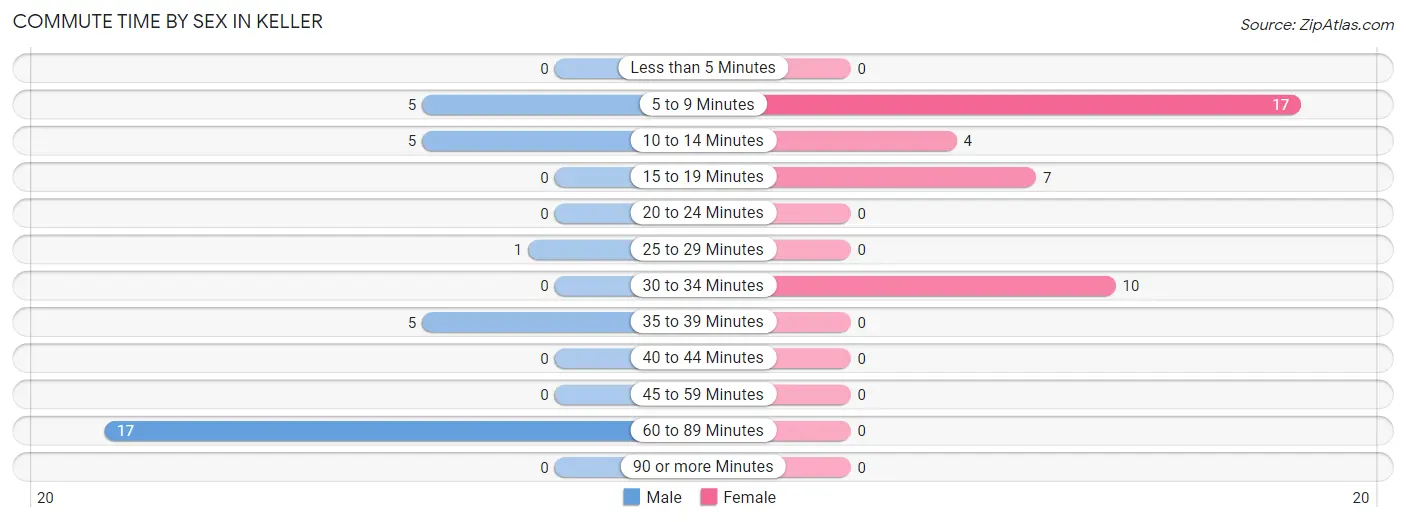
| Commute Time | Male | Female |
| Less than 5 Minutes | 0 (0.0%) | 0 (0.0%) |
| 5 to 9 Minutes | 5 (15.1%) | 17 (44.7%) |
| 10 to 14 Minutes | 5 (15.1%) | 4 (10.5%) |
| 15 to 19 Minutes | 0 (0.0%) | 7 (18.4%) |
| 20 to 24 Minutes | 0 (0.0%) | 0 (0.0%) |
| 25 to 29 Minutes | 1 (3.0%) | 0 (0.0%) |
| 30 to 34 Minutes | 0 (0.0%) | 10 (26.3%) |
| 35 to 39 Minutes | 5 (15.1%) | 0 (0.0%) |
| 40 to 44 Minutes | 0 (0.0%) | 0 (0.0%) |
| 45 to 59 Minutes | 0 (0.0%) | 0 (0.0%) |
| 60 to 89 Minutes | 17 (51.5%) | 0 (0.0%) |
| 90 or more Minutes | 0 (0.0%) | 0 (0.0%) |
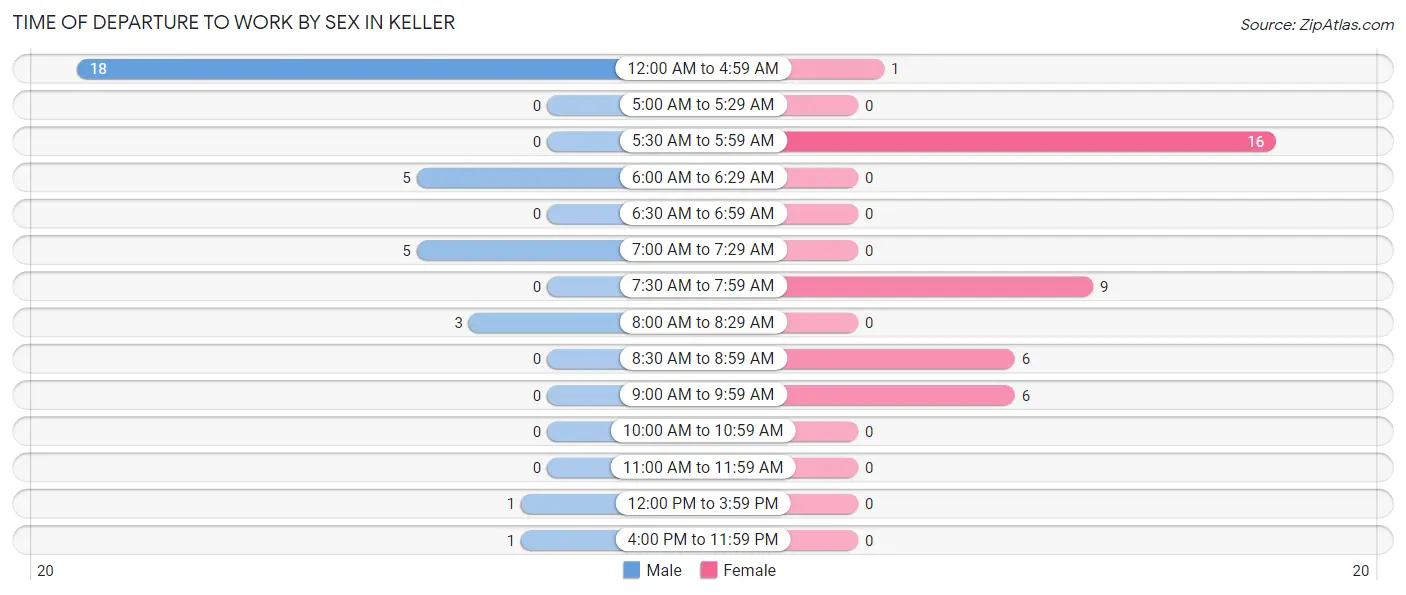
Time of Departure to Work by Sex in Keller
The most frequent times of departure to work in Keller are 12:00 AM to 4:59 AM (18, 54.5%) for males and 5:30 AM to 5:59 AM (16, 42.1%) for females.
| Time of Departure | Male | Female |
| 12:00 AM to 4:59 AM | 18 (54.5%) | 1 (2.6%) |
| 5:00 AM to 5:29 AM | 0 (0.0%) | 0 (0.0%) |
| 5:30 AM to 5:59 AM | 0 (0.0%) | 16 (42.1%) |
| 6:00 AM to 6:29 AM | 5 (15.1%) | 0 (0.0%) |
| 6:30 AM to 6:59 AM | 0 (0.0%) | 0 (0.0%) |
| 7:00 AM to 7:29 AM | 5 (15.1%) | 0 (0.0%) |
| 7:30 AM to 7:59 AM | 0 (0.0%) | 9 (23.7%) |
| 8:00 AM to 8:29 AM | 3 (9.1%) | 0 (0.0%) |
| 8:30 AM to 8:59 AM | 0 (0.0%) | 6 (15.8%) |
| 9:00 AM to 9:59 AM | 0 (0.0%) | 6 (15.8%) |
| 10:00 AM to 10:59 AM | 0 (0.0%) | 0 (0.0%) |
| 11:00 AM to 11:59 AM | 0 (0.0%) | 0 (0.0%) |
| 12:00 PM to 3:59 PM | 1 (3.0%) | 0 (0.0%) |
| 4:00 PM to 11:59 PM | 1 (3.0%) | 0 (0.0%) |
| Total | 33 (100.0%) | 38 (100.0%) |
Housing Occupancy in Keller
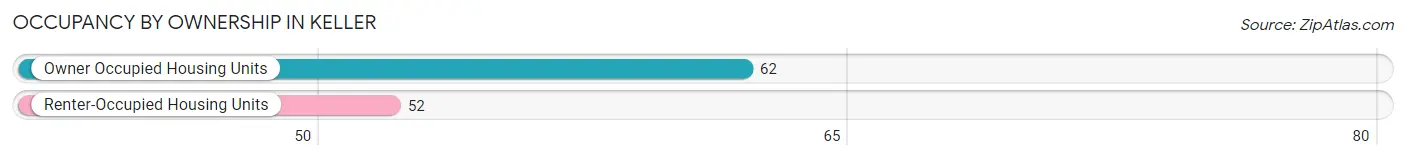
Occupancy by Ownership in Keller
Of the total 114 dwellings in Keller, owner-occupied units account for 62 (54.4%), while renter-occupied units make up 52 (45.6%).
| Occupancy | # Housing Units | % Housing Units |
| Owner Occupied Housing Units | 62 | 54.4% |
| Renter-Occupied Housing Units | 52 | 45.6% |
| Total Occupied Housing Units | 114 | 100.0% |
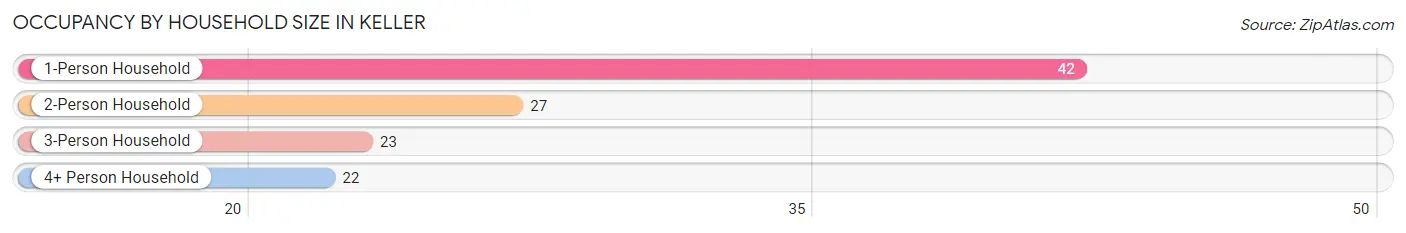
Occupancy by Household Size in Keller
| Household Size | # Housing Units | % Housing Units |
| 1-Person Household | 42 | 36.8% |
| 2-Person Household | 27 | 23.7% |
| 3-Person Household | 23 | 20.2% |
| 4+ Person Household | 22 | 19.3% |
| Total Housing Units | 114 | 100.0% |
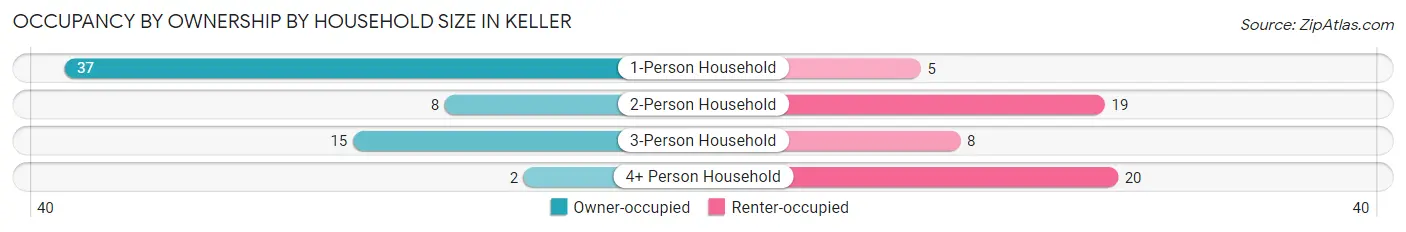
Occupancy by Ownership by Household Size in Keller
| Household Size | Owner-occupied | Renter-occupied |
| 1-Person Household | 37 (88.1%) | 5 (11.9%) |
| 2-Person Household | 8 (29.6%) | 19 (70.4%) |
| 3-Person Household | 15 (65.2%) | 8 (34.8%) |
| 4+ Person Household | 2 (9.1%) | 20 (90.9%) |
| Total Housing Units | 62 (54.4%) | 52 (45.6%) |
Occupancy by Educational Attainment in Keller
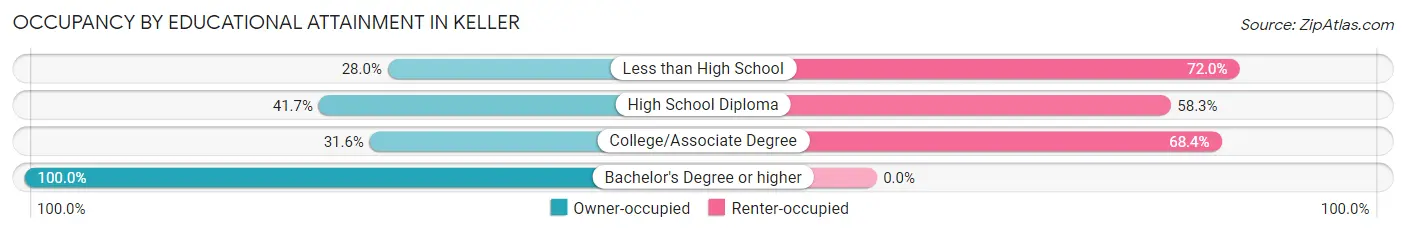
| Household Size | Owner-occupied | Renter-occupied |
| Less than High School | 7 (28.0%) | 18 (72.0%) |
| High School Diploma | 15 (41.7%) | 21 (58.3%) |
| College/Associate Degree | 6 (31.6%) | 13 (68.4%) |
| Bachelor's Degree or higher | 34 (100.0%) | 0 (0.0%) |
Occupancy by Age of Householder in Keller
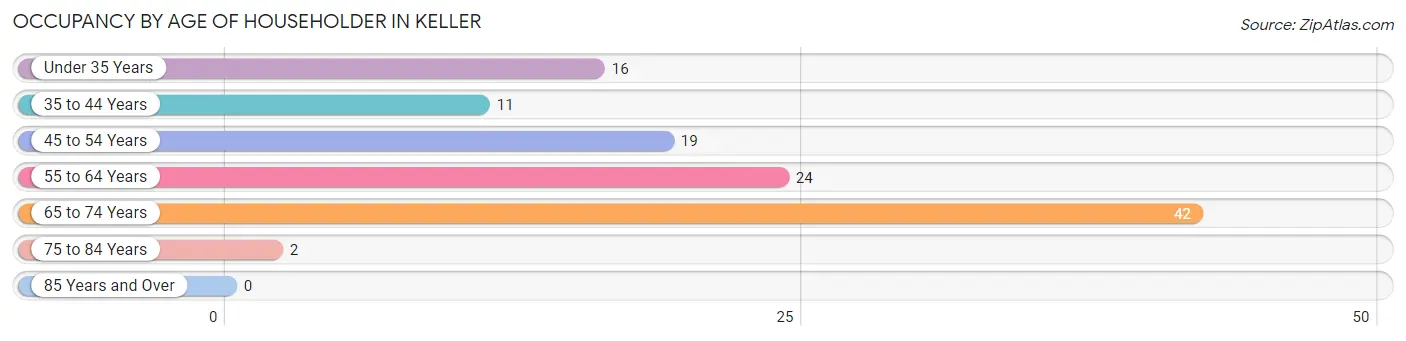
| Age Bracket | # Households | % Households |
| Under 35 Years | 16 | 14.0% |
| 35 to 44 Years | 11 | 9.7% |
| 45 to 54 Years | 19 | 16.7% |
| 55 to 64 Years | 24 | 21.0% |
| 65 to 74 Years | 42 | 36.8% |
| 75 to 84 Years | 2 | 1.8% |
| 85 Years and Over | 0 | 0.0% |
| Total | 114 | 100.0% |
Housing Finances in Keller
Median Income by Occupancy in Keller
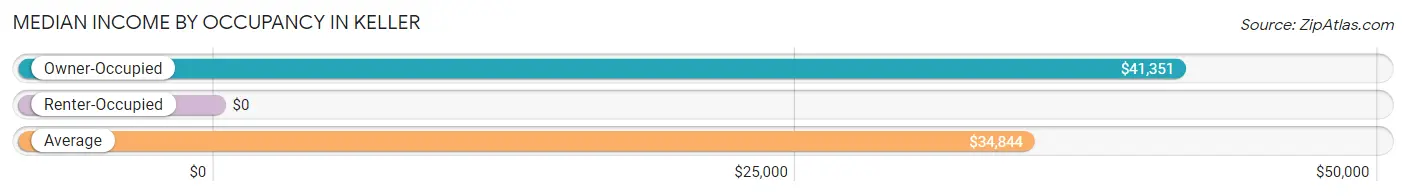
| Occupancy Type | # Households | Median Income |
| Owner-Occupied | 62 (54.4%) | $41,351 |
| Renter-Occupied | 52 (45.6%) | $0 |
| Average | 114 (100.0%) | $34,844 |
Occupancy by Householder Income Bracket in Keller
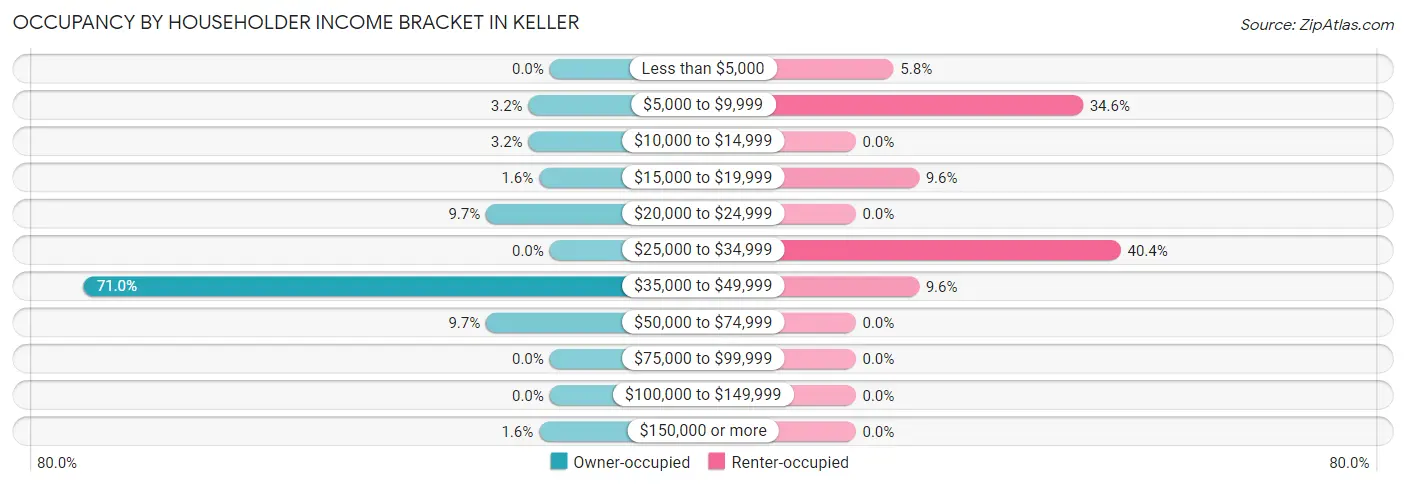
| Income Bracket | Owner-occupied | Renter-occupied |
| Less than $5,000 | 0 (0.0%) | 3 (5.8%) |
| $5,000 to $9,999 | 2 (3.2%) | 18 (34.6%) |
| $10,000 to $14,999 | 2 (3.2%) | 0 (0.0%) |
| $15,000 to $19,999 | 1 (1.6%) | 5 (9.6%) |
| $20,000 to $24,999 | 6 (9.7%) | 0 (0.0%) |
| $25,000 to $34,999 | 0 (0.0%) | 21 (40.4%) |
| $35,000 to $49,999 | 44 (71.0%) | 5 (9.6%) |
| $50,000 to $74,999 | 6 (9.7%) | 0 (0.0%) |
| $75,000 to $99,999 | 0 (0.0%) | 0 (0.0%) |
| $100,000 to $149,999 | 0 (0.0%) | 0 (0.0%) |
| $150,000 or more | 1 (1.6%) | 0 (0.0%) |
| Total | 62 (100.0%) | 52 (100.0%) |
Monthly Housing Cost Tiers in Keller
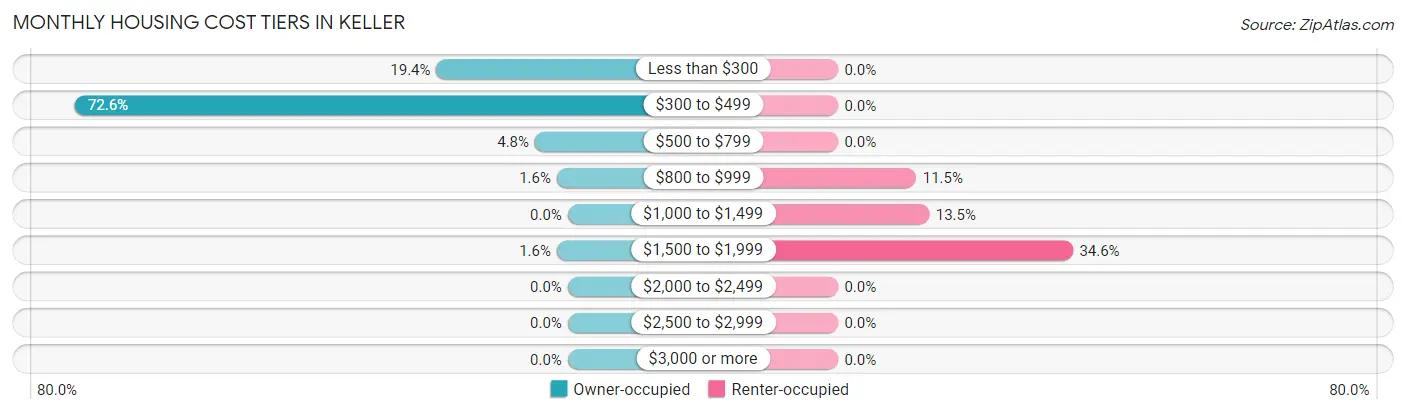
| Monthly Cost | Owner-occupied | Renter-occupied |
| Less than $300 | 12 (19.4%) | 0 (0.0%) |
| $300 to $499 | 45 (72.6%) | 0 (0.0%) |
| $500 to $799 | 3 (4.8%) | 0 (0.0%) |
| $800 to $999 | 1 (1.6%) | 6 (11.5%) |
| $1,000 to $1,499 | 0 (0.0%) | 7 (13.5%) |
| $1,500 to $1,999 | 1 (1.6%) | 18 (34.6%) |
| $2,000 to $2,499 | 0 (0.0%) | 0 (0.0%) |
| $2,500 to $2,999 | 0 (0.0%) | 0 (0.0%) |
| $3,000 or more | 0 (0.0%) | 0 (0.0%) |
| Total | 62 (100.0%) | 52 (100.0%) |
Physical Housing Characteristics in Keller
Housing Structures in Keller
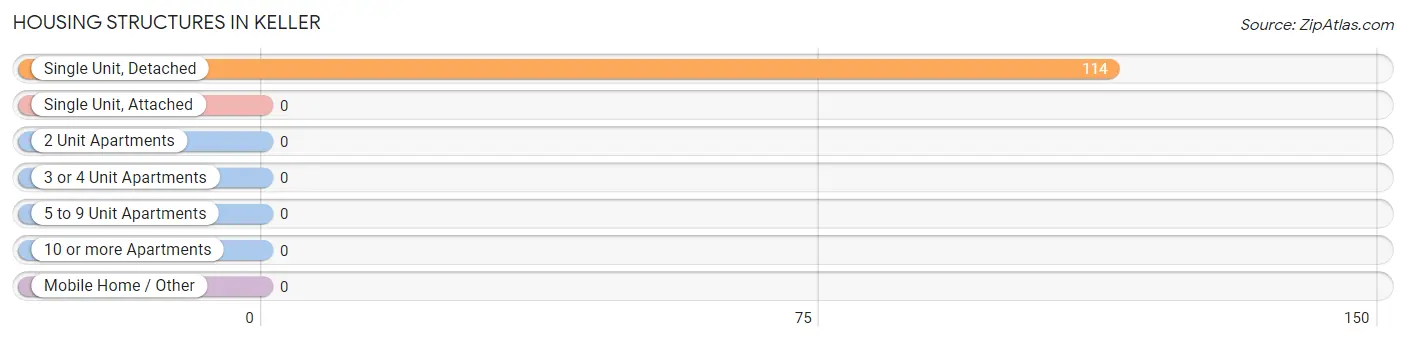
| Structure Type | # Housing Units | % Housing Units |
| Single Unit, Detached | 114 | 100.0% |
| Single Unit, Attached | 0 | 0.0% |
| 2 Unit Apartments | 0 | 0.0% |
| 3 or 4 Unit Apartments | 0 | 0.0% |
| 5 to 9 Unit Apartments | 0 | 0.0% |
| 10 or more Apartments | 0 | 0.0% |
| Mobile Home / Other | 0 | 0.0% |
| Total | 114 | 100.0% |
Housing Structures by Occupancy in Keller
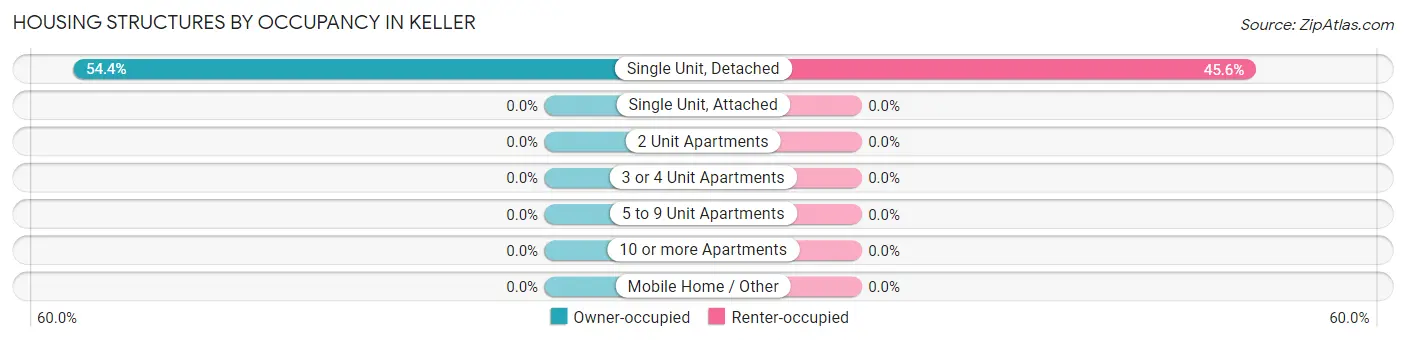
| Structure Type | Owner-occupied | Renter-occupied |
| Single Unit, Detached | 62 (54.4%) | 52 (45.6%) |
| Single Unit, Attached | 0 (0.0%) | 0 (0.0%) |
| 2 Unit Apartments | 0 (0.0%) | 0 (0.0%) |
| 3 or 4 Unit Apartments | 0 (0.0%) | 0 (0.0%) |
| 5 to 9 Unit Apartments | 0 (0.0%) | 0 (0.0%) |
| 10 or more Apartments | 0 (0.0%) | 0 (0.0%) |
| Mobile Home / Other | 0 (0.0%) | 0 (0.0%) |
| Total | 62 (54.4%) | 52 (45.6%) |
Housing Structures by Number of Rooms in Keller
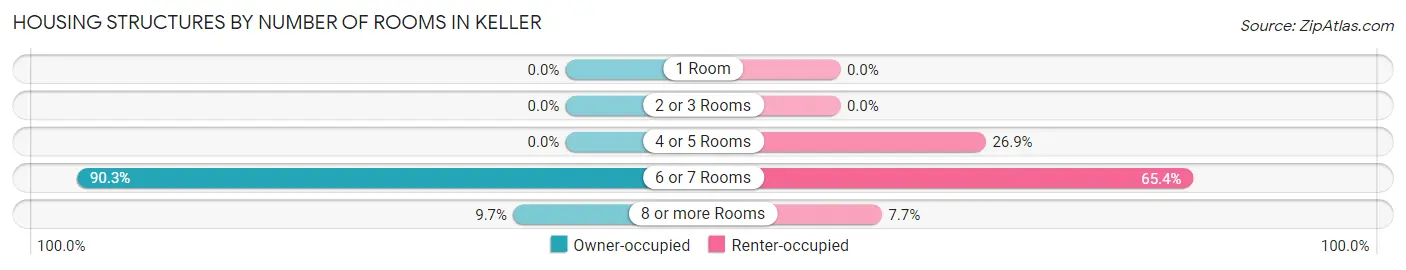
| Number of Rooms | Owner-occupied | Renter-occupied |
| 1 Room | 0 (0.0%) | 0 (0.0%) |
| 2 or 3 Rooms | 0 (0.0%) | 0 (0.0%) |
| 4 or 5 Rooms | 0 (0.0%) | 14 (26.9%) |
| 6 or 7 Rooms | 56 (90.3%) | 34 (65.4%) |
| 8 or more Rooms | 6 (9.7%) | 4 (7.7%) |
| Total | 62 (100.0%) | 52 (100.0%) |
Housing Structure by Heating Type in Keller
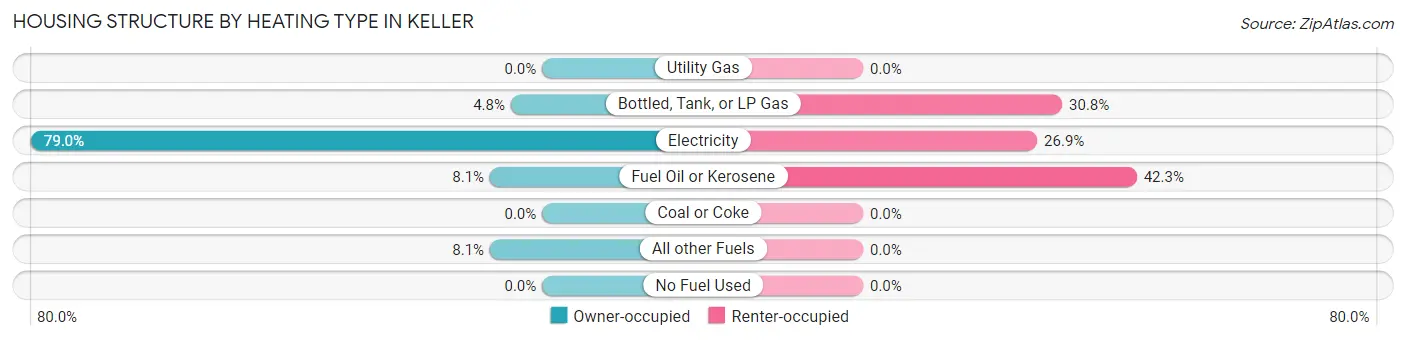
| Heating Type | Owner-occupied | Renter-occupied |
| Utility Gas | 0 (0.0%) | 0 (0.0%) |
| Bottled, Tank, or LP Gas | 3 (4.8%) | 16 (30.8%) |
| Electricity | 49 (79.0%) | 14 (26.9%) |
| Fuel Oil or Kerosene | 5 (8.1%) | 22 (42.3%) |
| Coal or Coke | 0 (0.0%) | 0 (0.0%) |
| All other Fuels | 5 (8.1%) | 0 (0.0%) |
| No Fuel Used | 0 (0.0%) | 0 (0.0%) |
| Total | 62 (100.0%) | 52 (100.0%) |
Household Vehicle Usage in Keller
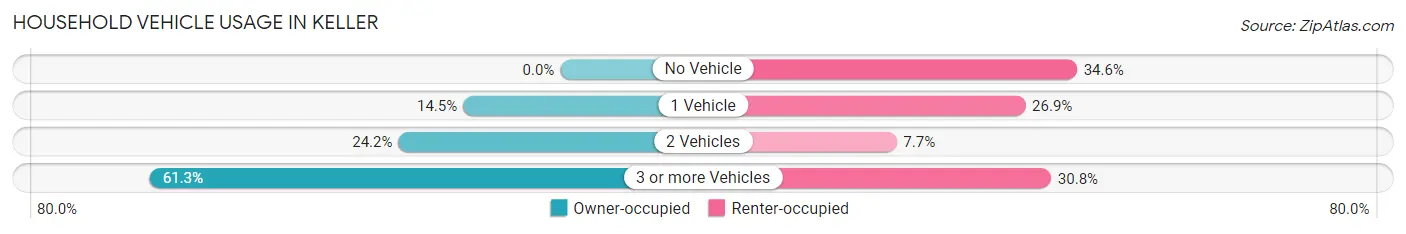
| Vehicles per Household | Owner-occupied | Renter-occupied |
| No Vehicle | 0 (0.0%) | 18 (34.6%) |
| 1 Vehicle | 9 (14.5%) | 14 (26.9%) |
| 2 Vehicles | 15 (24.2%) | 4 (7.7%) |
| 3 or more Vehicles | 38 (61.3%) | 16 (30.8%) |
| Total | 62 (100.0%) | 52 (100.0%) |
Real Estate & Mortgages in Keller
Real Estate and Mortgage Overview in Keller
| Characteristic | Without Mortgage | With Mortgage |
| Housing Units | 60 | 2 |
| Median Property Value | - | - |
| Median Household Income | $41,284 | $1 |
| Monthly Housing Costs | $434 | $0 |
| Real Estate Taxes | $706 | $0 |
Property Value by Mortgage Status in Keller
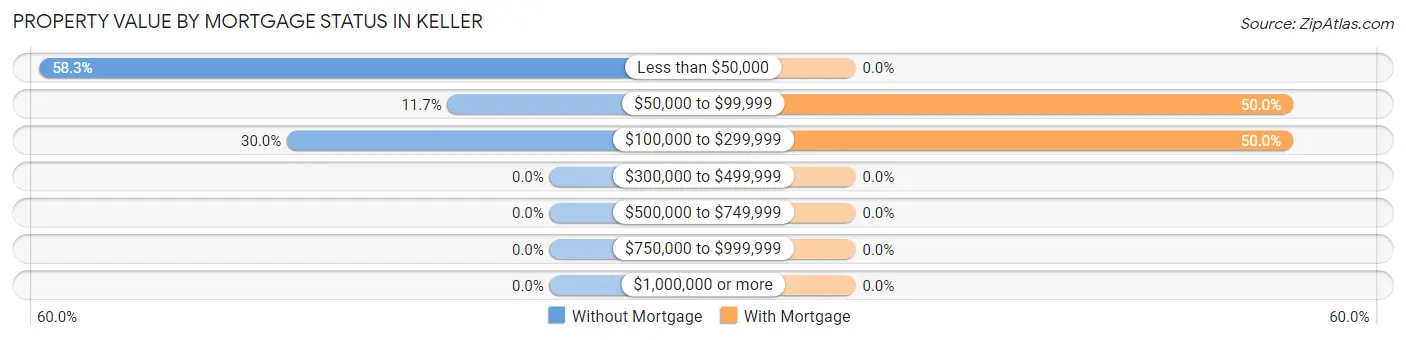
| Property Value | Without Mortgage | With Mortgage |
| Less than $50,000 | 35 (58.3%) | 0 (0.0%) |
| $50,000 to $99,999 | 7 (11.7%) | 1 (50.0%) |
| $100,000 to $299,999 | 18 (30.0%) | 1 (50.0%) |
| $300,000 to $499,999 | 0 (0.0%) | 0 (0.0%) |
| $500,000 to $749,999 | 0 (0.0%) | 0 (0.0%) |
| $750,000 to $999,999 | 0 (0.0%) | 0 (0.0%) |
| $1,000,000 or more | 0 (0.0%) | 0 (0.0%) |
| Total | 60 (100.0%) | 2 (100.0%) |
Household Income by Mortgage Status in Keller
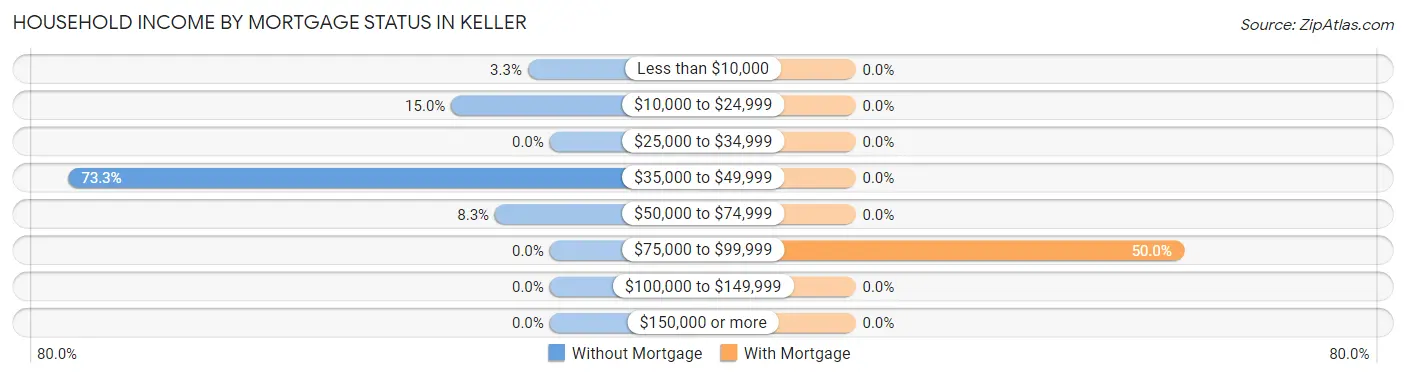
| Household Income | Without Mortgage | With Mortgage |
| Less than $10,000 | 2 (3.3%) | 0 (0.0%) |
| $10,000 to $24,999 | 9 (15.0%) | 0 (0.0%) |
| $25,000 to $34,999 | 0 (0.0%) | 0 (0.0%) |
| $35,000 to $49,999 | 44 (73.3%) | 0 (0.0%) |
| $50,000 to $74,999 | 5 (8.3%) | 0 (0.0%) |
| $75,000 to $99,999 | 0 (0.0%) | 1 (50.0%) |
| $100,000 to $149,999 | 0 (0.0%) | 0 (0.0%) |
| $150,000 or more | 0 (0.0%) | 0 (0.0%) |
| Total | 60 (100.0%) | 2 (100.0%) |
Property Value to Household Income Ratio in Keller
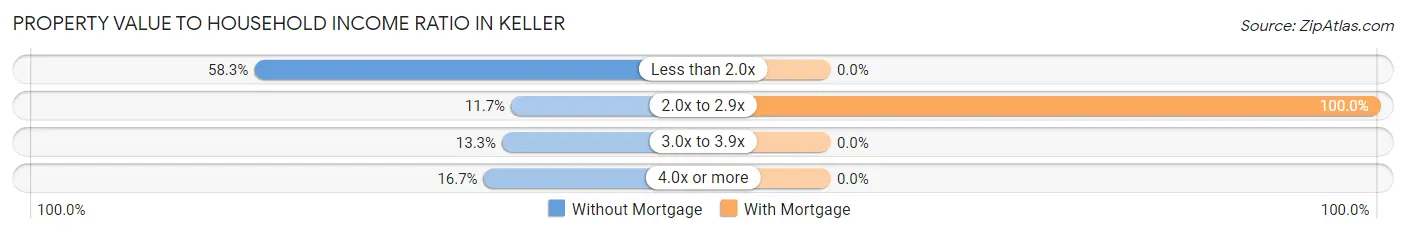
| Value-to-Income Ratio | Without Mortgage | With Mortgage |
| Less than 2.0x | 35 (58.3%) | 0 (0.0%) |
| 2.0x to 2.9x | 7 (11.7%) | 2 (100.0%) |
| 3.0x to 3.9x | 8 (13.3%) | 0 (0.0%) |
| 4.0x or more | 10 (16.7%) | 0 (0.0%) |
| Total | 60 (100.0%) | 2 (100.0%) |
Real Estate Taxes by Mortgage Status in Keller
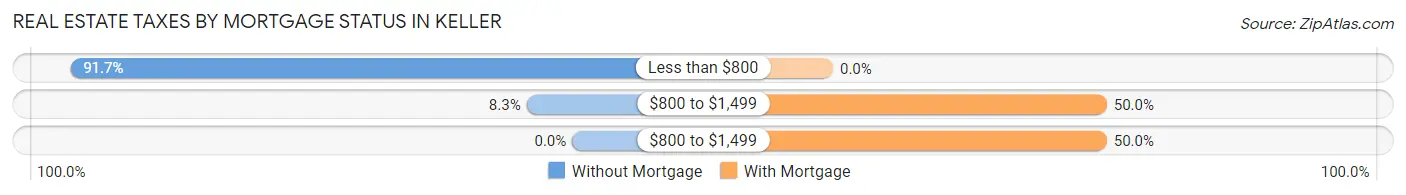
| Property Taxes | Without Mortgage | With Mortgage |
| Less than $800 | 55 (91.7%) | 0 (0.0%) |
| $800 to $1,499 | 5 (8.3%) | 1 (50.0%) |
| $800 to $1,499 | 0 (0.0%) | 1 (50.0%) |
| Total | 60 (100.0%) | 2 (100.0%) |
Health & Disability in Keller
Health Insurance Coverage by Age in Keller
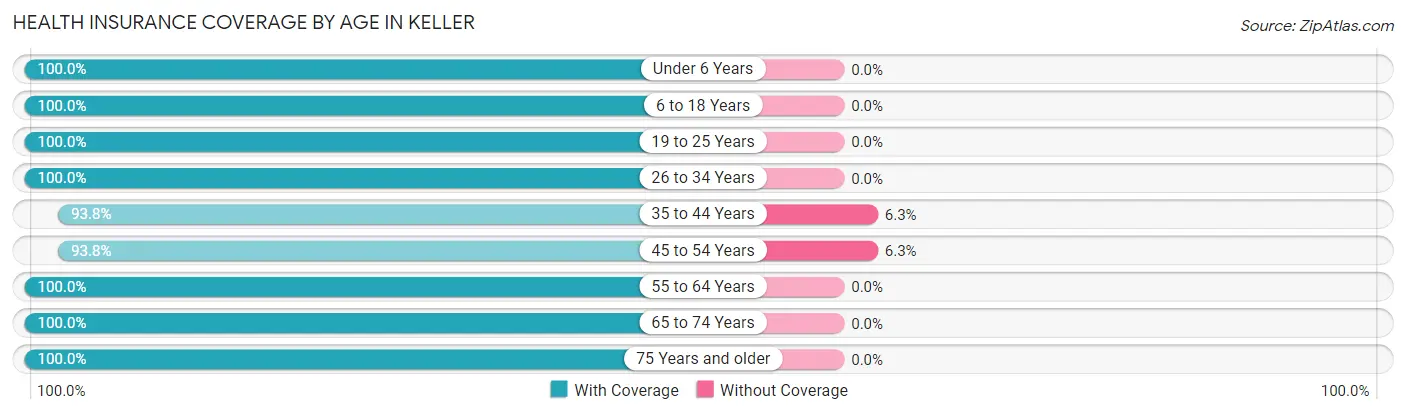
| Age Bracket | With Coverage | Without Coverage |
| Under 6 Years | 12 (100.0%) | 0 (0.0%) |
| 6 to 18 Years | 117 (100.0%) | 0 (0.0%) |
| 19 to 25 Years | 6 (100.0%) | 0 (0.0%) |
| 26 to 34 Years | 16 (100.0%) | 0 (0.0%) |
| 35 to 44 Years | 15 (93.8%) | 1 (6.2%) |
| 45 to 54 Years | 30 (93.8%) | 2 (6.2%) |
| 55 to 64 Years | 30 (100.0%) | 0 (0.0%) |
| 65 to 74 Years | 42 (100.0%) | 0 (0.0%) |
| 75 Years and older | 15 (100.0%) | 0 (0.0%) |
| Total | 283 (99.0%) | 3 (1.1%) |
Health Insurance Coverage by Citizenship Status in Keller

| Citizenship Status | With Coverage | Without Coverage |
| Native Born | 12 (100.0%) | 0 (0.0%) |
| Foreign Born, Citizen | 117 (100.0%) | 0 (0.0%) |
| Foreign Born, not a Citizen | 6 (100.0%) | 0 (0.0%) |
Health Insurance Coverage by Household Income in Keller
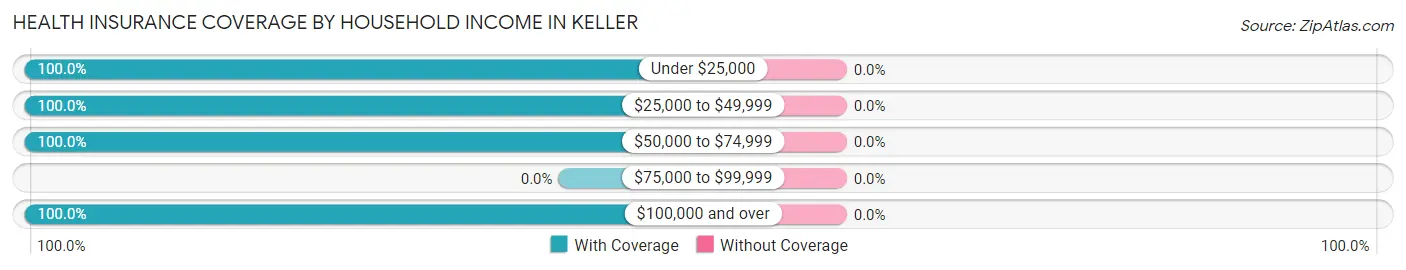
| Household Income | With Coverage | Without Coverage |
| Under $25,000 | 114 (100.0%) | 0 (0.0%) |
| $25,000 to $49,999 | 137 (100.0%) | 0 (0.0%) |
| $50,000 to $74,999 | 19 (100.0%) | 0 (0.0%) |
| $75,000 to $99,999 | 0 (0.0%) | 0 (0.0%) |
| $100,000 and over | 4 (100.0%) | 0 (0.0%) |
Public vs Private Health Insurance Coverage by Age in Keller
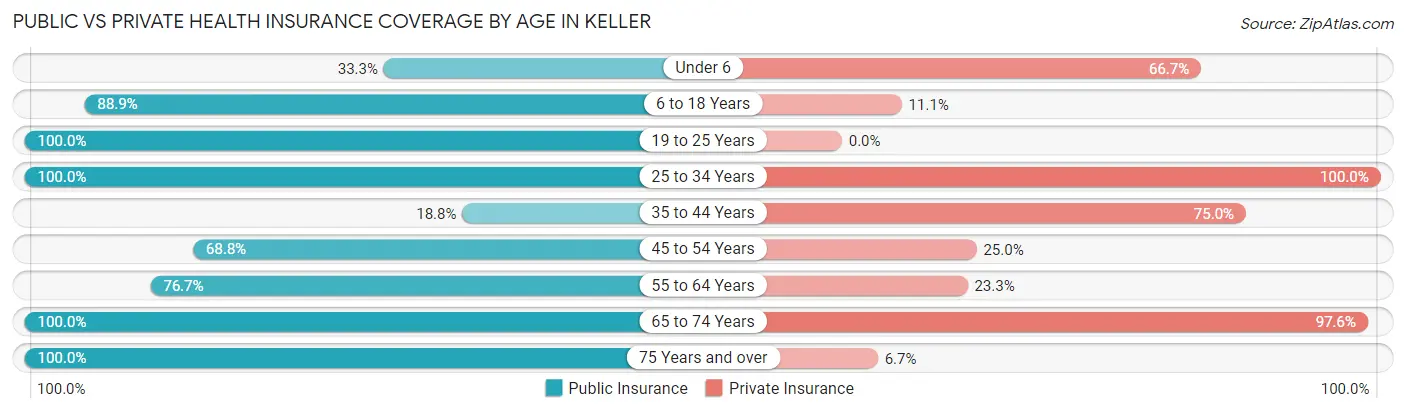
| Age Bracket | Public Insurance | Private Insurance |
| Under 6 | 4 (33.3%) | 8 (66.7%) |
| 6 to 18 Years | 104 (88.9%) | 13 (11.1%) |
| 19 to 25 Years | 6 (100.0%) | 0 (0.0%) |
| 25 to 34 Years | 16 (100.0%) | 16 (100.0%) |
| 35 to 44 Years | 3 (18.8%) | 12 (75.0%) |
| 45 to 54 Years | 22 (68.8%) | 8 (25.0%) |
| 55 to 64 Years | 23 (76.7%) | 7 (23.3%) |
| 65 to 74 Years | 42 (100.0%) | 41 (97.6%) |
| 75 Years and over | 15 (100.0%) | 1 (6.7%) |
| Total | 235 (82.2%) | 106 (37.1%) |
Disability Status by Sex by Age in Keller
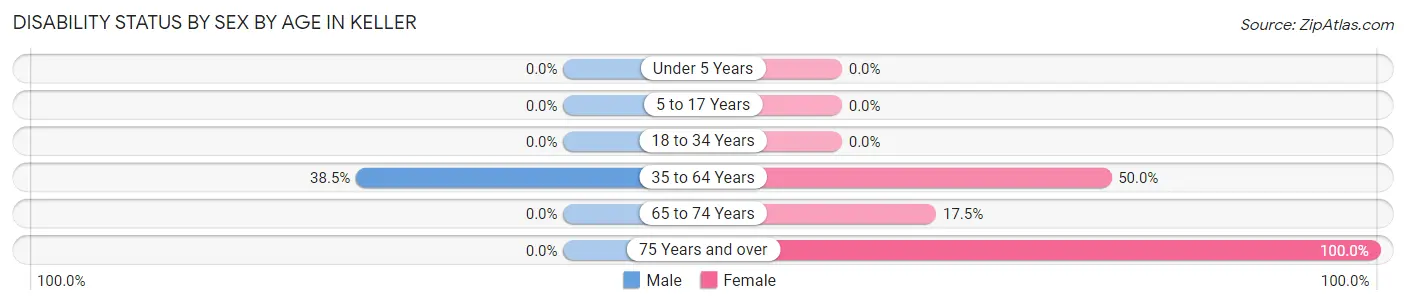
| Age Bracket | Male | Female |
| Under 5 Years | 0 (0.0%) | 0 (0.0%) |
| 5 to 17 Years | 0 (0.0%) | 0 (0.0%) |
| 18 to 34 Years | 0 (0.0%) | 0 (0.0%) |
| 35 to 64 Years | 10 (38.5%) | 26 (50.0%) |
| 65 to 74 Years | 0 (0.0%) | 7 (17.5%) |
| 75 Years and over | 0 (0.0%) | 1 (100.0%) |
Disability Class by Sex by Age in Keller
Disability Class: Hearing Difficulty
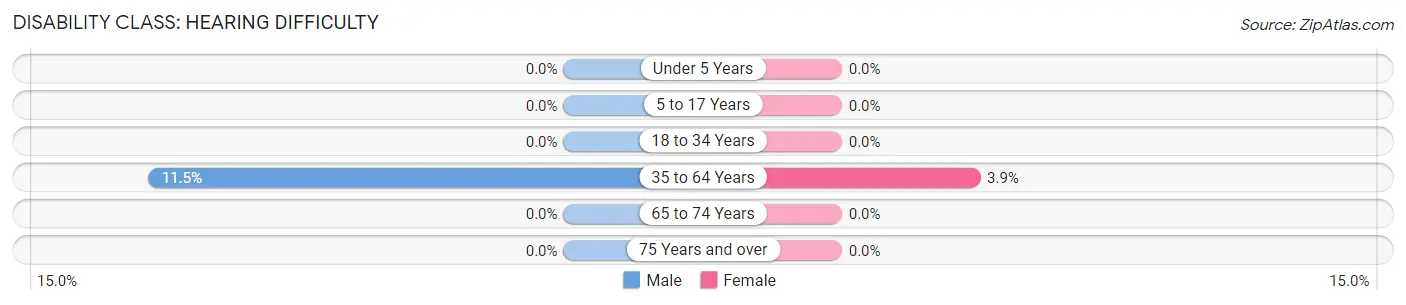
| Age Bracket | Male | Female |
| Under 5 Years | 0 (0.0%) | 0 (0.0%) |
| 5 to 17 Years | 0 (0.0%) | 0 (0.0%) |
| 18 to 34 Years | 0 (0.0%) | 0 (0.0%) |
| 35 to 64 Years | 3 (11.5%) | 2 (3.8%) |
| 65 to 74 Years | 0 (0.0%) | 0 (0.0%) |
| 75 Years and over | 0 (0.0%) | 0 (0.0%) |
Disability Class: Vision Difficulty
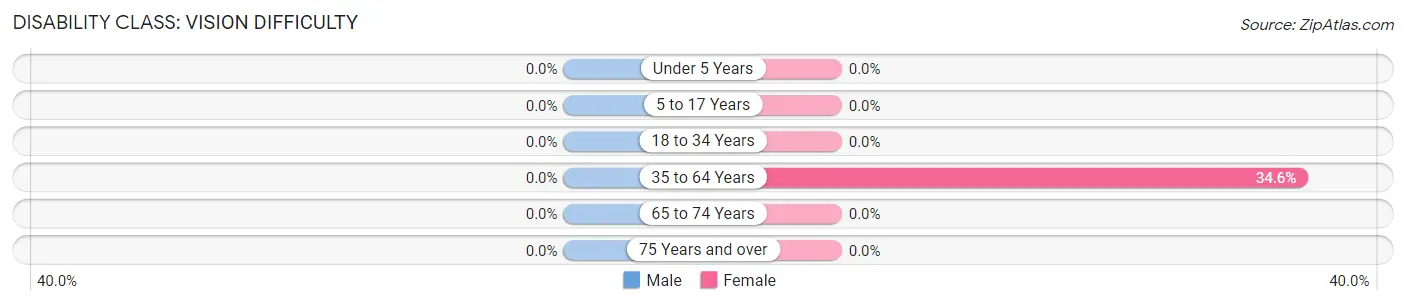
| Age Bracket | Male | Female |
| Under 5 Years | 0 (0.0%) | 0 (0.0%) |
| 5 to 17 Years | 0 (0.0%) | 0 (0.0%) |
| 18 to 34 Years | 0 (0.0%) | 0 (0.0%) |
| 35 to 64 Years | 0 (0.0%) | 18 (34.6%) |
| 65 to 74 Years | 0 (0.0%) | 0 (0.0%) |
| 75 Years and over | 0 (0.0%) | 0 (0.0%) |
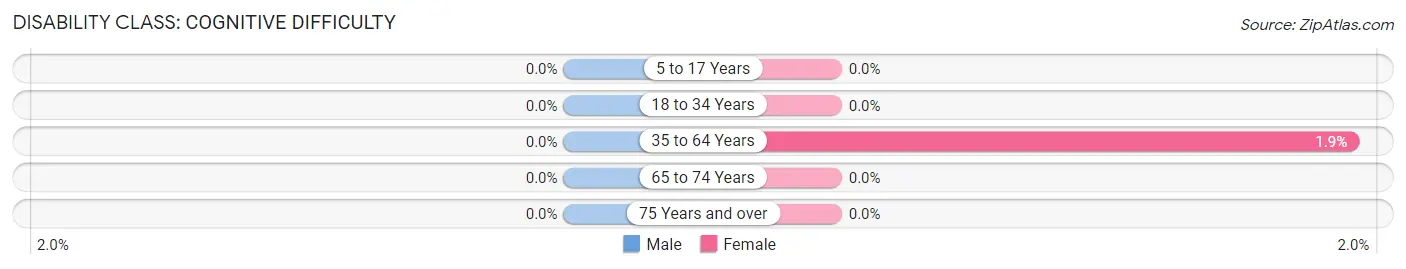
Disability Class: Cognitive Difficulty
| Age Bracket | Male | Female |
| 5 to 17 Years | 0 (0.0%) | 0 (0.0%) |
| 18 to 34 Years | 0 (0.0%) | 0 (0.0%) |
| 35 to 64 Years | 0 (0.0%) | 1 (1.9%) |
| 65 to 74 Years | 0 (0.0%) | 0 (0.0%) |
| 75 Years and over | 0 (0.0%) | 0 (0.0%) |
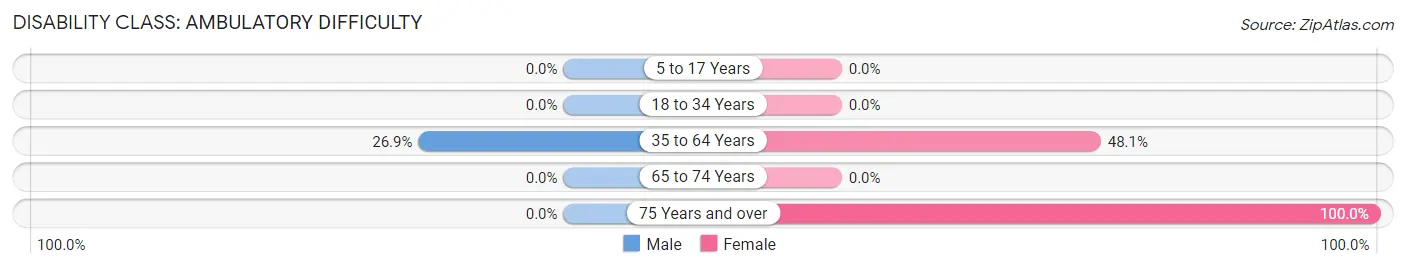
Disability Class: Ambulatory Difficulty
| Age Bracket | Male | Female |
| 5 to 17 Years | 0 (0.0%) | 0 (0.0%) |
| 18 to 34 Years | 0 (0.0%) | 0 (0.0%) |
| 35 to 64 Years | 7 (26.9%) | 25 (48.1%) |
| 65 to 74 Years | 0 (0.0%) | 0 (0.0%) |
| 75 Years and over | 0 (0.0%) | 1 (100.0%) |
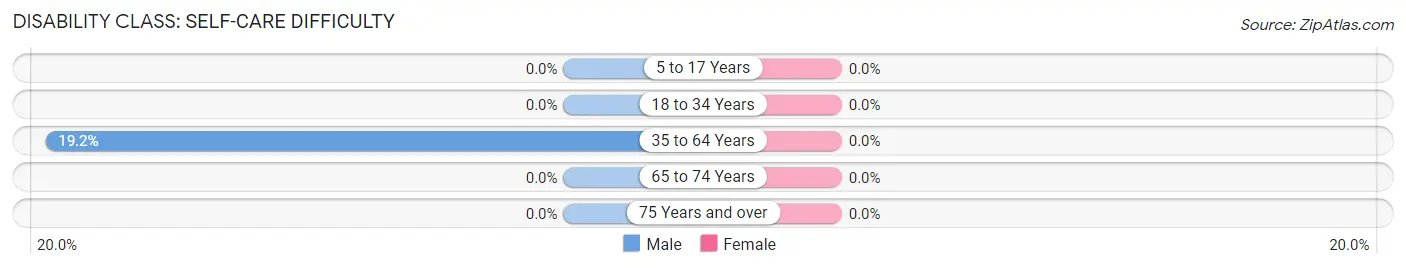
Disability Class: Self-Care Difficulty
| Age Bracket | Male | Female |
| 5 to 17 Years | 0 (0.0%) | 0 (0.0%) |
| 18 to 34 Years | 0 (0.0%) | 0 (0.0%) |
| 35 to 64 Years | 5 (19.2%) | 0 (0.0%) |
| 65 to 74 Years | 0 (0.0%) | 0 (0.0%) |
| 75 Years and over | 0 (0.0%) | 0 (0.0%) |
Technology Access in Keller
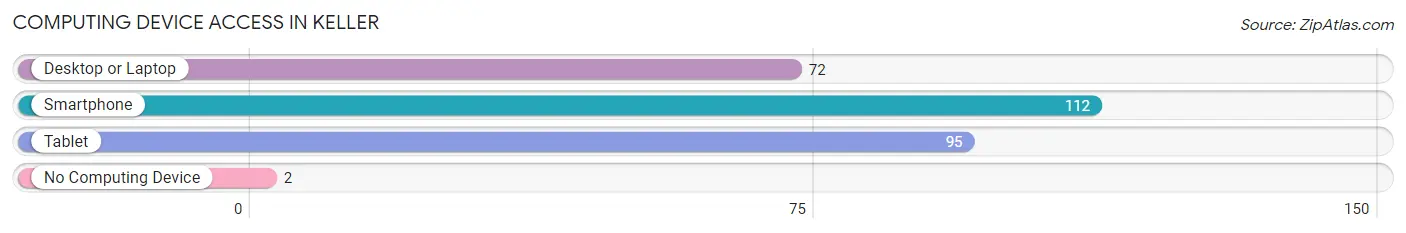
Computing Device Access in Keller
| Device Type | # Households | % Households |
| Desktop or Laptop | 72 | 63.2% |
| Smartphone | 112 | 98.3% |
| Tablet | 95 | 83.3% |
| No Computing Device | 2 | 1.8% |
| Total | 114 | 100.0% |
Internet Access in Keller
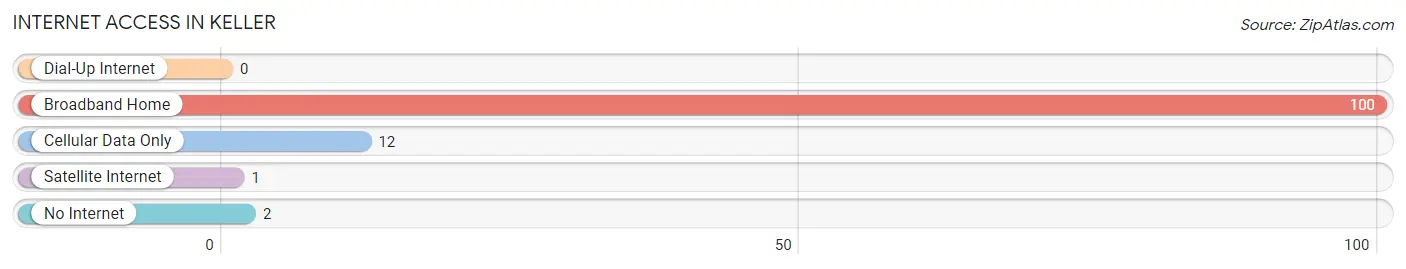
| Internet Type | # Households | % Households |
| Dial-Up Internet | 0 | 0.0% |
| Broadband Home | 100 | 87.7% |
| Cellular Data Only | 12 | 10.5% |
| Satellite Internet | 1 | 0.9% |
| No Internet | 2 | 1.8% |
| Total | 114 | 100.0% |
Keller Summary
Keller is a small town located in the state of Virginia, in the United States. It is situated in the southeastern part of the state, in the Hampton Roads region. The town has a population of approximately 8,000 people, and is part of the Virginia Beach-Norfolk-Newport News metropolitan area.
History
Keller was first settled in the early 1700s by English colonists. The town was originally known as “Keller’s Crossroads”, and was named after the Keller family, who were among the first settlers in the area. The town was officially incorporated in 1875, and was named after the Keller family.
In the late 1800s, Keller was a thriving agricultural community, with many farms and plantations in the area. The town was also home to a number of businesses, including a sawmill, a gristmill, and a general store.
In the early 1900s, the town began to experience a period of growth and development. The Norfolk and Western Railway built a line through the town, and the town became a popular stop for travelers. The town also became a popular destination for tourists, and many hotels and resorts were built in the area.
Geography
Keller is located in the southeastern part of Virginia, in the Hampton Roads region. The town is situated on the banks of the Elizabeth River, and is bordered by the cities of Norfolk and Portsmouth. The town is located approximately 25 miles from the Atlantic Ocean.
The town has a total area of 4.2 square miles, of which 0.2 square miles is water. The town is located in a humid subtropical climate zone, and experiences hot, humid summers and mild winters.
Economy
Keller’s economy is largely based on tourism and retail. The town is home to a number of hotels and resorts, as well as a variety of restaurants and shops. The town is also home to a number of manufacturing and industrial businesses, including a paper mill and a printing company.
The town is also home to a number of government and military installations, including the Naval Air Station Oceana and the Joint Expeditionary Base Little Creek-Fort Story.
Demographics
As of the 2010 census, Keller had a population of 8,000 people. The racial makeup of the town was 79.3% White, 14.2% African American, 0.7% Native American, 1.2% Asian, 0.1% Pacific Islander, and 4.5% from other races. Hispanic or Latino of any race were 4.7% of the population.
The median household income in Keller was $50,000, and the median family income was $60,000. The per capita income in the town was $25,000. About 8.5% of the population was below the poverty line.
Common Questions
What is Per Capita Income in Keller?
Per Capita income in Keller is $13,657.
What is the Median Family Income in Keller?
Median Family Income in Keller is $33,125.
What is the Median Household income in Keller?
Median Household Income in Keller is $34,844.
What is Inequality or Gini Index in Keller?
Inequality or Gini Index in Keller is 0.29.
What is the Total Population of Keller?
Total Population of Keller is 286.
What is the Total Male Population of Keller?
Total Male Population of Keller is 135.
What is the Total Female Population of Keller?
Total Female Population of Keller is 151.
What is the Ratio of Males per 100 Females in Keller?
There are 89.40 Males per 100 Females in Keller.
What is the Ratio of Females per 100 Males in Keller?
There are 111.85 Females per 100 Males in Keller.
What is the Median Population Age in Keller?
Median Population Age in Keller is 32.5 Years.
What is the Average Family Size in Keller
Average Family Size in Keller is 3.2 People.
What is the Average Household Size in Keller
Average Household Size in Keller is 2.4 People.
How Large is the Labor Force in Keller?
There are 72 People in the Labor Forcein in Keller.
What is the Percentage of People in the Labor Force in Keller?
44.7% of People are in the Labor Force in Keller.