Honaker, VA Map & Demographics
Honaker Map

Honaker Overview
$24,976
PER CAPITA INCOME
$57,273
AVG FAMILY INCOME
$45,491
AVG HOUSEHOLD INCOME
21.3%
WAGE / INCOME GAP [ % ]
78.7¢/ $1
WAGE / INCOME GAP [ $ ]
0.48
INEQUALITY / GINI INDEX
1,213
TOTAL POPULATION
610
MALE POPULATION
603
FEMALE POPULATION
101.16
MALES / 100 FEMALES
98.85
FEMALES / 100 MALES
40.7
MEDIAN AGE
3.5
AVG FAMILY SIZE
2.4
AVG HOUSEHOLD SIZE
464
LABOR FORCE [ PEOPLE ]
48.1%
PERCENT IN LABOR FORCE
3.2%
UNEMPLOYMENT RATE
Honaker Zip Codes
Honaker Area Codes
Income in Honaker
Income Overview in Honaker
Per Capita Income in Honaker is $24,976, while median incomes of families and households are $57,273 and $45,491 respectively.
| Characteristic | Number | Measure |
| Per Capita Income | 1,213 | $24,976 |
| Median Family Income | 276 | $57,273 |
| Mean Family Income | 276 | $64,622 |
| Median Household Income | 497 | $45,491 |
| Mean Household Income | 497 | $55,584 |
| Income Deficit | 276 | $0 |
| Wage / Income Gap (%) | 1,213 | 21.28% |
| Wage / Income Gap ($) | 1,213 | 78.72¢ per $1 |
| Gini / Inequality Index | 1,213 | 0.48 |
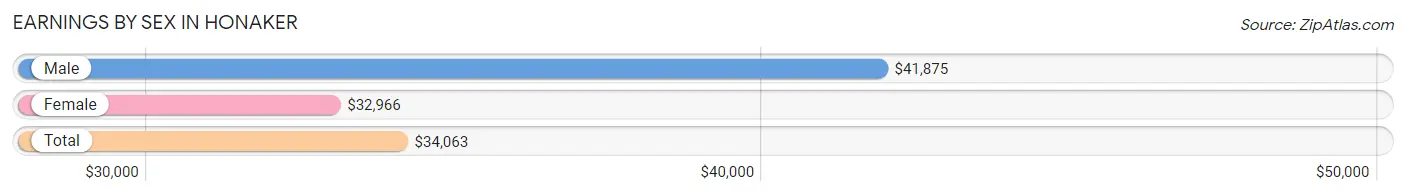
Earnings by Sex in Honaker
Average Earnings in Honaker are $34,063, $41,875 for men and $32,966 for women, a difference of 21.3%.
| Sex | Number | Average Earnings |
| Male | 239 (48.7%) | $41,875 |
| Female | 252 (51.3%) | $32,966 |
| Total | 491 (100.0%) | $34,063 |
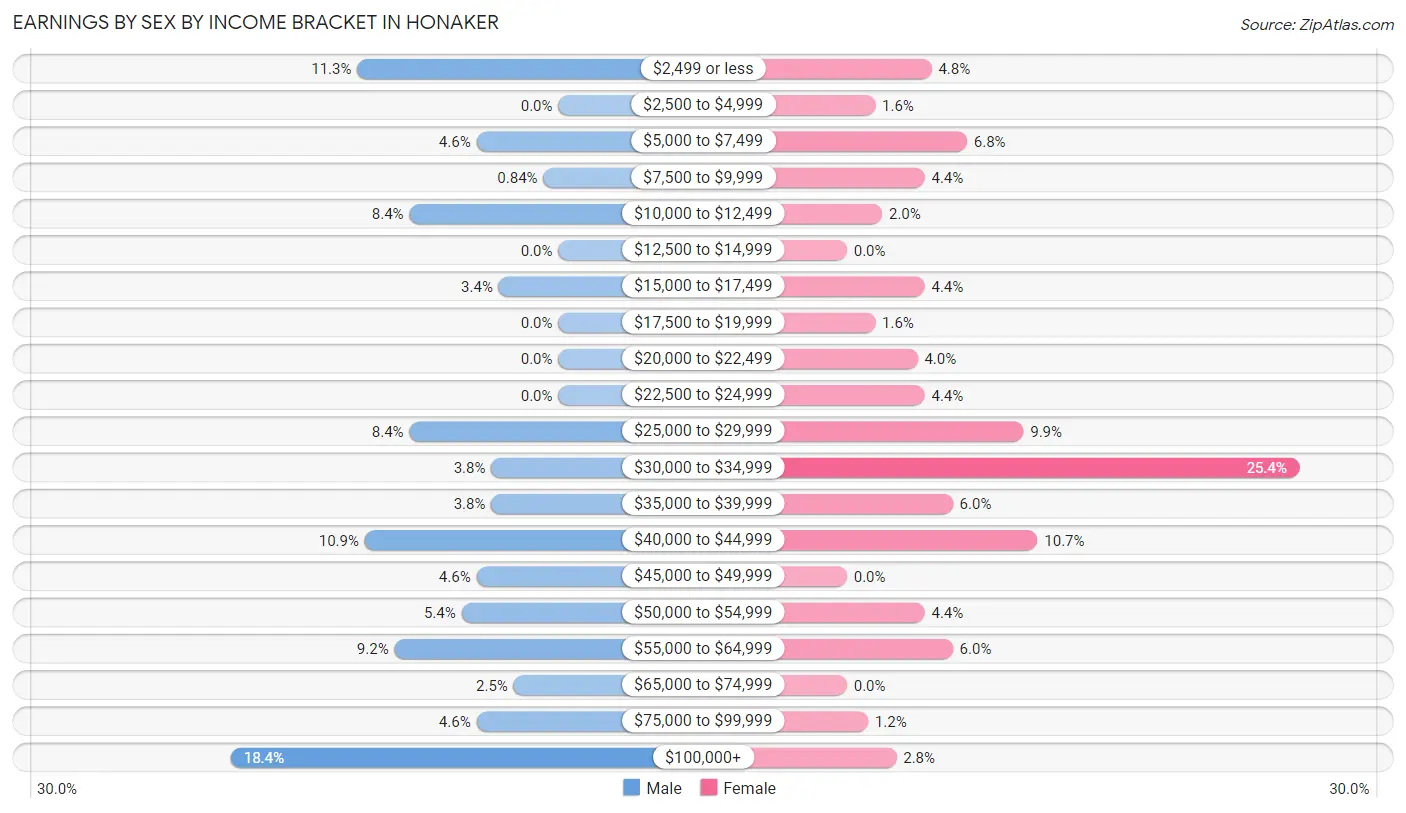
Earnings by Sex by Income Bracket in Honaker
The most common earnings brackets in Honaker are $100,000+ for men (44 | 18.4%) and $30,000 to $34,999 for women (64 | 25.4%).
| Income | Male | Female |
| $2,499 or less | 27 (11.3%) | 12 (4.8%) |
| $2,500 to $4,999 | 0 (0.0%) | 4 (1.6%) |
| $5,000 to $7,499 | 11 (4.6%) | 17 (6.8%) |
| $7,500 to $9,999 | 2 (0.8%) | 11 (4.4%) |
| $10,000 to $12,499 | 20 (8.4%) | 5 (2.0%) |
| $12,500 to $14,999 | 0 (0.0%) | 0 (0.0%) |
| $15,000 to $17,499 | 8 (3.4%) | 11 (4.4%) |
| $17,500 to $19,999 | 0 (0.0%) | 4 (1.6%) |
| $20,000 to $22,499 | 0 (0.0%) | 10 (4.0%) |
| $22,500 to $24,999 | 0 (0.0%) | 11 (4.4%) |
| $25,000 to $29,999 | 20 (8.4%) | 25 (9.9%) |
| $30,000 to $34,999 | 9 (3.8%) | 64 (25.4%) |
| $35,000 to $39,999 | 9 (3.8%) | 15 (5.9%) |
| $40,000 to $44,999 | 26 (10.9%) | 27 (10.7%) |
| $45,000 to $49,999 | 11 (4.6%) | 0 (0.0%) |
| $50,000 to $54,999 | 13 (5.4%) | 11 (4.4%) |
| $55,000 to $64,999 | 22 (9.2%) | 15 (5.9%) |
| $65,000 to $74,999 | 6 (2.5%) | 0 (0.0%) |
| $75,000 to $99,999 | 11 (4.6%) | 3 (1.2%) |
| $100,000+ | 44 (18.4%) | 7 (2.8%) |
| Total | 239 (100.0%) | 252 (100.0%) |
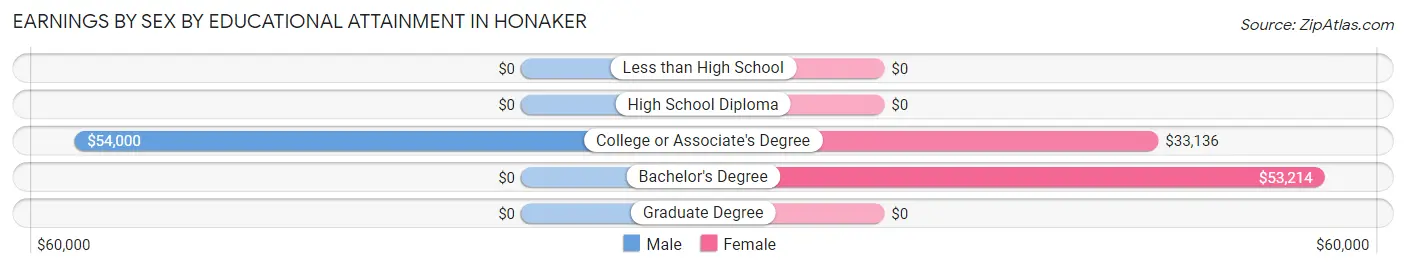
Earnings by Sex by Educational Attainment in Honaker
Average earnings in Honaker are $44,688 for men and $33,602 for women, a difference of 24.8%. Men with an educational attainment of college or associate's degree enjoy the highest average annual earnings of $54,000, while those with college or associate's degree education earn the least with $54,000. Women with an educational attainment of bachelor's degree earn the most with the average annual earnings of $53,214, while those with college or associate's degree education have the smallest earnings of $33,136.
| Educational Attainment | Male Income | Female Income |
| Less than High School | - | - |
| High School Diploma | - | - |
| College or Associate's Degree | $54,000 | $33,136 |
| Bachelor's Degree | - | - |
| Graduate Degree | - | - |
| Total | $44,688 | $33,602 |
Family Income in Honaker
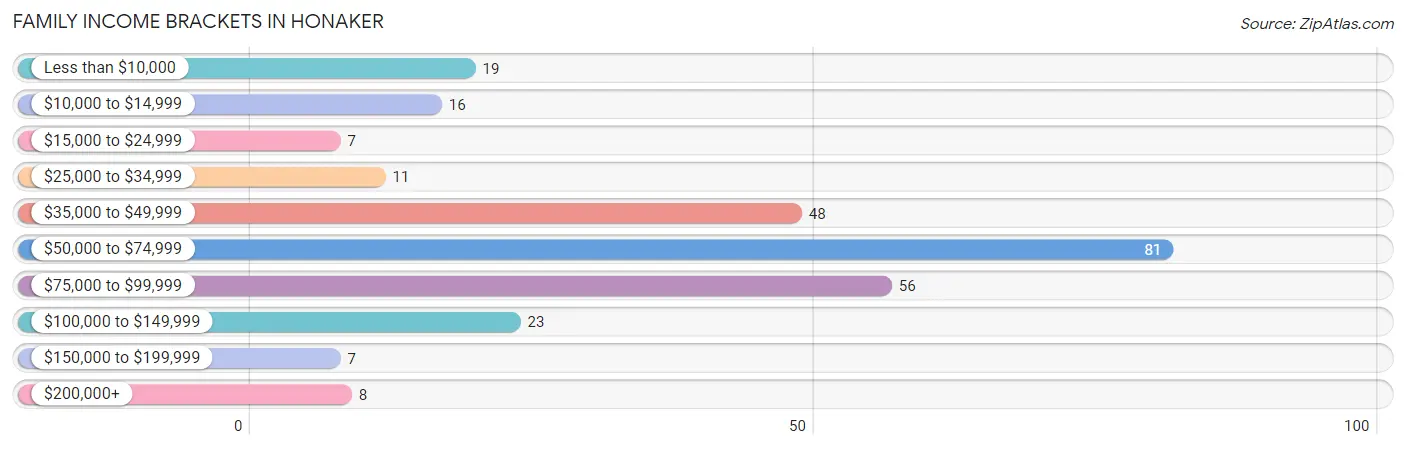
Family Income Brackets in Honaker
According to the Honaker family income data, there are 81 families falling into the $50,000 to $74,999 income range, which is the most common income bracket and makes up 29.3% of all families. Conversely, the $15,000 to $24,999 income bracket is the least frequent group with only 7 families (2.5%) belonging to this category.
| Income Bracket | # Families | % Families |
| Less than $10,000 | 19 | 6.9% |
| $10,000 to $14,999 | 16 | 5.8% |
| $15,000 to $24,999 | 7 | 2.5% |
| $25,000 to $34,999 | 11 | 4.0% |
| $35,000 to $49,999 | 48 | 17.4% |
| $50,000 to $74,999 | 81 | 29.3% |
| $75,000 to $99,999 | 56 | 20.3% |
| $100,000 to $149,999 | 23 | 8.3% |
| $150,000 to $199,999 | 7 | 2.5% |
| $200,000+ | 8 | 2.9% |
Family Income by Famaliy Size in Honaker
4-person families (44 | 15.9%) account for the highest median family income in Honaker with $78,750 per family, while 2-person families (118 | 42.7%) have the highest median income of $27,656 per family member.
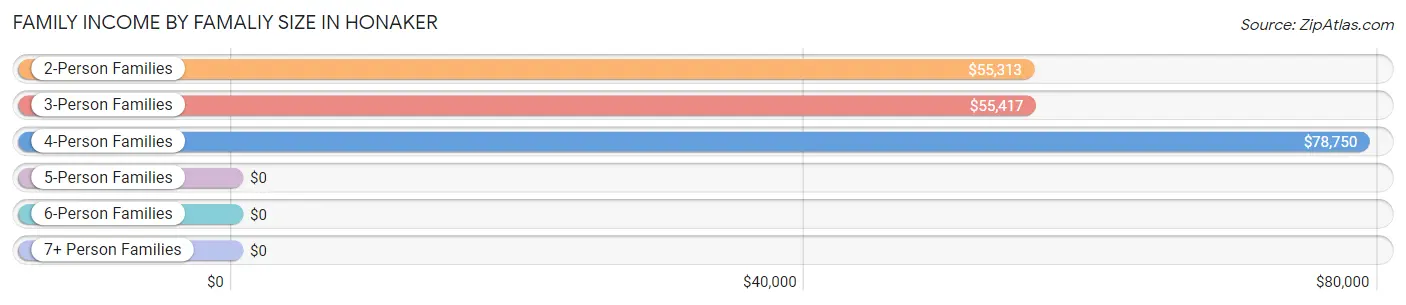
| Income Bracket | # Families | Median Income |
| 2-Person Families | 118 (42.7%) | $55,313 |
| 3-Person Families | 80 (29.0%) | $55,417 |
| 4-Person Families | 44 (15.9%) | $78,750 |
| 5-Person Families | 28 (10.1%) | $0 |
| 6-Person Families | 6 (2.2%) | $0 |
| 7+ Person Families | 0 (0.0%) | $0 |
| Total | 276 (100.0%) | $57,273 |
Family Income by Number of Earners in Honaker
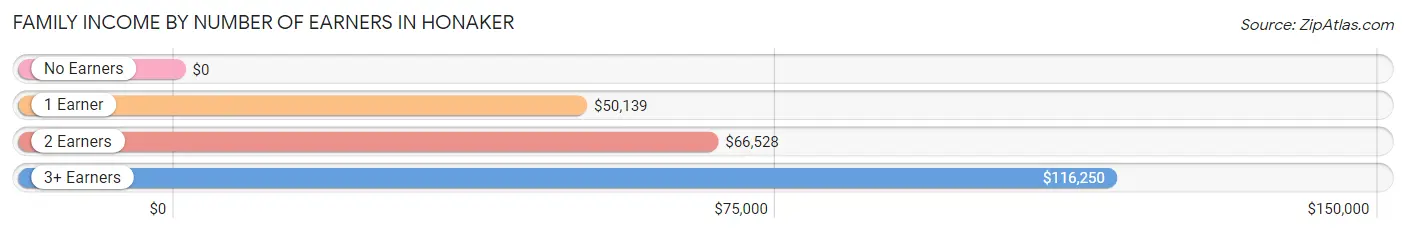
| Number of Earners | # Families | Median Income |
| No Earners | 70 (25.4%) | $0 |
| 1 Earner | 55 (19.9%) | $50,139 |
| 2 Earners | 125 (45.3%) | $66,528 |
| 3+ Earners | 26 (9.4%) | $116,250 |
| Total | 276 (100.0%) | $57,273 |
Household Income in Honaker
Household Income Brackets in Honaker
With 91 households falling in the category, the $15,000 to $24,999 income range is the most frequent in Honaker, accounting for 18.3% of all households. In contrast, only 7 households (1.4%) fall into the $150,000 to $199,999 income bracket, making it the least populous group.
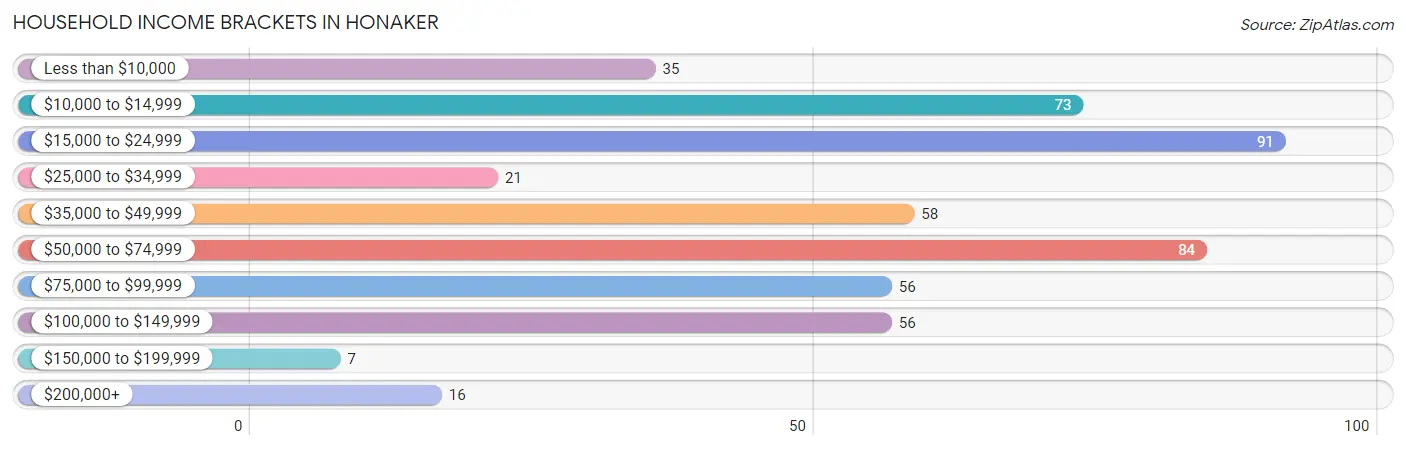
| Income Bracket | # Households | % Households |
| Less than $10,000 | 35 | 7.0% |
| $10,000 to $14,999 | 73 | 14.7% |
| $15,000 to $24,999 | 91 | 18.3% |
| $25,000 to $34,999 | 21 | 4.2% |
| $35,000 to $49,999 | 58 | 11.7% |
| $50,000 to $74,999 | 84 | 16.9% |
| $75,000 to $99,999 | 56 | 11.3% |
| $100,000 to $149,999 | 56 | 11.3% |
| $150,000 to $199,999 | 7 | 1.4% |
| $200,000+ | 16 | 3.2% |
Household Income by Householder Age in Honaker
The median household income in Honaker is $45,491, with the highest median household income of $61,750 found in the 25 to 44 years age bracket for the primary householder. A total of 190 households (38.2%) fall into this category. Meanwhile, the 15 to 24 years age bracket for the primary householder has the lowest median household income of $0, with 21 households (4.2%) in this group.
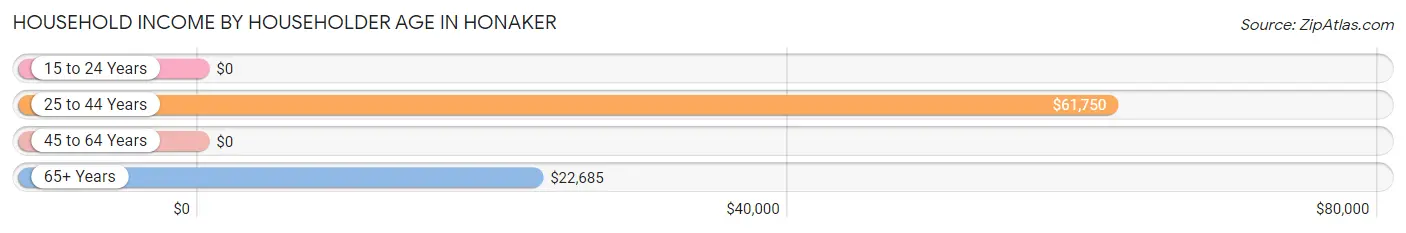
| Income Bracket | # Households | Median Income |
| 15 to 24 Years | 21 (4.2%) | $0 |
| 25 to 44 Years | 190 (38.2%) | $61,750 |
| 45 to 64 Years | 116 (23.3%) | $0 |
| 65+ Years | 170 (34.2%) | $22,685 |
| Total | 497 (100.0%) | $45,491 |
Poverty in Honaker
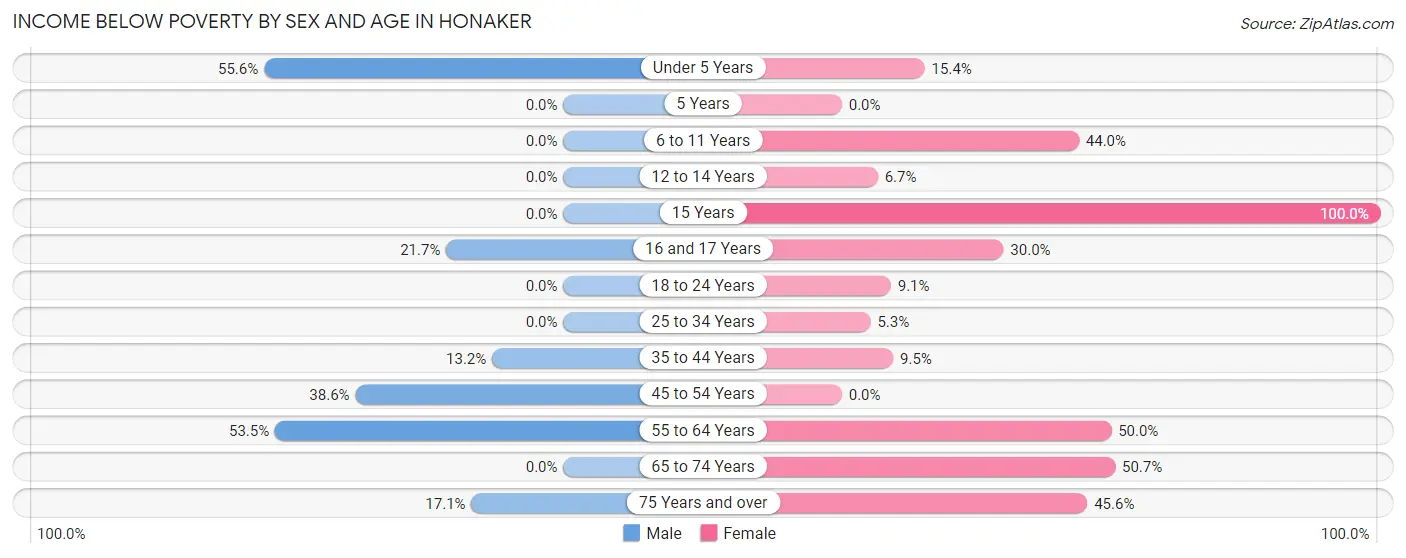
Income Below Poverty by Sex and Age in Honaker
With 18.1% poverty level for males and 24.1% for females among the residents of Honaker, under 5 year old males and 15 year old females are the most vulnerable to poverty, with 15 males (55.6%) and 3 females (100.0%) in their respective age groups living below the poverty level.
| Age Bracket | Male | Female |
| Under 5 Years | 15 (55.6%) | 4 (15.4%) |
| 5 Years | 0 (0.0%) | 0 (0.0%) |
| 6 to 11 Years | 0 (0.0%) | 22 (44.0%) |
| 12 to 14 Years | 0 (0.0%) | 2 (6.7%) |
| 15 Years | 0 (0.0%) | 3 (100.0%) |
| 16 and 17 Years | 5 (21.7%) | 3 (30.0%) |
| 18 to 24 Years | 0 (0.0%) | 3 (9.1%) |
| 25 to 34 Years | 0 (0.0%) | 5 (5.3%) |
| 35 to 44 Years | 23 (13.2%) | 10 (9.5%) |
| 45 to 54 Years | 22 (38.6%) | 0 (0.0%) |
| 55 to 64 Years | 38 (53.5%) | 17 (50.0%) |
| 65 to 74 Years | 0 (0.0%) | 35 (50.7%) |
| 75 Years and over | 7 (17.1%) | 41 (45.6%) |
| Total | 110 (18.1%) | 145 (24.1%) |
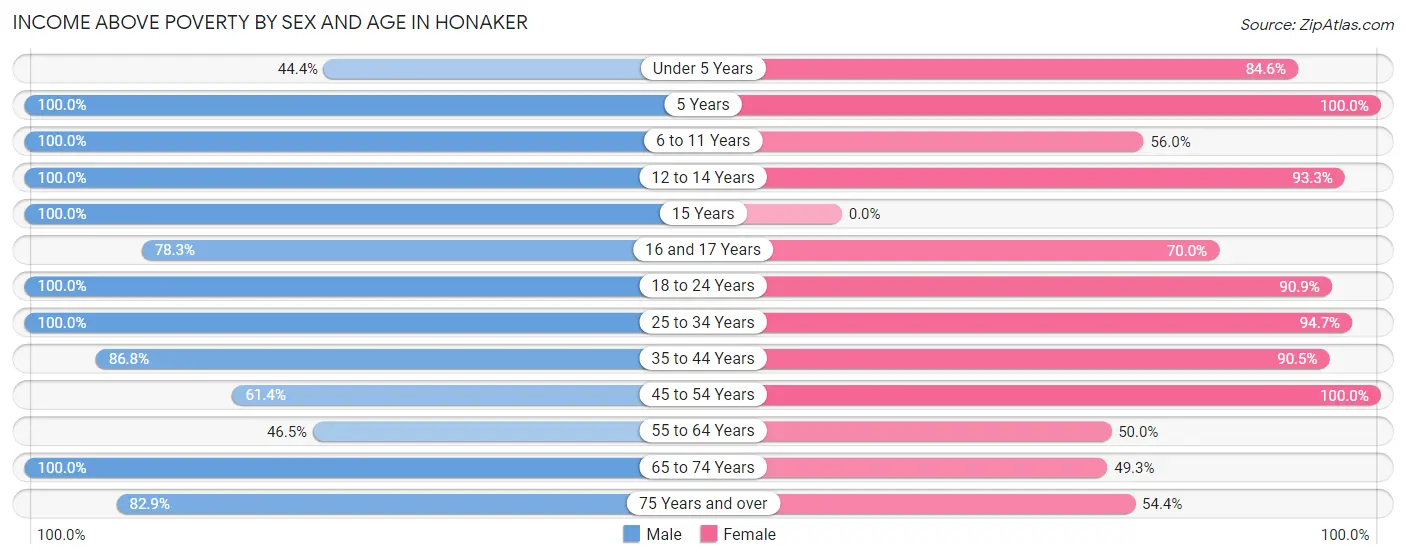
Income Above Poverty by Sex and Age in Honaker
According to the poverty statistics in Honaker, males aged 5 years and females aged 5 years are the age groups that are most secure financially, with 100.0% of males and 100.0% of females in these age groups living above the poverty line.
| Age Bracket | Male | Female |
| Under 5 Years | 12 (44.4%) | 22 (84.6%) |
| 5 Years | 7 (100.0%) | 8 (100.0%) |
| 6 to 11 Years | 51 (100.0%) | 28 (56.0%) |
| 12 to 14 Years | 40 (100.0%) | 28 (93.3%) |
| 15 Years | 4 (100.0%) | 0 (0.0%) |
| 16 and 17 Years | 18 (78.3%) | 7 (70.0%) |
| 18 to 24 Years | 36 (100.0%) | 30 (90.9%) |
| 25 to 34 Years | 39 (100.0%) | 89 (94.7%) |
| 35 to 44 Years | 151 (86.8%) | 95 (90.5%) |
| 45 to 54 Years | 35 (61.4%) | 50 (100.0%) |
| 55 to 64 Years | 33 (46.5%) | 17 (50.0%) |
| 65 to 74 Years | 38 (100.0%) | 34 (49.3%) |
| 75 Years and over | 34 (82.9%) | 49 (54.4%) |
| Total | 498 (81.9%) | 457 (75.9%) |
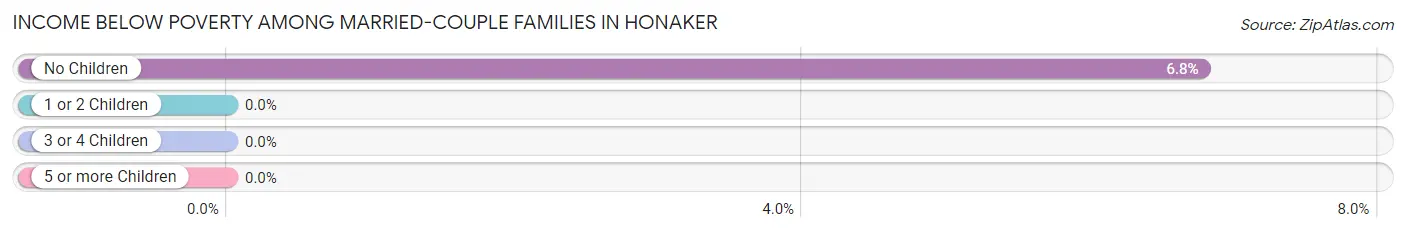
Income Below Poverty Among Married-Couple Families in Honaker
The poverty statistics for married-couple families in Honaker show that 4.0% or 9 of the total 227 families live below the poverty line. Families with no children have the highest poverty rate of 6.8%, comprising of 9 families. On the other hand, families with 1 or 2 children have the lowest poverty rate of 0.0%, which includes 0 families.
| Children | Above Poverty | Below Poverty |
| No Children | 124 (93.2%) | 9 (6.8%) |
| 1 or 2 Children | 71 (100.0%) | 0 (0.0%) |
| 3 or 4 Children | 23 (100.0%) | 0 (0.0%) |
| 5 or more Children | 0 (0.0%) | 0 (0.0%) |
| Total | 218 (96.0%) | 9 (4.0%) |
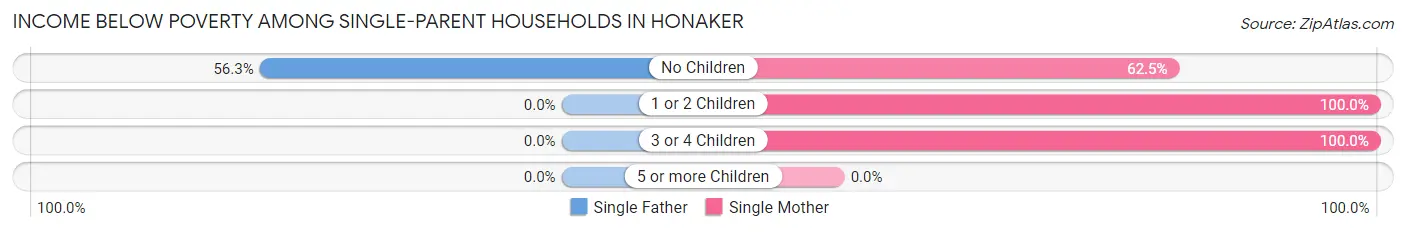
Income Below Poverty Among Single-Parent Households in Honaker
According to the poverty data in Honaker, 40.9% or 9 single-father households and 88.9% or 24 single-mother households are living below the poverty line. Among single-father households, those with no children have the highest poverty rate, with 9 households (56.2%) experiencing poverty. Likewise, among single-mother households, those with 1 or 2 children have the highest poverty rate, with 15 households (100.0%) falling below the poverty line.
| Children | Single Father | Single Mother |
| No Children | 9 (56.2%) | 5 (62.5%) |
| 1 or 2 Children | 0 (0.0%) | 15 (100.0%) |
| 3 or 4 Children | 0 (0.0%) | 4 (100.0%) |
| 5 or more Children | 0 (0.0%) | 0 (0.0%) |
| Total | 9 (40.9%) | 24 (88.9%) |
Income Below Poverty Among Married-Couple vs Single-Parent Households in Honaker
The poverty data for Honaker shows that 9 of the married-couple family households (4.0%) and 33 of the single-parent households (67.3%) are living below the poverty level. Within the married-couple family households, those with no children have the highest poverty rate, with 9 households (6.8%) falling below the poverty line. Among the single-parent households, those with 3 or 4 children have the highest poverty rate, with 4 household (100.0%) living below poverty.
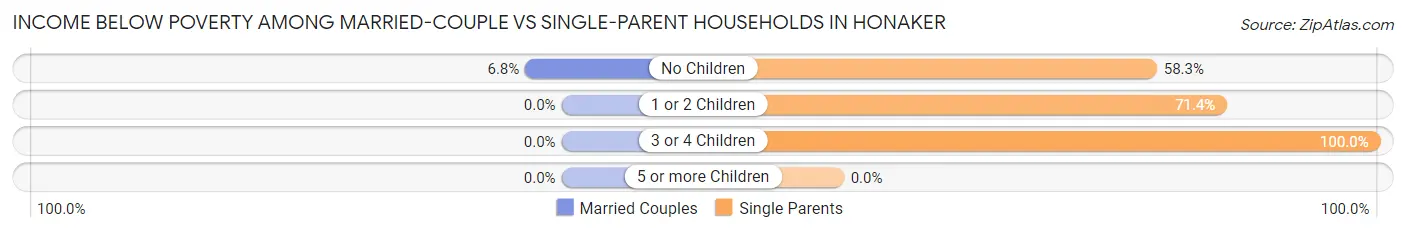
| Children | Married-Couple Families | Single-Parent Households |
| No Children | 9 (6.8%) | 14 (58.3%) |
| 1 or 2 Children | 0 (0.0%) | 15 (71.4%) |
| 3 or 4 Children | 0 (0.0%) | 4 (100.0%) |
| 5 or more Children | 0 (0.0%) | 0 (0.0%) |
| Total | 9 (4.0%) | 33 (67.3%) |
Race in Honaker
The most populous races in Honaker are White / Caucasian (1,210 | 99.8%), Black / African American (2 | 0.2%), and Hispanic or Latino (1 | 0.1%).
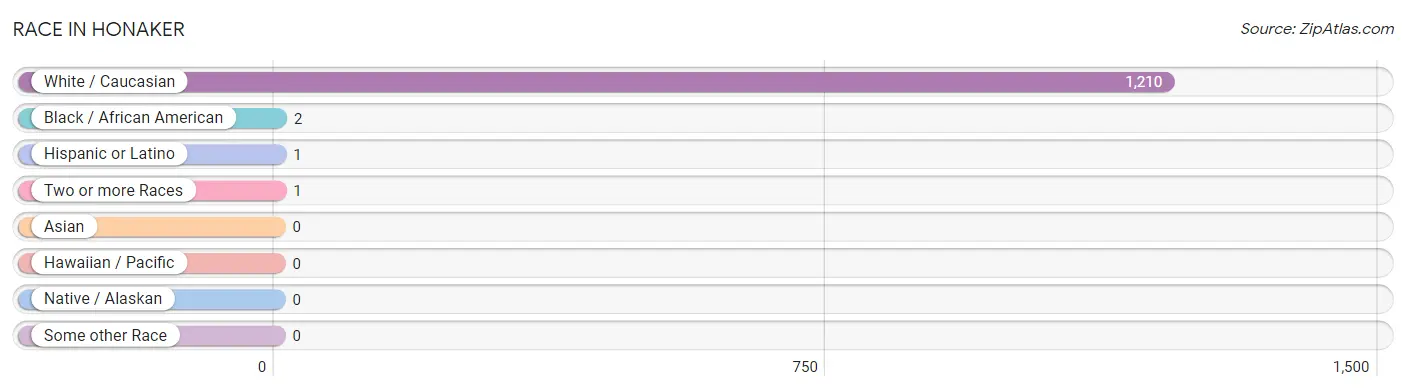
| Race | # Population | % Population |
| Asian | 0 | 0.0% |
| Black / African American | 2 | 0.2% |
| Hawaiian / Pacific | 0 | 0.0% |
| Hispanic or Latino | 1 | 0.1% |
| Native / Alaskan | 0 | 0.0% |
| White / Caucasian | 1,210 | 99.8% |
| Two or more Races | 1 | 0.1% |
| Some other Race | 0 | 0.0% |
| Total | 1,213 | 100.0% |
Ancestry in Honaker
The most populous ancestries reported in Honaker are American (722 | 59.5%), English (87 | 7.2%), Irish (45 | 3.7%), Scotch-Irish (35 | 2.9%), and German (22 | 1.8%), together accounting for 75.1% of all Honaker residents.
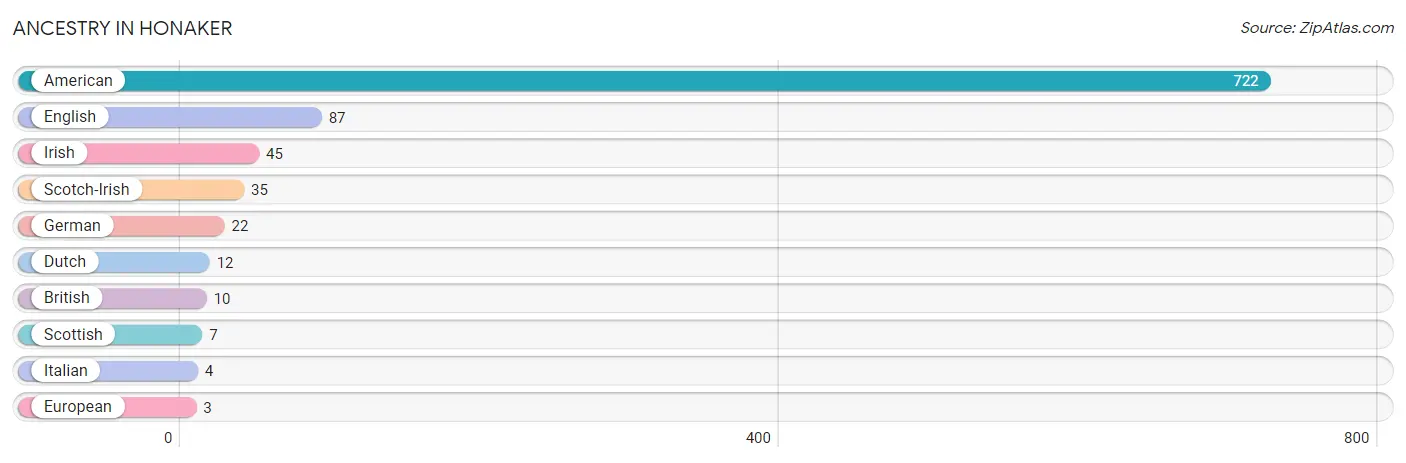
| Ancestry | # Population | % Population |
| American | 722 | 59.5% |
| British | 10 | 0.8% |
| Dutch | 12 | 1.0% |
| English | 87 | 7.2% |
| European | 3 | 0.3% |
| German | 22 | 1.8% |
| Irish | 45 | 3.7% |
| Italian | 4 | 0.3% |
| Scotch-Irish | 35 | 2.9% |
| Scottish | 7 | 0.6% | View All 10 Rows |
Immigrants in Honaker

| Immigration Origin | # Population | % Population | View All 0 Rows |
Sex and Age in Honaker
Sex and Age in Honaker
The most populous age groups in Honaker are 40 to 44 Years (114 | 18.7%) for men and 40 to 44 Years (79 | 13.1%) for women.
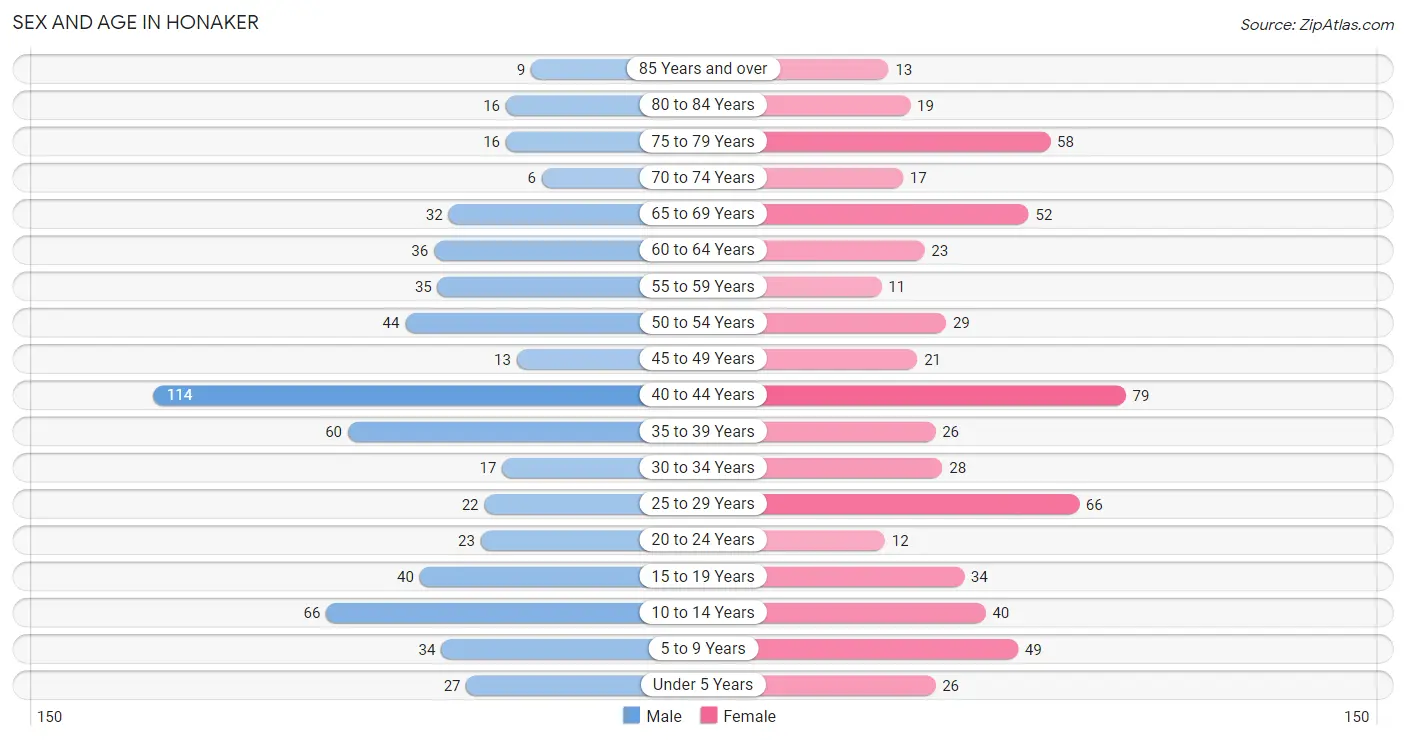
| Age Bracket | Male | Female |
| Under 5 Years | 27 (4.4%) | 26 (4.3%) |
| 5 to 9 Years | 34 (5.6%) | 49 (8.1%) |
| 10 to 14 Years | 66 (10.8%) | 40 (6.6%) |
| 15 to 19 Years | 40 (6.6%) | 34 (5.6%) |
| 20 to 24 Years | 23 (3.8%) | 12 (2.0%) |
| 25 to 29 Years | 22 (3.6%) | 66 (11.0%) |
| 30 to 34 Years | 17 (2.8%) | 28 (4.6%) |
| 35 to 39 Years | 60 (9.8%) | 26 (4.3%) |
| 40 to 44 Years | 114 (18.7%) | 79 (13.1%) |
| 45 to 49 Years | 13 (2.1%) | 21 (3.5%) |
| 50 to 54 Years | 44 (7.2%) | 29 (4.8%) |
| 55 to 59 Years | 35 (5.7%) | 11 (1.8%) |
| 60 to 64 Years | 36 (5.9%) | 23 (3.8%) |
| 65 to 69 Years | 32 (5.2%) | 52 (8.6%) |
| 70 to 74 Years | 6 (1.0%) | 17 (2.8%) |
| 75 to 79 Years | 16 (2.6%) | 58 (9.6%) |
| 80 to 84 Years | 16 (2.6%) | 19 (3.2%) |
| 85 Years and over | 9 (1.5%) | 13 (2.2%) |
| Total | 610 (100.0%) | 603 (100.0%) |
Families and Households in Honaker
Median Family Size in Honaker
The median family size in Honaker is 3.50 persons per family, with single female/mother families (27 | 9.8%) accounting for the largest median family size of 4.48 persons per family. On the other hand, single male/father families (22 | 8.0%) represent the smallest median family size with 2.64 persons per family.
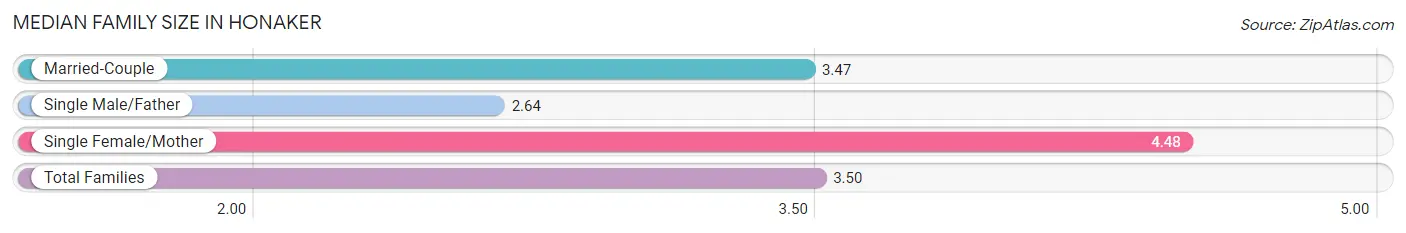
| Family Type | # Families | Family Size |
| Married-Couple | 227 (82.3%) | 3.47 |
| Single Male/Father | 22 (8.0%) | 2.64 |
| Single Female/Mother | 27 (9.8%) | 4.48 |
| Total Families | 276 (100.0%) | 3.50 |
Median Household Size in Honaker
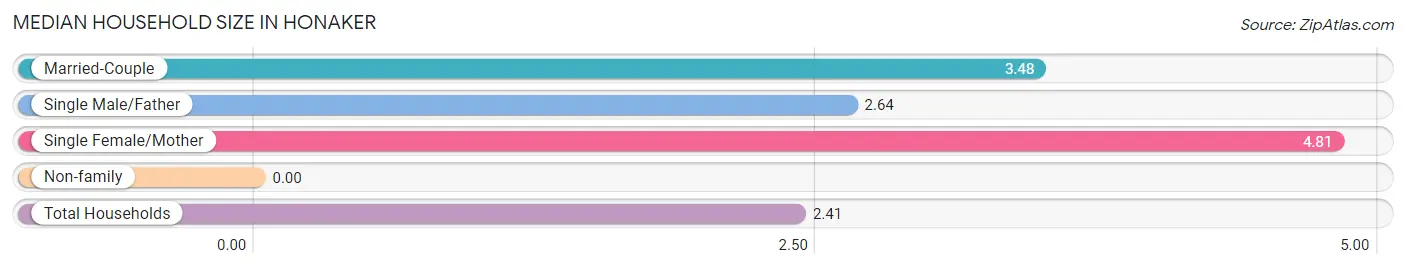
| Household Type | # Households | Household Size |
| Married-Couple | 227 (45.7%) | 3.48 |
| Single Male/Father | 22 (4.4%) | 2.64 |
| Single Female/Mother | 27 (5.4%) | 4.81 |
| Non-family | 221 (44.5%) | - |
| Total Households | 497 (100.0%) | 2.41 |
Household Size by Marriage Status in Honaker
Out of a total of 497 households in Honaker, 276 (55.5%) are family households, while 221 (44.5%) are nonfamily households. The most numerous type of family households are 2-person households, comprising 114, and the most common type of nonfamily households are 1-person households, comprising 221.
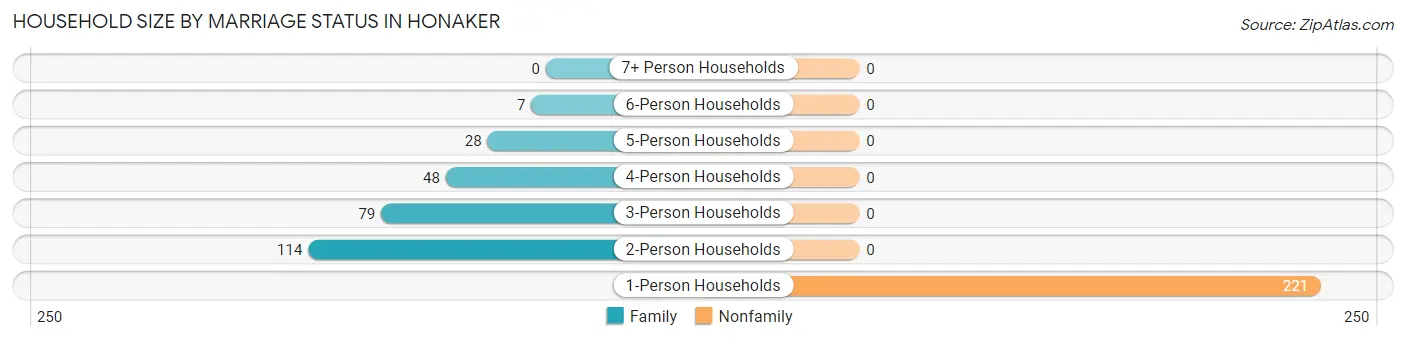
| Household Size | Family Households | Nonfamily Households |
| 1-Person Households | - | 221 (44.5%) |
| 2-Person Households | 114 (22.9%) | 0 (0.0%) |
| 3-Person Households | 79 (15.9%) | 0 (0.0%) |
| 4-Person Households | 48 (9.7%) | 0 (0.0%) |
| 5-Person Households | 28 (5.6%) | 0 (0.0%) |
| 6-Person Households | 7 (1.4%) | 0 (0.0%) |
| 7+ Person Households | 0 (0.0%) | 0 (0.0%) |
| Total | 276 (55.5%) | 221 (44.5%) |
Female Fertility in Honaker
Fertility by Age in Honaker
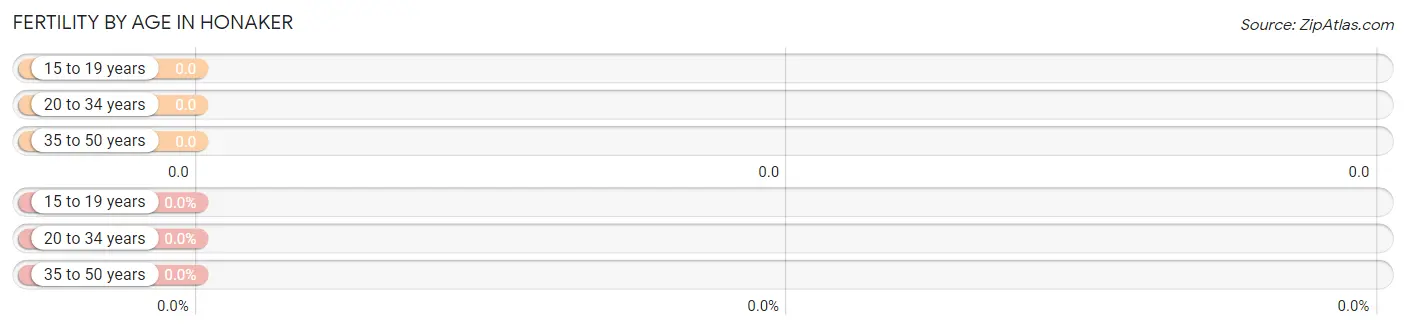
| Age Bracket | Women with Births | Births / 1,000 Women |
| 15 to 19 years | 0 (0.0%) | 0.0 |
| 20 to 34 years | 0 (0.0%) | 0.0 |
| 35 to 50 years | 0 (0.0%) | 0.0 |
| Total | 0 (0.0%) | 0.0 |
Fertility by Age by Marriage Status in Honaker
| Age Bracket | Married | Unmarried |
| 15 to 19 years | 0 (0.0%) | 0 (0.0%) |
| 20 to 34 years | 0 (0.0%) | 0 (0.0%) |
| 35 to 50 years | 0 (0.0%) | 0 (0.0%) |
| Total | 0 (0.0%) | 0 (0.0%) |
Fertility by Education in Honaker
| Educational Attainment | Women with Births | Births / 1,000 Women |
| Less than High School | 0 (0.0%) | 0.0 |
| High School Diploma | 0 (0.0%) | 0.0 |
| College or Associate's Degree | 0 (0.0%) | 0.0 |
| Bachelor's Degree | 0 (0.0%) | 0.0 |
| Graduate Degree | 0 (0.0%) | 0.0 |
| Total | 0 (0.0%) | 0.0 |
Fertility by Education by Marriage Status in Honaker
| Educational Attainment | Married | Unmarried |
| Less than High School | 0 (0.0%) | 0 (0.0%) |
| High School Diploma | 0 (0.0%) | 0 (0.0%) |
| College or Associate's Degree | 0 (0.0%) | 0 (0.0%) |
| Bachelor's Degree | 0 (0.0%) | 0 (0.0%) |
| Graduate Degree | 0 (0.0%) | 0 (0.0%) |
| Total | 0 (0.0%) | 0 (0.0%) |
Employment Characteristics in Honaker
Employment by Class of Employer in Honaker
Among the 435 employed individuals in Honaker, private company employees (331 | 76.1%), state government employees (49 | 11.3%), and local government employees (28 | 6.4%) make up the most common classes of employment.
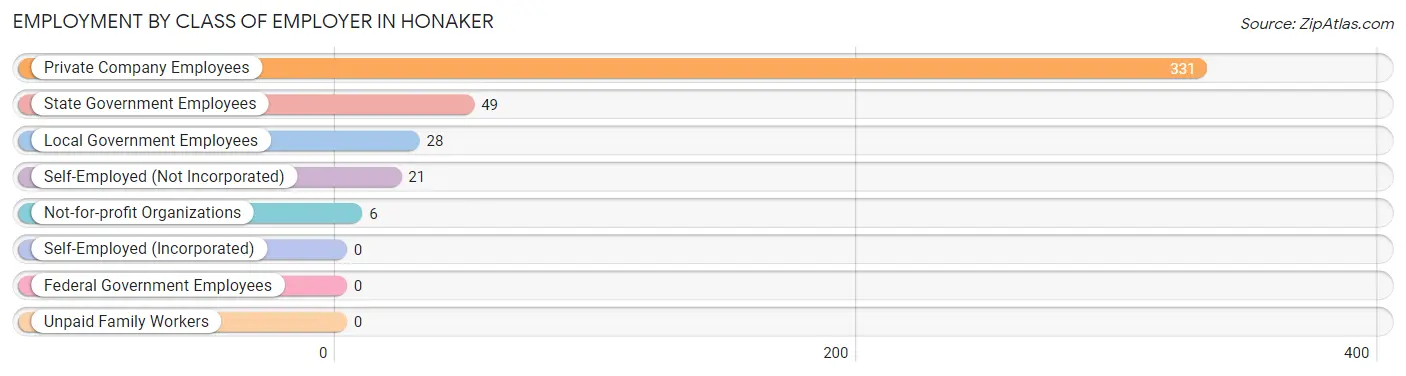
| Employer Class | # Employees | % Employees |
| Private Company Employees | 331 | 76.1% |
| Self-Employed (Incorporated) | 0 | 0.0% |
| Self-Employed (Not Incorporated) | 21 | 4.8% |
| Not-for-profit Organizations | 6 | 1.4% |
| Local Government Employees | 28 | 6.4% |
| State Government Employees | 49 | 11.3% |
| Federal Government Employees | 0 | 0.0% |
| Unpaid Family Workers | 0 | 0.0% |
| Total | 435 | 100.0% |
Employment Status by Age in Honaker
According to the labor force statistics for Honaker, out of the total population over 16 years of age (964), 48.1% or 464 individuals are in the labor force, with 3.2% or 15 of them unemployed. The age group with the highest labor force participation rate is 20 to 24 years, with 100.0% or 35 individuals in the labor force. Within the labor force, the 60 to 64 years age range has the highest percentage of unemployed individuals, with 37.5% or 6 of them being unemployed.
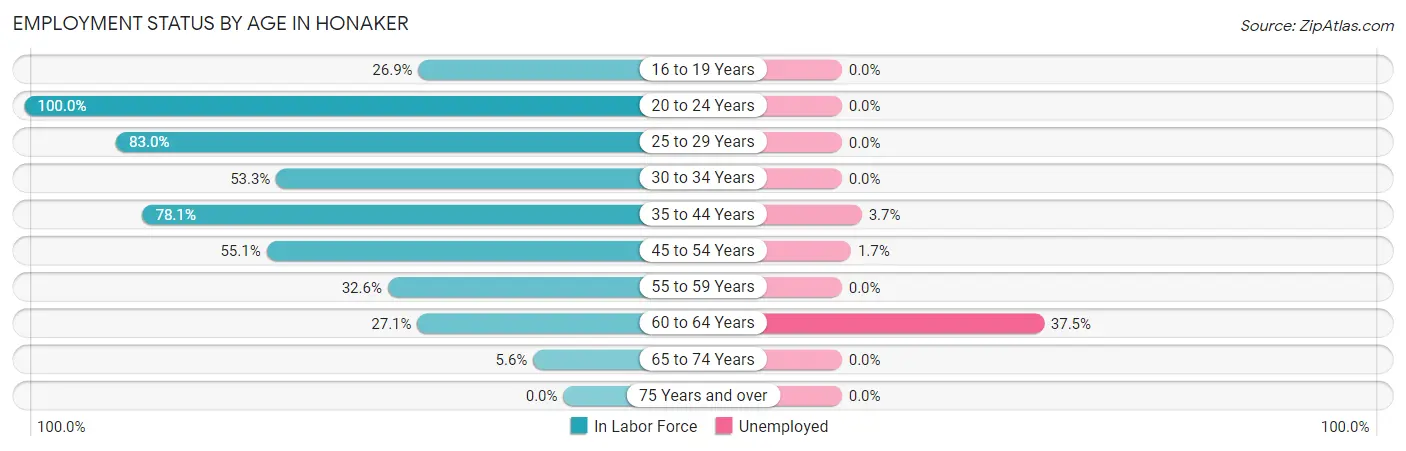
| Age Bracket | In Labor Force | Unemployed |
| 16 to 19 Years | 18 (26.9%) | 0 (0.0%) |
| 20 to 24 Years | 35 (100.0%) | 0 (0.0%) |
| 25 to 29 Years | 73 (83.0%) | 0 (0.0%) |
| 30 to 34 Years | 24 (53.3%) | 0 (0.0%) |
| 35 to 44 Years | 218 (78.1%) | 8 (3.7%) |
| 45 to 54 Years | 59 (55.1%) | 1 (1.7%) |
| 55 to 59 Years | 15 (32.6%) | 0 (0.0%) |
| 60 to 64 Years | 16 (27.1%) | 6 (37.5%) |
| 65 to 74 Years | 6 (5.6%) | 0 (0.0%) |
| 75 Years and over | 0 (0.0%) | 0 (0.0%) |
| Total | 464 (48.1%) | 15 (3.2%) |
Employment Status by Educational Attainment in Honaker
According to labor force statistics for Honaker, 64.9% of individuals (405) out of the total population between 25 and 64 years of age (624) are in the labor force, with 3.7% or 15 of them being unemployed. The group with the highest labor force participation rate are those with the educational attainment of bachelor's degree or higher, with 75.0% or 51 individuals in the labor force. Within the labor force, individuals with less than high school education have the highest percentage of unemployment, with 21.4% or 9 of them being unemployed.
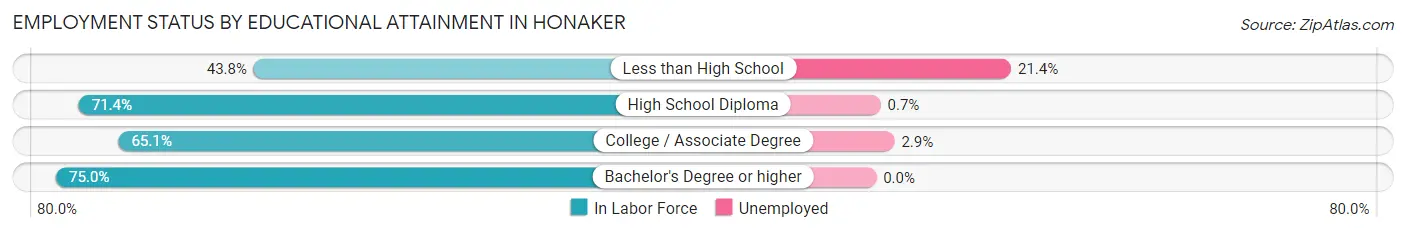
| Educational Attainment | In Labor Force | Unemployed |
| Less than High School | 42 (43.8%) | 21 (21.4%) |
| High School Diploma | 142 (71.4%) | 1 (0.7%) |
| College / Associate Degree | 170 (65.1%) | 8 (2.9%) |
| Bachelor's Degree or higher | 51 (75.0%) | 0 (0.0%) |
| Total | 405 (64.9%) | 23 (3.7%) |
Employment Occupations by Sex in Honaker
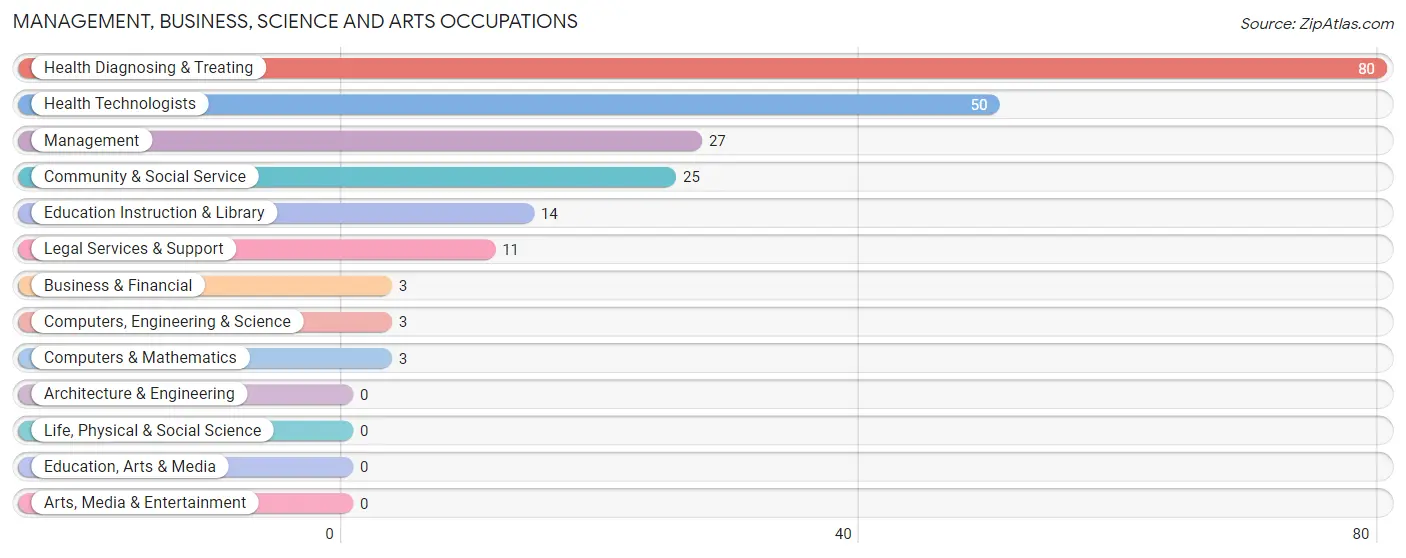
Management, Business, Science and Arts Occupations
The most common Management, Business, Science and Arts occupations in Honaker are Health Diagnosing & Treating (80 | 17.8%), Health Technologists (50 | 11.1%), Management (27 | 6.0%), Community & Social Service (25 | 5.6%), and Education Instruction & Library (14 | 3.1%).
Management, Business, Science and Arts Occupations by Sex
Within the Management, Business, Science and Arts occupations in Honaker, the most male-oriented occupations are Management (74.1%), and Health Diagnosing & Treating (17.5%), while the most female-oriented occupations are Business & Financial (100.0%), Computers, Engineering & Science (100.0%), and Computers & Mathematics (100.0%).
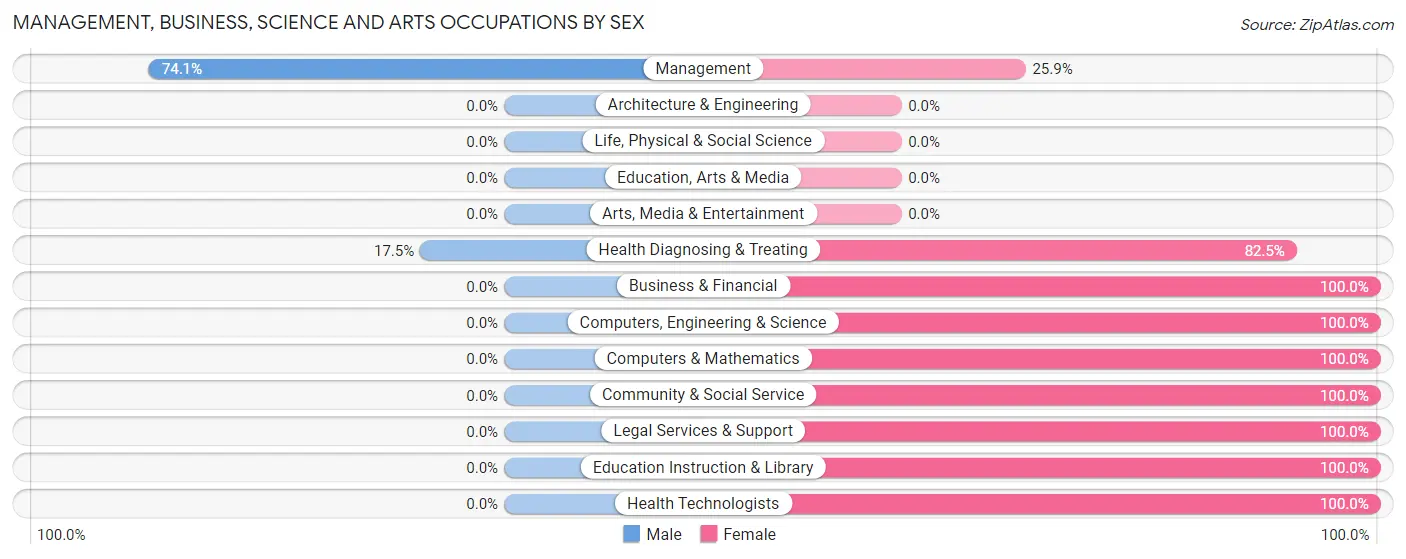
| Occupation | Male | Female |
| Management | 20 (74.1%) | 7 (25.9%) |
| Business & Financial | 0 (0.0%) | 3 (100.0%) |
| Computers, Engineering & Science | 0 (0.0%) | 3 (100.0%) |
| Computers & Mathematics | 0 (0.0%) | 3 (100.0%) |
| Architecture & Engineering | 0 (0.0%) | 0 (0.0%) |
| Life, Physical & Social Science | 0 (0.0%) | 0 (0.0%) |
| Community & Social Service | 0 (0.0%) | 25 (100.0%) |
| Education, Arts & Media | 0 (0.0%) | 0 (0.0%) |
| Legal Services & Support | 0 (0.0%) | 11 (100.0%) |
| Education Instruction & Library | 0 (0.0%) | 14 (100.0%) |
| Arts, Media & Entertainment | 0 (0.0%) | 0 (0.0%) |
| Health Diagnosing & Treating | 14 (17.5%) | 66 (82.5%) |
| Health Technologists | 0 (0.0%) | 50 (100.0%) |
| Total (Category) | 34 (24.6%) | 104 (75.4%) |
| Total (Overall) | 238 (53.0%) | 211 (47.0%) |
Services Occupations
The most common Services occupations in Honaker are Cleaning & Maintenance (36 | 8.0%), Security & Protection (15 | 3.3%), Law Enforcement (9 | 2.0%), and Firefighting & Prevention (6 | 1.3%).
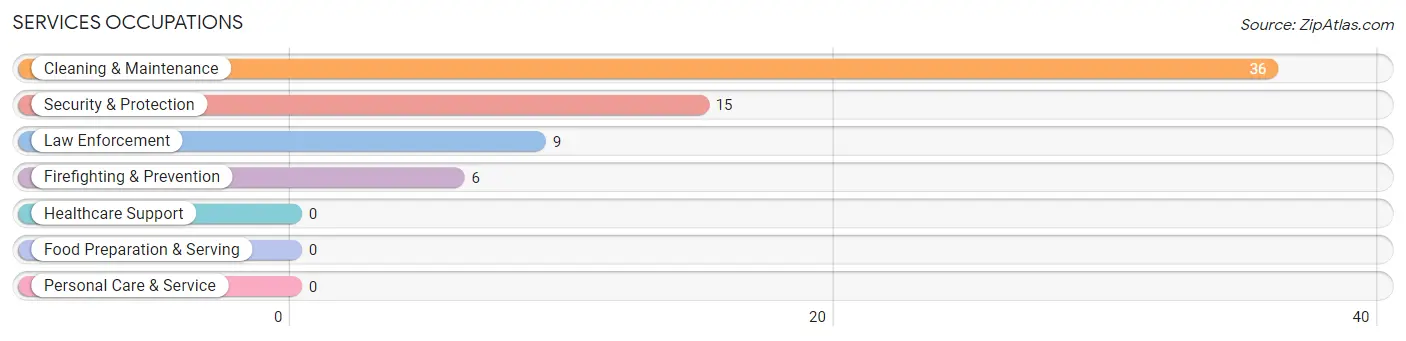
Services Occupations by Sex
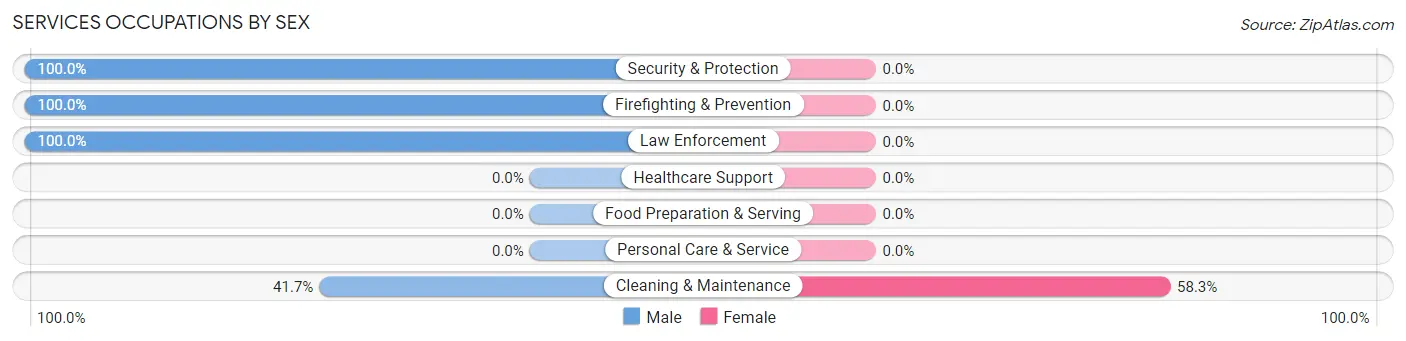
| Occupation | Male | Female |
| Healthcare Support | 0 (0.0%) | 0 (0.0%) |
| Security & Protection | 15 (100.0%) | 0 (0.0%) |
| Firefighting & Prevention | 6 (100.0%) | 0 (0.0%) |
| Law Enforcement | 9 (100.0%) | 0 (0.0%) |
| Food Preparation & Serving | 0 (0.0%) | 0 (0.0%) |
| Cleaning & Maintenance | 15 (41.7%) | 21 (58.3%) |
| Personal Care & Service | 0 (0.0%) | 0 (0.0%) |
| Total (Category) | 30 (58.8%) | 21 (41.2%) |
| Total (Overall) | 238 (53.0%) | 211 (47.0%) |
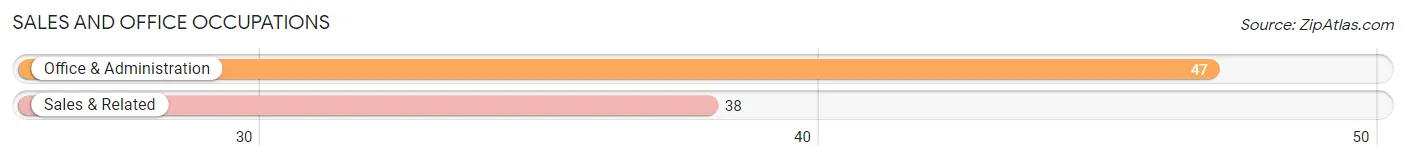
Sales and Office Occupations
The most common Sales and Office occupations in Honaker are Office & Administration (47 | 10.5%), and Sales & Related (38 | 8.5%).
Sales and Office Occupations by Sex
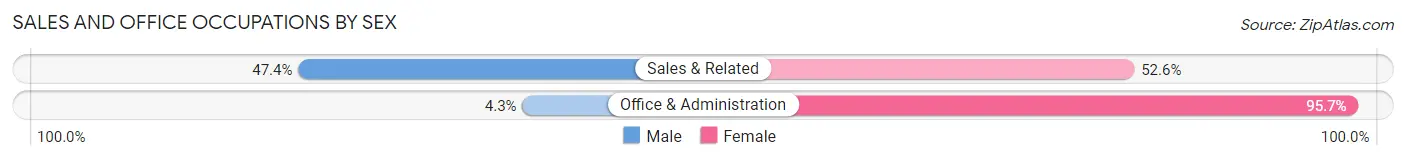
| Occupation | Male | Female |
| Sales & Related | 18 (47.4%) | 20 (52.6%) |
| Office & Administration | 2 (4.3%) | 45 (95.7%) |
| Total (Category) | 20 (23.5%) | 65 (76.5%) |
| Total (Overall) | 238 (53.0%) | 211 (47.0%) |
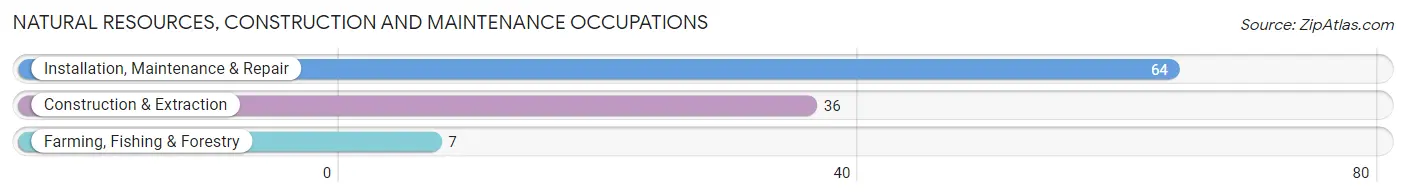
Natural Resources, Construction and Maintenance Occupations
The most common Natural Resources, Construction and Maintenance occupations in Honaker are Installation, Maintenance & Repair (64 | 14.2%), Construction & Extraction (36 | 8.0%), and Farming, Fishing & Forestry (7 | 1.6%).
Natural Resources, Construction and Maintenance Occupations by Sex
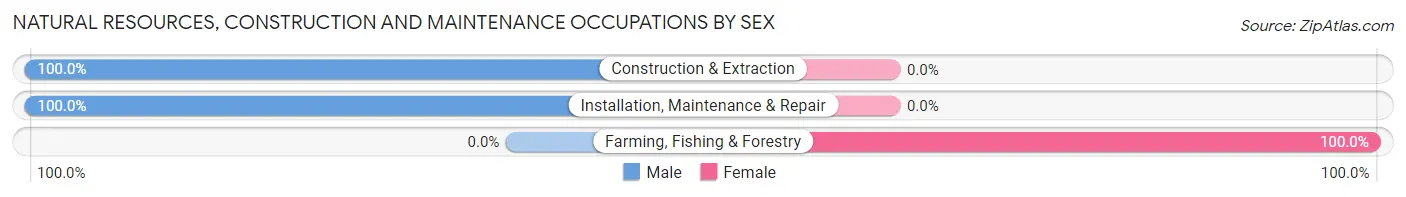
| Occupation | Male | Female |
| Farming, Fishing & Forestry | 0 (0.0%) | 7 (100.0%) |
| Construction & Extraction | 36 (100.0%) | 0 (0.0%) |
| Installation, Maintenance & Repair | 64 (100.0%) | 0 (0.0%) |
| Total (Category) | 100 (93.5%) | 7 (6.5%) |
| Total (Overall) | 238 (53.0%) | 211 (47.0%) |
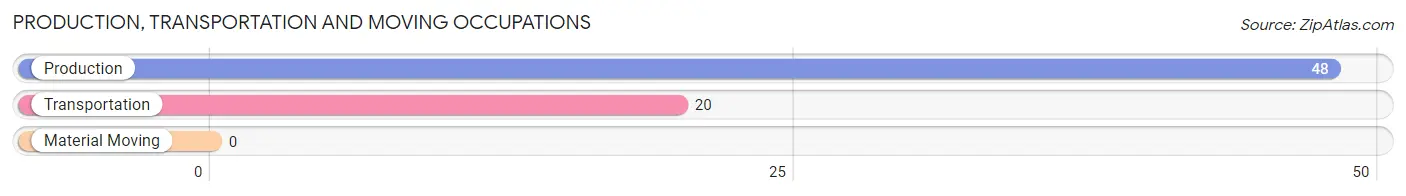
Production, Transportation and Moving Occupations
The most common Production, Transportation and Moving occupations in Honaker are Production (48 | 10.7%), and Transportation (20 | 4.4%).
Production, Transportation and Moving Occupations by Sex
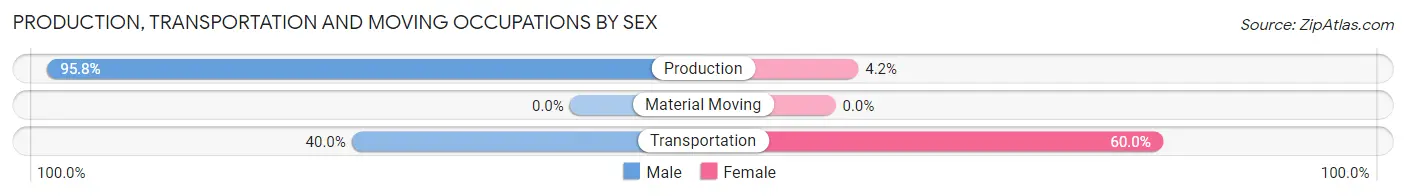
| Occupation | Male | Female |
| Production | 46 (95.8%) | 2 (4.2%) |
| Transportation | 8 (40.0%) | 12 (60.0%) |
| Material Moving | 0 (0.0%) | 0 (0.0%) |
| Total (Category) | 54 (79.4%) | 14 (20.6%) |
| Total (Overall) | 238 (53.0%) | 211 (47.0%) |
Employment Industries by Sex in Honaker
Employment Industries in Honaker
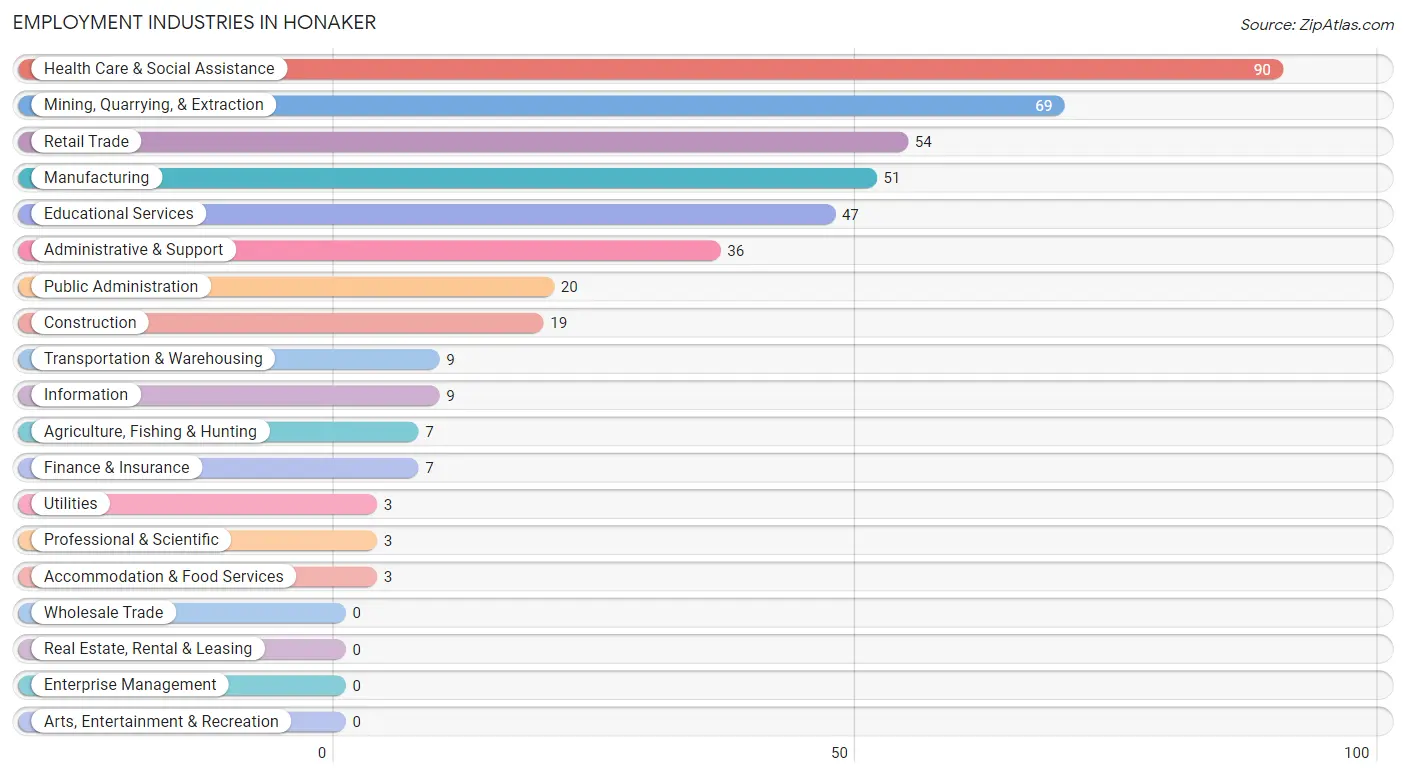
The major employment industries in Honaker include Health Care & Social Assistance (90 | 20.0%), Mining, Quarrying, & Extraction (69 | 15.4%), Retail Trade (54 | 12.0%), Manufacturing (51 | 11.4%), and Educational Services (47 | 10.5%).
Employment Industries by Sex in Honaker
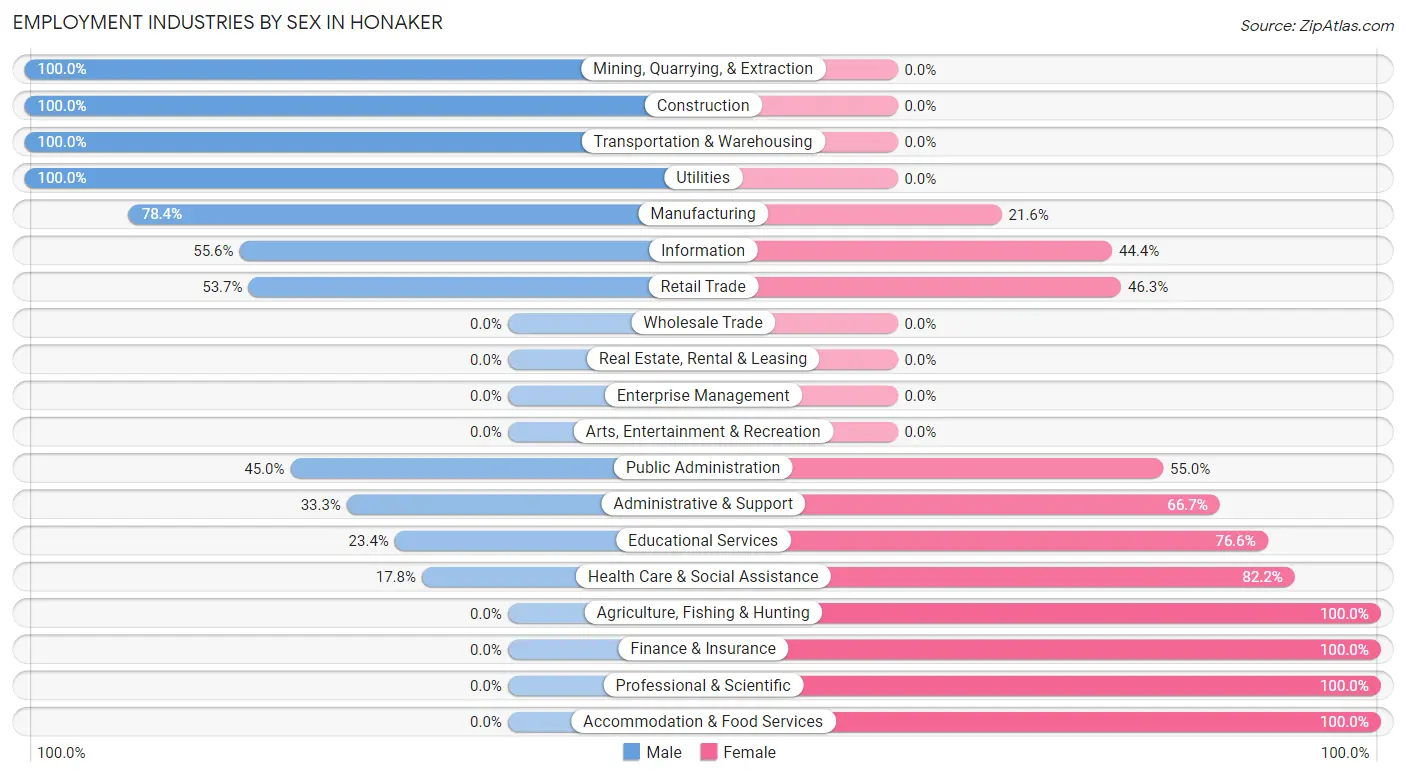
The Honaker industries that see more men than women are Mining, Quarrying, & Extraction (100.0%), Construction (100.0%), and Transportation & Warehousing (100.0%), whereas the industries that tend to have a higher number of women are Agriculture, Fishing & Hunting (100.0%), Finance & Insurance (100.0%), and Professional & Scientific (100.0%).
| Industry | Male | Female |
| Agriculture, Fishing & Hunting | 0 (0.0%) | 7 (100.0%) |
| Mining, Quarrying, & Extraction | 69 (100.0%) | 0 (0.0%) |
| Construction | 19 (100.0%) | 0 (0.0%) |
| Manufacturing | 40 (78.4%) | 11 (21.6%) |
| Wholesale Trade | 0 (0.0%) | 0 (0.0%) |
| Retail Trade | 29 (53.7%) | 25 (46.3%) |
| Transportation & Warehousing | 9 (100.0%) | 0 (0.0%) |
| Utilities | 3 (100.0%) | 0 (0.0%) |
| Information | 5 (55.6%) | 4 (44.4%) |
| Finance & Insurance | 0 (0.0%) | 7 (100.0%) |
| Real Estate, Rental & Leasing | 0 (0.0%) | 0 (0.0%) |
| Professional & Scientific | 0 (0.0%) | 3 (100.0%) |
| Enterprise Management | 0 (0.0%) | 0 (0.0%) |
| Administrative & Support | 12 (33.3%) | 24 (66.7%) |
| Educational Services | 11 (23.4%) | 36 (76.6%) |
| Health Care & Social Assistance | 16 (17.8%) | 74 (82.2%) |
| Arts, Entertainment & Recreation | 0 (0.0%) | 0 (0.0%) |
| Accommodation & Food Services | 0 (0.0%) | 3 (100.0%) |
| Public Administration | 9 (45.0%) | 11 (55.0%) |
| Total | 238 (53.0%) | 211 (47.0%) |
Education in Honaker
School Enrollment in Honaker
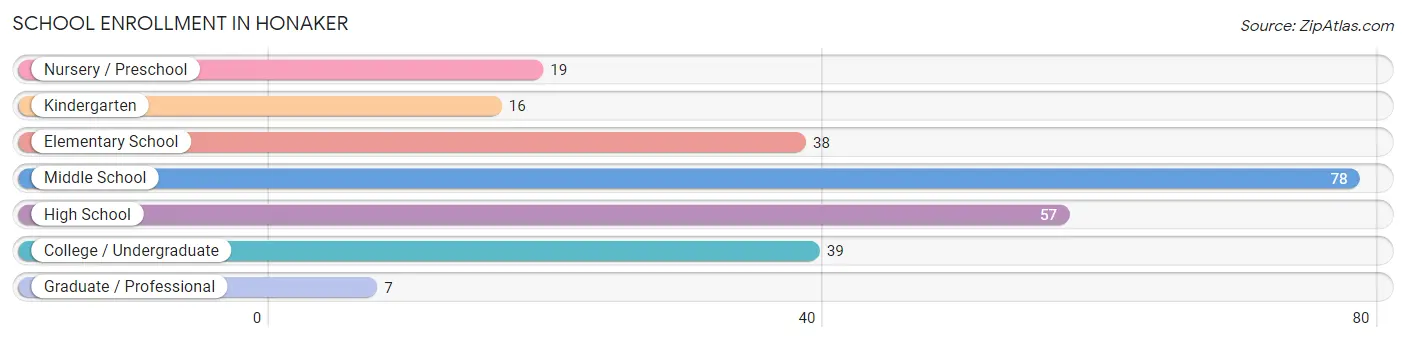
The most common levels of schooling among the 254 students in Honaker are middle school (78 | 30.7%), high school (57 | 22.4%), and college / undergraduate (39 | 15.3%).
| School Level | # Students | % Students |
| Nursery / Preschool | 19 | 7.5% |
| Kindergarten | 16 | 6.3% |
| Elementary School | 38 | 15.0% |
| Middle School | 78 | 30.7% |
| High School | 57 | 22.4% |
| College / Undergraduate | 39 | 15.3% |
| Graduate / Professional | 7 | 2.8% |
| Total | 254 | 100.0% |
School Enrollment by Age by Funding Source in Honaker
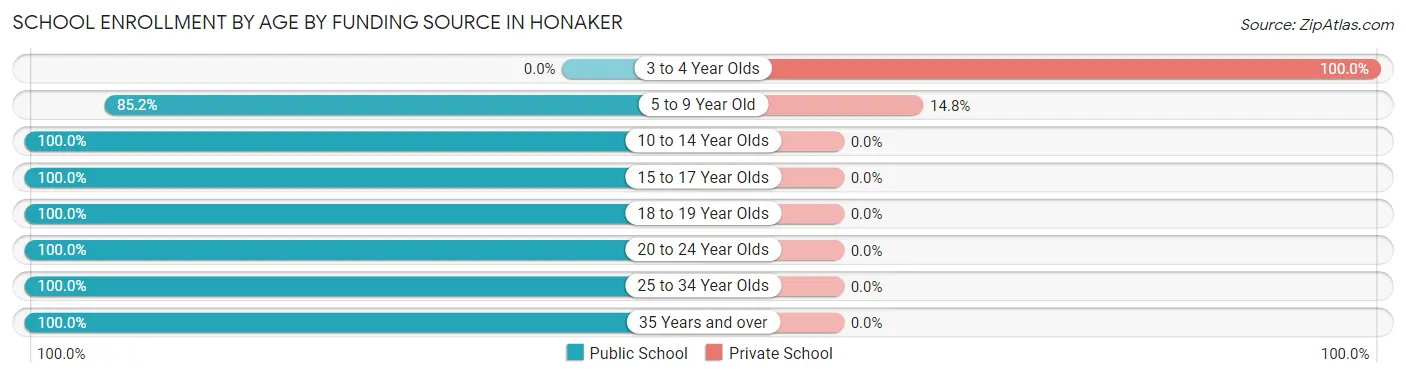
Out of a total of 254 students who are enrolled in schools in Honaker, 27 (10.6%) attend a private institution, while the remaining 227 (89.4%) are enrolled in public schools. The age group of 3 to 4 year olds has the highest likelihood of being enrolled in private schools, with 19 (100.0% in the age bracket) enrolled. Conversely, the age group of 10 to 14 year olds has the lowest likelihood of being enrolled in a private school, with 89 (100.0% in the age bracket) attending a public institution.
| Age Bracket | Public School | Private School |
| 3 to 4 Year Olds | 0 (0.0%) | 19 (100.0%) |
| 5 to 9 Year Old | 46 (85.2%) | 8 (14.8%) |
| 10 to 14 Year Olds | 89 (100.0%) | 0 (0.0%) |
| 15 to 17 Year Olds | 40 (100.0%) | 0 (0.0%) |
| 18 to 19 Year Olds | 9 (100.0%) | 0 (0.0%) |
| 20 to 24 Year Olds | 14 (100.0%) | 0 (0.0%) |
| 25 to 34 Year Olds | 16 (100.0%) | 0 (0.0%) |
| 35 Years and over | 13 (100.0%) | 0 (0.0%) |
| Total | 227 (89.4%) | 27 (10.6%) |
Educational Attainment by Field of Study in Honaker
Education (29 | 27.1%), arts & humanities (21 | 19.6%), computers & mathematics (13 | 12.1%), social sciences (10 | 9.3%), and liberal arts & history (10 | 9.3%) are the most common fields of study among 107 individuals in Honaker who have obtained a bachelor's degree or higher.
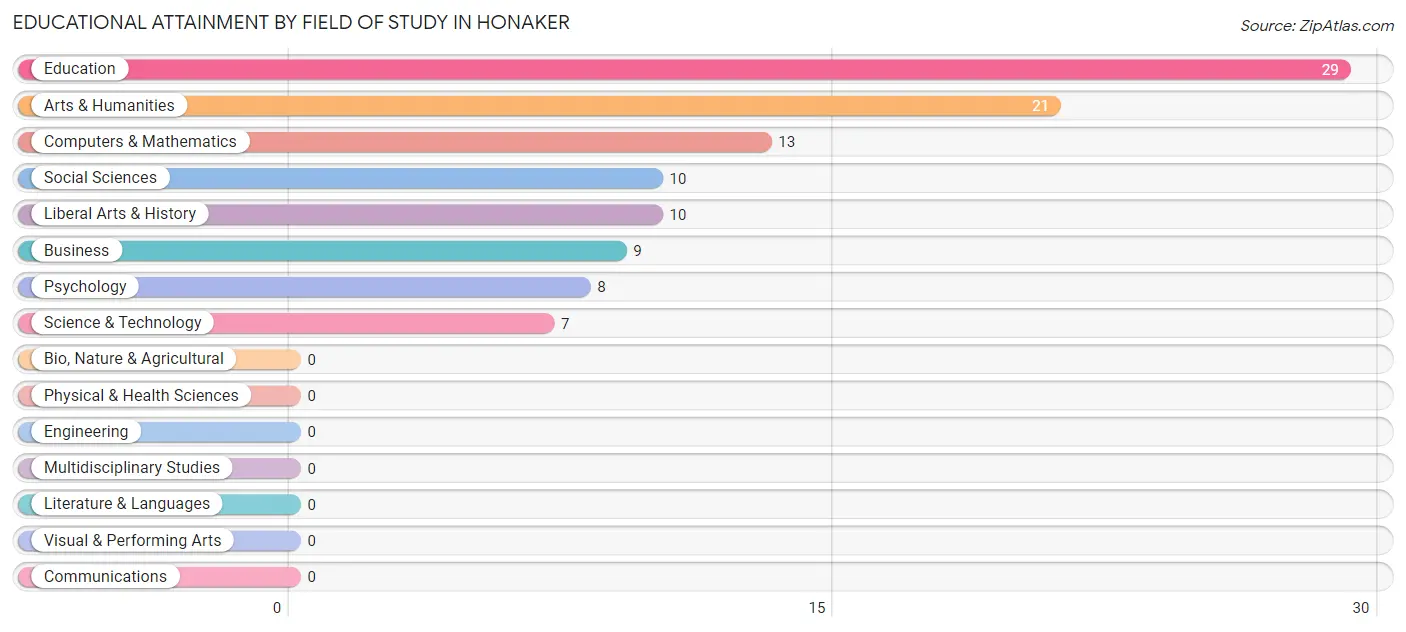
| Field of Study | # Graduates | % Graduates |
| Computers & Mathematics | 13 | 12.1% |
| Bio, Nature & Agricultural | 0 | 0.0% |
| Physical & Health Sciences | 0 | 0.0% |
| Psychology | 8 | 7.5% |
| Social Sciences | 10 | 9.3% |
| Engineering | 0 | 0.0% |
| Multidisciplinary Studies | 0 | 0.0% |
| Science & Technology | 7 | 6.5% |
| Business | 9 | 8.4% |
| Education | 29 | 27.1% |
| Literature & Languages | 0 | 0.0% |
| Liberal Arts & History | 10 | 9.3% |
| Visual & Performing Arts | 0 | 0.0% |
| Communications | 0 | 0.0% |
| Arts & Humanities | 21 | 19.6% |
| Total | 107 | 100.0% |
Transportation & Commute in Honaker
Vehicle Availability by Sex in Honaker
The most prevalent vehicle ownership categories in Honaker are males with 3 vehicles (103, accounting for 46.8%) and females with 3 vehicles (114, making up 49.3%).
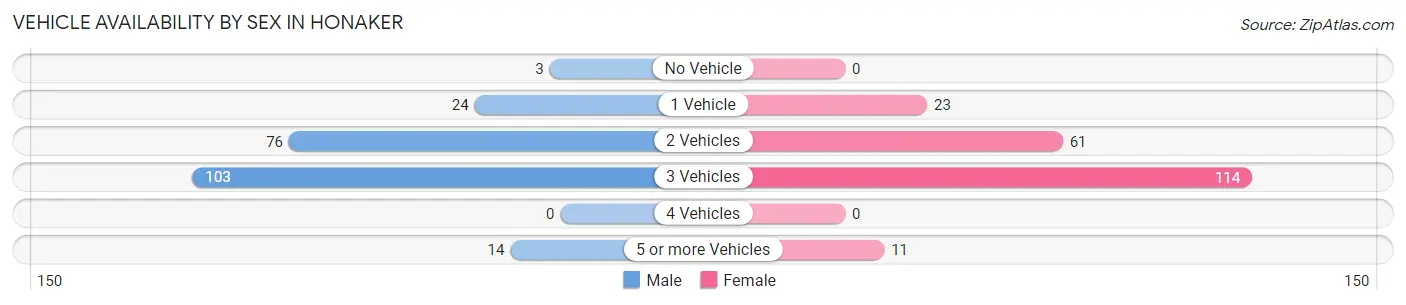
| Vehicles Available | Male | Female |
| No Vehicle | 3 (1.4%) | 0 (0.0%) |
| 1 Vehicle | 24 (10.9%) | 23 (11.0%) |
| 2 Vehicles | 76 (34.5%) | 61 (29.2%) |
| 3 Vehicles | 103 (46.8%) | 114 (54.5%) |
| 4 Vehicles | 0 (0.0%) | 0 (0.0%) |
| 5 or more Vehicles | 14 (6.4%) | 11 (5.3%) |
| Total | 220 (100.0%) | 209 (100.0%) |
Commute Time in Honaker
The most frequently occuring commute durations in Honaker are 20 to 24 minutes (99 commuters, 23.3%), 60 to 89 minutes (63 commuters, 14.8%), and 40 to 44 minutes (58 commuters, 13.7%).
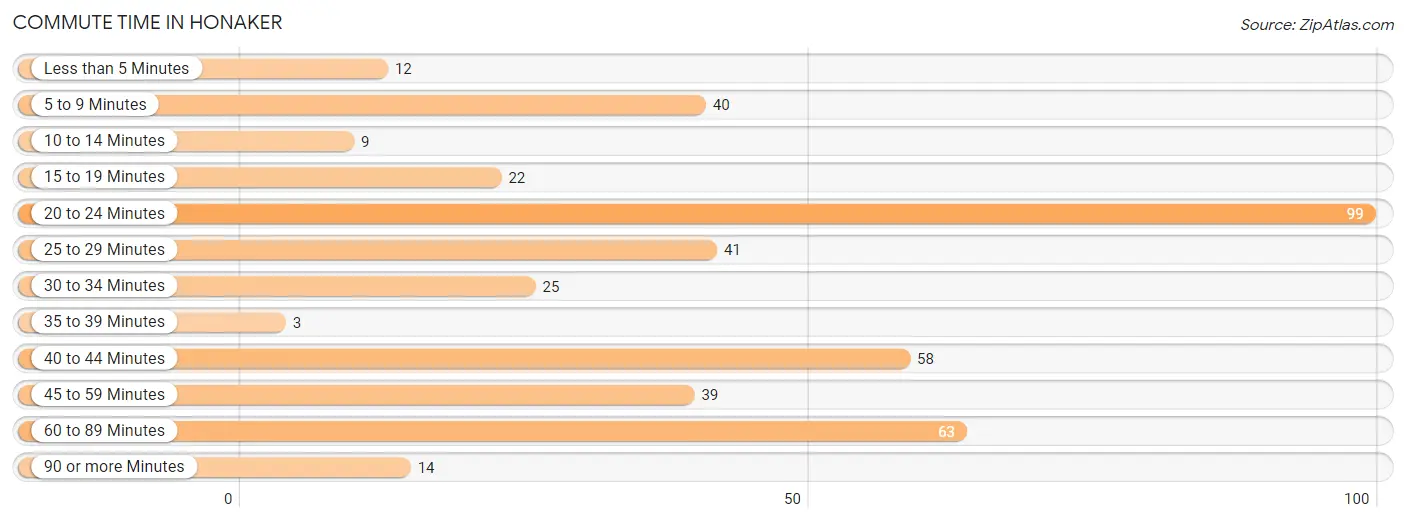
| Commute Time | # Commuters | % Commuters |
| Less than 5 Minutes | 12 | 2.8% |
| 5 to 9 Minutes | 40 | 9.4% |
| 10 to 14 Minutes | 9 | 2.1% |
| 15 to 19 Minutes | 22 | 5.2% |
| 20 to 24 Minutes | 99 | 23.3% |
| 25 to 29 Minutes | 41 | 9.7% |
| 30 to 34 Minutes | 25 | 5.9% |
| 35 to 39 Minutes | 3 | 0.7% |
| 40 to 44 Minutes | 58 | 13.7% |
| 45 to 59 Minutes | 39 | 9.2% |
| 60 to 89 Minutes | 63 | 14.8% |
| 90 or more Minutes | 14 | 3.3% |
Commute Time by Sex in Honaker
The most common commute times in Honaker are 20 to 24 minutes (48 commuters, 21.4%) for males and 60 to 89 minutes (63 commuters, 31.3%) for females.
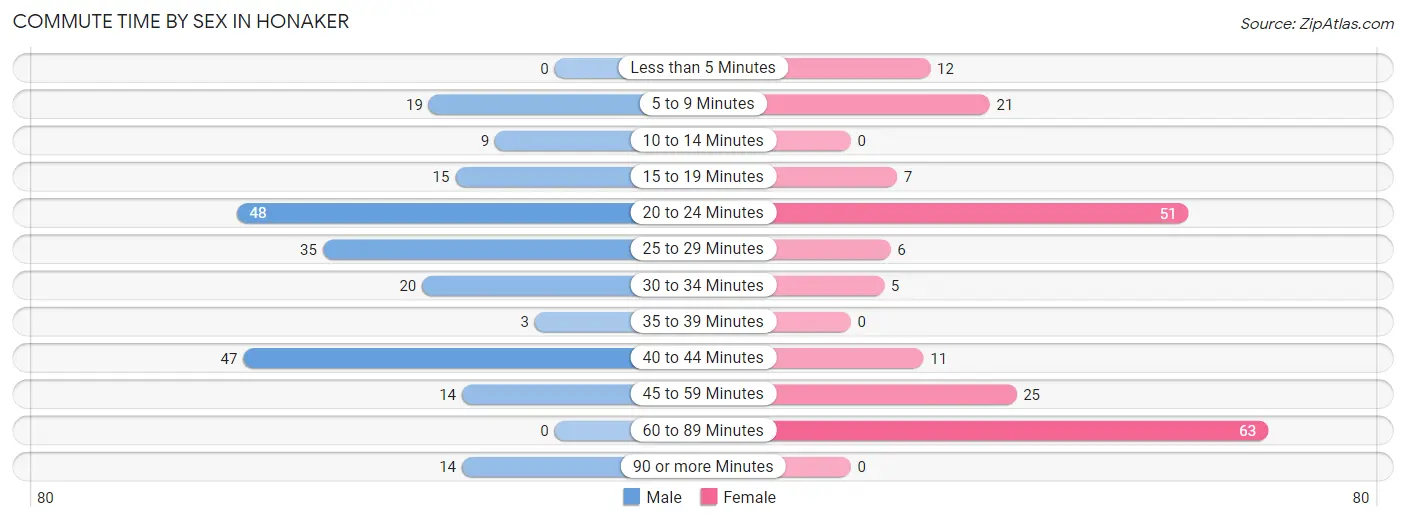
| Commute Time | Male | Female |
| Less than 5 Minutes | 0 (0.0%) | 12 (6.0%) |
| 5 to 9 Minutes | 19 (8.5%) | 21 (10.4%) |
| 10 to 14 Minutes | 9 (4.0%) | 0 (0.0%) |
| 15 to 19 Minutes | 15 (6.7%) | 7 (3.5%) |
| 20 to 24 Minutes | 48 (21.4%) | 51 (25.4%) |
| 25 to 29 Minutes | 35 (15.6%) | 6 (3.0%) |
| 30 to 34 Minutes | 20 (8.9%) | 5 (2.5%) |
| 35 to 39 Minutes | 3 (1.3%) | 0 (0.0%) |
| 40 to 44 Minutes | 47 (21.0%) | 11 (5.5%) |
| 45 to 59 Minutes | 14 (6.2%) | 25 (12.4%) |
| 60 to 89 Minutes | 0 (0.0%) | 63 (31.3%) |
| 90 or more Minutes | 14 (6.2%) | 0 (0.0%) |
Time of Departure to Work by Sex in Honaker
The most frequent times of departure to work in Honaker are 4:00 PM to 11:59 PM (51, 22.8%) for males and 5:30 AM to 5:59 AM (56, 27.9%) for females.
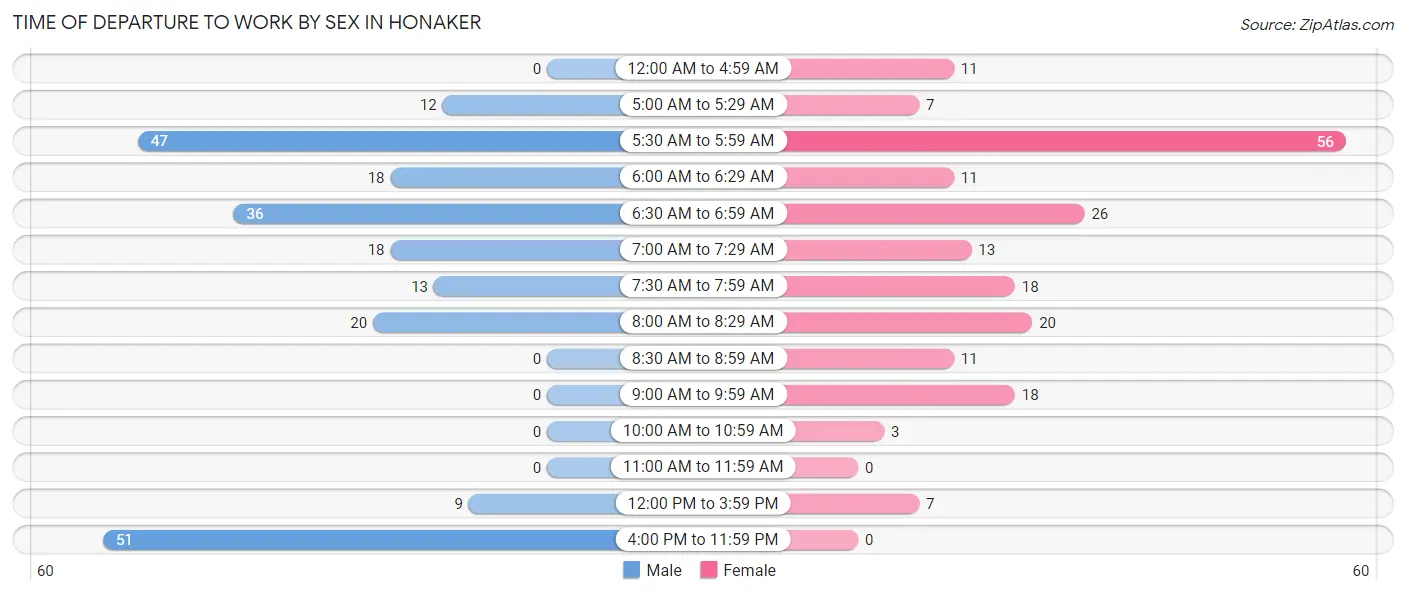
| Time of Departure | Male | Female |
| 12:00 AM to 4:59 AM | 0 (0.0%) | 11 (5.5%) |
| 5:00 AM to 5:29 AM | 12 (5.4%) | 7 (3.5%) |
| 5:30 AM to 5:59 AM | 47 (21.0%) | 56 (27.9%) |
| 6:00 AM to 6:29 AM | 18 (8.0%) | 11 (5.5%) |
| 6:30 AM to 6:59 AM | 36 (16.1%) | 26 (12.9%) |
| 7:00 AM to 7:29 AM | 18 (8.0%) | 13 (6.5%) |
| 7:30 AM to 7:59 AM | 13 (5.8%) | 18 (9.0%) |
| 8:00 AM to 8:29 AM | 20 (8.9%) | 20 (10.0%) |
| 8:30 AM to 8:59 AM | 0 (0.0%) | 11 (5.5%) |
| 9:00 AM to 9:59 AM | 0 (0.0%) | 18 (9.0%) |
| 10:00 AM to 10:59 AM | 0 (0.0%) | 3 (1.5%) |
| 11:00 AM to 11:59 AM | 0 (0.0%) | 0 (0.0%) |
| 12:00 PM to 3:59 PM | 9 (4.0%) | 7 (3.5%) |
| 4:00 PM to 11:59 PM | 51 (22.8%) | 0 (0.0%) |
| Total | 224 (100.0%) | 201 (100.0%) |
Housing Occupancy in Honaker
Occupancy by Ownership in Honaker
Of the total 497 dwellings in Honaker, owner-occupied units account for 364 (73.2%), while renter-occupied units make up 133 (26.8%).
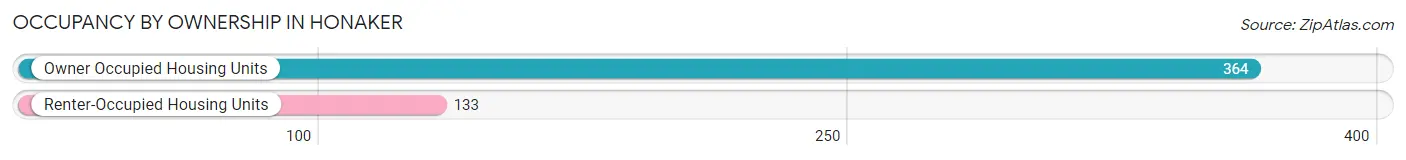
| Occupancy | # Housing Units | % Housing Units |
| Owner Occupied Housing Units | 364 | 73.2% |
| Renter-Occupied Housing Units | 133 | 26.8% |
| Total Occupied Housing Units | 497 | 100.0% |
Occupancy by Household Size in Honaker
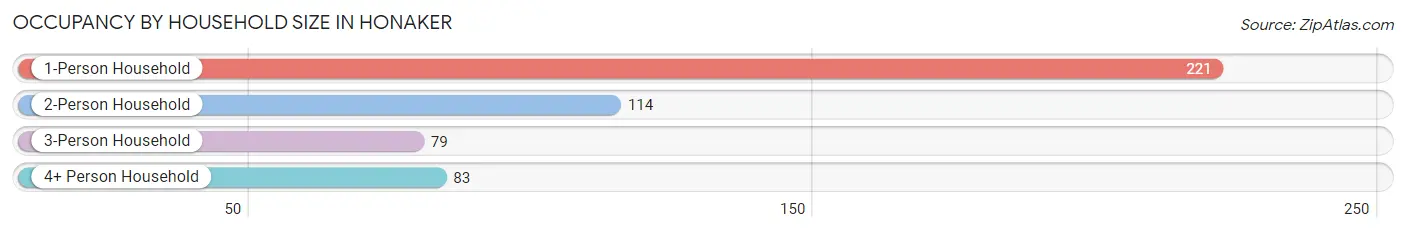
| Household Size | # Housing Units | % Housing Units |
| 1-Person Household | 221 | 44.5% |
| 2-Person Household | 114 | 22.9% |
| 3-Person Household | 79 | 15.9% |
| 4+ Person Household | 83 | 16.7% |
| Total Housing Units | 497 | 100.0% |
Occupancy by Ownership by Household Size in Honaker
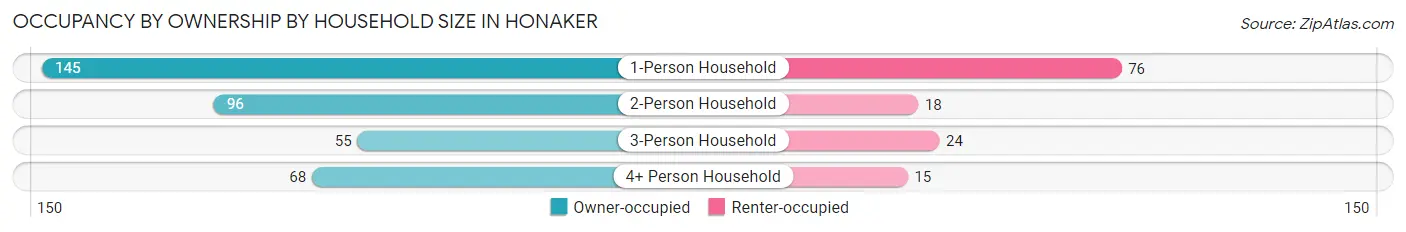
| Household Size | Owner-occupied | Renter-occupied |
| 1-Person Household | 145 (65.6%) | 76 (34.4%) |
| 2-Person Household | 96 (84.2%) | 18 (15.8%) |
| 3-Person Household | 55 (69.6%) | 24 (30.4%) |
| 4+ Person Household | 68 (81.9%) | 15 (18.1%) |
| Total Housing Units | 364 (73.2%) | 133 (26.8%) |
Occupancy by Educational Attainment in Honaker
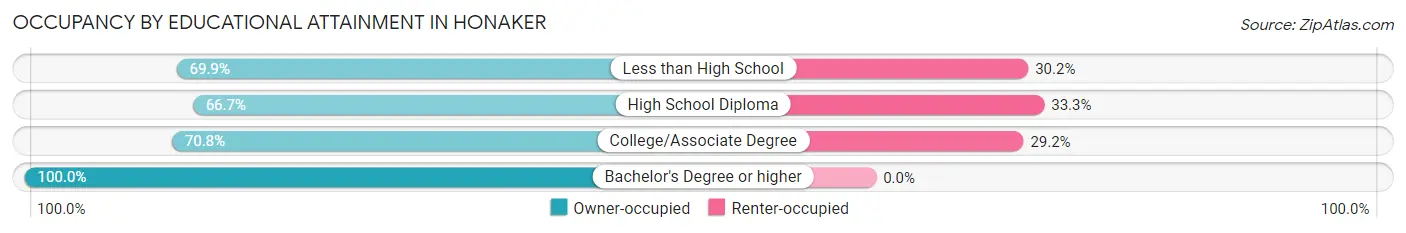
| Household Size | Owner-occupied | Renter-occupied |
| Less than High School | 95 (69.9%) | 41 (30.1%) |
| High School Diploma | 118 (66.7%) | 59 (33.3%) |
| College/Associate Degree | 80 (70.8%) | 33 (29.2%) |
| Bachelor's Degree or higher | 71 (100.0%) | 0 (0.0%) |
Occupancy by Age of Householder in Honaker
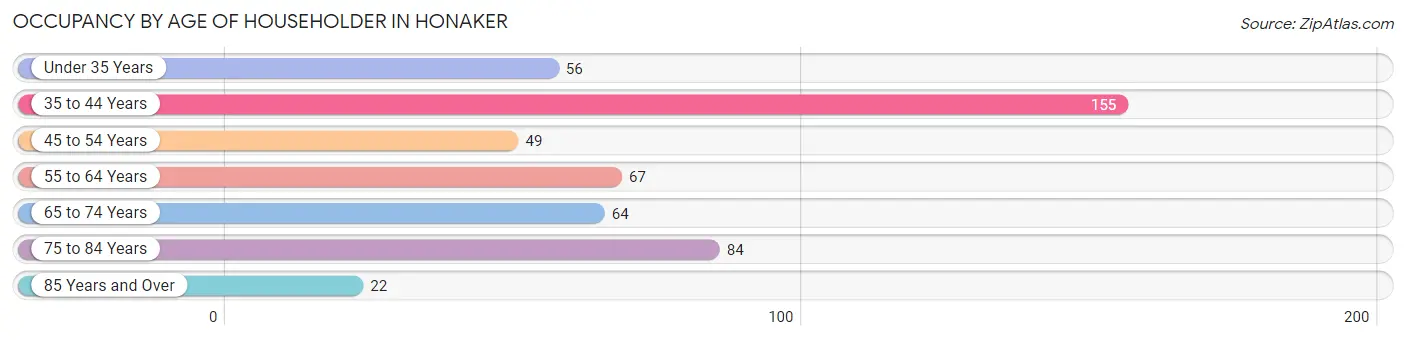
| Age Bracket | # Households | % Households |
| Under 35 Years | 56 | 11.3% |
| 35 to 44 Years | 155 | 31.2% |
| 45 to 54 Years | 49 | 9.9% |
| 55 to 64 Years | 67 | 13.5% |
| 65 to 74 Years | 64 | 12.9% |
| 75 to 84 Years | 84 | 16.9% |
| 85 Years and Over | 22 | 4.4% |
| Total | 497 | 100.0% |
Housing Finances in Honaker
Median Income by Occupancy in Honaker
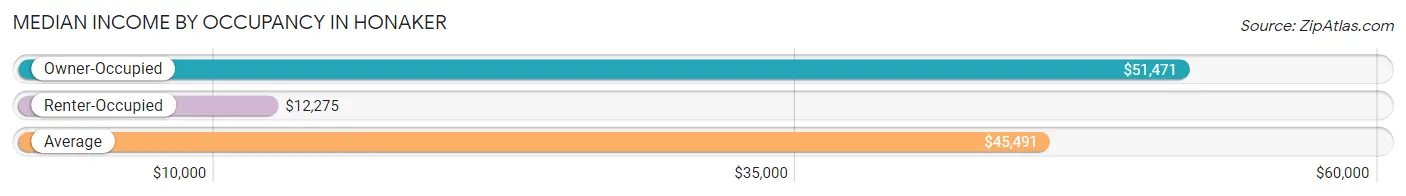
| Occupancy Type | # Households | Median Income |
| Owner-Occupied | 364 (73.2%) | $51,471 |
| Renter-Occupied | 133 (26.8%) | $12,275 |
| Average | 497 (100.0%) | $45,491 |
Occupancy by Householder Income Bracket in Honaker
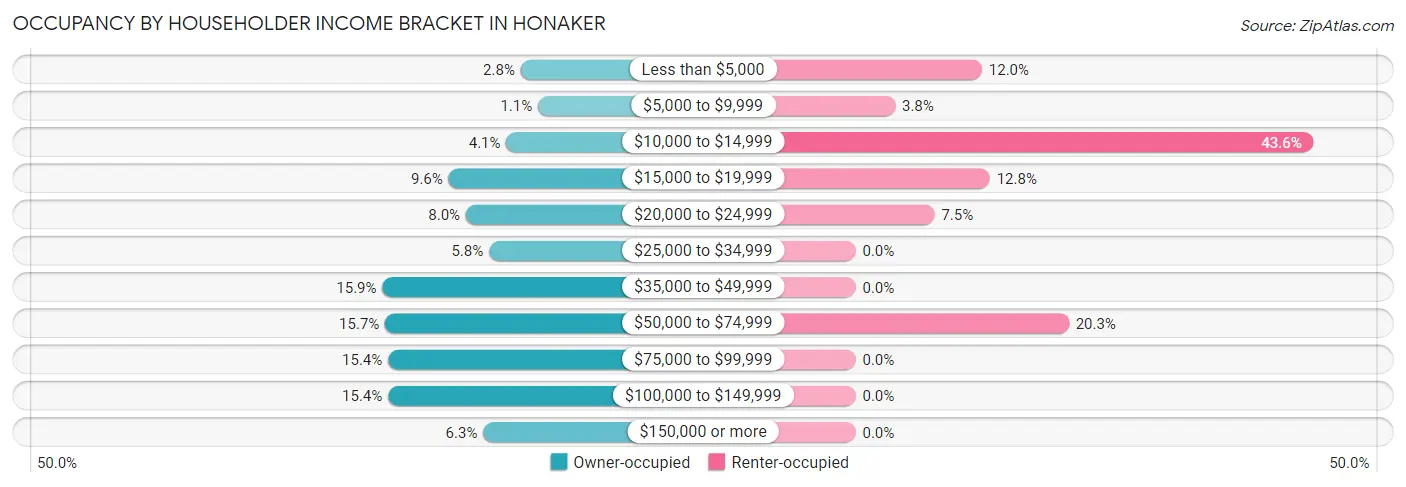
| Income Bracket | Owner-occupied | Renter-occupied |
| Less than $5,000 | 10 (2.8%) | 16 (12.0%) |
| $5,000 to $9,999 | 4 (1.1%) | 5 (3.8%) |
| $10,000 to $14,999 | 15 (4.1%) | 58 (43.6%) |
| $15,000 to $19,999 | 35 (9.6%) | 17 (12.8%) |
| $20,000 to $24,999 | 29 (8.0%) | 10 (7.5%) |
| $25,000 to $34,999 | 21 (5.8%) | 0 (0.0%) |
| $35,000 to $49,999 | 58 (15.9%) | 0 (0.0%) |
| $50,000 to $74,999 | 57 (15.7%) | 27 (20.3%) |
| $75,000 to $99,999 | 56 (15.4%) | 0 (0.0%) |
| $100,000 to $149,999 | 56 (15.4%) | 0 (0.0%) |
| $150,000 or more | 23 (6.3%) | 0 (0.0%) |
| Total | 364 (100.0%) | 133 (100.0%) |
Monthly Housing Cost Tiers in Honaker
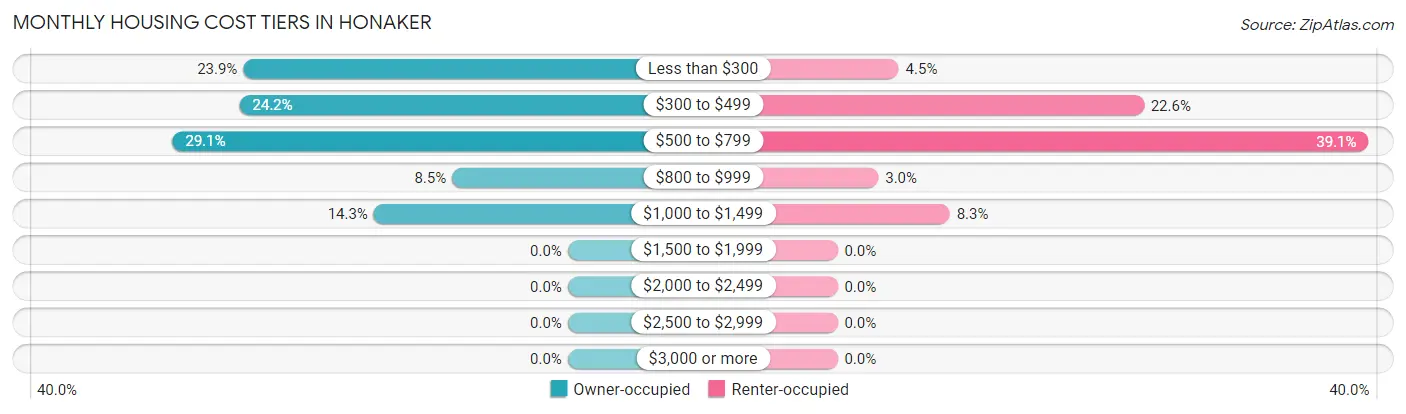
| Monthly Cost | Owner-occupied | Renter-occupied |
| Less than $300 | 87 (23.9%) | 6 (4.5%) |
| $300 to $499 | 88 (24.2%) | 30 (22.6%) |
| $500 to $799 | 106 (29.1%) | 52 (39.1%) |
| $800 to $999 | 31 (8.5%) | 4 (3.0%) |
| $1,000 to $1,499 | 52 (14.3%) | 11 (8.3%) |
| $1,500 to $1,999 | 0 (0.0%) | 0 (0.0%) |
| $2,000 to $2,499 | 0 (0.0%) | 0 (0.0%) |
| $2,500 to $2,999 | 0 (0.0%) | 0 (0.0%) |
| $3,000 or more | 0 (0.0%) | 0 (0.0%) |
| Total | 364 (100.0%) | 133 (100.0%) |
Physical Housing Characteristics in Honaker
Housing Structures in Honaker
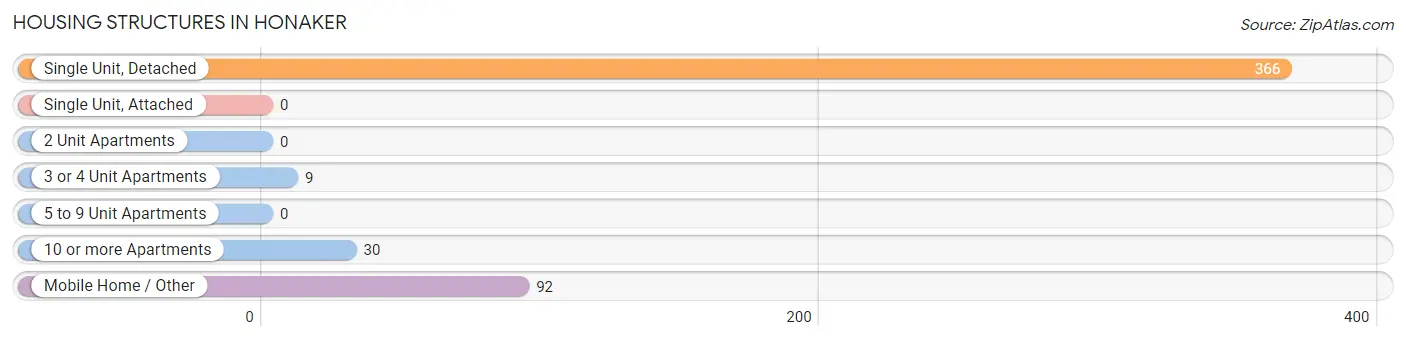
| Structure Type | # Housing Units | % Housing Units |
| Single Unit, Detached | 366 | 73.6% |
| Single Unit, Attached | 0 | 0.0% |
| 2 Unit Apartments | 0 | 0.0% |
| 3 or 4 Unit Apartments | 9 | 1.8% |
| 5 to 9 Unit Apartments | 0 | 0.0% |
| 10 or more Apartments | 30 | 6.0% |
| Mobile Home / Other | 92 | 18.5% |
| Total | 497 | 100.0% |
Housing Structures by Occupancy in Honaker
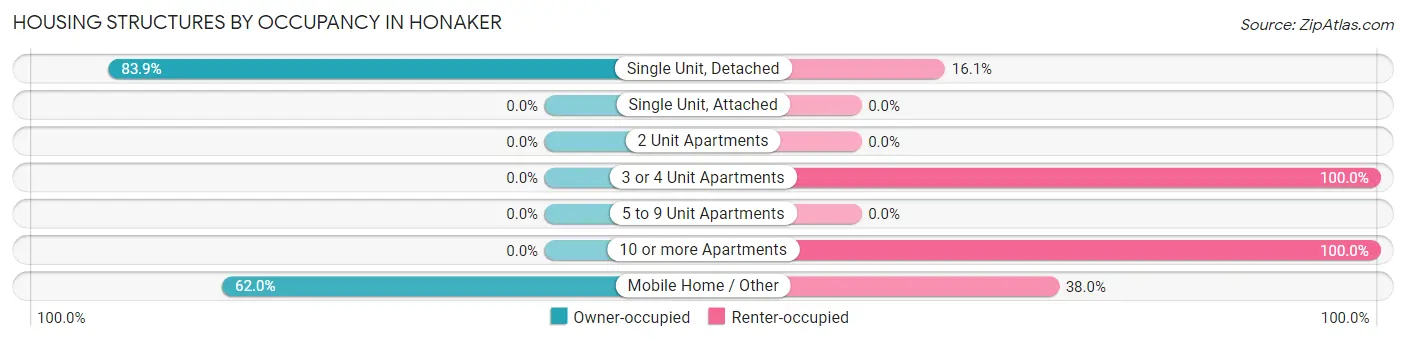
| Structure Type | Owner-occupied | Renter-occupied |
| Single Unit, Detached | 307 (83.9%) | 59 (16.1%) |
| Single Unit, Attached | 0 (0.0%) | 0 (0.0%) |
| 2 Unit Apartments | 0 (0.0%) | 0 (0.0%) |
| 3 or 4 Unit Apartments | 0 (0.0%) | 9 (100.0%) |
| 5 to 9 Unit Apartments | 0 (0.0%) | 0 (0.0%) |
| 10 or more Apartments | 0 (0.0%) | 30 (100.0%) |
| Mobile Home / Other | 57 (62.0%) | 35 (38.0%) |
| Total | 364 (73.2%) | 133 (26.8%) |
Housing Structures by Number of Rooms in Honaker
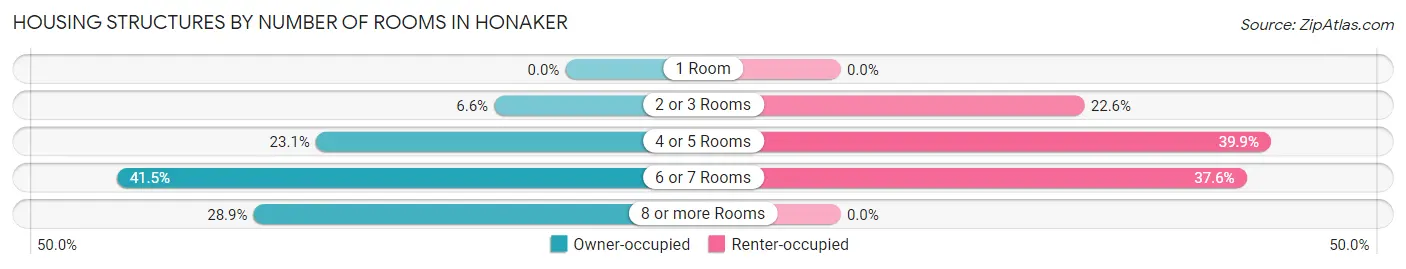
| Number of Rooms | Owner-occupied | Renter-occupied |
| 1 Room | 0 (0.0%) | 0 (0.0%) |
| 2 or 3 Rooms | 24 (6.6%) | 30 (22.6%) |
| 4 or 5 Rooms | 84 (23.1%) | 53 (39.9%) |
| 6 or 7 Rooms | 151 (41.5%) | 50 (37.6%) |
| 8 or more Rooms | 105 (28.8%) | 0 (0.0%) |
| Total | 364 (100.0%) | 133 (100.0%) |
Housing Structure by Heating Type in Honaker
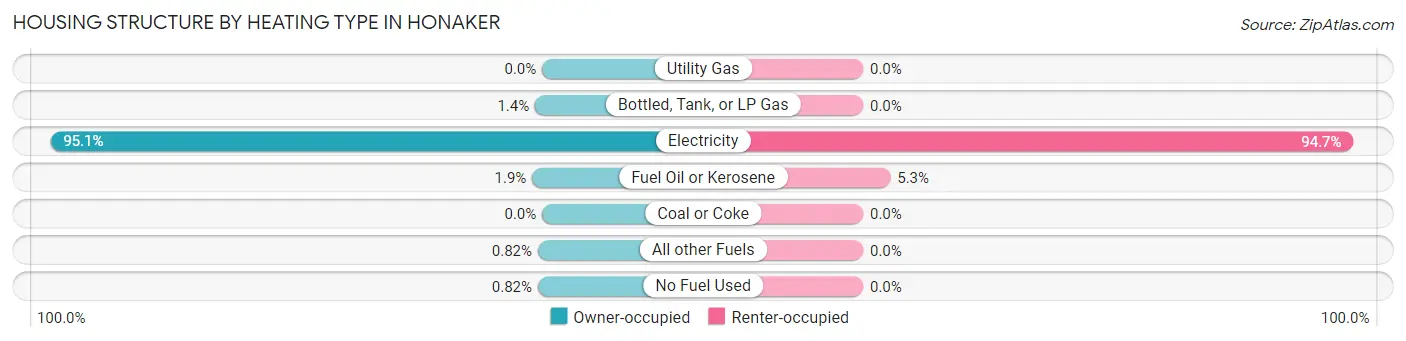
| Heating Type | Owner-occupied | Renter-occupied |
| Utility Gas | 0 (0.0%) | 0 (0.0%) |
| Bottled, Tank, or LP Gas | 5 (1.4%) | 0 (0.0%) |
| Electricity | 346 (95.1%) | 126 (94.7%) |
| Fuel Oil or Kerosene | 7 (1.9%) | 7 (5.3%) |
| Coal or Coke | 0 (0.0%) | 0 (0.0%) |
| All other Fuels | 3 (0.8%) | 0 (0.0%) |
| No Fuel Used | 3 (0.8%) | 0 (0.0%) |
| Total | 364 (100.0%) | 133 (100.0%) |
Household Vehicle Usage in Honaker
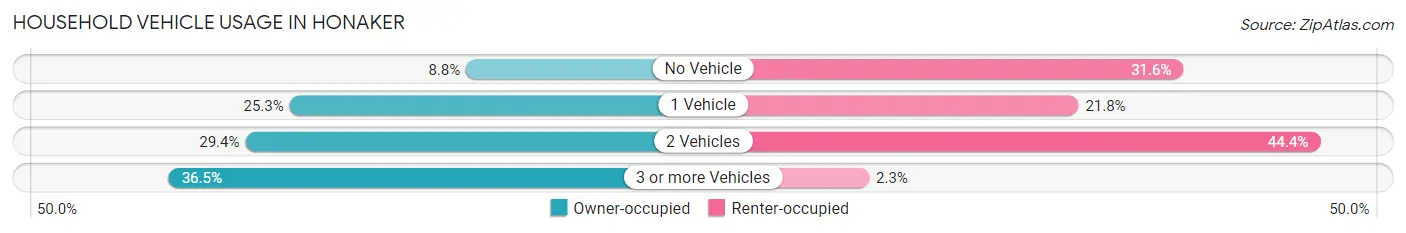
| Vehicles per Household | Owner-occupied | Renter-occupied |
| No Vehicle | 32 (8.8%) | 42 (31.6%) |
| 1 Vehicle | 92 (25.3%) | 29 (21.8%) |
| 2 Vehicles | 107 (29.4%) | 59 (44.4%) |
| 3 or more Vehicles | 133 (36.5%) | 3 (2.3%) |
| Total | 364 (100.0%) | 133 (100.0%) |
Real Estate & Mortgages in Honaker
Real Estate and Mortgage Overview in Honaker
| Characteristic | Without Mortgage | With Mortgage |
| Housing Units | 234 | 130 |
| Median Property Value | $87,500 | $109,400 |
| Median Household Income | $37,083 | $0 |
| Monthly Housing Costs | $350 | $0 |
| Real Estate Taxes | $538 | $11 |
Property Value by Mortgage Status in Honaker
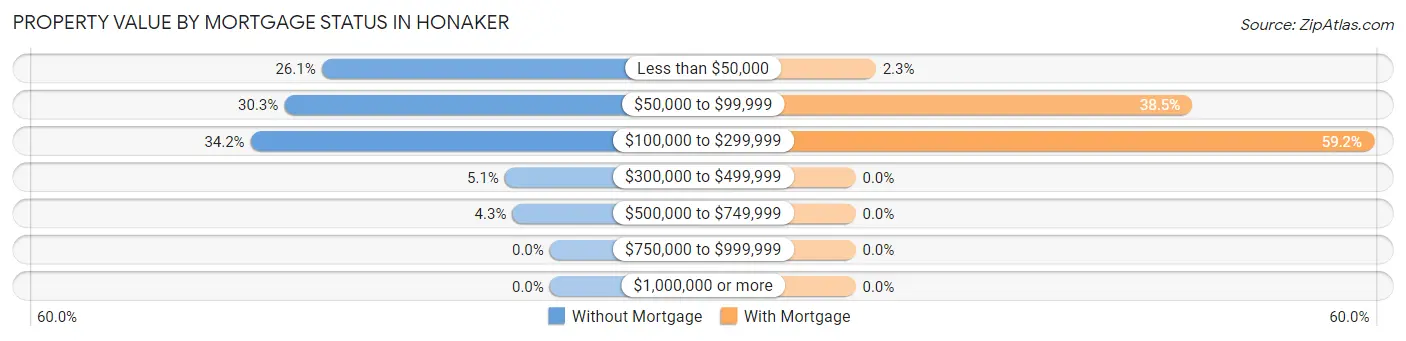
| Property Value | Without Mortgage | With Mortgage |
| Less than $50,000 | 61 (26.1%) | 3 (2.3%) |
| $50,000 to $99,999 | 71 (30.3%) | 50 (38.5%) |
| $100,000 to $299,999 | 80 (34.2%) | 77 (59.2%) |
| $300,000 to $499,999 | 12 (5.1%) | 0 (0.0%) |
| $500,000 to $749,999 | 10 (4.3%) | 0 (0.0%) |
| $750,000 to $999,999 | 0 (0.0%) | 0 (0.0%) |
| $1,000,000 or more | 0 (0.0%) | 0 (0.0%) |
| Total | 234 (100.0%) | 130 (100.0%) |
Household Income by Mortgage Status in Honaker
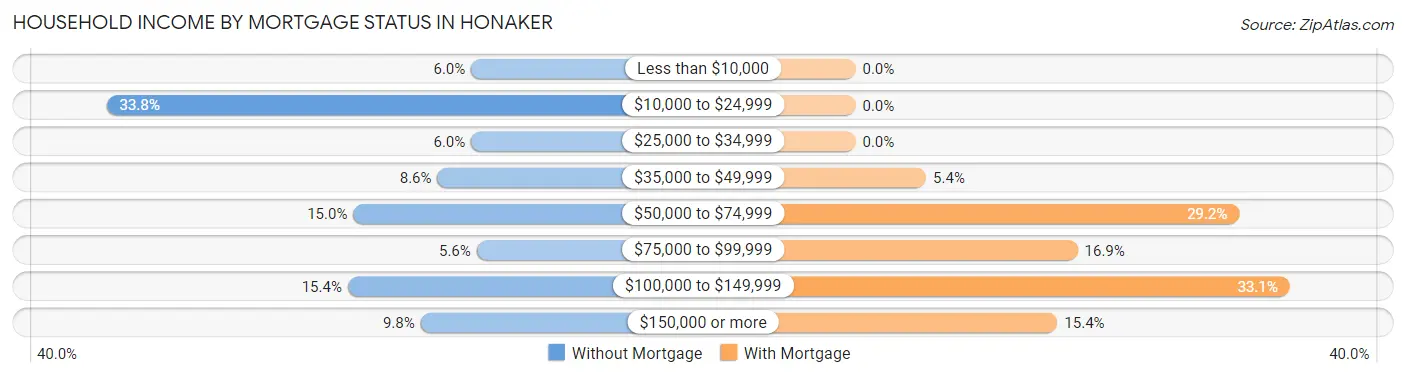
| Household Income | Without Mortgage | With Mortgage |
| Less than $10,000 | 14 (6.0%) | 0 (0.0%) |
| $10,000 to $24,999 | 79 (33.8%) | 0 (0.0%) |
| $25,000 to $34,999 | 14 (6.0%) | 0 (0.0%) |
| $35,000 to $49,999 | 20 (8.6%) | 7 (5.4%) |
| $50,000 to $74,999 | 35 (15.0%) | 38 (29.2%) |
| $75,000 to $99,999 | 13 (5.6%) | 22 (16.9%) |
| $100,000 to $149,999 | 36 (15.4%) | 43 (33.1%) |
| $150,000 or more | 23 (9.8%) | 20 (15.4%) |
| Total | 234 (100.0%) | 130 (100.0%) |
Property Value to Household Income Ratio in Honaker
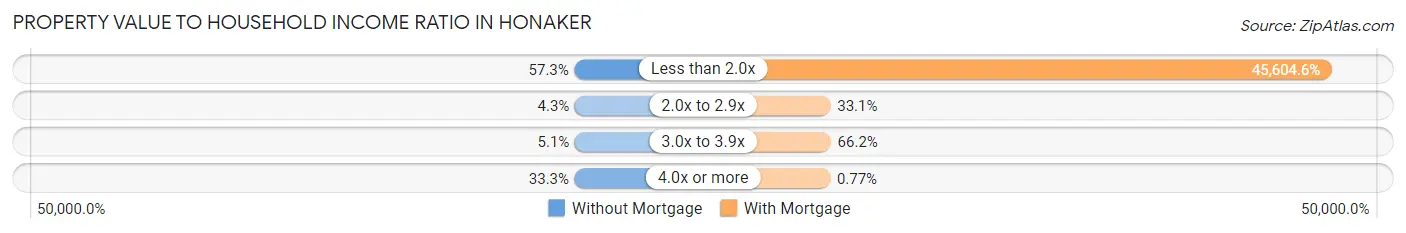
| Value-to-Income Ratio | Without Mortgage | With Mortgage |
| Less than 2.0x | 134 (57.3%) | 59,286 (45,604.6%) |
| 2.0x to 2.9x | 10 (4.3%) | 43 (33.1%) |
| 3.0x to 3.9x | 12 (5.1%) | 86 (66.1%) |
| 4.0x or more | 78 (33.3%) | 1 (0.8%) |
| Total | 234 (100.0%) | 130 (100.0%) |
Real Estate Taxes by Mortgage Status in Honaker
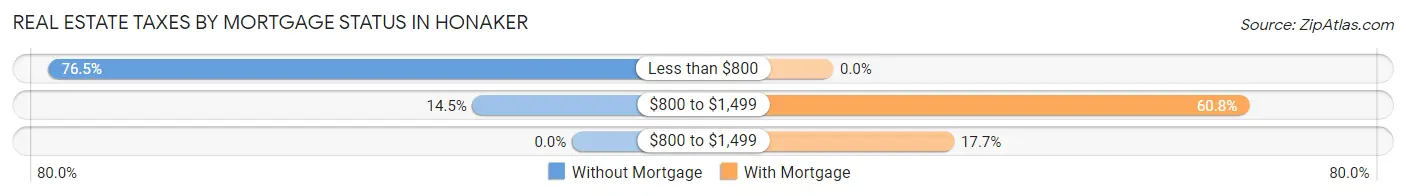
| Property Taxes | Without Mortgage | With Mortgage |
| Less than $800 | 179 (76.5%) | 0 (0.0%) |
| $800 to $1,499 | 34 (14.5%) | 79 (60.8%) |
| $800 to $1,499 | 0 (0.0%) | 23 (17.7%) |
| Total | 234 (100.0%) | 130 (100.0%) |
Health & Disability in Honaker
Health Insurance Coverage by Age in Honaker
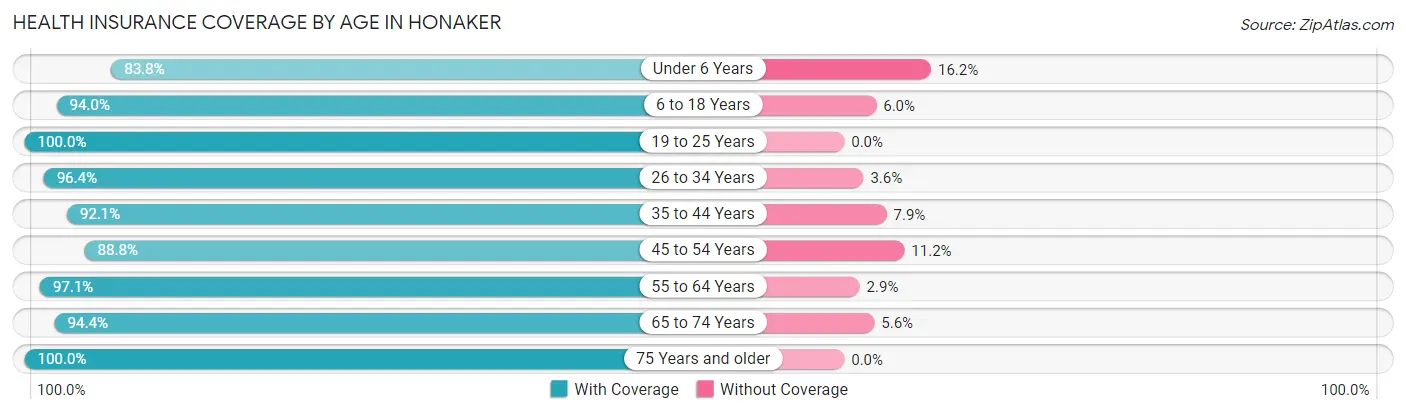
| Age Bracket | With Coverage | Without Coverage |
| Under 6 Years | 57 (83.8%) | 11 (16.2%) |
| 6 to 18 Years | 221 (94.0%) | 14 (6.0%) |
| 19 to 25 Years | 69 (100.0%) | 0 (0.0%) |
| 26 to 34 Years | 108 (96.4%) | 4 (3.6%) |
| 35 to 44 Years | 257 (92.1%) | 22 (7.9%) |
| 45 to 54 Years | 95 (88.8%) | 12 (11.2%) |
| 55 to 64 Years | 102 (97.1%) | 3 (2.9%) |
| 65 to 74 Years | 101 (94.4%) | 6 (5.6%) |
| 75 Years and older | 131 (100.0%) | 0 (0.0%) |
| Total | 1,141 (94.1%) | 72 (5.9%) |
Health Insurance Coverage by Citizenship Status in Honaker
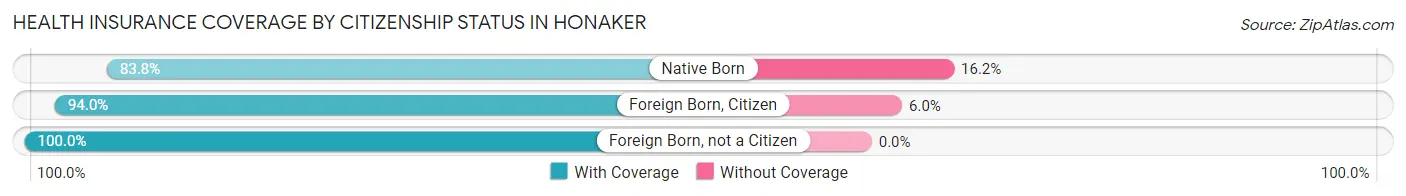
| Citizenship Status | With Coverage | Without Coverage |
| Native Born | 57 (83.8%) | 11 (16.2%) |
| Foreign Born, Citizen | 221 (94.0%) | 14 (6.0%) |
| Foreign Born, not a Citizen | 69 (100.0%) | 0 (0.0%) |
Health Insurance Coverage by Household Income in Honaker
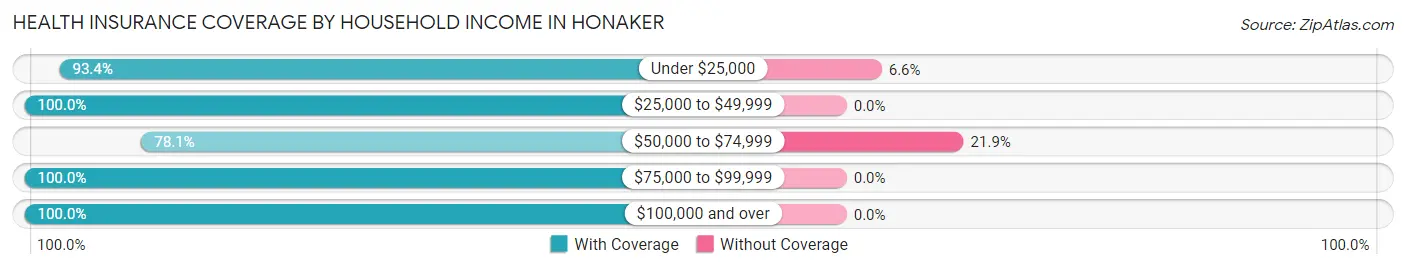
| Household Income | With Coverage | Without Coverage |
| Under $25,000 | 299 (93.4%) | 21 (6.6%) |
| $25,000 to $49,999 | 217 (100.0%) | 0 (0.0%) |
| $50,000 to $74,999 | 182 (78.1%) | 51 (21.9%) |
| $75,000 to $99,999 | 188 (100.0%) | 0 (0.0%) |
| $100,000 and over | 241 (100.0%) | 0 (0.0%) |
Public vs Private Health Insurance Coverage by Age in Honaker
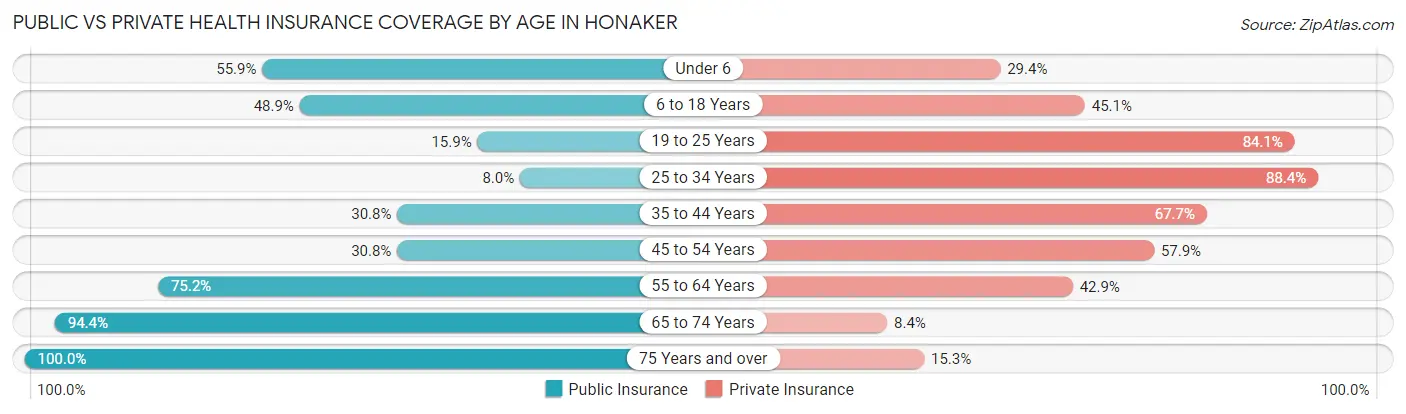
| Age Bracket | Public Insurance | Private Insurance |
| Under 6 | 38 (55.9%) | 20 (29.4%) |
| 6 to 18 Years | 115 (48.9%) | 106 (45.1%) |
| 19 to 25 Years | 11 (15.9%) | 58 (84.1%) |
| 25 to 34 Years | 9 (8.0%) | 99 (88.4%) |
| 35 to 44 Years | 86 (30.8%) | 189 (67.7%) |
| 45 to 54 Years | 33 (30.8%) | 62 (57.9%) |
| 55 to 64 Years | 79 (75.2%) | 45 (42.9%) |
| 65 to 74 Years | 101 (94.4%) | 9 (8.4%) |
| 75 Years and over | 131 (100.0%) | 20 (15.3%) |
| Total | 603 (49.7%) | 608 (50.1%) |
Disability Status by Sex by Age in Honaker

| Age Bracket | Male | Female |
| Under 5 Years | 0 (0.0%) | 0 (0.0%) |
| 5 to 17 Years | 30 (23.6%) | 6 (5.9%) |
| 18 to 34 Years | 11 (14.7%) | 10 (7.9%) |
| 35 to 64 Years | 102 (33.8%) | 66 (34.9%) |
| 65 to 74 Years | 19 (50.0%) | 58 (84.1%) |
| 75 Years and over | 38 (92.7%) | 57 (63.3%) |
Disability Class by Sex by Age in Honaker
Disability Class: Hearing Difficulty
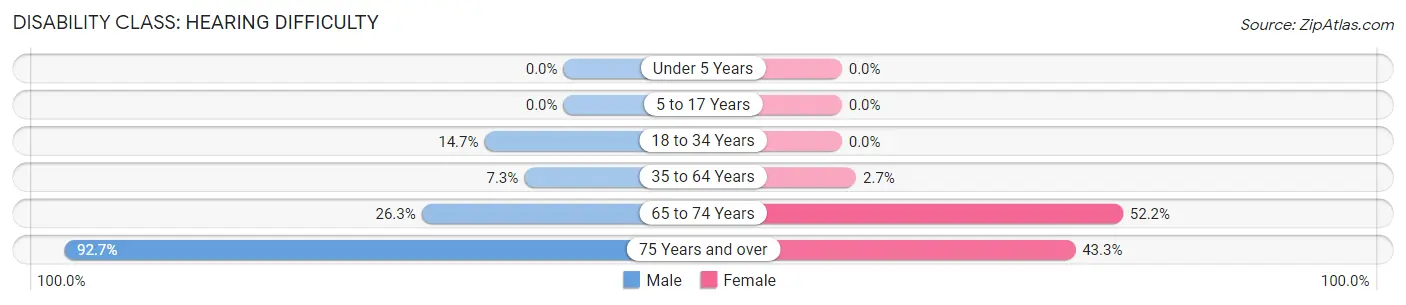
| Age Bracket | Male | Female |
| Under 5 Years | 0 (0.0%) | 0 (0.0%) |
| 5 to 17 Years | 0 (0.0%) | 0 (0.0%) |
| 18 to 34 Years | 11 (14.7%) | 0 (0.0%) |
| 35 to 64 Years | 22 (7.3%) | 5 (2.6%) |
| 65 to 74 Years | 10 (26.3%) | 36 (52.2%) |
| 75 Years and over | 38 (92.7%) | 39 (43.3%) |
Disability Class: Vision Difficulty
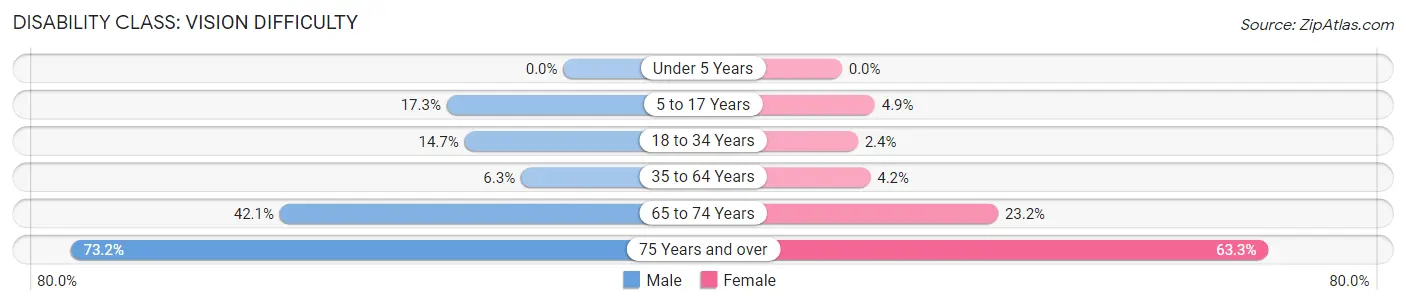
| Age Bracket | Male | Female |
| Under 5 Years | 0 (0.0%) | 0 (0.0%) |
| 5 to 17 Years | 22 (17.3%) | 5 (4.9%) |
| 18 to 34 Years | 11 (14.7%) | 3 (2.4%) |
| 35 to 64 Years | 19 (6.3%) | 8 (4.2%) |
| 65 to 74 Years | 16 (42.1%) | 16 (23.2%) |
| 75 Years and over | 30 (73.2%) | 57 (63.3%) |
Disability Class: Cognitive Difficulty
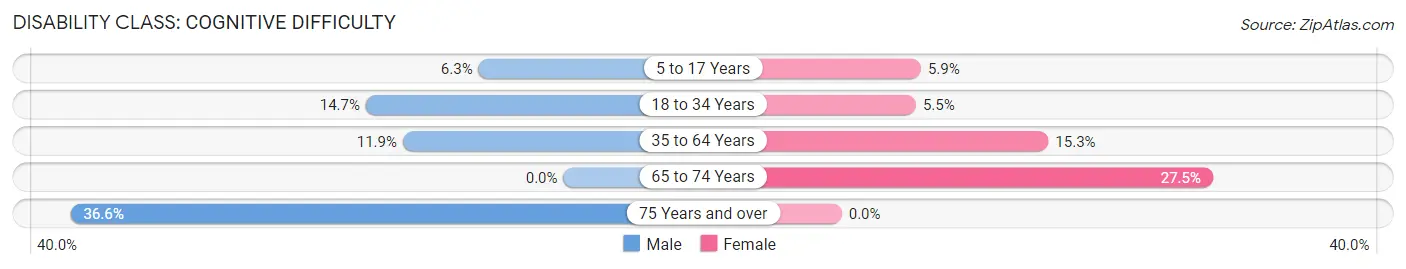
| Age Bracket | Male | Female |
| 5 to 17 Years | 8 (6.3%) | 6 (5.9%) |
| 18 to 34 Years | 11 (14.7%) | 7 (5.5%) |
| 35 to 64 Years | 36 (11.9%) | 29 (15.3%) |
| 65 to 74 Years | 0 (0.0%) | 19 (27.5%) |
| 75 Years and over | 15 (36.6%) | 0 (0.0%) |
Disability Class: Ambulatory Difficulty
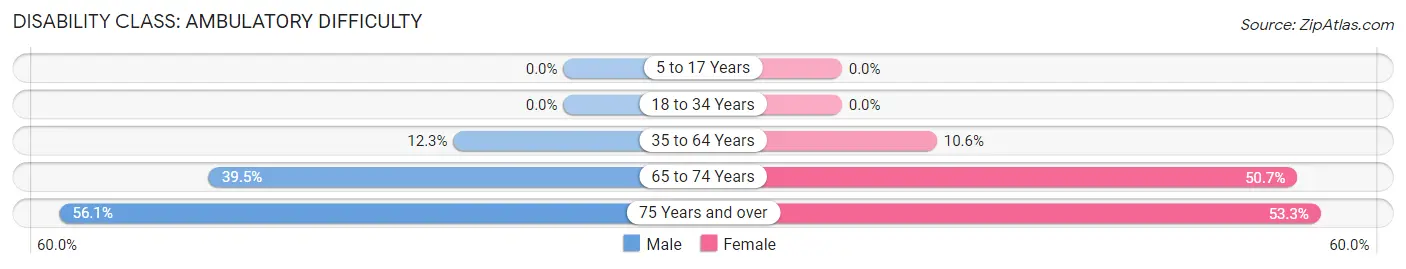
| Age Bracket | Male | Female |
| 5 to 17 Years | 0 (0.0%) | 0 (0.0%) |
| 18 to 34 Years | 0 (0.0%) | 0 (0.0%) |
| 35 to 64 Years | 37 (12.2%) | 20 (10.6%) |
| 65 to 74 Years | 15 (39.5%) | 35 (50.7%) |
| 75 Years and over | 23 (56.1%) | 48 (53.3%) |
Disability Class: Self-Care Difficulty
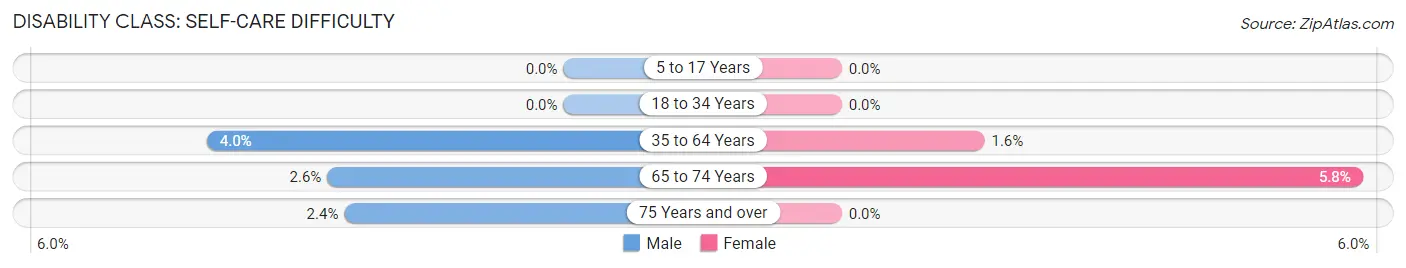
| Age Bracket | Male | Female |
| 5 to 17 Years | 0 (0.0%) | 0 (0.0%) |
| 18 to 34 Years | 0 (0.0%) | 0 (0.0%) |
| 35 to 64 Years | 12 (4.0%) | 3 (1.6%) |
| 65 to 74 Years | 1 (2.6%) | 4 (5.8%) |
| 75 Years and over | 1 (2.4%) | 0 (0.0%) |
Technology Access in Honaker
Computing Device Access in Honaker
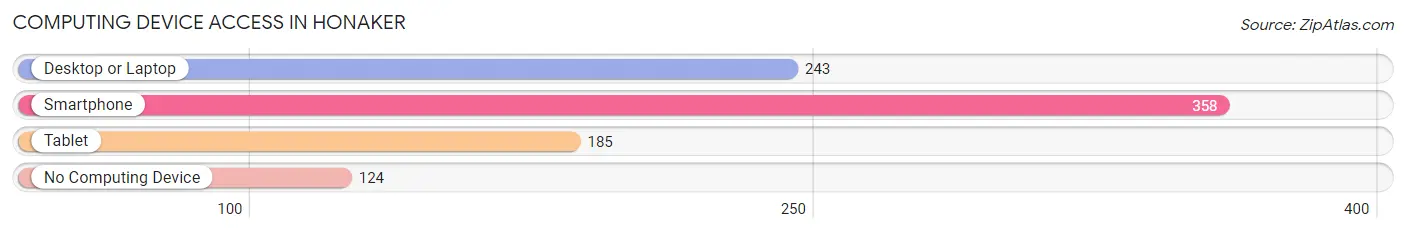
| Device Type | # Households | % Households |
| Desktop or Laptop | 243 | 48.9% |
| Smartphone | 358 | 72.0% |
| Tablet | 185 | 37.2% |
| No Computing Device | 124 | 24.9% |
| Total | 497 | 100.0% |
Internet Access in Honaker
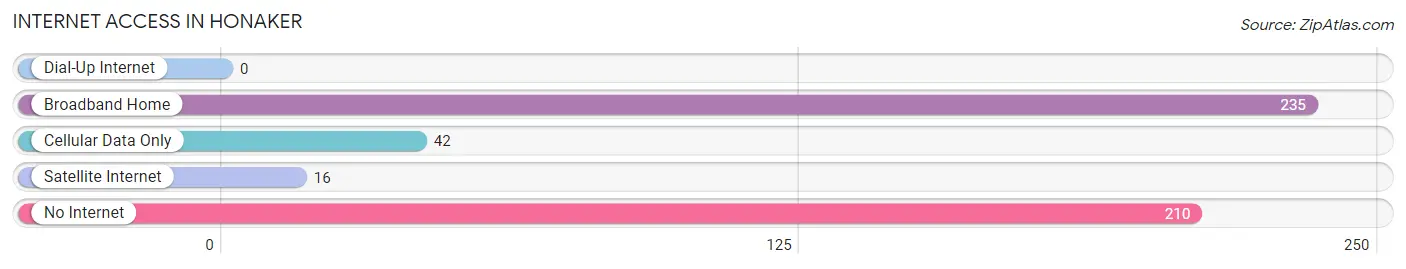
| Internet Type | # Households | % Households |
| Dial-Up Internet | 0 | 0.0% |
| Broadband Home | 235 | 47.3% |
| Cellular Data Only | 42 | 8.5% |
| Satellite Internet | 16 | 3.2% |
| No Internet | 210 | 42.2% |
| Total | 497 | 100.0% |
Honaker Summary
History
Honaker, Virginia is a small town located in Russell County, Virginia. It is situated in the Appalachian Mountains and is part of the Appalachian Plateau. The town was founded in 1883 by William Honaker, a local farmer and businessman. The town was named after him and has been a part of Russell County ever since.
Honaker has a rich history that dates back to the early 1800s. The town was originally inhabited by Native Americans, including the Cherokee, Shawnee, and Iroquois tribes. The first settlers to the area were mostly of English and German descent. The town was officially established in 1883 and was named after William Honaker.
The town grew rapidly in the late 1800s and early 1900s due to the coal mining industry. The coal industry was the main source of employment for the town’s residents. The town also had a thriving timber industry, which provided jobs for many of the town’s residents.
The town was also home to a number of businesses, including a general store, a hotel, a bank, and a post office. The town also had a number of churches, including the First Baptist Church, the Methodist Church, and the Presbyterian Church.
The town was also home to a number of schools, including the Honaker High School, which was established in 1891. The school was the first public high school in Russell County.
The town was also home to a number of other businesses, including a sawmill, a gristmill, a blacksmith shop, and a tannery. The town also had a number of other businesses, including a furniture store, a grocery store, and a drug store.
The town was also home to a number of other businesses, including a movie theater, a bowling alley, and a pool hall. The town also had a number of other businesses, including a barber shop, a beauty shop, and a shoe store.
The town was also home to a number of other businesses, including a hardware store, a dry goods store, and a clothing store. The town also had a number of other businesses, including a bakery, a butcher shop, and a grocery store.
The town was also home to a number of other businesses, including a gas station, a car dealership, and a car repair shop. The town also had a number of other businesses, including a restaurant, a hotel, and a bar.
Geography
Honaker is located in the Appalachian Mountains in Russell County, Virginia. The town is situated in the Appalachian Plateau, which is a region of the Appalachian Mountains that is characterized by rolling hills and valleys. The town is located at an elevation of 1,890 feet above sea level.
The town is located near the Clinch River, which is a tributary of the Tennessee River. The town is also located near the Appalachian Trail, which is a 2,190-mile long hiking trail that runs from Maine to Georgia.
The town is located in a temperate climate, with hot summers and cold winters. The average temperature in the summer is around 75 degrees Fahrenheit, and the average temperature in the winter is around 40 degrees Fahrenheit.
Economy
The economy of Honaker is largely based on agriculture and tourism. The town is home to a number of farms, which produce a variety of crops, including corn, soybeans, wheat, and hay. The town is also home to a number of tourist attractions, including the Honaker Historical Museum, the Honaker Railroad Museum, and the Honaker Arts and Crafts Center.
The town is also home to a number of businesses, including a grocery store, a hardware store, a drug store, a restaurant, a hotel, and a bar. The town is also home to a number of other businesses, including a car dealership, a car repair shop, a gas station, and a furniture store.
Demographics
As of the 2010 census, the population of Honaker was 1,890. The town has a population density of 5.3 people per square mile. The median age of the town’s residents is 44.7 years old.
The town is predominantly white, with 92.3% of the population identifying as white. The town also has a small African American population, with 4.2% of the population identifying as African American. The town also has a small Hispanic population, with 1.3% of the population identifying as Hispanic.
The town has a median household income of $30,938, and the median home value is $90,400. The town has a poverty rate of 17.3%, and the unemployment rate is 6.2%.
Common Questions
What is Per Capita Income in Honaker?
Per Capita income in Honaker is $24,976.
What is the Median Family Income in Honaker?
Median Family Income in Honaker is $57,273.
What is the Median Household income in Honaker?
Median Household Income in Honaker is $45,491.
What is Income or Wage Gap in Honaker?
Income or Wage Gap in Honaker is 21.3%.
Women in Honaker earn 78.7 cents for every dollar earned by a man.
What is Inequality or Gini Index in Honaker?
Inequality or Gini Index in Honaker is 0.48.
What is the Total Population of Honaker?
Total Population of Honaker is 1,213.
What is the Total Male Population of Honaker?
Total Male Population of Honaker is 610.
What is the Total Female Population of Honaker?
Total Female Population of Honaker is 603.
What is the Ratio of Males per 100 Females in Honaker?
There are 101.16 Males per 100 Females in Honaker.
What is the Ratio of Females per 100 Males in Honaker?
There are 98.85 Females per 100 Males in Honaker.
What is the Median Population Age in Honaker?
Median Population Age in Honaker is 40.7 Years.
What is the Average Family Size in Honaker
Average Family Size in Honaker is 3.5 People.
What is the Average Household Size in Honaker
Average Household Size in Honaker is 2.4 People.
How Large is the Labor Force in Honaker?
There are 464 People in the Labor Forcein in Honaker.
What is the Percentage of People in the Labor Force in Honaker?
48.1% of People are in the Labor Force in Honaker.
What is the Unemployment Rate in Honaker?
Unemployment Rate in Honaker is 3.2%.