Hiwassee, VA Map & Demographics
Hiwassee Map
Hiwassee Overview
$53,155
PER CAPITA INCOME
$66,625
AVG FAMILY INCOME
$67,778
AVG HOUSEHOLD INCOME
0.35
INEQUALITY / GINI INDEX
86
TOTAL POPULATION
54
MALE POPULATION
32
FEMALE POPULATION
168.75
MALES / 100 FEMALES
59.26
FEMALES / 100 MALES
67.1
MEDIAN AGE
2.4
AVG FAMILY SIZE
1.7
AVG HOUSEHOLD SIZE
62
LABOR FORCE [ PEOPLE ]
78.5%
PERCENT IN LABOR FORCE
27.4%
UNEMPLOYMENT RATE
Hiwassee Zip Codes
Hiwassee Area Codes
Income in Hiwassee
Income Overview in Hiwassee
Per Capita Income in Hiwassee is $53,155, while median incomes of families and households are $66,625 and $67,778 respectively.
| Characteristic | Number | Measure |
| Per Capita Income | 86 | $53,155 |
| Median Family Income | 25 | $66,625 |
| Mean Family Income | 25 | $65,792 |
| Median Household Income | 50 | $67,778 |
| Mean Household Income | 50 | $88,162 |
| Income Deficit | 25 | $0 |
| Wage / Income Gap (%) | 86 | 0.00% |
| Wage / Income Gap ($) | 86 | 100.00¢ per $1 |
| Gini / Inequality Index | 86 | 0.35 |
Earnings by Sex in Hiwassee
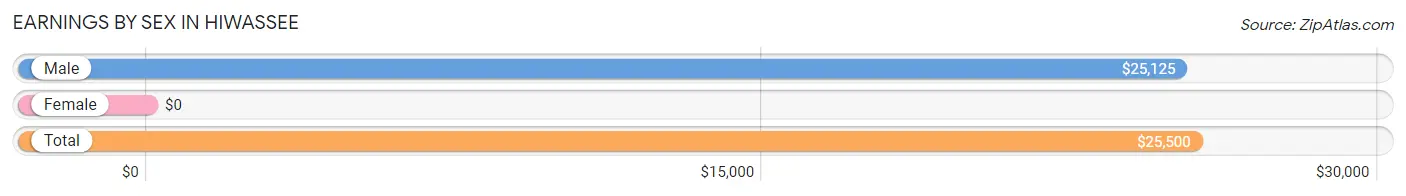
| Sex | Number | Average Earnings |
| Male | 39 (72.2%) | $25,125 |
| Female | 15 (27.8%) | $0 |
| Total | 54 (100.0%) | $25,500 |
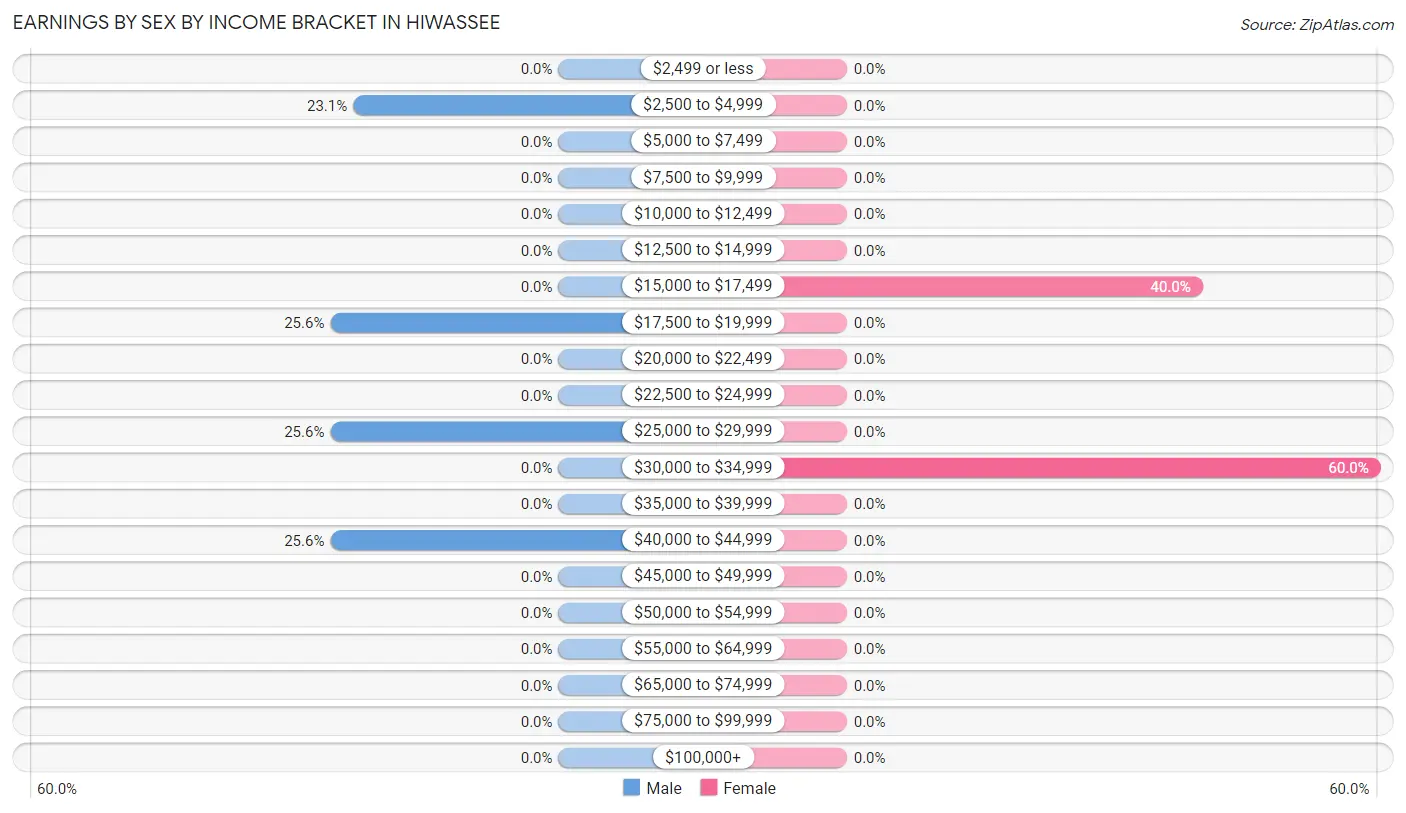
Earnings by Sex by Income Bracket in Hiwassee
The most common earnings brackets in Hiwassee are $17,500 to $19,999 for men (10 | 25.6%) and $30,000 to $34,999 for women (9 | 60.0%).
| Income | Male | Female |
| $2,499 or less | 0 (0.0%) | 0 (0.0%) |
| $2,500 to $4,999 | 9 (23.1%) | 0 (0.0%) |
| $5,000 to $7,499 | 0 (0.0%) | 0 (0.0%) |
| $7,500 to $9,999 | 0 (0.0%) | 0 (0.0%) |
| $10,000 to $12,499 | 0 (0.0%) | 0 (0.0%) |
| $12,500 to $14,999 | 0 (0.0%) | 0 (0.0%) |
| $15,000 to $17,499 | 0 (0.0%) | 6 (40.0%) |
| $17,500 to $19,999 | 10 (25.6%) | 0 (0.0%) |
| $20,000 to $22,499 | 0 (0.0%) | 0 (0.0%) |
| $22,500 to $24,999 | 0 (0.0%) | 0 (0.0%) |
| $25,000 to $29,999 | 10 (25.6%) | 0 (0.0%) |
| $30,000 to $34,999 | 0 (0.0%) | 9 (60.0%) |
| $35,000 to $39,999 | 0 (0.0%) | 0 (0.0%) |
| $40,000 to $44,999 | 10 (25.6%) | 0 (0.0%) |
| $45,000 to $49,999 | 0 (0.0%) | 0 (0.0%) |
| $50,000 to $54,999 | 0 (0.0%) | 0 (0.0%) |
| $55,000 to $64,999 | 0 (0.0%) | 0 (0.0%) |
| $65,000 to $74,999 | 0 (0.0%) | 0 (0.0%) |
| $75,000 to $99,999 | 0 (0.0%) | 0 (0.0%) |
| $100,000+ | 0 (0.0%) | 0 (0.0%) |
| Total | 39 (100.0%) | 15 (100.0%) |
Earnings by Sex by Educational Attainment in Hiwassee
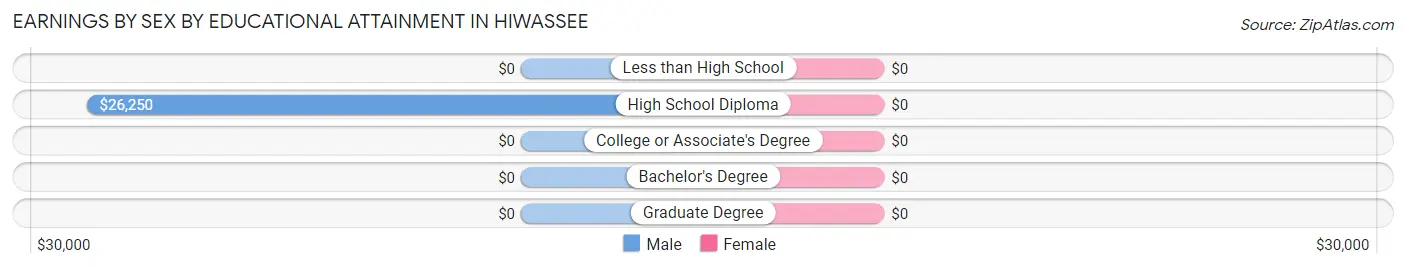
| Educational Attainment | Male Income | Female Income |
| Less than High School | - | - |
| High School Diploma | $26,250 | $0 |
| College or Associate's Degree | - | - |
| Bachelor's Degree | - | - |
| Graduate Degree | - | - |
| Total | $25,125 | $0 |
Family Income in Hiwassee
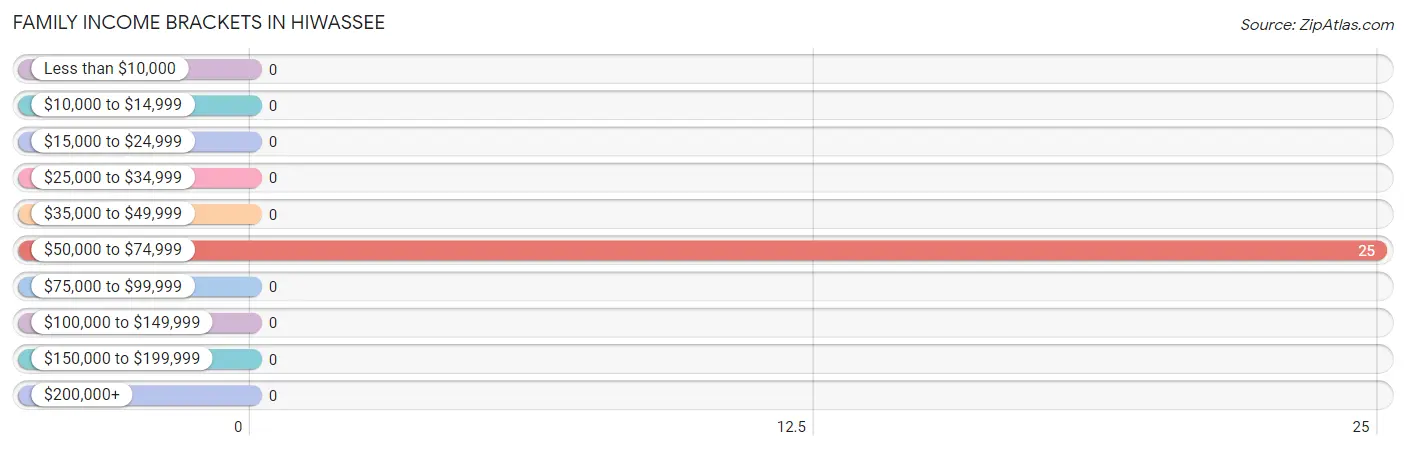
Family Income Brackets in Hiwassee
According to the Hiwassee family income data, there are 25 families falling into the $50,000 to $74,999 income range, which is the most common income bracket and makes up 100.0% of all families.
| Income Bracket | # Families | % Families |
| Less than $10,000 | 0 | 0.0% |
| $10,000 to $14,999 | 0 | 0.0% |
| $15,000 to $24,999 | 0 | 0.0% |
| $25,000 to $34,999 | 0 | 0.0% |
| $35,000 to $49,999 | 0 | 0.0% |
| $50,000 to $74,999 | 25 | 100.0% |
| $75,000 to $99,999 | 0 | 0.0% |
| $100,000 to $149,999 | 0 | 0.0% |
| $150,000 to $199,999 | 0 | 0.0% |
| $200,000+ | 0 | 0.0% |
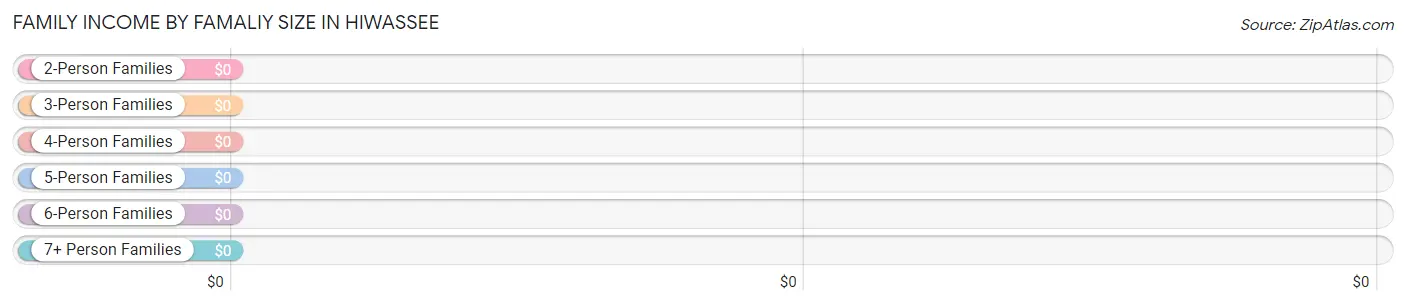
Family Income by Famaliy Size in Hiwassee
| Income Bracket | # Families | Median Income |
| 2-Person Families | 19 (76.0%) | $0 |
| 3-Person Families | 6 (24.0%) | $0 |
| 4-Person Families | 0 (0.0%) | $0 |
| 5-Person Families | 0 (0.0%) | $0 |
| 6-Person Families | 0 (0.0%) | $0 |
| 7+ Person Families | 0 (0.0%) | $0 |
| Total | 25 (100.0%) | $66,625 |
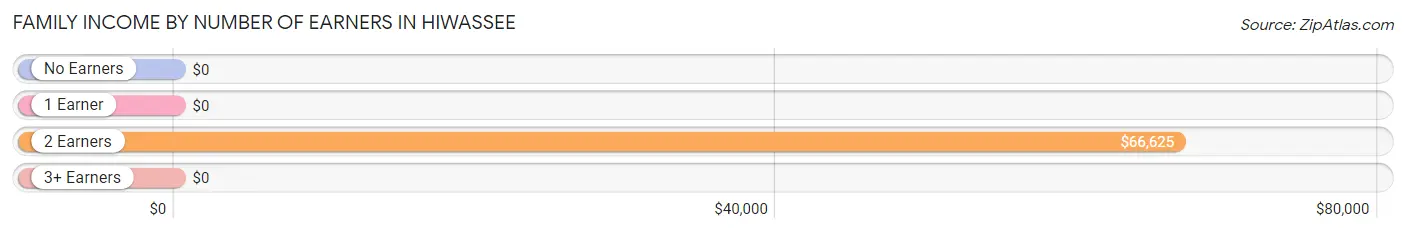
Family Income by Number of Earners in Hiwassee
| Number of Earners | # Families | Median Income |
| No Earners | 0 (0.0%) | $0 |
| 1 Earner | 0 (0.0%) | $0 |
| 2 Earners | 25 (100.0%) | $66,625 |
| 3+ Earners | 0 (0.0%) | $0 |
| Total | 25 (100.0%) | $66,625 |
Household Income in Hiwassee
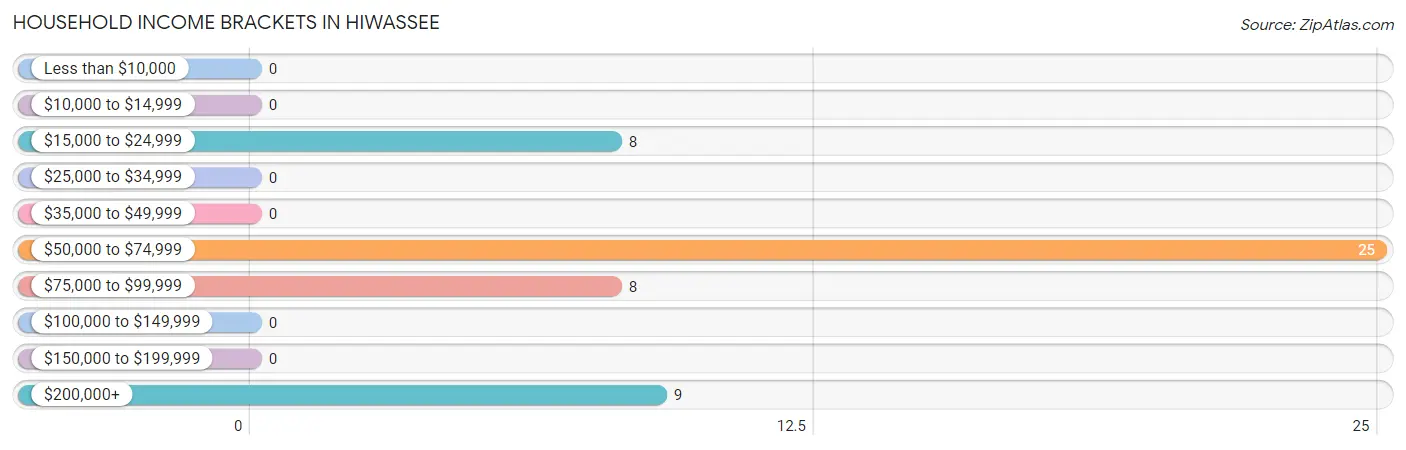
Household Income Brackets in Hiwassee
With 25 households falling in the category, the $50,000 to $74,999 income range is the most frequent in Hiwassee, accounting for 50.0% of all households.
| Income Bracket | # Households | % Households |
| Less than $10,000 | 0 | 0.0% |
| $10,000 to $14,999 | 0 | 0.0% |
| $15,000 to $24,999 | 8 | 16.0% |
| $25,000 to $34,999 | 0 | 0.0% |
| $35,000 to $49,999 | 0 | 0.0% |
| $50,000 to $74,999 | 25 | 50.0% |
| $75,000 to $99,999 | 8 | 16.0% |
| $100,000 to $149,999 | 0 | 0.0% |
| $150,000 to $199,999 | 0 | 0.0% |
| $200,000+ | 9 | 18.0% |
Household Income by Householder Age in Hiwassee
The median household income in Hiwassee is $67,778, with the highest median household income of $67,375 found in the 65+ years age bracket for the primary householder. A total of 35 households (70.0%) fall into this category.
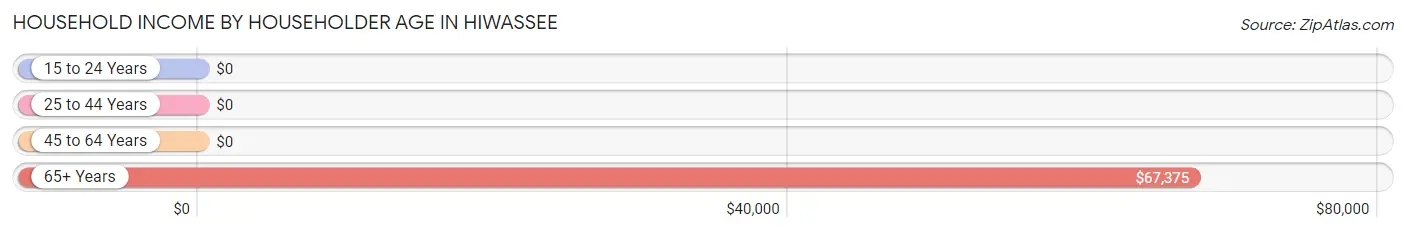
| Income Bracket | # Households | Median Income |
| 15 to 24 Years | 0 (0.0%) | $0 |
| 25 to 44 Years | 0 (0.0%) | $0 |
| 45 to 64 Years | 15 (30.0%) | $0 |
| 65+ Years | 35 (70.0%) | $67,375 |
| Total | 50 (100.0%) | $67,778 |
Poverty in Hiwassee
Income Below Poverty by Sex and Age in Hiwassee
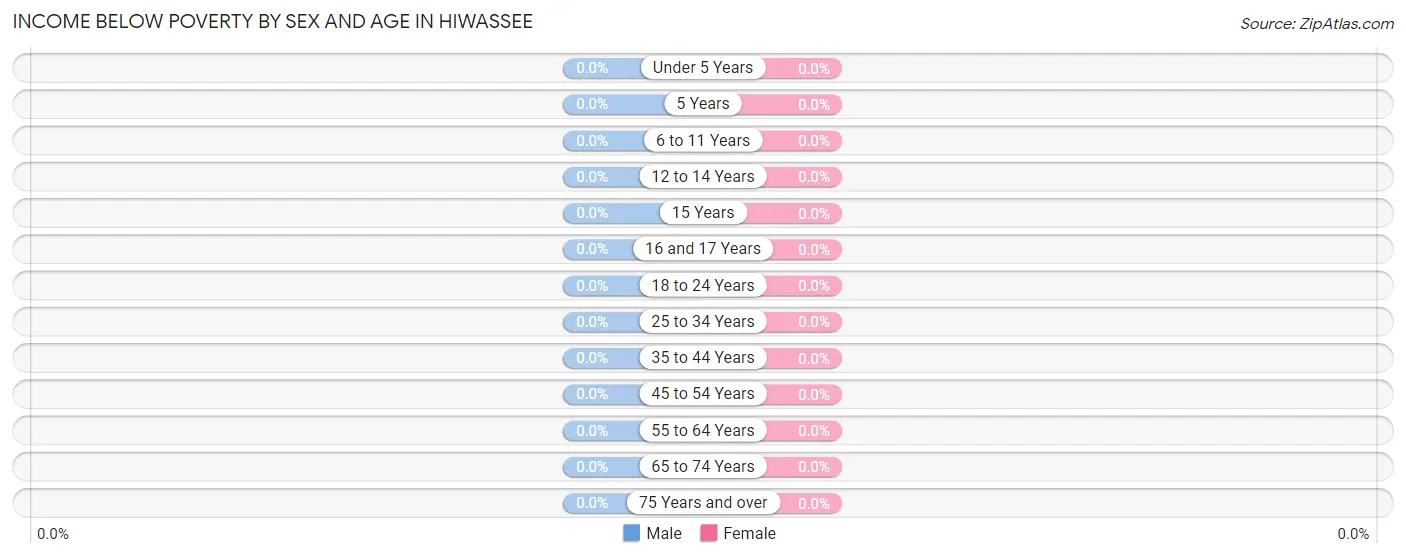
| Age Bracket | Male | Female |
| Under 5 Years | 0 (0.0%) | 0 (0.0%) |
| 5 Years | 0 (0.0%) | 0 (0.0%) |
| 6 to 11 Years | 0 (0.0%) | 0 (0.0%) |
| 12 to 14 Years | 0 (0.0%) | 0 (0.0%) |
| 15 Years | 0 (0.0%) | 0 (0.0%) |
| 16 and 17 Years | 0 (0.0%) | 0 (0.0%) |
| 18 to 24 Years | 0 (0.0%) | 0 (0.0%) |
| 25 to 34 Years | 0 (0.0%) | 0 (0.0%) |
| 35 to 44 Years | 0 (0.0%) | 0 (0.0%) |
| 45 to 54 Years | 0 (0.0%) | 0 (0.0%) |
| 55 to 64 Years | 0 (0.0%) | 0 (0.0%) |
| 65 to 74 Years | 0 (0.0%) | 0 (0.0%) |
| 75 Years and over | 0 (0.0%) | 0 (0.0%) |
| Total | 0 (0.0%) | 0 (0.0%) |
Income Above Poverty by Sex and Age in Hiwassee
According to the poverty statistics in Hiwassee, males aged 6 to 11 years and females aged 45 to 54 years are the age groups that are most secure financially, with 100.0% of males and 100.0% of females in these age groups living above the poverty line.
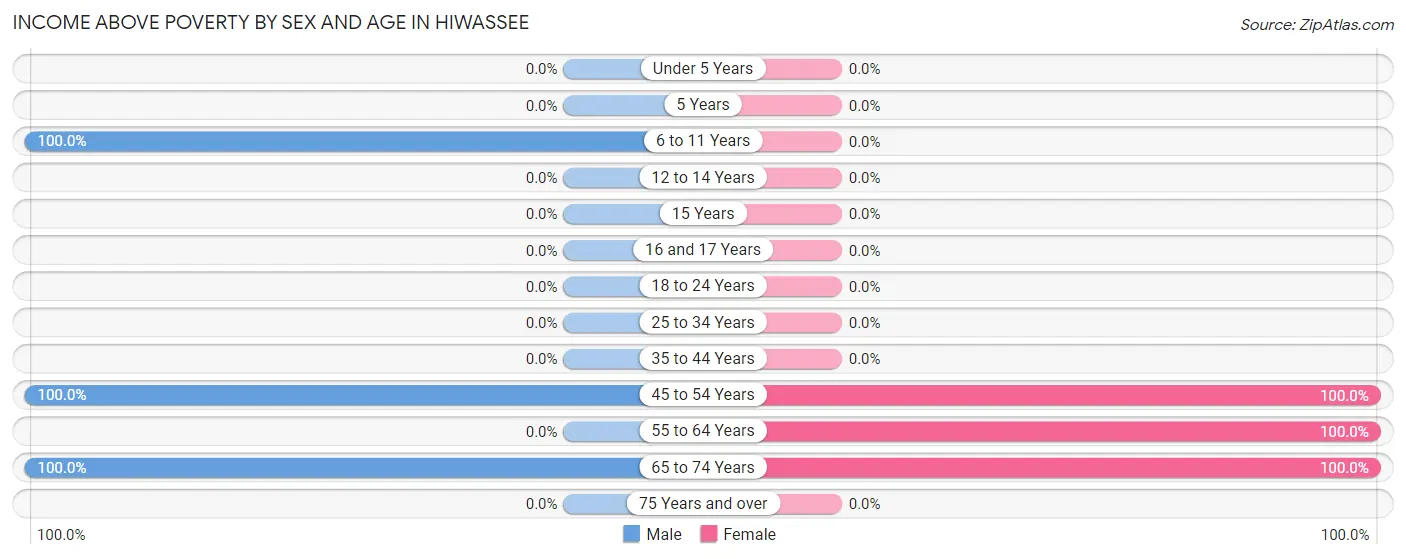
| Age Bracket | Male | Female |
| Under 5 Years | 0 (0.0%) | 0 (0.0%) |
| 5 Years | 0 (0.0%) | 0 (0.0%) |
| 6 to 11 Years | 7 (100.0%) | 0 (0.0%) |
| 12 to 14 Years | 0 (0.0%) | 0 (0.0%) |
| 15 Years | 0 (0.0%) | 0 (0.0%) |
| 16 and 17 Years | 0 (0.0%) | 0 (0.0%) |
| 18 to 24 Years | 0 (0.0%) | 0 (0.0%) |
| 25 to 34 Years | 0 (0.0%) | 0 (0.0%) |
| 35 to 44 Years | 0 (0.0%) | 0 (0.0%) |
| 45 to 54 Years | 20 (100.0%) | 6 (100.0%) |
| 55 to 64 Years | 0 (0.0%) | 9 (100.0%) |
| 65 to 74 Years | 27 (100.0%) | 17 (100.0%) |
| 75 Years and over | 0 (0.0%) | 0 (0.0%) |
| Total | 54 (100.0%) | 32 (100.0%) |
Income Below Poverty Among Married-Couple Families in Hiwassee
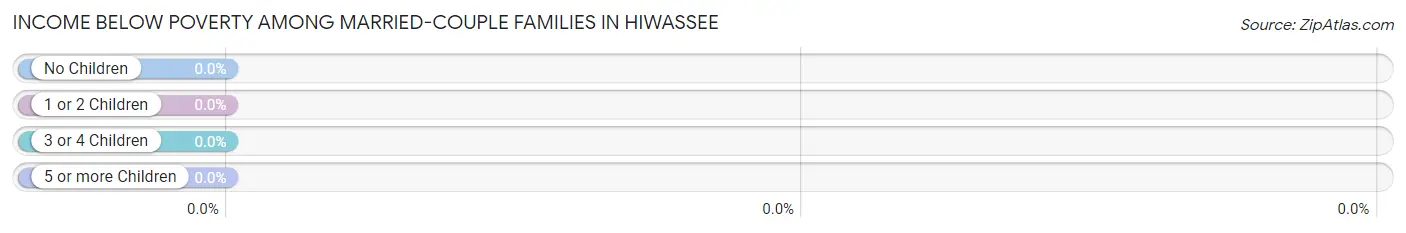
| Children | Above Poverty | Below Poverty |
| No Children | 9 (100.0%) | 0 (0.0%) |
| 1 or 2 Children | 0 (0.0%) | 0 (0.0%) |
| 3 or 4 Children | 0 (0.0%) | 0 (0.0%) |
| 5 or more Children | 0 (0.0%) | 0 (0.0%) |
| Total | 9 (100.0%) | 0 (0.0%) |
Income Below Poverty Among Single-Parent Households in Hiwassee
| Children | Single Father | Single Mother |
| No Children | 0 (0.0%) | 0 (0.0%) |
| 1 or 2 Children | 0 (0.0%) | 0 (0.0%) |
| 3 or 4 Children | 0 (0.0%) | 0 (0.0%) |
| 5 or more Children | 0 (0.0%) | 0 (0.0%) |
| Total | 0 (0.0%) | 0 (0.0%) |
Income Below Poverty Among Married-Couple vs Single-Parent Households in Hiwassee
| Children | Married-Couple Families | Single-Parent Households |
| No Children | 0 (0.0%) | 0 (0.0%) |
| 1 or 2 Children | 0 (0.0%) | 0 (0.0%) |
| 3 or 4 Children | 0 (0.0%) | 0 (0.0%) |
| 5 or more Children | 0 (0.0%) | 0 (0.0%) |
| Total | 0 (0.0%) | 0 (0.0%) |
Race in Hiwassee
The most populous races in Hiwassee are , and White / Caucasian (86 | 100.0%).
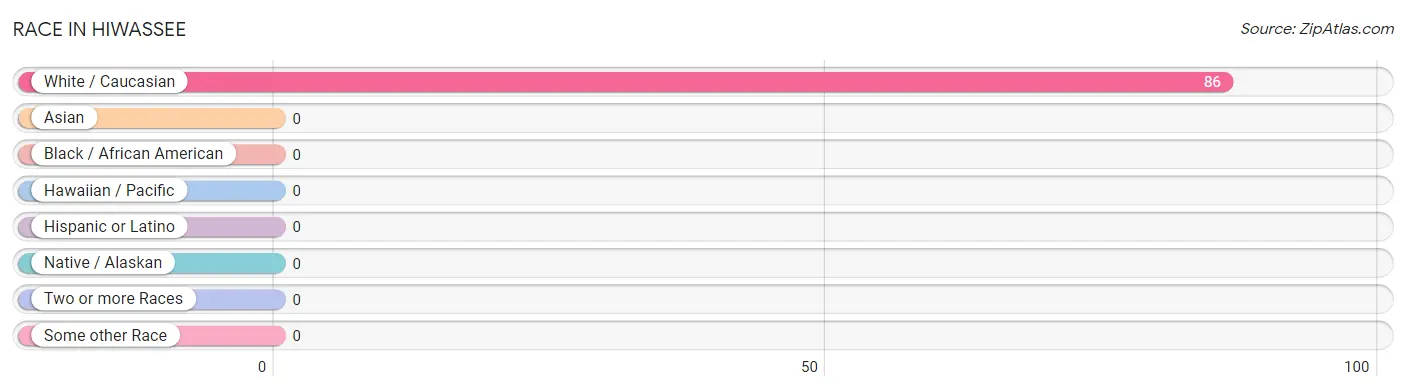
| Race | # Population | % Population |
| Asian | 0 | 0.0% |
| Black / African American | 0 | 0.0% |
| Hawaiian / Pacific | 0 | 0.0% |
| Hispanic or Latino | 0 | 0.0% |
| Native / Alaskan | 0 | 0.0% |
| White / Caucasian | 86 | 100.0% |
| Two or more Races | 0 | 0.0% |
| Some other Race | 0 | 0.0% |
| Total | 86 | 100.0% |
Ancestry in Hiwassee
The most populous ancestries reported in Hiwassee are American (29 | 33.7%), Scottish (16 | 18.6%), English (9 | 10.5%), German (9 | 10.5%), and French Canadian (8 | 9.3%), together accounting for 82.6% of all Hiwassee residents.
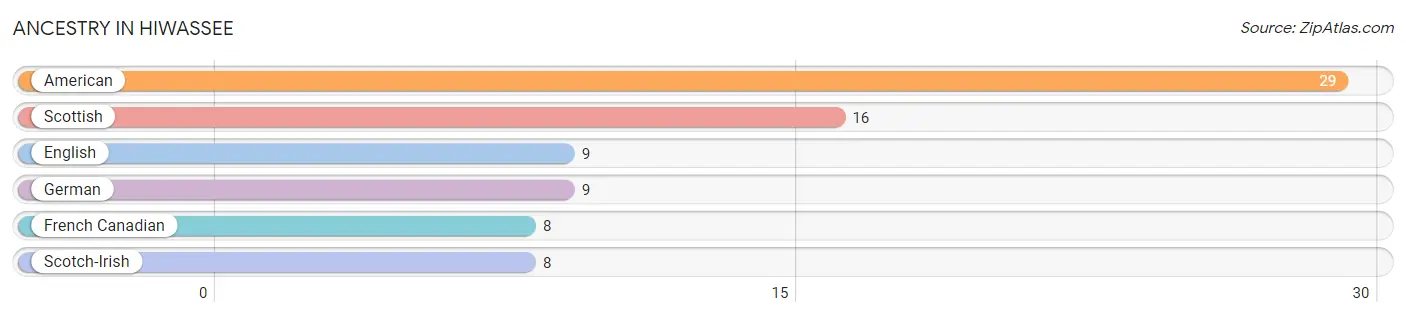
| Ancestry | # Population | % Population |
| American | 29 | 33.7% |
| English | 9 | 10.5% |
| French Canadian | 8 | 9.3% |
| German | 9 | 10.5% |
| Scotch-Irish | 8 | 9.3% |
| Scottish | 16 | 18.6% | View All 6 Rows |
Immigrants in Hiwassee

| Immigration Origin | # Population | % Population | View All 0 Rows |
Sex and Age in Hiwassee
Sex and Age in Hiwassee
The most populous age groups in Hiwassee are 70 to 74 Years (17 | 31.5%) for men and 70 to 74 Years (17 | 53.1%) for women.
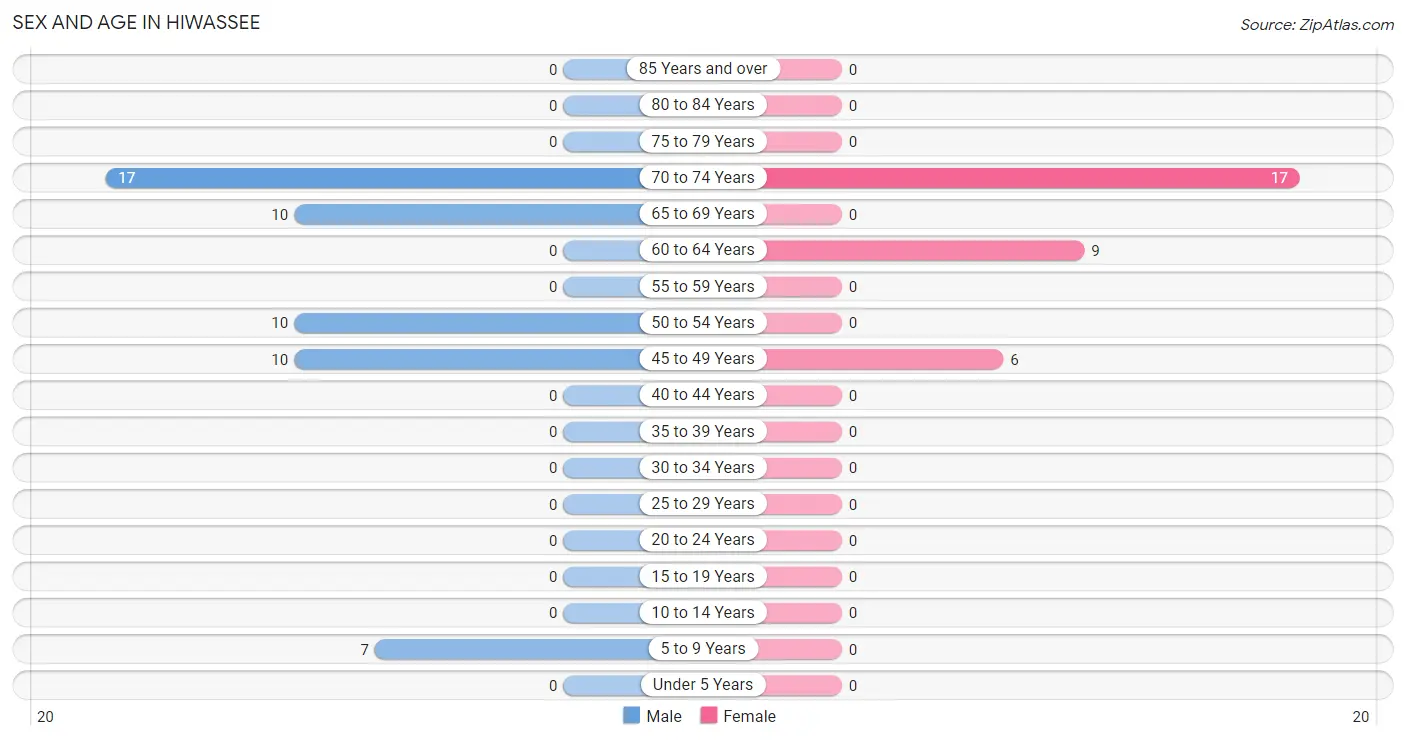
| Age Bracket | Male | Female |
| Under 5 Years | 0 (0.0%) | 0 (0.0%) |
| 5 to 9 Years | 7 (13.0%) | 0 (0.0%) |
| 10 to 14 Years | 0 (0.0%) | 0 (0.0%) |
| 15 to 19 Years | 0 (0.0%) | 0 (0.0%) |
| 20 to 24 Years | 0 (0.0%) | 0 (0.0%) |
| 25 to 29 Years | 0 (0.0%) | 0 (0.0%) |
| 30 to 34 Years | 0 (0.0%) | 0 (0.0%) |
| 35 to 39 Years | 0 (0.0%) | 0 (0.0%) |
| 40 to 44 Years | 0 (0.0%) | 0 (0.0%) |
| 45 to 49 Years | 10 (18.5%) | 6 (18.8%) |
| 50 to 54 Years | 10 (18.5%) | 0 (0.0%) |
| 55 to 59 Years | 0 (0.0%) | 0 (0.0%) |
| 60 to 64 Years | 0 (0.0%) | 9 (28.1%) |
| 65 to 69 Years | 10 (18.5%) | 0 (0.0%) |
| 70 to 74 Years | 17 (31.5%) | 17 (53.1%) |
| 75 to 79 Years | 0 (0.0%) | 0 (0.0%) |
| 80 to 84 Years | 0 (0.0%) | 0 (0.0%) |
| 85 Years and over | 0 (0.0%) | 0 (0.0%) |
| Total | 54 (100.0%) | 32 (100.0%) |
Families and Households in Hiwassee
Median Family Size in Hiwassee
The median family size in Hiwassee is 2.44 persons per family, with single female/mother families (6 | 24.0%) accounting for the largest median family size of 3.83 persons per family. On the other hand, married-couple families (9 | 36.0%) represent the smallest median family size with 2.00 persons per family.
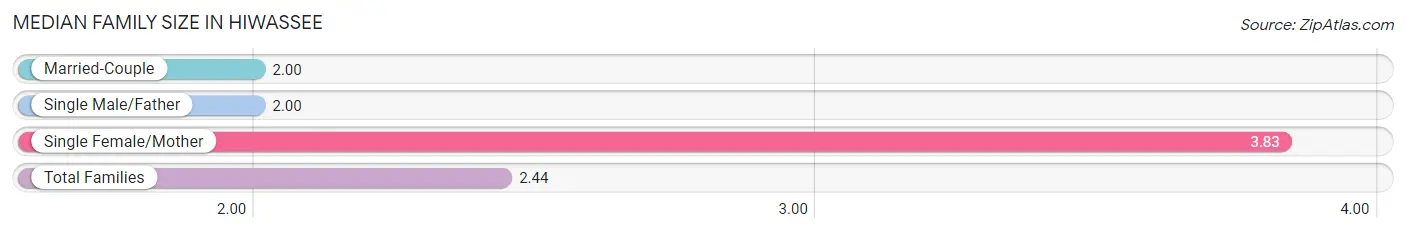
| Family Type | # Families | Family Size |
| Married-Couple | 9 (36.0%) | 2.00 |
| Single Male/Father | 10 (40.0%) | 2.00 |
| Single Female/Mother | 6 (24.0%) | 3.83 |
| Total Families | 25 (100.0%) | 2.44 |
Median Household Size in Hiwassee
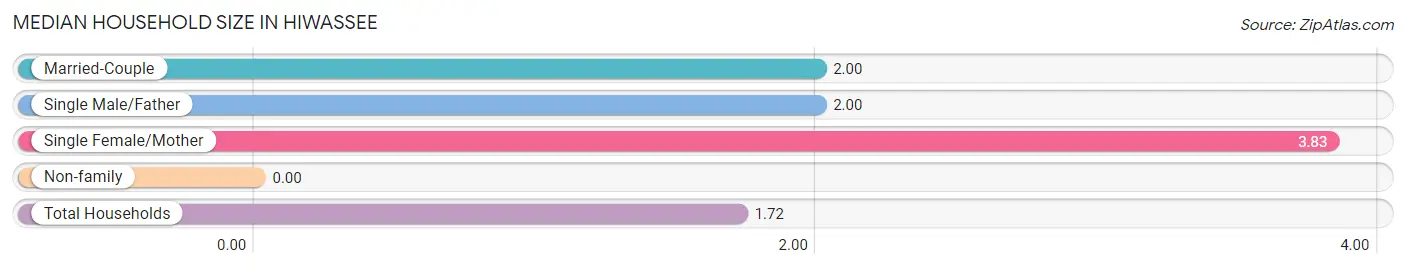
| Household Type | # Households | Household Size |
| Married-Couple | 9 (18.0%) | 2.00 |
| Single Male/Father | 10 (20.0%) | 2.00 |
| Single Female/Mother | 6 (12.0%) | 3.83 |
| Non-family | 25 (50.0%) | - |
| Total Households | 50 (100.0%) | 1.72 |
Household Size by Marriage Status in Hiwassee
Out of a total of 50 households in Hiwassee, 25 (50.0%) are family households, while 25 (50.0%) are nonfamily households. The most numerous type of family households are 2-person households, comprising 19, and the most common type of nonfamily households are 1-person households, comprising 25.
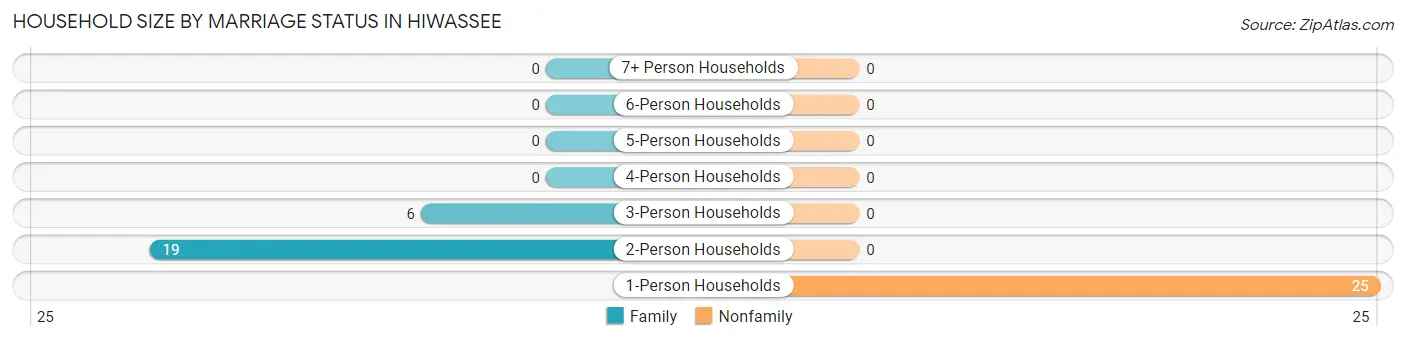
| Household Size | Family Households | Nonfamily Households |
| 1-Person Households | - | 25 (50.0%) |
| 2-Person Households | 19 (38.0%) | 0 (0.0%) |
| 3-Person Households | 6 (12.0%) | 0 (0.0%) |
| 4-Person Households | 0 (0.0%) | 0 (0.0%) |
| 5-Person Households | 0 (0.0%) | 0 (0.0%) |
| 6-Person Households | 0 (0.0%) | 0 (0.0%) |
| 7+ Person Households | 0 (0.0%) | 0 (0.0%) |
| Total | 25 (50.0%) | 25 (50.0%) |
Female Fertility in Hiwassee
Fertility by Age in Hiwassee
| Age Bracket | Women with Births | Births / 1,000 Women |
| 15 to 19 years | 0 (0.0%) | 0.0 |
| 20 to 34 years | 0 (0.0%) | 0.0 |
| 35 to 50 years | 0 (0.0%) | 0.0 |
| Total | 0 (0.0%) | 0.0 |
Fertility by Age by Marriage Status in Hiwassee
| Age Bracket | Married | Unmarried |
| 15 to 19 years | 0 (0.0%) | 0 (0.0%) |
| 20 to 34 years | 0 (0.0%) | 0 (0.0%) |
| 35 to 50 years | 0 (0.0%) | 0 (0.0%) |
| Total | 0 (0.0%) | 0 (0.0%) |
Fertility by Education in Hiwassee
| Educational Attainment | Women with Births | Births / 1,000 Women |
| Less than High School | 0 (0.0%) | 0.0 |
| High School Diploma | 0 (0.0%) | 0.0 |
| College or Associate's Degree | 0 (0.0%) | 0.0 |
| Bachelor's Degree | 0 (0.0%) | 0.0 |
| Graduate Degree | 0 (0.0%) | 0.0 |
| Total | 0 (0.0%) | 0.0 |
Fertility by Education by Marriage Status in Hiwassee
| Educational Attainment | Married | Unmarried |
| Less than High School | 0 (0.0%) | 0 (0.0%) |
| High School Diploma | 0 (0.0%) | 0 (0.0%) |
| College or Associate's Degree | 0 (0.0%) | 0 (0.0%) |
| Bachelor's Degree | 0 (0.0%) | 0 (0.0%) |
| Graduate Degree | 0 (0.0%) | 0 (0.0%) |
| Total | 0 (0.0%) | 0 (0.0%) |
Employment Characteristics in Hiwassee
Employment by Class of Employer in Hiwassee
Among the 45 employed individuals in Hiwassee, private company employees (26 | 57.8%), and self-employed (not incorporated) (19 | 42.2%) make up the most common classes of employment.
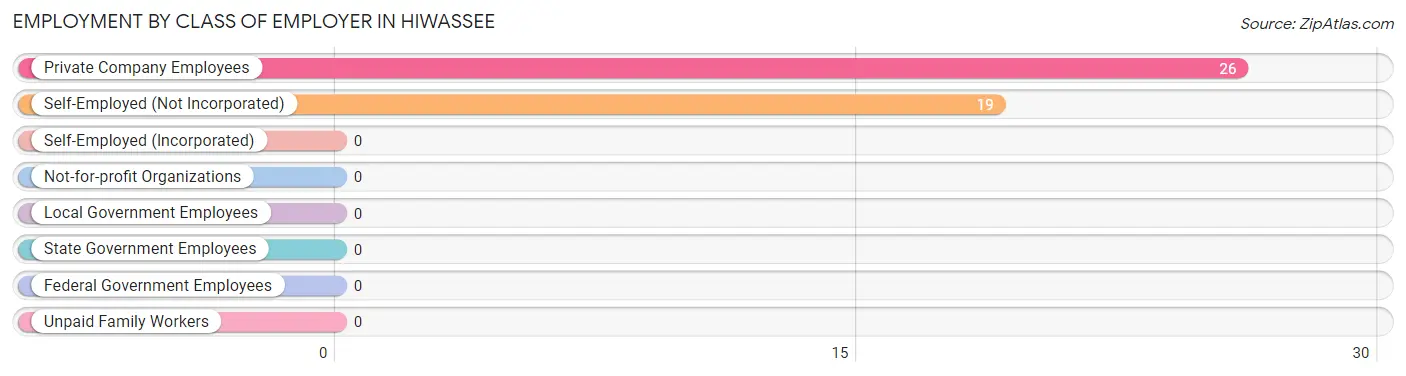
| Employer Class | # Employees | % Employees |
| Private Company Employees | 26 | 57.8% |
| Self-Employed (Incorporated) | 0 | 0.0% |
| Self-Employed (Not Incorporated) | 19 | 42.2% |
| Not-for-profit Organizations | 0 | 0.0% |
| Local Government Employees | 0 | 0.0% |
| State Government Employees | 0 | 0.0% |
| Federal Government Employees | 0 | 0.0% |
| Unpaid Family Workers | 0 | 0.0% |
| Total | 45 | 100.0% |
Employment Status by Age in Hiwassee
According to the labor force statistics for Hiwassee, out of the total population over 16 years of age (79), 78.5% or 62 individuals are in the labor force, with 27.4% or 17 of them unemployed. The age group with the highest labor force participation rate is 45 to 54 years, with 100.0% or 26 individuals in the labor force. Within the labor force, the 65 to 74 years age range has the highest percentage of unemployed individuals, with 47.2% or 17 of them being unemployed.
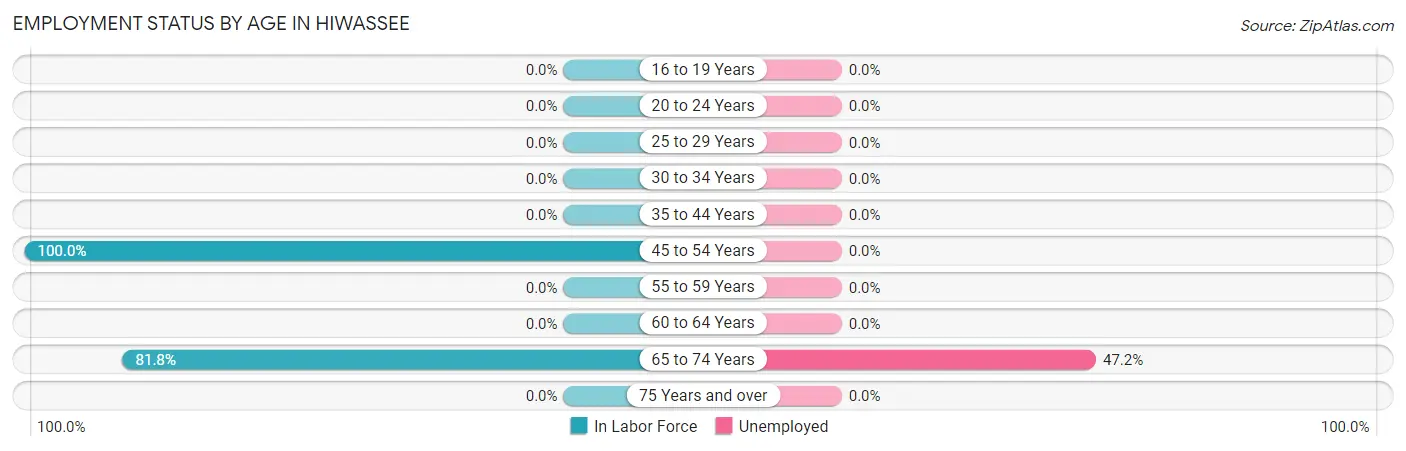
| Age Bracket | In Labor Force | Unemployed |
| 16 to 19 Years | 0 (0.0%) | 0 (0.0%) |
| 20 to 24 Years | 0 (0.0%) | 0 (0.0%) |
| 25 to 29 Years | 0 (0.0%) | 0 (0.0%) |
| 30 to 34 Years | 0 (0.0%) | 0 (0.0%) |
| 35 to 44 Years | 0 (0.0%) | 0 (0.0%) |
| 45 to 54 Years | 26 (100.0%) | 0 (0.0%) |
| 55 to 59 Years | 0 (0.0%) | 0 (0.0%) |
| 60 to 64 Years | 0 (0.0%) | 0 (0.0%) |
| 65 to 74 Years | 36 (81.8%) | 17 (47.2%) |
| 75 Years and over | 0 (0.0%) | 0 (0.0%) |
| Total | 62 (78.5%) | 17 (27.4%) |
Employment Status by Educational Attainment in Hiwassee
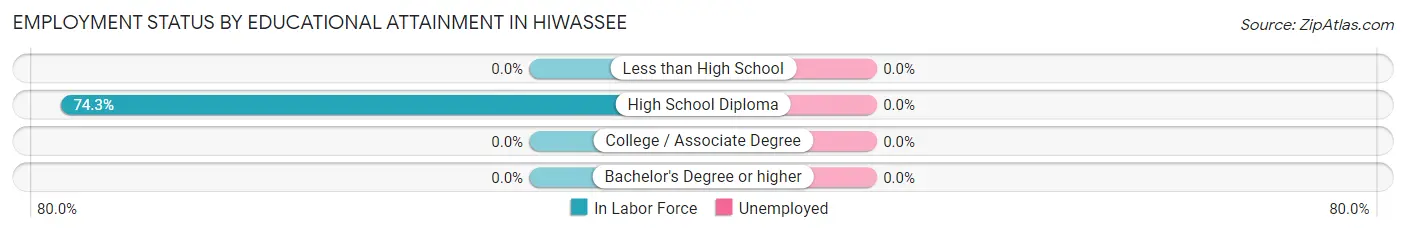
| Educational Attainment | In Labor Force | Unemployed |
| Less than High School | 0 (0.0%) | 0 (0.0%) |
| High School Diploma | 26 (74.3%) | 0 (0.0%) |
| College / Associate Degree | 0 (0.0%) | 0 (0.0%) |
| Bachelor's Degree or higher | 0 (0.0%) | 0 (0.0%) |
| Total | 26 (74.3%) | 0 (0.0%) |
Employment Occupations by Sex in Hiwassee
Management, Business, Science and Arts Occupations
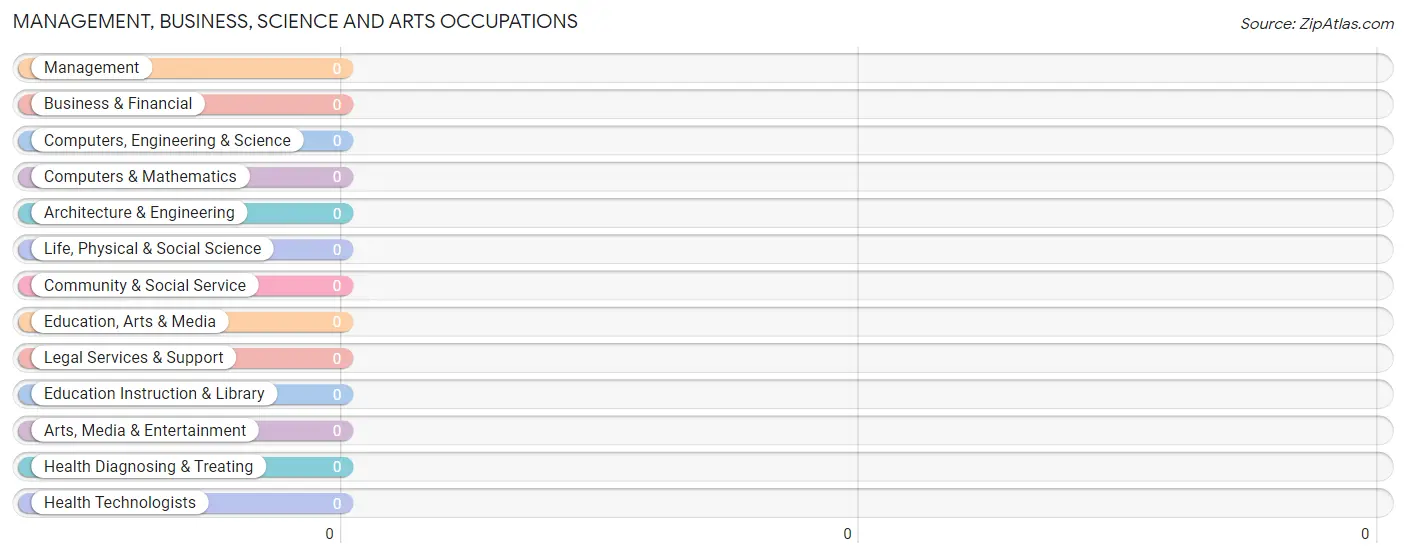
Management, Business, Science and Arts Occupations by Sex
| Occupation | Male | Female |
| Management | 0 (0.0%) | 0 (0.0%) |
| Business & Financial | 0 (0.0%) | 0 (0.0%) |
| Computers, Engineering & Science | 0 (0.0%) | 0 (0.0%) |
| Computers & Mathematics | 0 (0.0%) | 0 (0.0%) |
| Architecture & Engineering | 0 (0.0%) | 0 (0.0%) |
| Life, Physical & Social Science | 0 (0.0%) | 0 (0.0%) |
| Community & Social Service | 0 (0.0%) | 0 (0.0%) |
| Education, Arts & Media | 0 (0.0%) | 0 (0.0%) |
| Legal Services & Support | 0 (0.0%) | 0 (0.0%) |
| Education Instruction & Library | 0 (0.0%) | 0 (0.0%) |
| Arts, Media & Entertainment | 0 (0.0%) | 0 (0.0%) |
| Health Diagnosing & Treating | 0 (0.0%) | 0 (0.0%) |
| Health Technologists | 0 (0.0%) | 0 (0.0%) |
| Total (Category) | 0 (0.0%) | 0 (0.0%) |
| Total (Overall) | 30 (66.7%) | 15 (33.3%) |
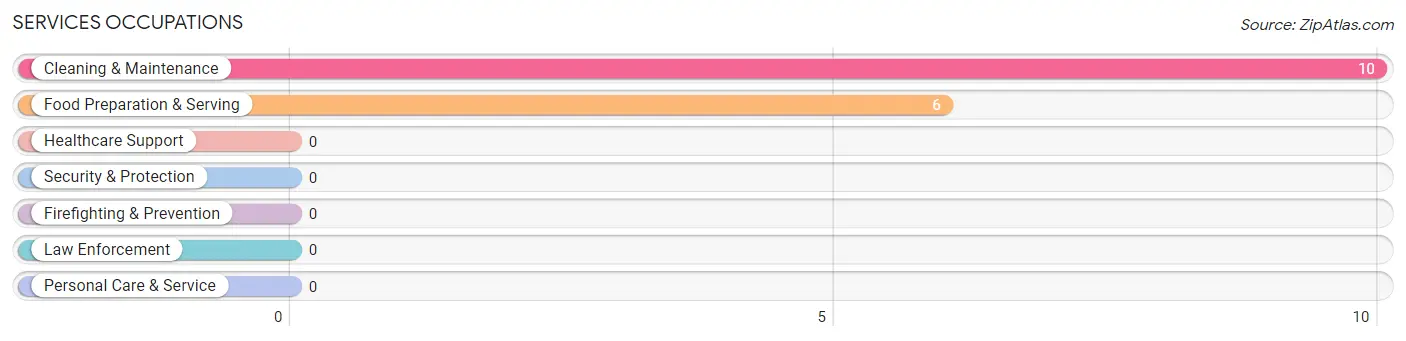
Services Occupations
The most common Services occupations in Hiwassee are Cleaning & Maintenance (10 | 22.2%), and Food Preparation & Serving (6 | 13.3%).
Services Occupations by Sex
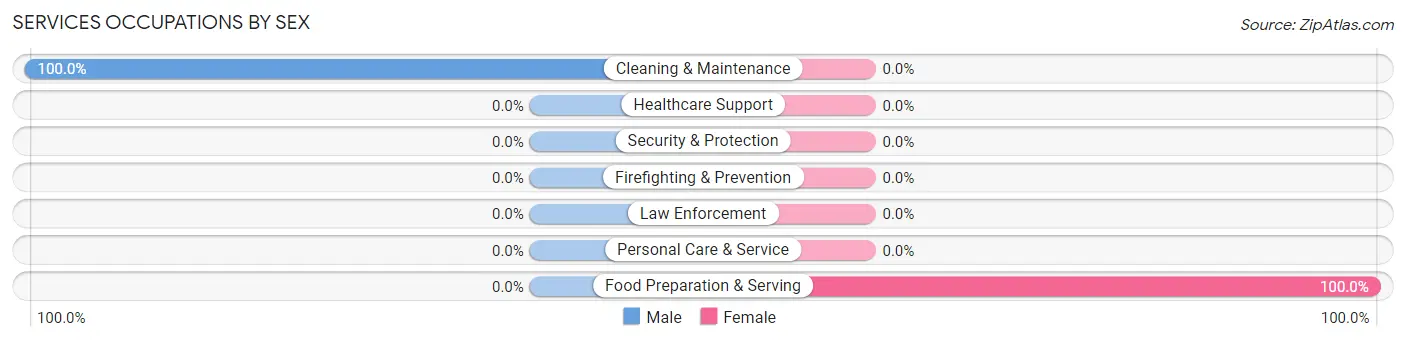
| Occupation | Male | Female |
| Healthcare Support | 0 (0.0%) | 0 (0.0%) |
| Security & Protection | 0 (0.0%) | 0 (0.0%) |
| Firefighting & Prevention | 0 (0.0%) | 0 (0.0%) |
| Law Enforcement | 0 (0.0%) | 0 (0.0%) |
| Food Preparation & Serving | 0 (0.0%) | 6 (100.0%) |
| Cleaning & Maintenance | 10 (100.0%) | 0 (0.0%) |
| Personal Care & Service | 0 (0.0%) | 0 (0.0%) |
| Total (Category) | 10 (62.5%) | 6 (37.5%) |
| Total (Overall) | 30 (66.7%) | 15 (33.3%) |
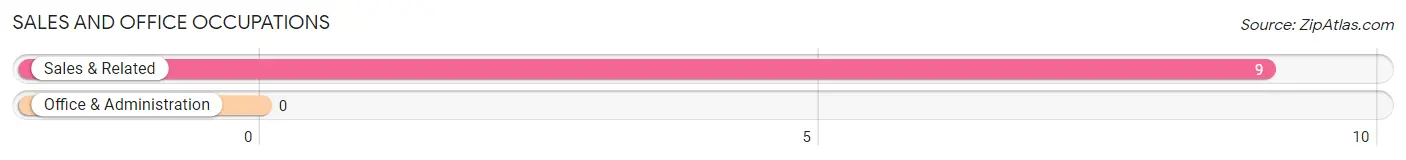
Sales and Office Occupations
The most common Sales and Office occupations in Hiwassee are , and Sales & Related (9 | 20.0%).
Sales and Office Occupations by Sex
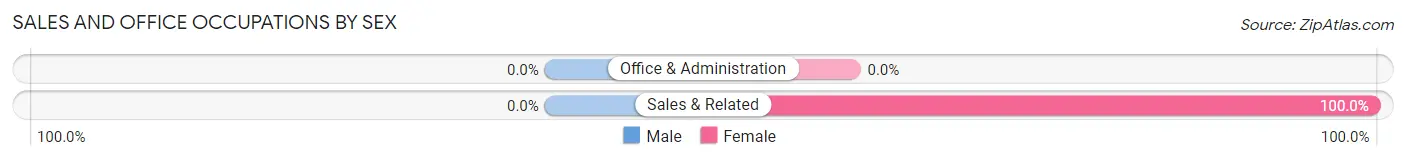
| Occupation | Male | Female |
| Sales & Related | 0 (0.0%) | 9 (100.0%) |
| Office & Administration | 0 (0.0%) | 0 (0.0%) |
| Total (Category) | 0 (0.0%) | 9 (100.0%) |
| Total (Overall) | 30 (66.7%) | 15 (33.3%) |
Natural Resources, Construction and Maintenance Occupations
The most common Natural Resources, Construction and Maintenance occupations in Hiwassee are Construction & Extraction (10 | 22.2%), and Installation, Maintenance & Repair (10 | 22.2%).
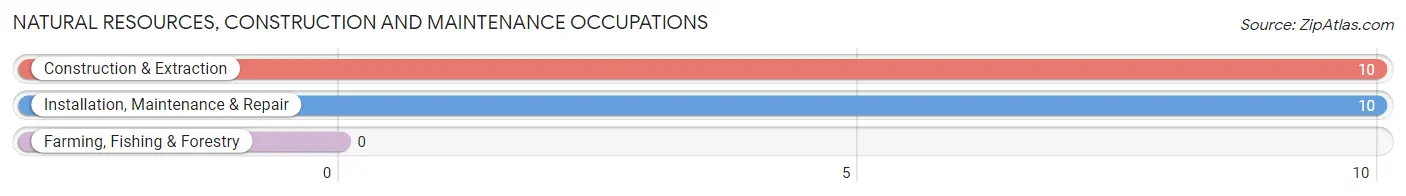
Natural Resources, Construction and Maintenance Occupations by Sex
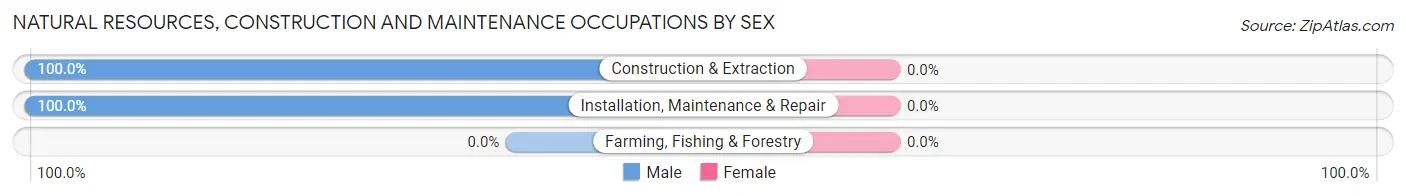
| Occupation | Male | Female |
| Farming, Fishing & Forestry | 0 (0.0%) | 0 (0.0%) |
| Construction & Extraction | 10 (100.0%) | 0 (0.0%) |
| Installation, Maintenance & Repair | 10 (100.0%) | 0 (0.0%) |
| Total (Category) | 20 (100.0%) | 0 (0.0%) |
| Total (Overall) | 30 (66.7%) | 15 (33.3%) |
Production, Transportation and Moving Occupations
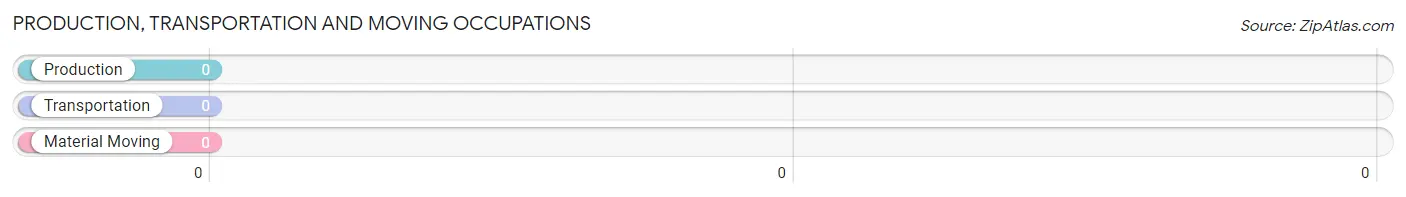
Production, Transportation and Moving Occupations by Sex
| Occupation | Male | Female |
| Production | 0 (0.0%) | 0 (0.0%) |
| Transportation | 0 (0.0%) | 0 (0.0%) |
| Material Moving | 0 (0.0%) | 0 (0.0%) |
| Total (Category) | 0 (0.0%) | 0 (0.0%) |
| Total (Overall) | 30 (66.7%) | 15 (33.3%) |
Employment Industries by Sex in Hiwassee
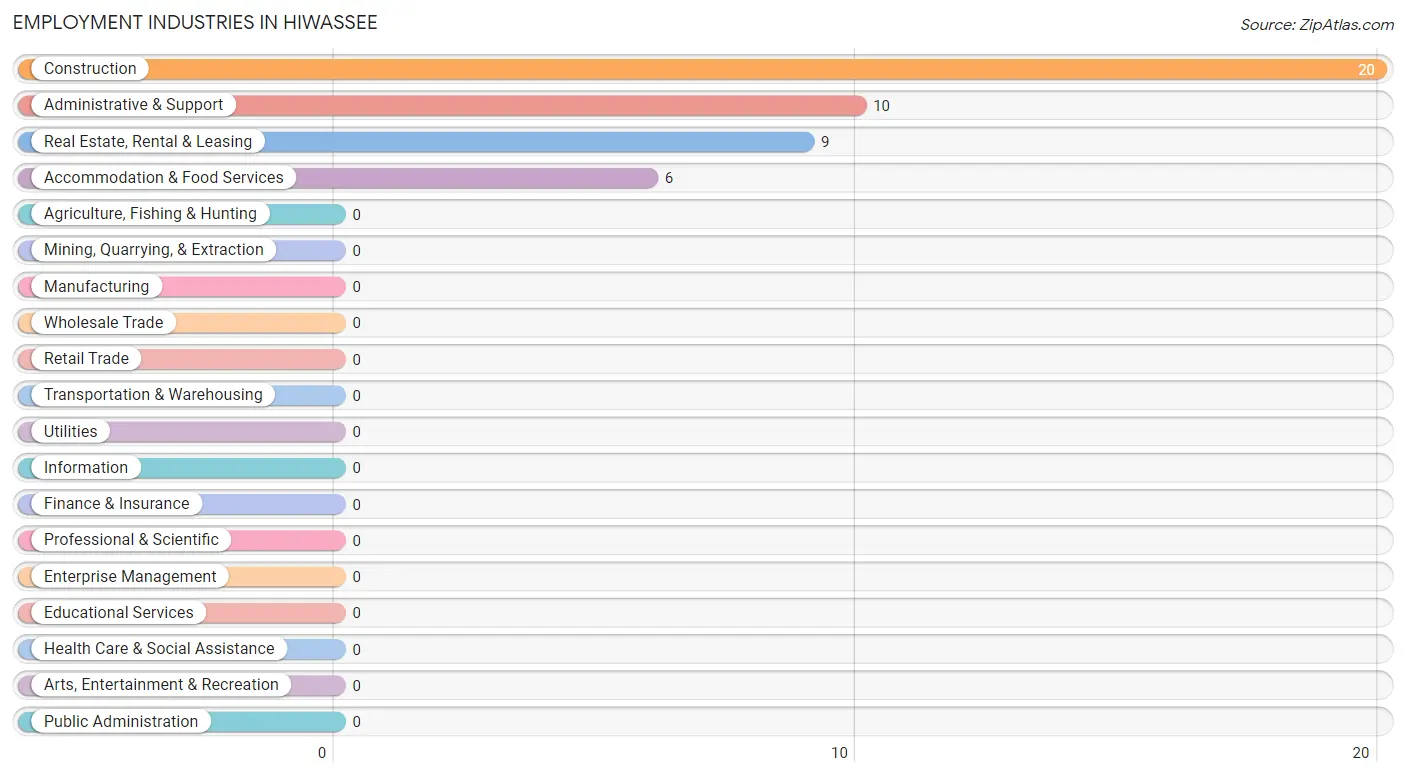
Employment Industries in Hiwassee
The major employment industries in Hiwassee include Construction (20 | 44.4%), Administrative & Support (10 | 22.2%), Real Estate, Rental & Leasing (9 | 20.0%), and Accommodation & Food Services (6 | 13.3%).
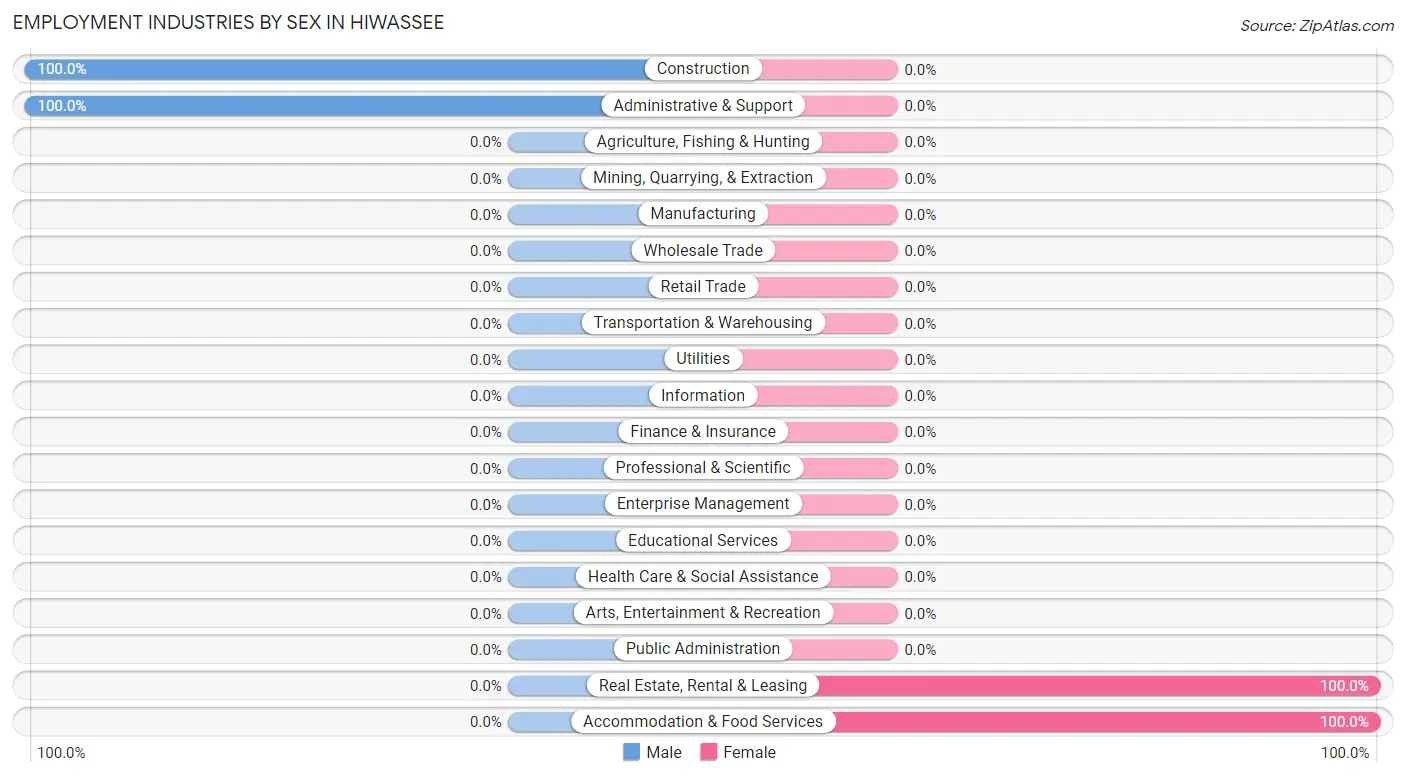
Employment Industries by Sex in Hiwassee
The Hiwassee industries that see more men than women are Construction (100.0%), and Administrative & Support (100.0%), whereas the industries that tend to have a higher number of women are Real Estate, Rental & Leasing (100.0%), and Accommodation & Food Services (100.0%).
| Industry | Male | Female |
| Agriculture, Fishing & Hunting | 0 (0.0%) | 0 (0.0%) |
| Mining, Quarrying, & Extraction | 0 (0.0%) | 0 (0.0%) |
| Construction | 20 (100.0%) | 0 (0.0%) |
| Manufacturing | 0 (0.0%) | 0 (0.0%) |
| Wholesale Trade | 0 (0.0%) | 0 (0.0%) |
| Retail Trade | 0 (0.0%) | 0 (0.0%) |
| Transportation & Warehousing | 0 (0.0%) | 0 (0.0%) |
| Utilities | 0 (0.0%) | 0 (0.0%) |
| Information | 0 (0.0%) | 0 (0.0%) |
| Finance & Insurance | 0 (0.0%) | 0 (0.0%) |
| Real Estate, Rental & Leasing | 0 (0.0%) | 9 (100.0%) |
| Professional & Scientific | 0 (0.0%) | 0 (0.0%) |
| Enterprise Management | 0 (0.0%) | 0 (0.0%) |
| Administrative & Support | 10 (100.0%) | 0 (0.0%) |
| Educational Services | 0 (0.0%) | 0 (0.0%) |
| Health Care & Social Assistance | 0 (0.0%) | 0 (0.0%) |
| Arts, Entertainment & Recreation | 0 (0.0%) | 0 (0.0%) |
| Accommodation & Food Services | 0 (0.0%) | 6 (100.0%) |
| Public Administration | 0 (0.0%) | 0 (0.0%) |
| Total | 30 (66.7%) | 15 (33.3%) |
Education in Hiwassee
School Enrollment in Hiwassee
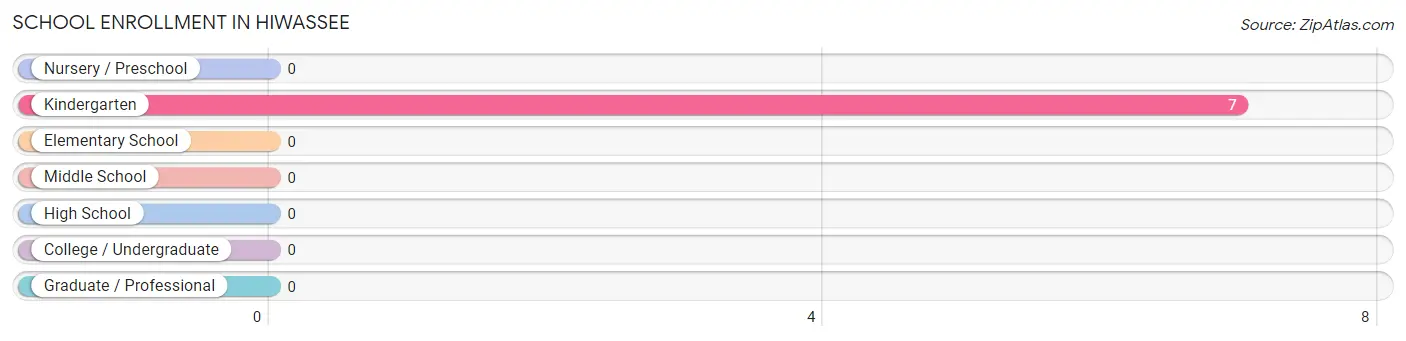
| School Level | # Students | % Students |
| Nursery / Preschool | 0 | 0.0% |
| Kindergarten | 7 | 100.0% |
| Elementary School | 0 | 0.0% |
| Middle School | 0 | 0.0% |
| High School | 0 | 0.0% |
| College / Undergraduate | 0 | 0.0% |
| Graduate / Professional | 0 | 0.0% |
| Total | 7 | 100.0% |
School Enrollment by Age by Funding Source in Hiwassee
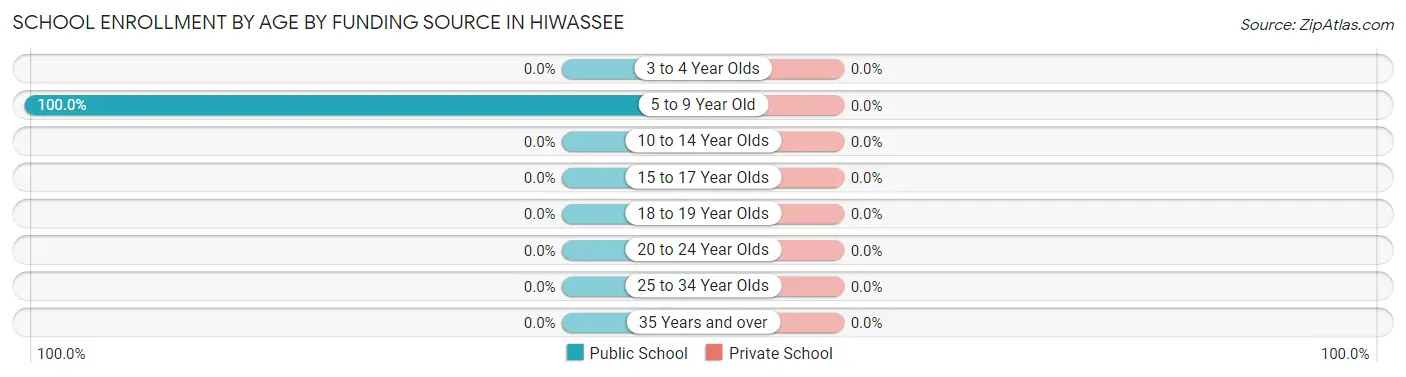
| Age Bracket | Public School | Private School |
| 3 to 4 Year Olds | 0 (0.0%) | 0 (0.0%) |
| 5 to 9 Year Old | 7 (100.0%) | 0 (0.0%) |
| 10 to 14 Year Olds | 0 (0.0%) | 0 (0.0%) |
| 15 to 17 Year Olds | 0 (0.0%) | 0 (0.0%) |
| 18 to 19 Year Olds | 0 (0.0%) | 0 (0.0%) |
| 20 to 24 Year Olds | 0 (0.0%) | 0 (0.0%) |
| 25 to 34 Year Olds | 0 (0.0%) | 0 (0.0%) |
| 35 Years and over | 0 (0.0%) | 0 (0.0%) |
| Total | 7 (100.0%) | 0 (0.0%) |
Educational Attainment by Field of Study in Hiwassee
, and education (8 | 100.0%) are the most common fields of study among 8 individuals in Hiwassee who have obtained a bachelor's degree or higher.
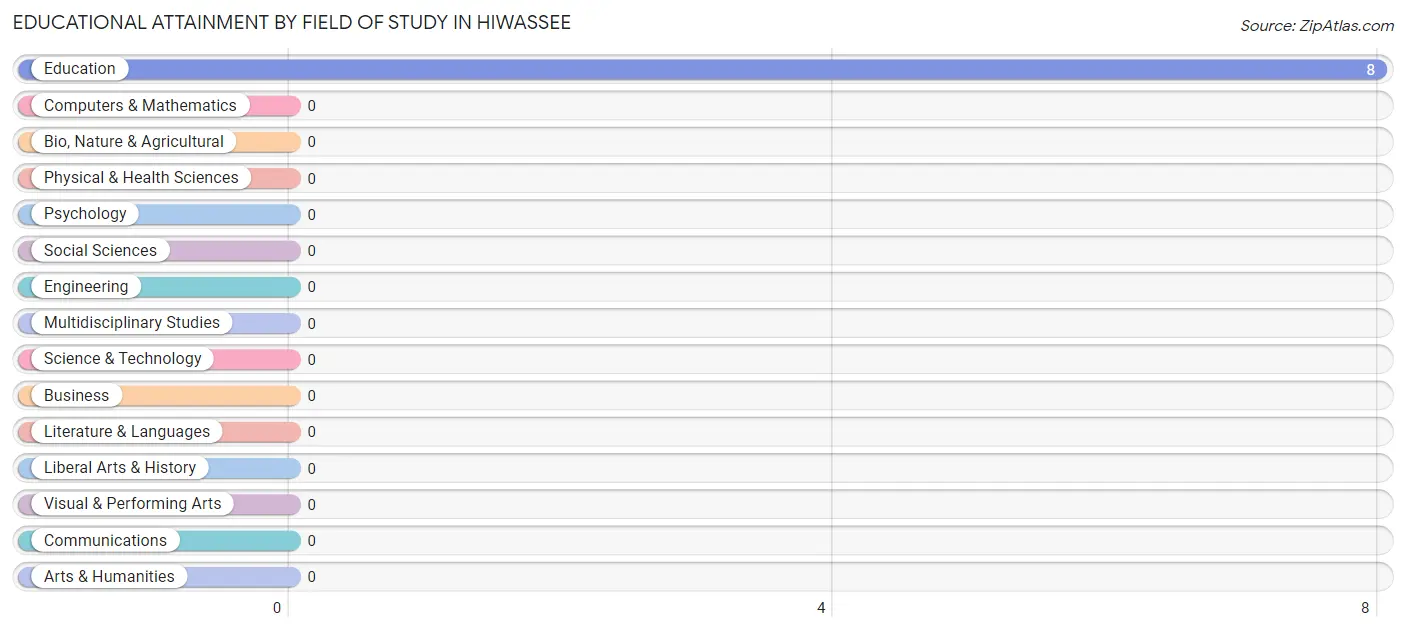
| Field of Study | # Graduates | % Graduates |
| Computers & Mathematics | 0 | 0.0% |
| Bio, Nature & Agricultural | 0 | 0.0% |
| Physical & Health Sciences | 0 | 0.0% |
| Psychology | 0 | 0.0% |
| Social Sciences | 0 | 0.0% |
| Engineering | 0 | 0.0% |
| Multidisciplinary Studies | 0 | 0.0% |
| Science & Technology | 0 | 0.0% |
| Business | 0 | 0.0% |
| Education | 8 | 100.0% |
| Literature & Languages | 0 | 0.0% |
| Liberal Arts & History | 0 | 0.0% |
| Visual & Performing Arts | 0 | 0.0% |
| Communications | 0 | 0.0% |
| Arts & Humanities | 0 | 0.0% |
| Total | 8 | 100.0% |
Transportation & Commute in Hiwassee
Vehicle Availability by Sex in Hiwassee
The most prevalent vehicle ownership categories in Hiwassee are males with 2 vehicles (20, accounting for 66.7%) and females with 2 vehicles (9, making up 133.3%).
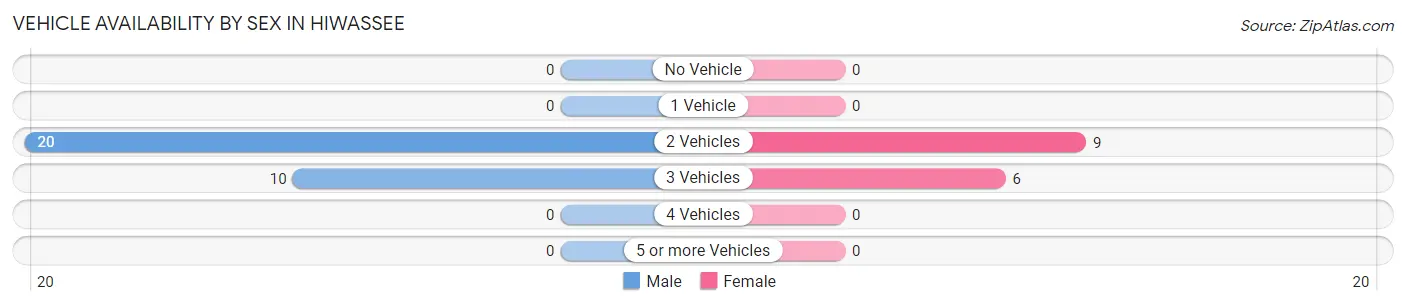
| Vehicles Available | Male | Female |
| No Vehicle | 0 (0.0%) | 0 (0.0%) |
| 1 Vehicle | 0 (0.0%) | 0 (0.0%) |
| 2 Vehicles | 20 (66.7%) | 9 (60.0%) |
| 3 Vehicles | 10 (33.3%) | 6 (40.0%) |
| 4 Vehicles | 0 (0.0%) | 0 (0.0%) |
| 5 or more Vehicles | 0 (0.0%) | 0 (0.0%) |
| Total | 30 (100.0%) | 15 (100.0%) |
Commute Time in Hiwassee
The most frequently occuring commute durations in Hiwassee are less than 5 minutes (10 commuters, 22.2%), 30 to 34 minutes (10 commuters, 22.2%), and 35 to 39 minutes (10 commuters, 22.2%).
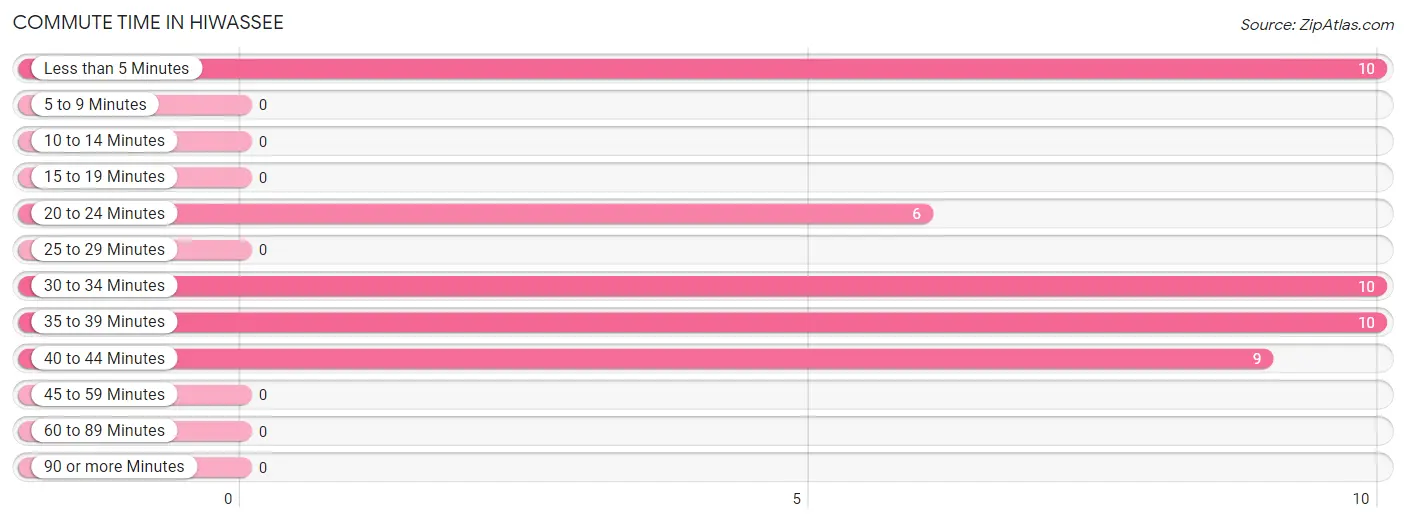
| Commute Time | # Commuters | % Commuters |
| Less than 5 Minutes | 10 | 22.2% |
| 5 to 9 Minutes | 0 | 0.0% |
| 10 to 14 Minutes | 0 | 0.0% |
| 15 to 19 Minutes | 0 | 0.0% |
| 20 to 24 Minutes | 6 | 13.3% |
| 25 to 29 Minutes | 0 | 0.0% |
| 30 to 34 Minutes | 10 | 22.2% |
| 35 to 39 Minutes | 10 | 22.2% |
| 40 to 44 Minutes | 9 | 20.0% |
| 45 to 59 Minutes | 0 | 0.0% |
| 60 to 89 Minutes | 0 | 0.0% |
| 90 or more Minutes | 0 | 0.0% |
Commute Time by Sex in Hiwassee
The most common commute times in Hiwassee are less than 5 minutes (10 commuters, 33.3%) for males and 40 to 44 minutes (9 commuters, 60.0%) for females.
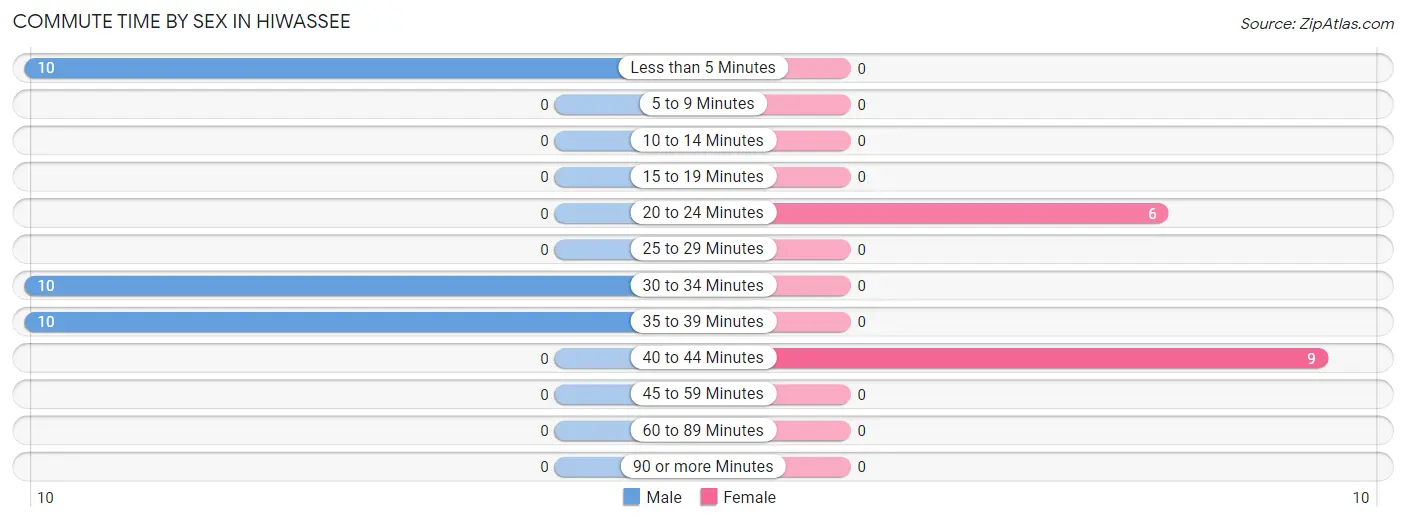
| Commute Time | Male | Female |
| Less than 5 Minutes | 10 (33.3%) | 0 (0.0%) |
| 5 to 9 Minutes | 0 (0.0%) | 0 (0.0%) |
| 10 to 14 Minutes | 0 (0.0%) | 0 (0.0%) |
| 15 to 19 Minutes | 0 (0.0%) | 0 (0.0%) |
| 20 to 24 Minutes | 0 (0.0%) | 6 (40.0%) |
| 25 to 29 Minutes | 0 (0.0%) | 0 (0.0%) |
| 30 to 34 Minutes | 10 (33.3%) | 0 (0.0%) |
| 35 to 39 Minutes | 10 (33.3%) | 0 (0.0%) |
| 40 to 44 Minutes | 0 (0.0%) | 9 (60.0%) |
| 45 to 59 Minutes | 0 (0.0%) | 0 (0.0%) |
| 60 to 89 Minutes | 0 (0.0%) | 0 (0.0%) |
| 90 or more Minutes | 0 (0.0%) | 0 (0.0%) |
Time of Departure to Work by Sex in Hiwassee
The most frequent times of departure to work in Hiwassee are 5:00 AM to 5:29 AM (10, 33.3%) for males and 9:00 AM to 9:59 AM (9, 60.0%) for females.
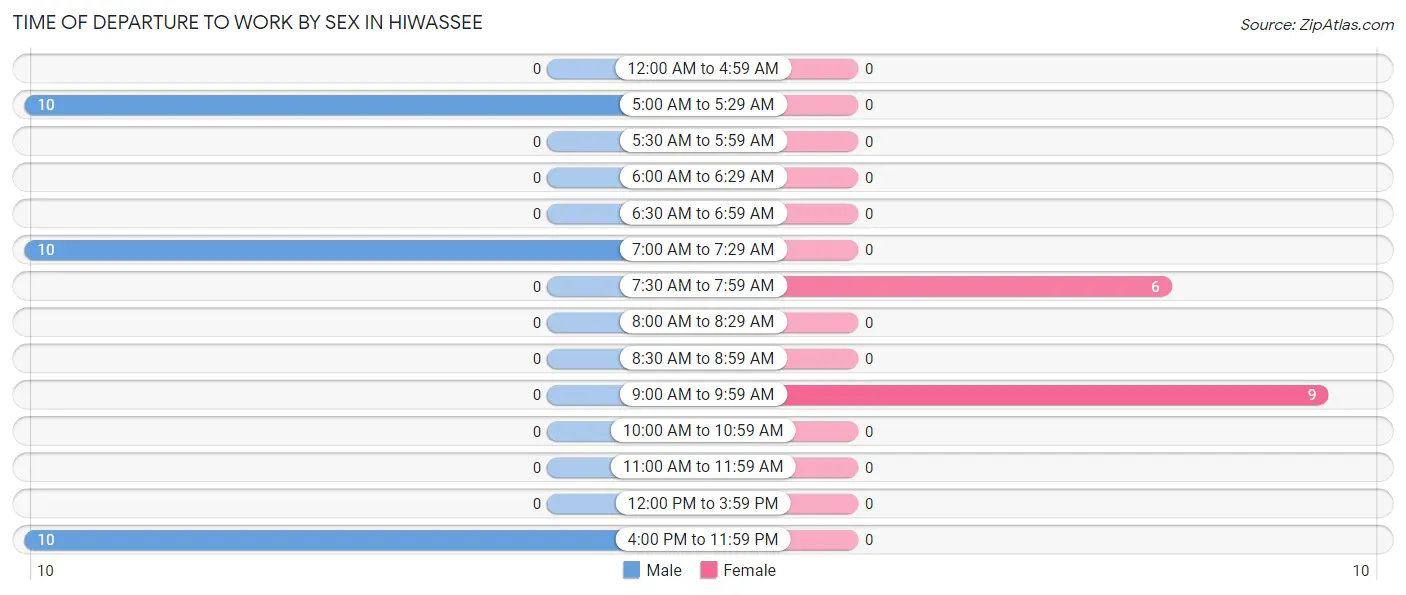
| Time of Departure | Male | Female |
| 12:00 AM to 4:59 AM | 0 (0.0%) | 0 (0.0%) |
| 5:00 AM to 5:29 AM | 10 (33.3%) | 0 (0.0%) |
| 5:30 AM to 5:59 AM | 0 (0.0%) | 0 (0.0%) |
| 6:00 AM to 6:29 AM | 0 (0.0%) | 0 (0.0%) |
| 6:30 AM to 6:59 AM | 0 (0.0%) | 0 (0.0%) |
| 7:00 AM to 7:29 AM | 10 (33.3%) | 0 (0.0%) |
| 7:30 AM to 7:59 AM | 0 (0.0%) | 6 (40.0%) |
| 8:00 AM to 8:29 AM | 0 (0.0%) | 0 (0.0%) |
| 8:30 AM to 8:59 AM | 0 (0.0%) | 0 (0.0%) |
| 9:00 AM to 9:59 AM | 0 (0.0%) | 9 (60.0%) |
| 10:00 AM to 10:59 AM | 0 (0.0%) | 0 (0.0%) |
| 11:00 AM to 11:59 AM | 0 (0.0%) | 0 (0.0%) |
| 12:00 PM to 3:59 PM | 0 (0.0%) | 0 (0.0%) |
| 4:00 PM to 11:59 PM | 10 (33.3%) | 0 (0.0%) |
| Total | 30 (100.0%) | 15 (100.0%) |
Housing Occupancy in Hiwassee
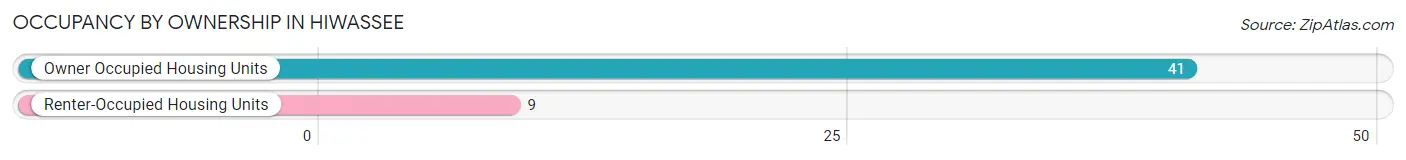
Occupancy by Ownership in Hiwassee
Of the total 50 dwellings in Hiwassee, owner-occupied units account for 41 (82.0%), while renter-occupied units make up 9 (18.0%).
| Occupancy | # Housing Units | % Housing Units |
| Owner Occupied Housing Units | 41 | 82.0% |
| Renter-Occupied Housing Units | 9 | 18.0% |
| Total Occupied Housing Units | 50 | 100.0% |
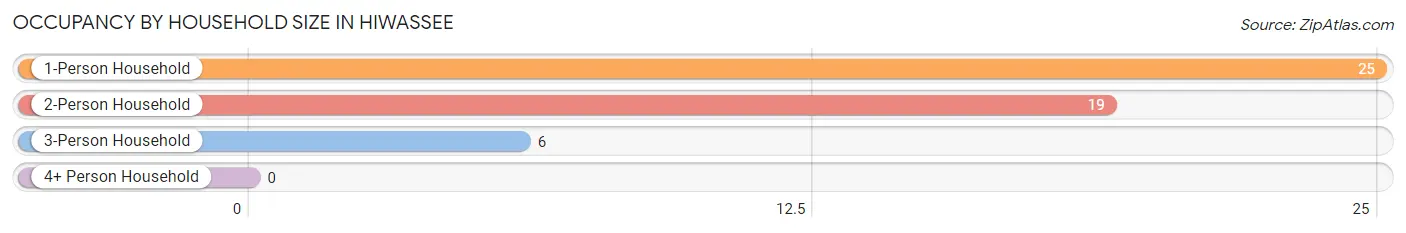
Occupancy by Household Size in Hiwassee
| Household Size | # Housing Units | % Housing Units |
| 1-Person Household | 25 | 50.0% |
| 2-Person Household | 19 | 38.0% |
| 3-Person Household | 6 | 12.0% |
| 4+ Person Household | 0 | 0.0% |
| Total Housing Units | 50 | 100.0% |
Occupancy by Ownership by Household Size in Hiwassee
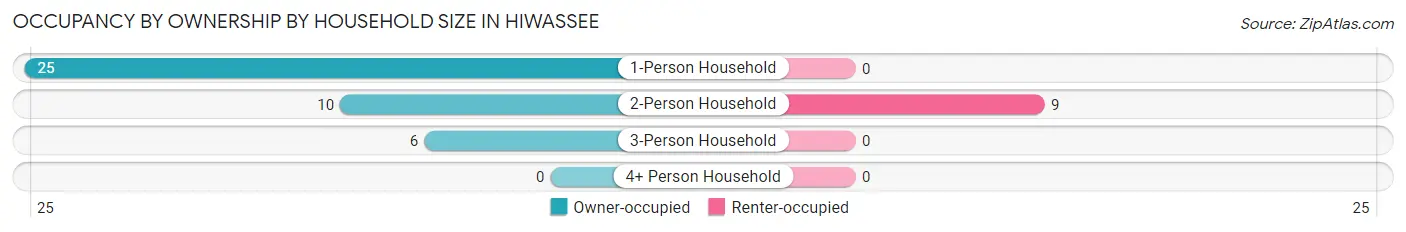
| Household Size | Owner-occupied | Renter-occupied |
| 1-Person Household | 25 (100.0%) | 0 (0.0%) |
| 2-Person Household | 10 (52.6%) | 9 (47.4%) |
| 3-Person Household | 6 (100.0%) | 0 (0.0%) |
| 4+ Person Household | 0 (0.0%) | 0 (0.0%) |
| Total Housing Units | 41 (82.0%) | 9 (18.0%) |
Occupancy by Educational Attainment in Hiwassee
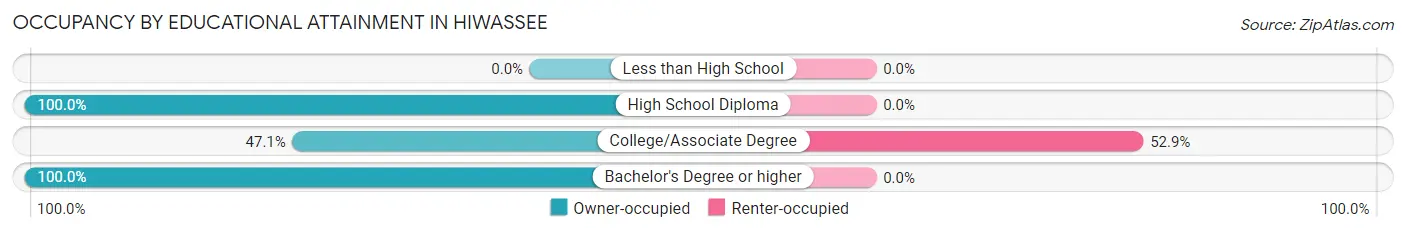
| Household Size | Owner-occupied | Renter-occupied |
| Less than High School | 0 (0.0%) | 0 (0.0%) |
| High School Diploma | 25 (100.0%) | 0 (0.0%) |
| College/Associate Degree | 8 (47.1%) | 9 (52.9%) |
| Bachelor's Degree or higher | 8 (100.0%) | 0 (0.0%) |
Occupancy by Age of Householder in Hiwassee
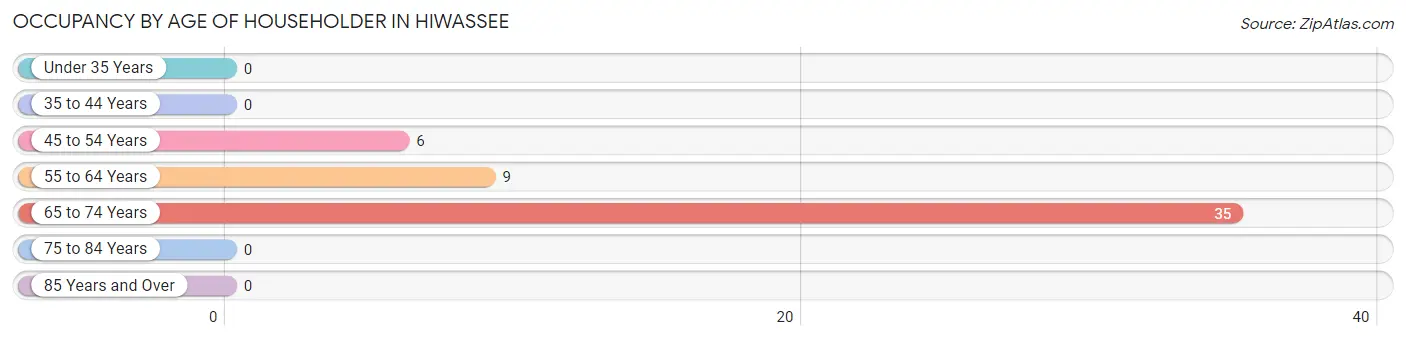
| Age Bracket | # Households | % Households |
| Under 35 Years | 0 | 0.0% |
| 35 to 44 Years | 0 | 0.0% |
| 45 to 54 Years | 6 | 12.0% |
| 55 to 64 Years | 9 | 18.0% |
| 65 to 74 Years | 35 | 70.0% |
| 75 to 84 Years | 0 | 0.0% |
| 85 Years and Over | 0 | 0.0% |
| Total | 50 | 100.0% |
Housing Finances in Hiwassee
Median Income by Occupancy in Hiwassee
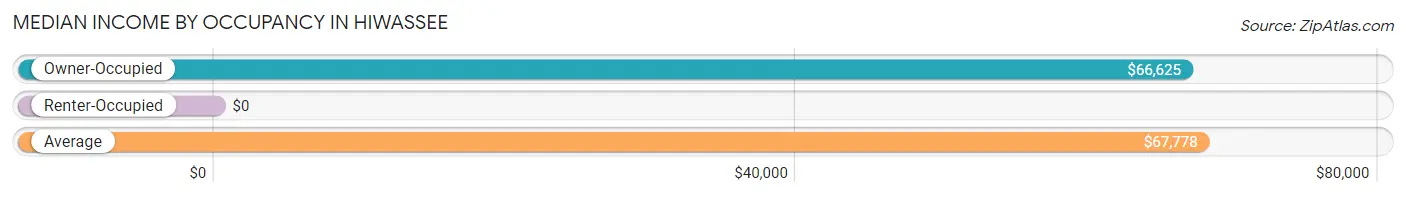
| Occupancy Type | # Households | Median Income |
| Owner-Occupied | 41 (82.0%) | $66,625 |
| Renter-Occupied | 9 (18.0%) | $0 |
| Average | 50 (100.0%) | $67,778 |
Occupancy by Householder Income Bracket in Hiwassee
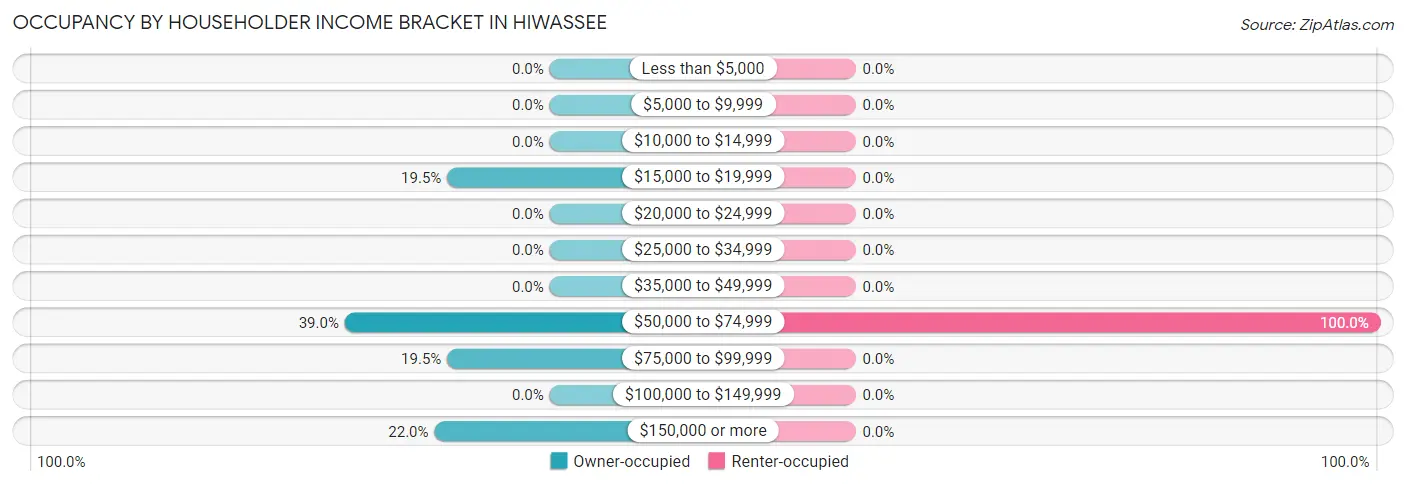
| Income Bracket | Owner-occupied | Renter-occupied |
| Less than $5,000 | 0 (0.0%) | 0 (0.0%) |
| $5,000 to $9,999 | 0 (0.0%) | 0 (0.0%) |
| $10,000 to $14,999 | 0 (0.0%) | 0 (0.0%) |
| $15,000 to $19,999 | 8 (19.5%) | 0 (0.0%) |
| $20,000 to $24,999 | 0 (0.0%) | 0 (0.0%) |
| $25,000 to $34,999 | 0 (0.0%) | 0 (0.0%) |
| $35,000 to $49,999 | 0 (0.0%) | 0 (0.0%) |
| $50,000 to $74,999 | 16 (39.0%) | 9 (100.0%) |
| $75,000 to $99,999 | 8 (19.5%) | 0 (0.0%) |
| $100,000 to $149,999 | 0 (0.0%) | 0 (0.0%) |
| $150,000 or more | 9 (22.0%) | 0 (0.0%) |
| Total | 41 (100.0%) | 9 (100.0%) |
Monthly Housing Cost Tiers in Hiwassee
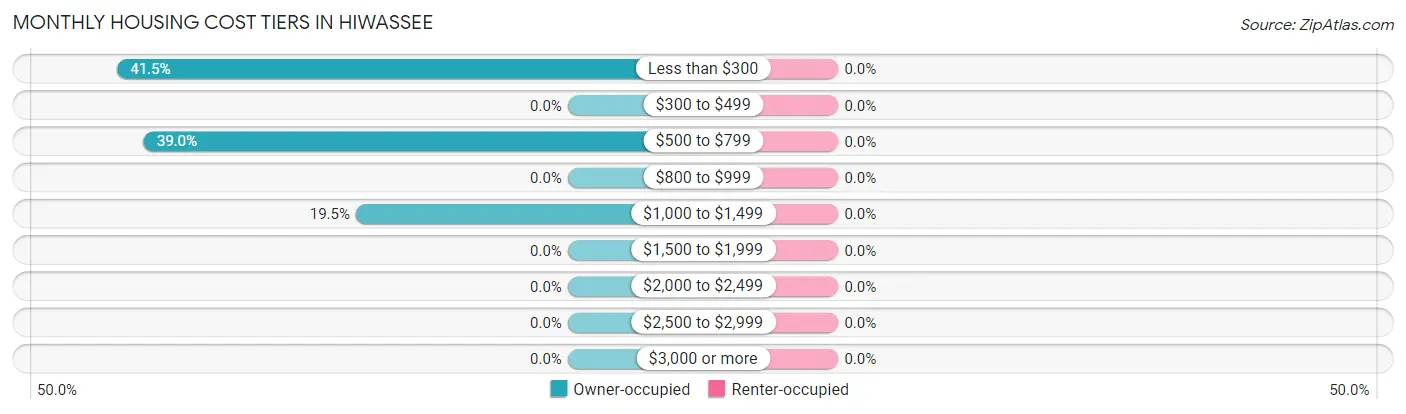
| Monthly Cost | Owner-occupied | Renter-occupied |
| Less than $300 | 17 (41.5%) | 0 (0.0%) |
| $300 to $499 | 0 (0.0%) | 0 (0.0%) |
| $500 to $799 | 16 (39.0%) | 0 (0.0%) |
| $800 to $999 | 0 (0.0%) | 0 (0.0%) |
| $1,000 to $1,499 | 8 (19.5%) | 0 (0.0%) |
| $1,500 to $1,999 | 0 (0.0%) | 0 (0.0%) |
| $2,000 to $2,499 | 0 (0.0%) | 0 (0.0%) |
| $2,500 to $2,999 | 0 (0.0%) | 0 (0.0%) |
| $3,000 or more | 0 (0.0%) | 0 (0.0%) |
| Total | 41 (100.0%) | 9 (100.0%) |
Physical Housing Characteristics in Hiwassee
Housing Structures in Hiwassee
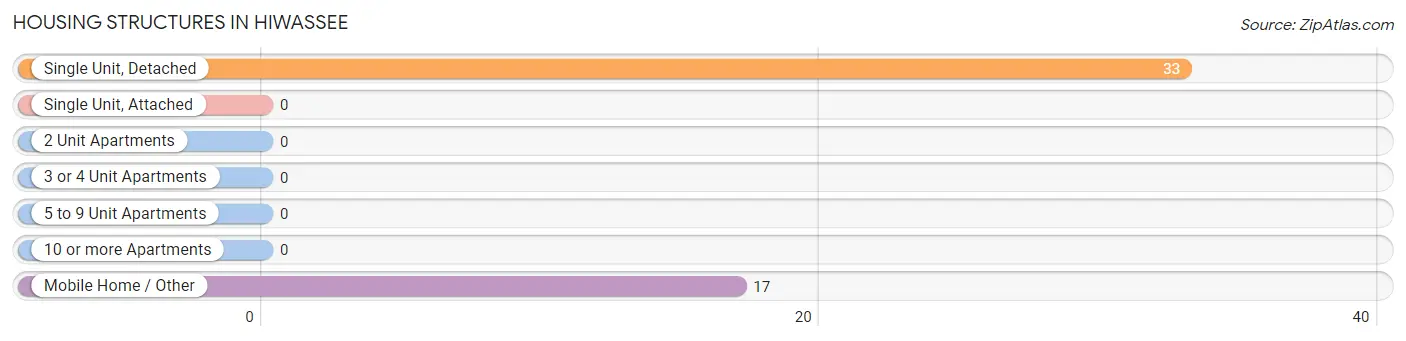
| Structure Type | # Housing Units | % Housing Units |
| Single Unit, Detached | 33 | 66.0% |
| Single Unit, Attached | 0 | 0.0% |
| 2 Unit Apartments | 0 | 0.0% |
| 3 or 4 Unit Apartments | 0 | 0.0% |
| 5 to 9 Unit Apartments | 0 | 0.0% |
| 10 or more Apartments | 0 | 0.0% |
| Mobile Home / Other | 17 | 34.0% |
| Total | 50 | 100.0% |
Housing Structures by Occupancy in Hiwassee
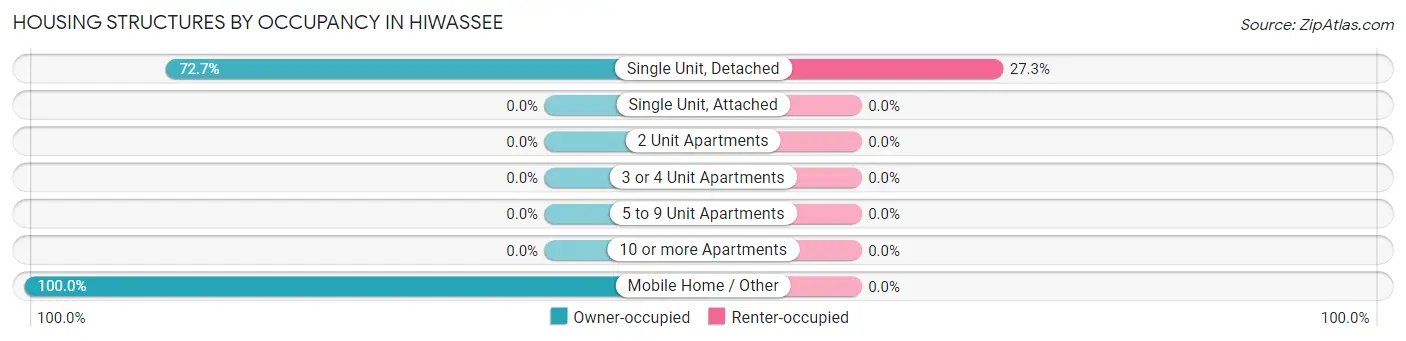
| Structure Type | Owner-occupied | Renter-occupied |
| Single Unit, Detached | 24 (72.7%) | 9 (27.3%) |
| Single Unit, Attached | 0 (0.0%) | 0 (0.0%) |
| 2 Unit Apartments | 0 (0.0%) | 0 (0.0%) |
| 3 or 4 Unit Apartments | 0 (0.0%) | 0 (0.0%) |
| 5 to 9 Unit Apartments | 0 (0.0%) | 0 (0.0%) |
| 10 or more Apartments | 0 (0.0%) | 0 (0.0%) |
| Mobile Home / Other | 17 (100.0%) | 0 (0.0%) |
| Total | 41 (82.0%) | 9 (18.0%) |
Housing Structures by Number of Rooms in Hiwassee
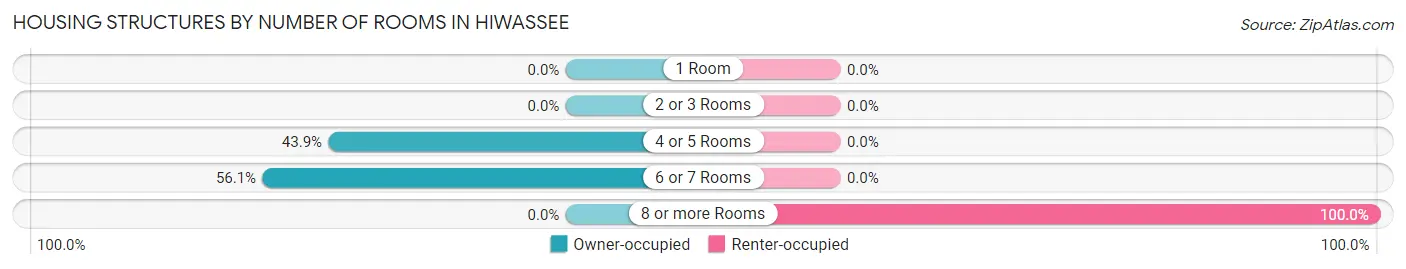
| Number of Rooms | Owner-occupied | Renter-occupied |
| 1 Room | 0 (0.0%) | 0 (0.0%) |
| 2 or 3 Rooms | 0 (0.0%) | 0 (0.0%) |
| 4 or 5 Rooms | 18 (43.9%) | 0 (0.0%) |
| 6 or 7 Rooms | 23 (56.1%) | 0 (0.0%) |
| 8 or more Rooms | 0 (0.0%) | 9 (100.0%) |
| Total | 41 (100.0%) | 9 (100.0%) |
Housing Structure by Heating Type in Hiwassee
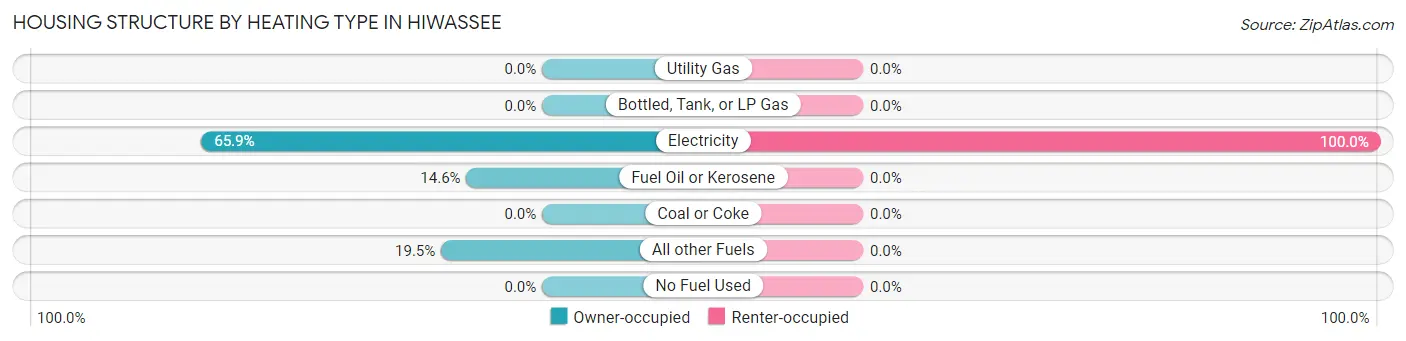
| Heating Type | Owner-occupied | Renter-occupied |
| Utility Gas | 0 (0.0%) | 0 (0.0%) |
| Bottled, Tank, or LP Gas | 0 (0.0%) | 0 (0.0%) |
| Electricity | 27 (65.8%) | 9 (100.0%) |
| Fuel Oil or Kerosene | 6 (14.6%) | 0 (0.0%) |
| Coal or Coke | 0 (0.0%) | 0 (0.0%) |
| All other Fuels | 8 (19.5%) | 0 (0.0%) |
| No Fuel Used | 0 (0.0%) | 0 (0.0%) |
| Total | 41 (100.0%) | 9 (100.0%) |
Household Vehicle Usage in Hiwassee
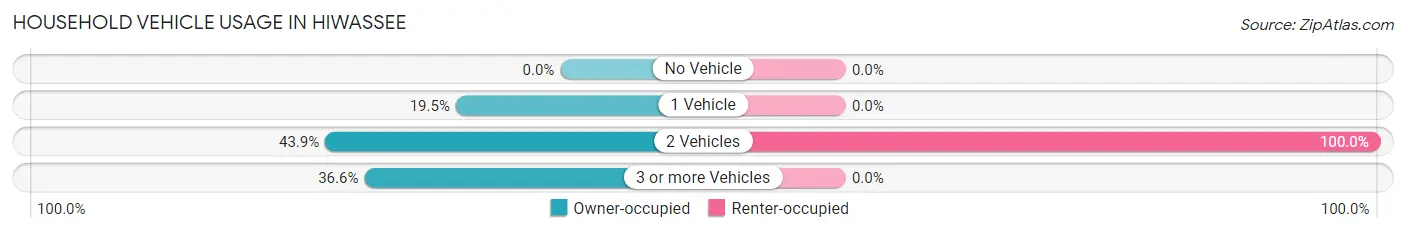
| Vehicles per Household | Owner-occupied | Renter-occupied |
| No Vehicle | 0 (0.0%) | 0 (0.0%) |
| 1 Vehicle | 8 (19.5%) | 0 (0.0%) |
| 2 Vehicles | 18 (43.9%) | 9 (100.0%) |
| 3 or more Vehicles | 15 (36.6%) | 0 (0.0%) |
| Total | 41 (100.0%) | 9 (100.0%) |
Real Estate & Mortgages in Hiwassee
Real Estate and Mortgage Overview in Hiwassee
| Characteristic | Without Mortgage | With Mortgage |
| Housing Units | 23 | 18 |
| Median Property Value | - | - |
| Median Household Income | - | - |
| Monthly Housing Costs | $234 | $0 |
| Real Estate Taxes | $465 | $8 |
Property Value by Mortgage Status in Hiwassee
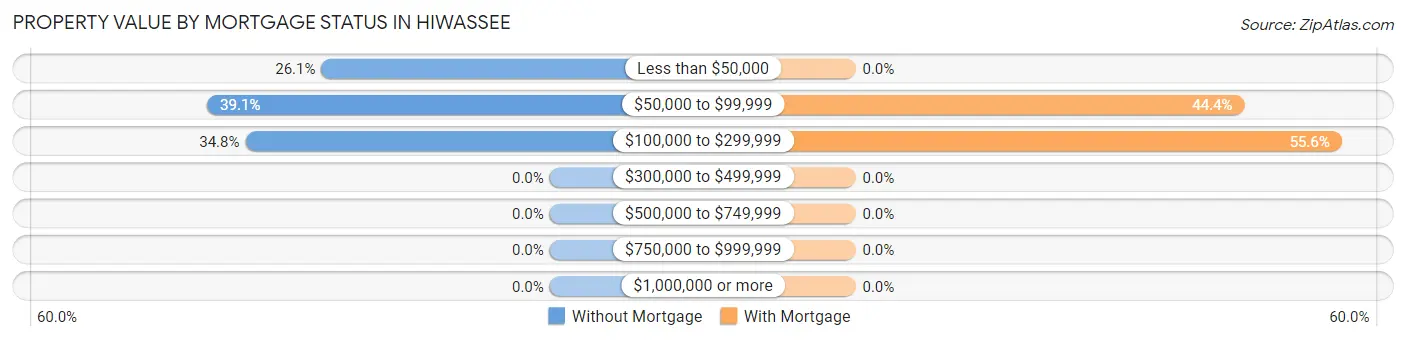
| Property Value | Without Mortgage | With Mortgage |
| Less than $50,000 | 6 (26.1%) | 0 (0.0%) |
| $50,000 to $99,999 | 9 (39.1%) | 8 (44.4%) |
| $100,000 to $299,999 | 8 (34.8%) | 10 (55.6%) |
| $300,000 to $499,999 | 0 (0.0%) | 0 (0.0%) |
| $500,000 to $749,999 | 0 (0.0%) | 0 (0.0%) |
| $750,000 to $999,999 | 0 (0.0%) | 0 (0.0%) |
| $1,000,000 or more | 0 (0.0%) | 0 (0.0%) |
| Total | 23 (100.0%) | 18 (100.0%) |
Household Income by Mortgage Status in Hiwassee
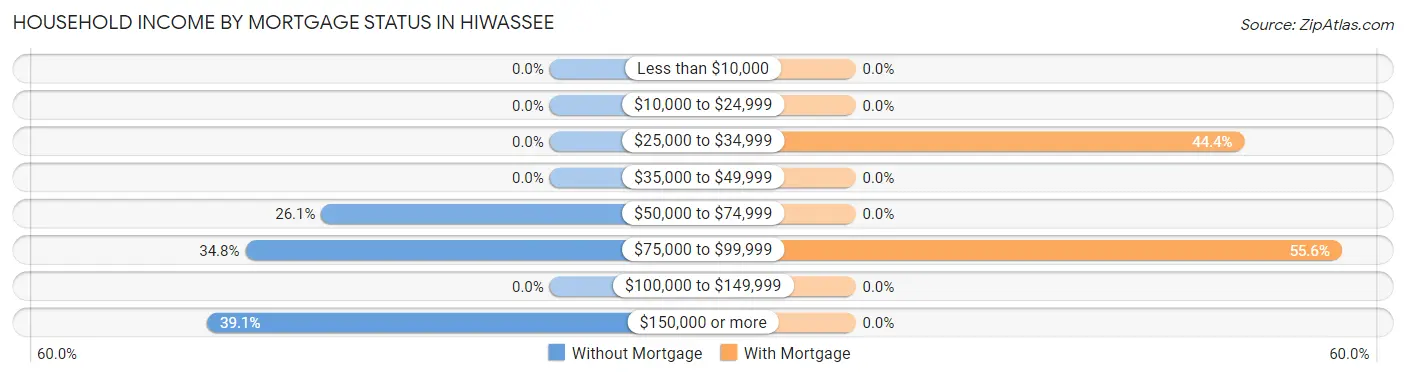
| Household Income | Without Mortgage | With Mortgage |
| Less than $10,000 | 0 (0.0%) | 0 (0.0%) |
| $10,000 to $24,999 | 0 (0.0%) | 0 (0.0%) |
| $25,000 to $34,999 | 0 (0.0%) | 8 (44.4%) |
| $35,000 to $49,999 | 0 (0.0%) | 0 (0.0%) |
| $50,000 to $74,999 | 6 (26.1%) | 0 (0.0%) |
| $75,000 to $99,999 | 8 (34.8%) | 10 (55.6%) |
| $100,000 to $149,999 | 0 (0.0%) | 0 (0.0%) |
| $150,000 or more | 9 (39.1%) | 0 (0.0%) |
| Total | 23 (100.0%) | 18 (100.0%) |
Property Value to Household Income Ratio in Hiwassee
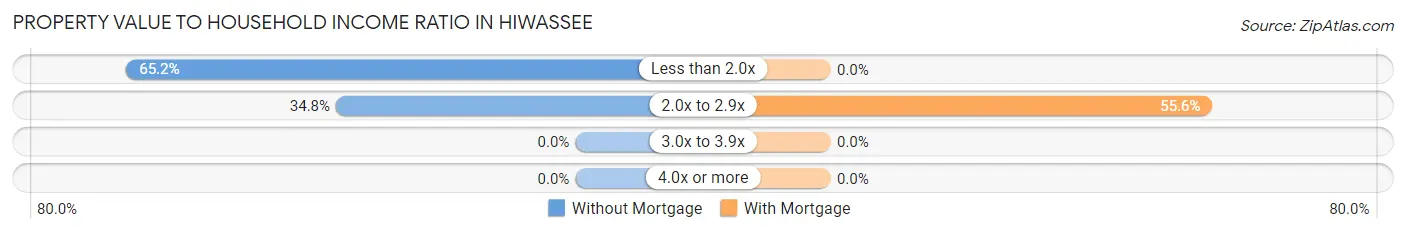
| Value-to-Income Ratio | Without Mortgage | With Mortgage |
| Less than 2.0x | 15 (65.2%) | 0 (0.0%) |
| 2.0x to 2.9x | 8 (34.8%) | 10 (55.6%) |
| 3.0x to 3.9x | 0 (0.0%) | 0 (0.0%) |
| 4.0x or more | 0 (0.0%) | 0 (0.0%) |
| Total | 23 (100.0%) | 18 (100.0%) |
Real Estate Taxes by Mortgage Status in Hiwassee
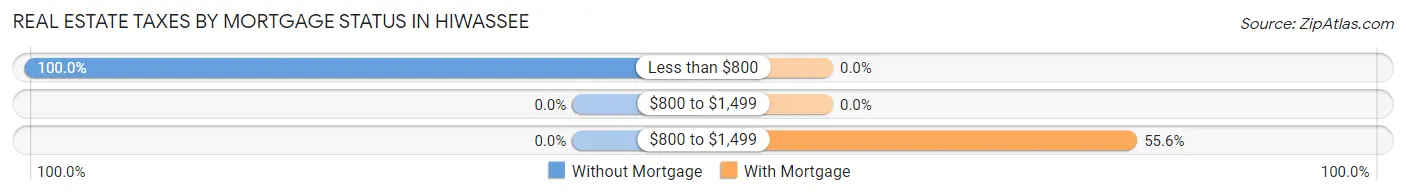
| Property Taxes | Without Mortgage | With Mortgage |
| Less than $800 | 23 (100.0%) | 0 (0.0%) |
| $800 to $1,499 | 0 (0.0%) | 0 (0.0%) |
| $800 to $1,499 | 0 (0.0%) | 10 (55.6%) |
| Total | 23 (100.0%) | 18 (100.0%) |
Health & Disability in Hiwassee
Health Insurance Coverage by Age in Hiwassee
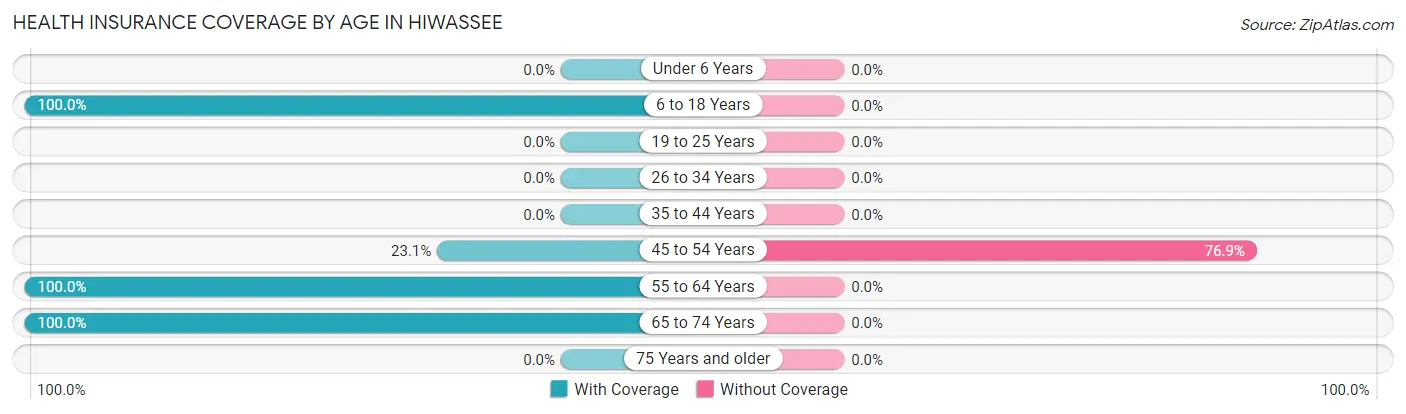
| Age Bracket | With Coverage | Without Coverage |
| Under 6 Years | 0 (0.0%) | 0 (0.0%) |
| 6 to 18 Years | 7 (100.0%) | 0 (0.0%) |
| 19 to 25 Years | 0 (0.0%) | 0 (0.0%) |
| 26 to 34 Years | 0 (0.0%) | 0 (0.0%) |
| 35 to 44 Years | 0 (0.0%) | 0 (0.0%) |
| 45 to 54 Years | 6 (23.1%) | 20 (76.9%) |
| 55 to 64 Years | 9 (100.0%) | 0 (0.0%) |
| 65 to 74 Years | 44 (100.0%) | 0 (0.0%) |
| 75 Years and older | 0 (0.0%) | 0 (0.0%) |
| Total | 66 (76.7%) | 20 (23.3%) |
Health Insurance Coverage by Citizenship Status in Hiwassee
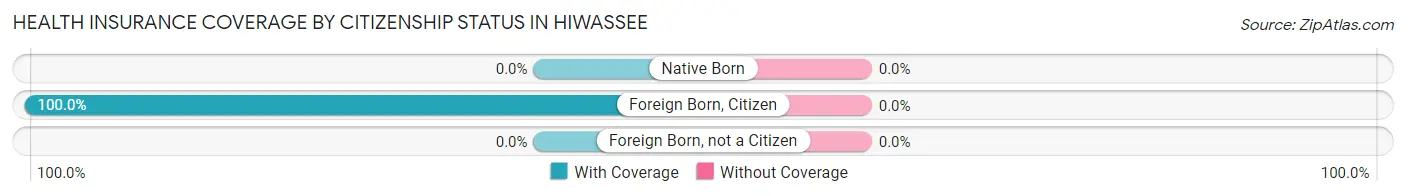
| Citizenship Status | With Coverage | Without Coverage |
| Native Born | 0 (0.0%) | 0 (0.0%) |
| Foreign Born, Citizen | 7 (100.0%) | 0 (0.0%) |
| Foreign Born, not a Citizen | 0 (0.0%) | 0 (0.0%) |
Health Insurance Coverage by Household Income in Hiwassee
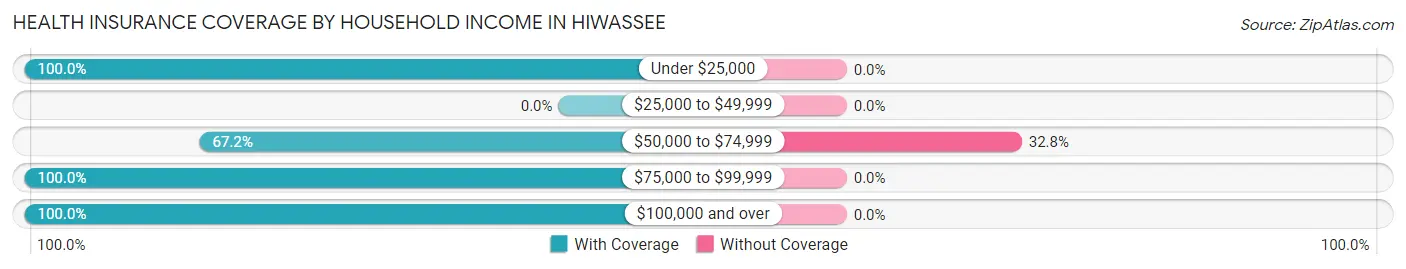
| Household Income | With Coverage | Without Coverage |
| Under $25,000 | 8 (100.0%) | 0 (0.0%) |
| $25,000 to $49,999 | 0 (0.0%) | 0 (0.0%) |
| $50,000 to $74,999 | 41 (67.2%) | 20 (32.8%) |
| $75,000 to $99,999 | 8 (100.0%) | 0 (0.0%) |
| $100,000 and over | 9 (100.0%) | 0 (0.0%) |
Public vs Private Health Insurance Coverage by Age in Hiwassee
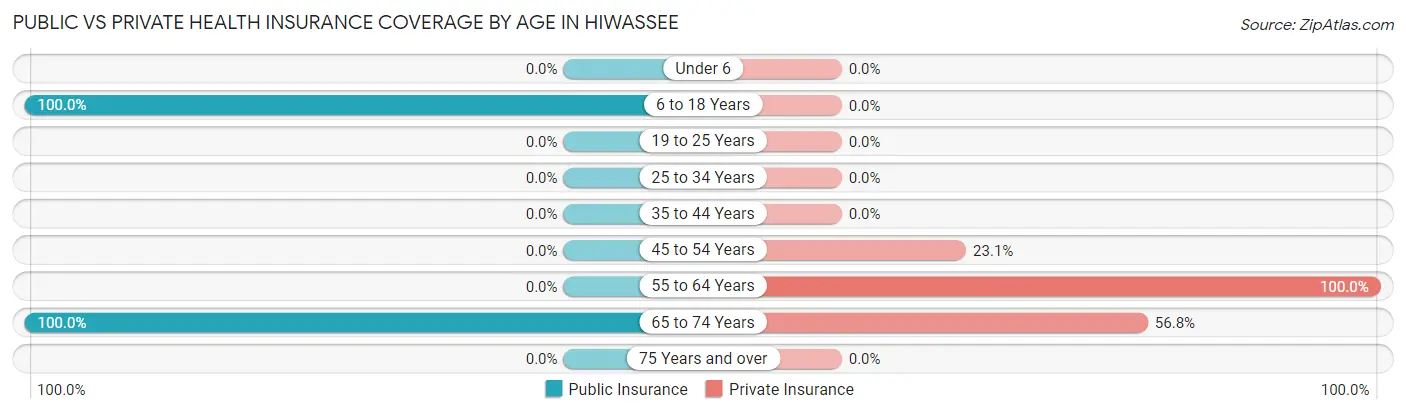
| Age Bracket | Public Insurance | Private Insurance |
| Under 6 | 0 (0.0%) | 0 (0.0%) |
| 6 to 18 Years | 7 (100.0%) | 0 (0.0%) |
| 19 to 25 Years | 0 (0.0%) | 0 (0.0%) |
| 25 to 34 Years | 0 (0.0%) | 0 (0.0%) |
| 35 to 44 Years | 0 (0.0%) | 0 (0.0%) |
| 45 to 54 Years | 0 (0.0%) | 6 (23.1%) |
| 55 to 64 Years | 0 (0.0%) | 9 (100.0%) |
| 65 to 74 Years | 44 (100.0%) | 25 (56.8%) |
| 75 Years and over | 0 (0.0%) | 0 (0.0%) |
| Total | 51 (59.3%) | 40 (46.5%) |
Disability Status by Sex by Age in Hiwassee
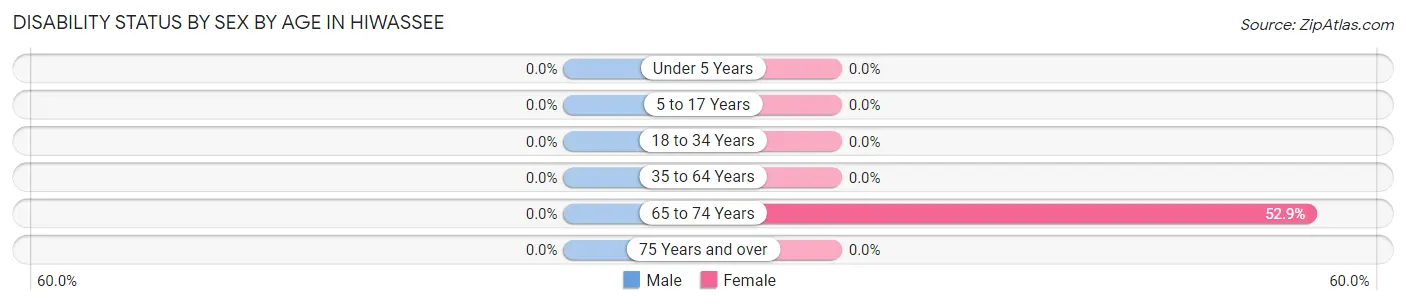
| Age Bracket | Male | Female |
| Under 5 Years | 0 (0.0%) | 0 (0.0%) |
| 5 to 17 Years | 0 (0.0%) | 0 (0.0%) |
| 18 to 34 Years | 0 (0.0%) | 0 (0.0%) |
| 35 to 64 Years | 0 (0.0%) | 0 (0.0%) |
| 65 to 74 Years | 0 (0.0%) | 9 (52.9%) |
| 75 Years and over | 0 (0.0%) | 0 (0.0%) |
Disability Class by Sex by Age in Hiwassee
Disability Class: Hearing Difficulty
| Age Bracket | Male | Female |
| Under 5 Years | 0 (0.0%) | 0 (0.0%) |
| 5 to 17 Years | 0 (0.0%) | 0 (0.0%) |
| 18 to 34 Years | 0 (0.0%) | 0 (0.0%) |
| 35 to 64 Years | 0 (0.0%) | 0 (0.0%) |
| 65 to 74 Years | 0 (0.0%) | 0 (0.0%) |
| 75 Years and over | 0 (0.0%) | 0 (0.0%) |
Disability Class: Vision Difficulty
| Age Bracket | Male | Female |
| Under 5 Years | 0 (0.0%) | 0 (0.0%) |
| 5 to 17 Years | 0 (0.0%) | 0 (0.0%) |
| 18 to 34 Years | 0 (0.0%) | 0 (0.0%) |
| 35 to 64 Years | 0 (0.0%) | 0 (0.0%) |
| 65 to 74 Years | 0 (0.0%) | 0 (0.0%) |
| 75 Years and over | 0 (0.0%) | 0 (0.0%) |
Disability Class: Cognitive Difficulty

| Age Bracket | Male | Female |
| 5 to 17 Years | 0 (0.0%) | 0 (0.0%) |
| 18 to 34 Years | 0 (0.0%) | 0 (0.0%) |
| 35 to 64 Years | 0 (0.0%) | 0 (0.0%) |
| 65 to 74 Years | 0 (0.0%) | 0 (0.0%) |
| 75 Years and over | 0 (0.0%) | 0 (0.0%) |
Disability Class: Ambulatory Difficulty
| Age Bracket | Male | Female |
| 5 to 17 Years | 0 (0.0%) | 0 (0.0%) |
| 18 to 34 Years | 0 (0.0%) | 0 (0.0%) |
| 35 to 64 Years | 0 (0.0%) | 0 (0.0%) |
| 65 to 74 Years | 0 (0.0%) | 9 (52.9%) |
| 75 Years and over | 0 (0.0%) | 0 (0.0%) |
Disability Class: Self-Care Difficulty
| Age Bracket | Male | Female |
| 5 to 17 Years | 0 (0.0%) | 0 (0.0%) |
| 18 to 34 Years | 0 (0.0%) | 0 (0.0%) |
| 35 to 64 Years | 0 (0.0%) | 0 (0.0%) |
| 65 to 74 Years | 0 (0.0%) | 0 (0.0%) |
| 75 Years and over | 0 (0.0%) | 0 (0.0%) |
Technology Access in Hiwassee
Computing Device Access in Hiwassee
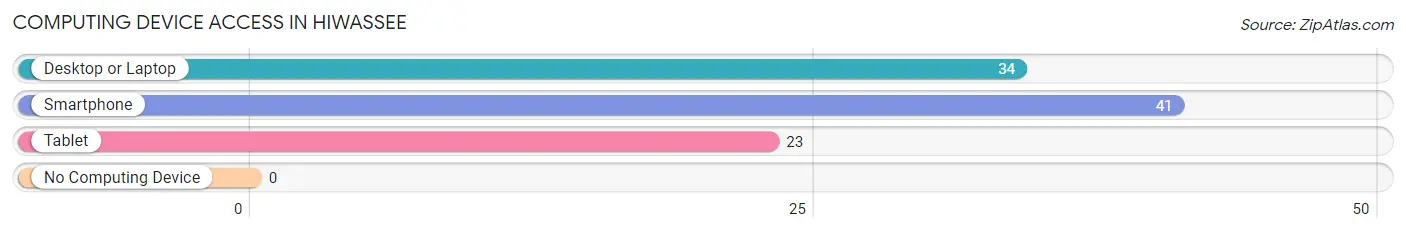
| Device Type | # Households | % Households |
| Desktop or Laptop | 34 | 68.0% |
| Smartphone | 41 | 82.0% |
| Tablet | 23 | 46.0% |
| No Computing Device | 0 | 0.0% |
| Total | 50 | 100.0% |
Internet Access in Hiwassee
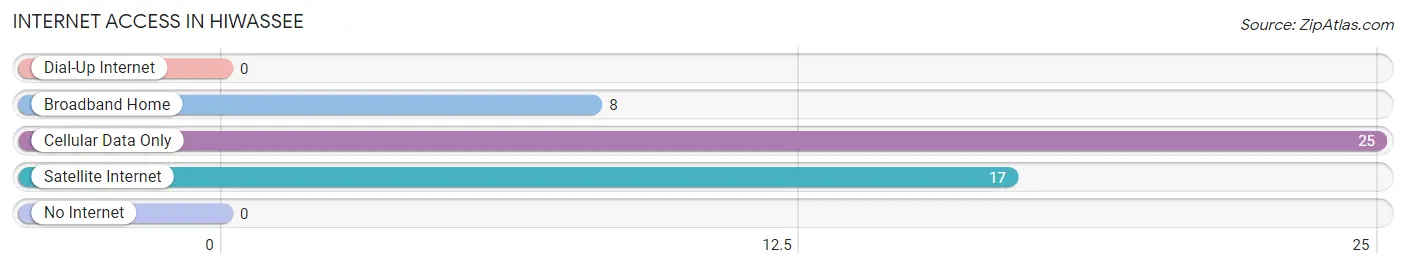
| Internet Type | # Households | % Households |
| Dial-Up Internet | 0 | 0.0% |
| Broadband Home | 8 | 16.0% |
| Cellular Data Only | 25 | 50.0% |
| Satellite Internet | 17 | 34.0% |
| No Internet | 0 | 0.0% |
| Total | 50 | 100.0% |
Hiwassee Summary
History
The area now known as Hiwassee, Virginia was first inhabited by Native Americans, including the Cherokee, who lived in the area for centuries before the arrival of European settlers. The first Europeans to settle in the area were the English, who arrived in the late 17th century. The area was part of the Colony of Virginia, and was part of the county of Fincastle, which was created in 1772.
In the early 19th century, the area was part of the newly-formed Wythe County. In 1831, the town of Hiwassee was established, and it quickly became a thriving community. The town was named after the nearby Hiwassee River, which was named after the Cherokee word for “meeting place”.
The town of Hiwassee was an important stop on the Great Road, which connected the Shenandoah Valley to the rest of the state. The town was also an important stop on the Virginia and Tennessee Railroad, which connected the town to the rest of the state.
The town of Hiwassee was an important center of commerce and industry in the 19th century. The town was home to several mills, including a grist mill, a saw mill, and a woolen mill. The town also had several stores, a hotel, and a post office.
The town of Hiwassee was also an important center of education in the 19th century. The town had several schools, including a private school, a public school, and a college. The college, which was founded in 1845, was known as Hiwassee College. The college was the first college in the state to offer a degree in education.
Geography
Hiwassee, Virginia is located in the southwestern part of the state, in Wythe County. The town is situated on the banks of the Hiwassee River, which is a tributary of the New River. The town is located at the intersection of US Route 11 and State Route 615.
The town of Hiwassee is located in the Appalachian Mountains, and the surrounding area is characterized by rolling hills and valleys. The town is located in a temperate climate, with hot summers and cold winters. The average annual temperature is around 55 degrees Fahrenheit.
The town of Hiwassee is located in a rural area, and the surrounding area is mostly farmland. The town is surrounded by several small towns and villages, including Wytheville, Max Meadows, and Rural Retreat.
Economy
The economy of Hiwassee, Virginia is largely based on agriculture and tourism. The town is home to several farms, which produce a variety of crops, including corn, soybeans, wheat, and hay. The town is also home to several wineries, which produce a variety of wines.
The town of Hiwassee is also a popular tourist destination. The town is home to several historic sites, including the Hiwassee College Historic District, the Hiwassee Dam, and the Hiwassee River. The town is also home to several outdoor recreation areas, including the Hiwassee Wildlife Management Area and the Hiwassee State Park.
Demographics
As of the 2010 census, the town of Hiwassee had a population of 1,845. The population is largely white (94.3%), with a small percentage of African Americans (3.2%) and Hispanics (1.2%). The median household income is $37,500, and the median home value is $117,000. The town has a poverty rate of 17.3%.
Common Questions
What is Per Capita Income in Hiwassee?
Per Capita income in Hiwassee is $53,155.
What is the Median Family Income in Hiwassee?
Median Family Income in Hiwassee is $66,625.
What is the Median Household income in Hiwassee?
Median Household Income in Hiwassee is $67,778.
What is Inequality or Gini Index in Hiwassee?
Inequality or Gini Index in Hiwassee is 0.35.
What is the Total Population of Hiwassee?
Total Population of Hiwassee is 86.
What is the Total Male Population of Hiwassee?
Total Male Population of Hiwassee is 54.
What is the Total Female Population of Hiwassee?
Total Female Population of Hiwassee is 32.
What is the Ratio of Males per 100 Females in Hiwassee?
There are 168.75 Males per 100 Females in Hiwassee.
What is the Ratio of Females per 100 Males in Hiwassee?
There are 59.26 Females per 100 Males in Hiwassee.
What is the Median Population Age in Hiwassee?
Median Population Age in Hiwassee is 67.1 Years.
What is the Average Family Size in Hiwassee
Average Family Size in Hiwassee is 2.4 People.
What is the Average Household Size in Hiwassee
Average Household Size in Hiwassee is 1.7 People.
How Large is the Labor Force in Hiwassee?
There are 62 People in the Labor Forcein in Hiwassee.
What is the Percentage of People in the Labor Force in Hiwassee?
78.5% of People are in the Labor Force in Hiwassee.
What is the Unemployment Rate in Hiwassee?
Unemployment Rate in Hiwassee is 27.4%.